Embed Size (px)
Citation preview

8.1 Physics of the Atmosphere
EASA PART 66 MODULES Airline Maintenance & Engineering Training Ltd. Page 1 of 62

Arrangement of the Atmosphere
Introduction
The earth is encased in a thin layer of gases which insulate us from the devastat-ing effect of the sun's energy and which supports life. This layer of gases, calledour atmosphere, surrounds the earth to a depth of about 800km (500miles). It con-sists of a mixture of gases, principally nitrogen - about 78%, and oxygen - about21%. The remainder 1% is made up of traces of argon, neon, krypton and carbondioxide. The gases of our atmosphere are compressible and in the lower levels arepressed down upon by all of the air above. So, pressure and density are increased.
Figure 1: Atmosphere Layers
Troposphere
The lower level of our atmosphere is called the troposphere, and it extends fromthe surface upward to the tropopause. Its depth varies from about 7’500m(~28’000 feet) at the poles to 20’000m (~54’000ft) at the equator. The tropospherecontains water vapour that causes clouds and vertical air currents and accountsfor much of what we call weather.
Tropopause
This is the boundary between the troposphere and the stratosphere, and it is herethat the temperature drop with altitude stops, and there is a constant temperatureof -56.5°C.
Stratosphere
Above the troposphere the air is extremely thin. Since there is no water vapour inthe stratosphere, there is no weather.
Figure 2: The Atmosphere
Equator
N
STroposphere
Stratosphere
Mesosphere
30 - 35 km
7.5 - 9 km
16.5 - 20 km
42 - 46 km
100
1000Sea Level
the Stratosphere
the Tropopause
the TroposphereMountEverest
EarthDeath Valley
Cloud
and
Rain
EASA PART 66 MODULES Airline Maintenance & Engineering Training Ltd. Page 2 of 62

Atmospheric Conditions
Pressure
The weight of air above any surface produces a pressure at that surface i.e. a forceof so may Newton's per square meter of surface. The average pressure at sea lev-el due to the weight of the atmosphere is about 1013.25 millibars or 29.92 inchesmercury. The apparatus for measuring atmospheric pressure is shown in the pic-ture (see “Figure 3” on page 3). A glass tube open at one end, and closed at theother is filled with mercury. The open end is sealed temporarily and then sub-merged into a small container partly filled with mercury, after which the end is un-sealed. This allows the mercury in the tube to descend, leaving a vacuum at thetop of the tube. Some of the mercury flows into the container while a portion of itremains in the tube. The weight of the atmosphere pressing on the mercury in theopen container exactly balances the weight of the mercury in the tube, which hasno atmospheric pressure pushing down on it due to the vacuum in the top of thetube.
As the pressure of the surrounding air decreases or increases, the mercury col-umn lowers or rises correspondingly. At sea level the height of the mercury in thetube measures standard day condition at 760 mm (29.92 in).
Figure 3: Mercury Barometer
Density of Air
The density of air - i.e. the mass per unit volume, is low compared with water (themass of a cubic metre of air at ground level is roughly 1.225 kg whereas the massof cubic metre of water is a metric tonne, 1000 kg, nearly 800 times as much). It isthis very property of air, its density, which makes all flight possible, or perhaps weshould say airborne flight possible, because this does not apply to rockets.
The balloon, the airship, the kite, the parachute, and the aircraft, all of them aresupported in the air by forces which are entirely dependent on its density; the lessthe density the more difficult flight becomes and for all of them flight becomes im-possible in a vacuum.
The density of gases is governed by the following rules:
1. Density varies in direct proportion with the pressure (density increases aspressure increases)
2. Density varies inversely with the temperature (density decreases as temper-ature increases)
Air at high altitudes with low pressure is less dense than air at low altitudes withhigher pressure. A mass of hot air is less dense than a mass of cool air.
Table 1: Different Pressure Unit
Value Unit Explanation
1 bar bar
1.033 kg/cm² kilogram per sq. centimetre
760 mm Hg mm of mercury
29.92 in Hg inch of mercury
14.7 psi pound per sq. inch
1013.2 mb or hPa millibar or hecto Pascal
AtmosphericPressure
Vacuum
760mm(29.92in)at Sea Level
EASA PART 66 MODULES Airline Maintenance & Engineering Training Ltd. Page 3 of 62
Air Temperature
Going upward through the lower layers of the atmosphere there is the gradual dropin temperature. The reason for the falling off of temperature is that the radiant heatdirect from the sun passes through the atmosphere without appreciably raising thetemperature. The earth, however, absorbs the heat, the temperature of the earthis raised and the air in contact with it absorbs some of this heat. In still air, the tem-perature falls off with height at a rate of about 6.5°C for every 1’000m or 2°C forevery 1’000ft. This rate of fall does not alter until about 11’000m (36’000ft) - theactual height varying at different parts of the earth, being greater at the Equator(54’000ft) and least at the poles (28’000ft).
Air Temperature lapse rate = 6.5°C for every 1’000m (2°C per 1’000ft)
When the Tropopause is reached, quite suddenly the temperature ceases to falland remains practically constant to the lower limits of the stratosphere(see“Figure 2” on page 2).
Viscosity
An important property of air in so far as it affects flight is its viscosity. This meansthe tendency of one layer of air to move with the layer next to it; it is rather similarto the property of friction between solids.
Humidity
Humidity is a condition of moisture or dampness. The maximum amount of watervapour that the air can hold depends entirely on the temperature; the higher thetemperature of the air, the more water vapour it can absorb.
By itself, water vapour weighs approximately five-eight's as much as an equal vol-ume of perfectly dry air.
Therefore, when air contains 5 parts of water vapour and 95 parts of perfectly dryair, it is not as heavy as air containing no moisture. This is because water is com-posed of hydrogen (an extremely light gas) and oxygen. Air is composed principal-ly of nitrogen, which is almost as heavy as oxygen.
Assuming that the temperature and pressure remain the same, the density of airvaries with the humidity. On damp days the density is less than it is on dry days.
The amount of water vapour in the air may be measured by the use of an instru-ment called a hygrometer. Air is blown over a wet-bulb and a dry bulb thermome-ter. The difference in temperature between the two thermometers is comparedwith values on a chart to find the percent of relative humidity (see “Table 2: Section
of Percentage Humidity Chart” on page 5) . This measurement is the ratio of theamount of water the air will hold at this particular temperature.
For practical work in aviation, temperature and dew point are used more often thanrelative humidity to measure the amount of water vapour in the air. Dew point isthe temperature to which a body of air must be lowered before the water vapourcondenses out and becomes liquid water.
EASA PART 66 MODULES Airline Maintenance & Engineering Training Ltd. Page 4 of 62
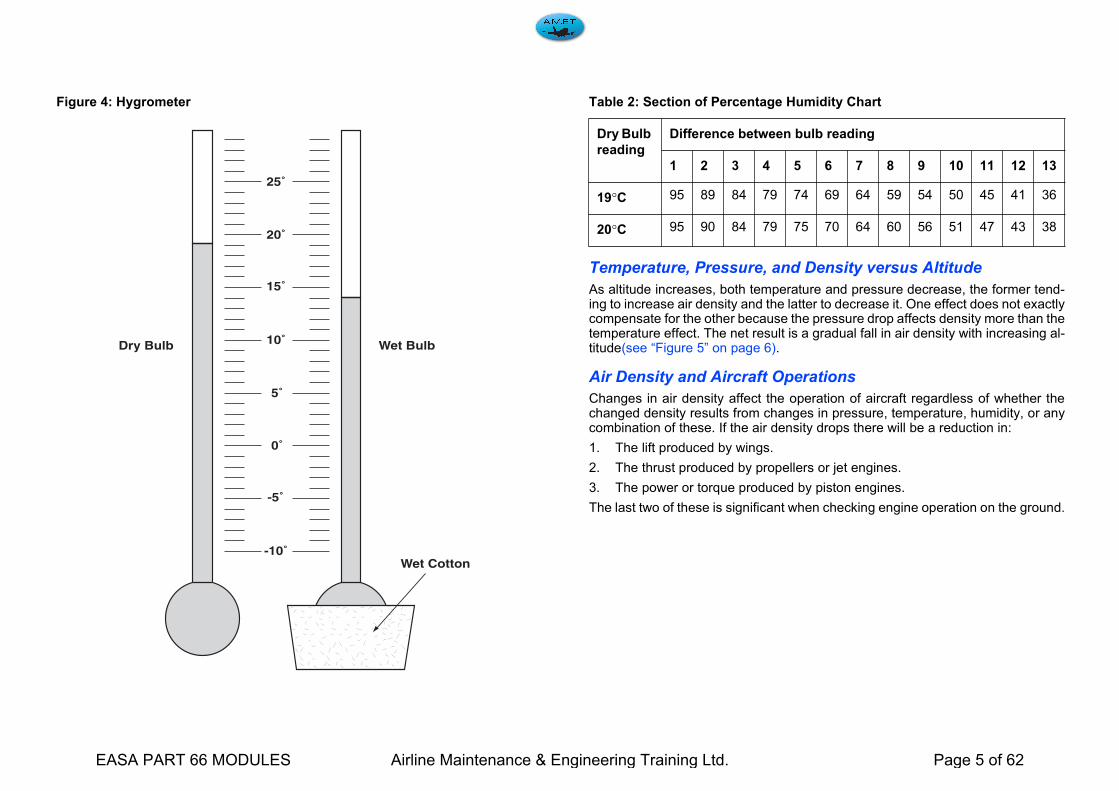
Figure 4: Hygrometer
Temperature, Pressure, and Density versus Altitude
As altitude increases, both temperature and pressure decrease, the former tend-ing to increase air density and the latter to decrease it. One effect does not exactlycompensate for the other because the pressure drop affects density more than thetemperature effect. The net result is a gradual fall in air density with increasing al-titude(see “Figure 5” on page 6).
Air Density and Aircraft Operations
Changes in air density affect the operation of aircraft regardless of whether thechanged density results from changes in pressure, temperature, humidity, or anycombination of these. If the air density drops there will be a reduction in:
1. The lift produced by wings.
2. The thrust produced by propellers or jet engines.
3. The power or torque produced by piston engines.
The last two of these is significant when checking engine operation on the ground.
Wet Cotton
Wet BulbDry Bulb
25˚
20˚
15˚
10˚
-10˚
5˚
-5˚
0˚
Table 2: Section of Percentage Humidity Chart
Dry Bulb
reading
Difference between bulb reading
1 2 3 4 5 6 7 8 9 10 11 12 13
19°C 95 89 84 79 74 69 64 59 54 50 45 41 36
20°C 95 90 84 79 75 70 64 60 56 51 47 43 38
EASA PART 66 MODULES Airline Maintenance & Engineering Training Ltd. Page 5 of 62
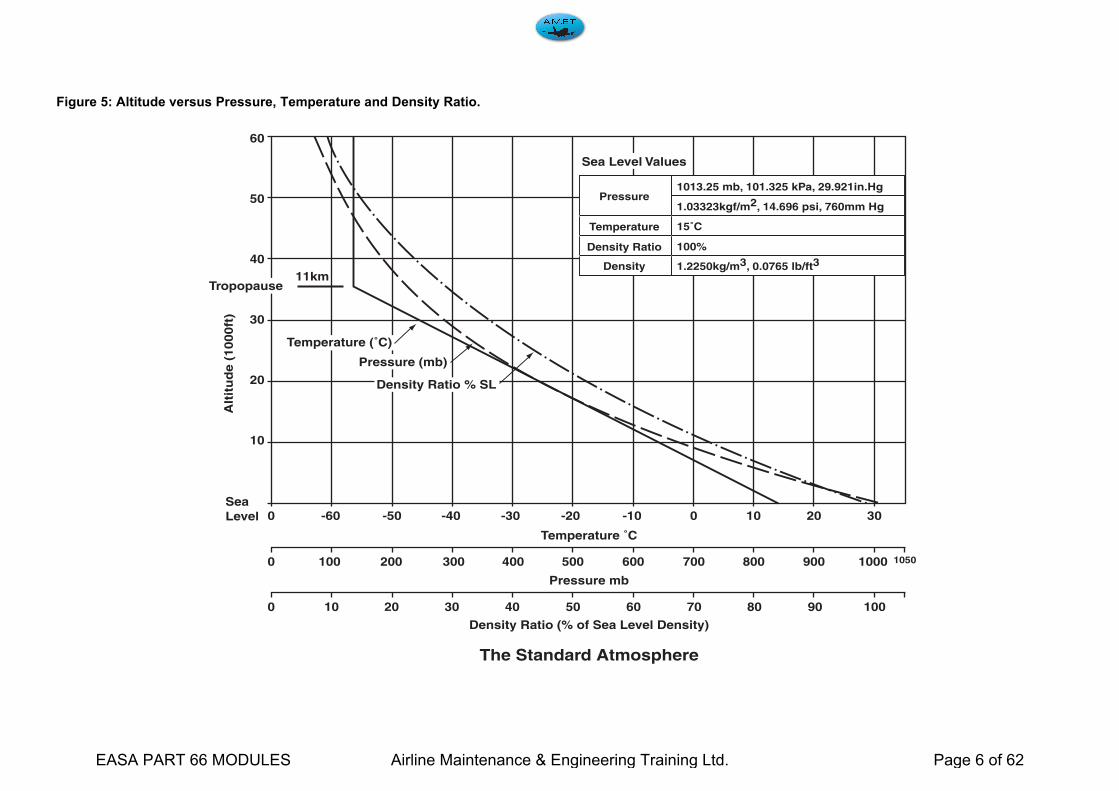
Figure 5: Altitude versus Pressure, Temperature and Density Ratio.
Pressure1013.25 mb, 101.325 kPa, 29.921in.Hg
1.03323kgf/m2, 14.696 psi, 760mm Hg
15˚C
100%
1.2250kg/m3, 0.0765 lb/ft3
Temperature
Density Ratio
Density
Sea Level Values
60
50
40
30
20
10
SeaLevel
Alt
itu
de (
1000ft
)
Tropopause11km
Temperature (˚C)
Pressure (mb)
Density Ratio % SL
-60 -50 -40 -30 -20 -10 0 10 20 300
0 10501000900800700600500400300200100
0 100908070605040302010
Temperature ˚C
Pressure mb
Density Ratio (% of Sea Level Density)
The Standard Atmosphere
EASA PART 66 MODULES Airline Maintenance & Engineering Training Ltd. Page 6 of 62

The Standard Atmosphere
Since the temperature, pressure, and density of the atmosphere change fromplace to place and from day to day it is necessary to have a standard set of condi-tions with observed readings can be compared facilitates the correction of aircraftand engine performance calculations for any non-standard conditions. The set ofstandard conditions is usually known as the International Standard Atmosphere(ISA). In the aircraft industry this is also known as the ICAO Standard Atmosphere.ICAO stands for International Civil Aviation Organization.
The table shown is an abridged Standard Atmosphere table (seeTable 4 onpage 8). Dry air is assumed.
The tables of Standard Atmosphere published by ICAO cover a wider range of al-titudes, more accurately than the tables shown.
If the performance of an aircraft is computed, either through flight tests or wind tun-nel tests, some standard reference condition must be determined first in order tocompare results with those of similar tests.
The standard atmosphere approximates the average conditions existing at 40° lat-itude north, and is determined on the basis of the following assumptions.
Variations from Standard Days
As may be expected, the temperature, pressure, density, and water vapour con-tent of the air varies considerably in the troposphere. The temperature at 40 lati-tude may range from 50°C at low altitudes during the summer to -70°C at highaltitudes during the winter. As previous stated, temperature usually decreases withan increase in altitude. Exceptions to this rule occur when cooler air is trappednear the earth surface by a warmer layer. This is called temperature inversion,commonly associated with frontal movement of air masses.
Pressure likewise varies at any given point in the atmosphere. On a standard day,at sea level, pressure will be 29.92 in Hg. On non-standard days, pressure at sealevel will vary considerably above or below this figure.
Density of the air is determined by the pressure and temperature acting upon it.Since the standard atmosphere can never be assumed to be “standard”, a conven-ient method of calculating density has been devised. Since air pressure is meas-ured in inconvenient terms, it is expedient to utilize the aneroid altimeter as apressure gauge and refer to the term “pressure altitude” instead of atmosphericpressure.
Pressure Altitude
Pressure altitude is the altitude in the standard atmosphere corresponding to aparticular value of air pressure. The aircraft altimeter is essentially a sensitive ba-rometer calibrated to indicate altitude in the standard atmosphere.
With the altimeter of an aircraft set at 1’013hPa (29.92 in Hg), the dial will indicatethe number of metres above or below a level where1’013hPa exist, not necessarilyabove or below sea level, unless standard day conditions exist. In general, the al-
Table 3: ISA at sea level
Pressure (P0) 1’013hPa = 760mm = 29.92 in Hg
Temperature (T0) 15°C = 59° F
Gravity (g0) 9.81m/s2= 32.174 ft/sec2.
EASA PART 66 MODULES Airline Maintenance & Engineering Training Ltd. Page 7 of 62

timeter will indicate the altitude at which the existing pressure would be consideredstandard pressure. The symbol Hp is used to indicate pressure altitude.
Table 4: The International Standard Atmosphere (I.S.A)
Altitude (h) Ambient Temperature (T0) Ambient Pressure (P0) Velocity of Sound (vs)
Feet Metres Deg. K Deg. C lbs./sq.in millibars ft./sec. Knots km/h
-1’0000+1’0002’0003’0004’0005,0006’0007’0008’0009’00010’00011’00012’00013’00014’00015’00016’00017’00018’00019’00020’00021’00022’00023’00024’00025’00026’000
-304.80+304.8609.6914.41219.21524.01828.82133.62438.42741.23048.03352,83657.63962.44267.24572.04876.85181.65486.45791.26096.06400.86705.67010.47315.27620.07924.8
289.98288.00286.02284.04282.05280.07278.09276.11274.13272.15270.17268.18266.20264.22262.24260.26258.28256.30254.32252.33250.35248.37246.39244.41242.43240.45238.47236.49
16.9815.0013.021.049.057.075.093.111.13-0.85-2.83-4.81-6.79-8.77-10.75-12.74-14.72-16.70-16.68-20.66-22.64-24.62-26.60-28.68-30.56-32.55-34.53-36.51
15.2314.6914.1713.6613.1712.6912.2211.7711.3310.9110.5010.109.719.348.908.638.297.967.647.337.036.756.476.205.945.695.455.21
1050.41013.2977.1942.1900.0875.0843.0811.9781.7752.5724.1696.6670.0644.2619.2595.0571.6548.9527.0505.8485.2465.4446.2427.7409.7392.5375.8359.7
1119.91116.11112.31108.41104.51100.71096.71092.81088.91085.01081.01077.01073.11069.11065.01061.01057.01052.91048.01044.71040.61036.51032.41028.21024.01019.81015.61011.4
663.12660.85658.57656.29654.00651.70649.38647.07644.75642.40640.07637.71635.35632.99630.61628.22625.82623.42621.01618.58616.15613.71611.25608.79606.32603.04601.35598.84
1228.81224.61320.41216.21211.91207.71203.41199.11194.81190.41186.11181.81177.41173.01168.61164.21159.71155.31150.81146.31141.81137.31132.71128.21123.61119.01114.41109.7
EASA PART 66 MODULES Airline Maintenance & Engineering Training Ltd. Page 8 of 62
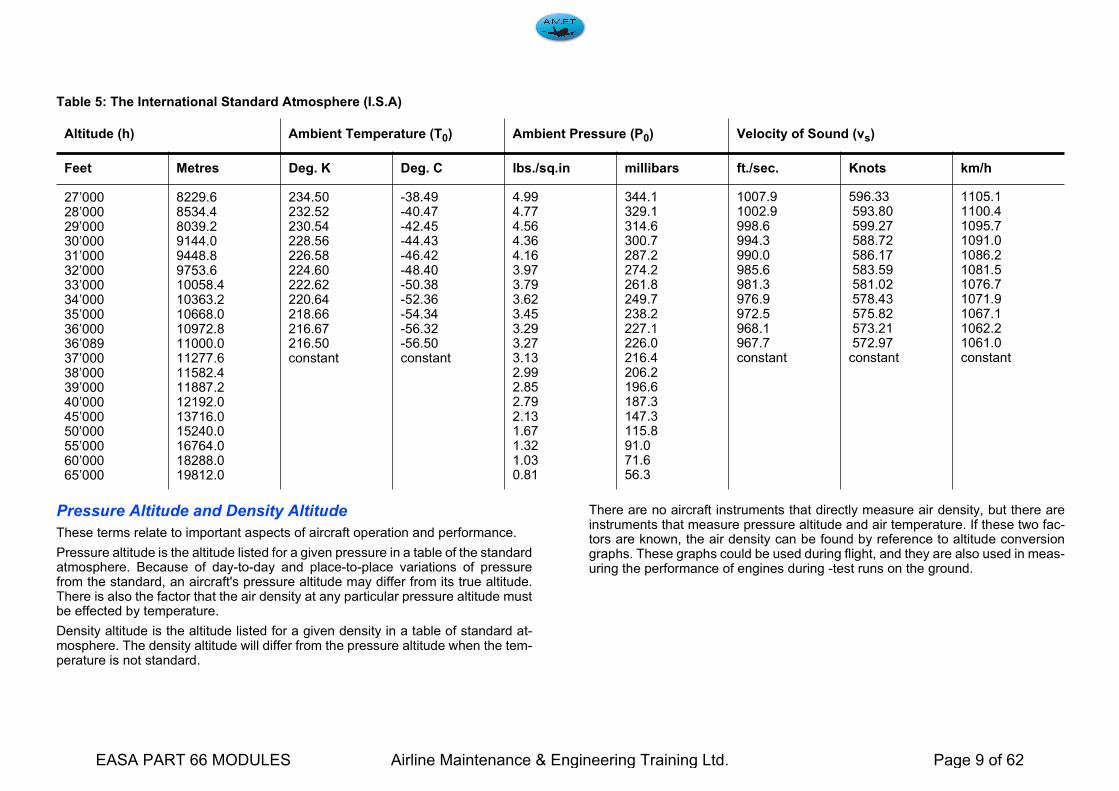
Pressure Altitude and Density Altitude
These terms relate to important aspects of aircraft operation and performance.
Pressure altitude is the altitude listed for a given pressure in a table of the standardatmosphere. Because of day-to-day and place-to-place variations of pressurefrom the standard, an aircraft's pressure altitude may differ from its true altitude.There is also the factor that the air density at any particular pressure altitude mustbe effected by temperature.
Density altitude is the altitude listed for a given density in a table of standard at-mosphere. The density altitude will differ from the pressure altitude when the tem-perature is not standard.
There are no aircraft instruments that directly measure air density, but there areinstruments that measure pressure altitude and air temperature. If these two fac-tors are known, the air density can be found by reference to altitude conversiongraphs. These graphs could be used during flight, and they are also used in meas-uring the performance of engines during -test runs on the ground.
Table 5: The International Standard Atmosphere (I.S.A)
Altitude (h) Ambient Temperature (T0) Ambient Pressure (P0) Velocity of Sound (vs)
Feet Metres Deg. K Deg. C lbs./sq.in millibars ft./sec. Knots km/h
27’00028’00029’00030’00031’00032’00033’00034’00035’00036’00036’08937’00038’00039’00040’00045’00050’00055’00060’00065’000
8229.68534.48039.29144.09448.89753.610058.410363.210668.010972.811000.011277.611582.411887.212192.013716.015240.016764.018288.019812.0
234.50232.52230.54228.56226.58224.60222.62220.64218.66216.67216.50constant
-38.49-40.47-42.45-44.43-46.42-48.40-50.38-52.36-54.34-56.32-56.50constant
4.994.774.564.364.163.973.793.623.453.293.273.132.992.852.792.131.671.321.030.81
344.1329.1314.6300.7287.2274.2261.8249.7238.2227.1226.0216.4206.2196.6187.3147.3115.891.071.656.3
1007.91002.9998.6994.3990.0985.6981.3976.9972.5968.1967.7constant
596.33 593.80 599.27 588.72 586.17 583.59 581.02 578.43 575.82 573.21 572.97constant
1105.11100.41095.71091.01086.21081.51076.71071.91067.11062.21061.0constant
EASA PART 66 MODULES Airline Maintenance & Engineering Training Ltd. Page 9 of 62

To demonstrate the use of the graph, consider the three following pressure andtemperature conditions that could exist on different days at an airport with a truealtitude of 5000 feet.:
Day 1 is a standard day. The density altitude, pressure altitude, and true altitudeare all 5000 feet because the pressure and temperature conform to the standardatmosphere. Below is the method you would use to check from the graph (see“Figure 6” on page 11) that at a temperature of 5°C and a pressure altitude of5’000ft is a density altitude of 5’000ft: from the 5 point on the temperature scale,draw a vertical line to intersect the 5’000ft pressure altitude slant-line; from thispoint draw a horizontal line to the density altitude scale; this will be 5’000ft.
Day 2 is non standard (like most days). Go through the same steps as before onthe graph and you will find that a temperature of 25°C and a pressure altitude of4’500ft. means a density altitude of 6’700ft.
Table 6: Example
Pressure Altitude Air Temperature
Day 1 5’000ft 5°C
Day 2 4’500ft 25°C
EASA PART 66 MODULES Airline Maintenance & Engineering Training Ltd. Page 10 of 62

Figure 6: Density Altitude Chart
Pressure A
ltitude
15000
25000
30000
35000
20000
5000
5000
Sea Level
10000
-70-60
-50-40
-30-20
-100
1020
3040
5060
Temp
erature C
˚
-4 -2 0 2 4 6 8 10 12 14 16 18 20 22 24 26 28 30 32 This line is the standardtemperature / altitude (ISA)
Density Altitude x 1000ft
Day 1
Day 2
EASA PART 66 MODULES Airline Maintenance & Engineering Training Ltd. Page 11 of 62

EASA PART 66 MODULES Airline Maintenance & Engineering Training Ltd. Page 12 of 62

8.2 Aerodynamics
EASA PART 66 MODULES Airline Maintenance & Engineering Training Ltd. Page 13 of 62
Airflow Around a Body
An aeroplane must produce lift to be able to fly. Before this is discussed, there aresome terms and principles belonging to airflow that are to be explained
Free Stream Flow
Air flow is the movement of air particles in a certain direction. Normally, airflowsare not visible. In a storm you can’t see the movement of the air particles. You justsee the results!
Trees that are blown down, rough seas, broken umbrellas, etc. The air flow causedby an aircraft or a helicopter is not visible either.
To be able to observe air flows around objects, the flows have to be made visible
first. There are two ways of doing this:
• by using smoke or vaporized talcum powder
• by using pieces of thread connected to the surface of the object that indicatethe flow direction at that particular point.
Laminar Flow and Turbulent Flow
The flow pattern of laminar flows consists of layers. Each air particle follows a cer-tain course and is not influenced by a particle from another layer. There is no dif-ference in velocity between the layers.
Figure 1: Laminar Flow
Turbulent flows are flows in which the velocity and direction change continuously.Some air particles move opposite to others in the air flow. They don’t follow theirown course but hinder other air particles. The useless labour connected to thismust be compensated by the thrust of the engines.
Figure 2: Turbulent Flow
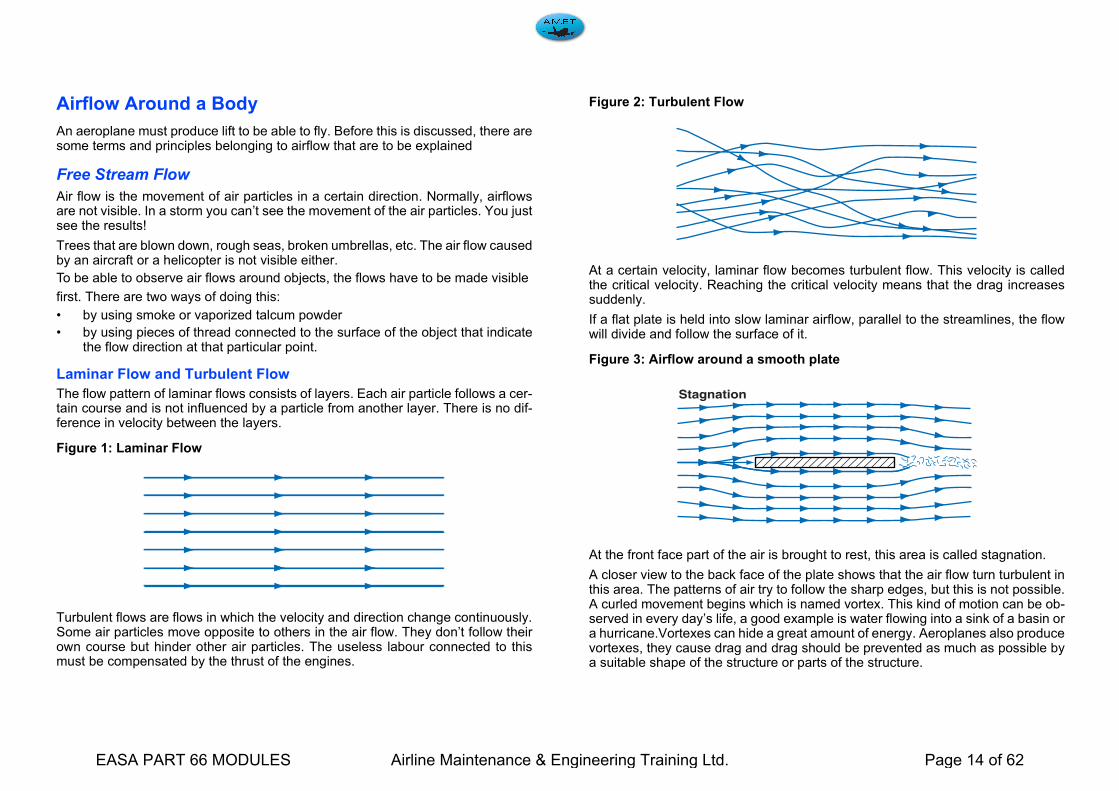
At a certain velocity, laminar flow becomes turbulent flow. This velocity is calledthe critical velocity. Reaching the critical velocity means that the drag increasessuddenly.
If a flat plate is held into slow laminar airflow, parallel to the streamlines, the flowwill divide and follow the surface of it.
Figure 3: Airflow around a smooth plate
At the front face part of the air is brought to rest, this area is called stagnation.
A closer view to the back face of the plate shows that the air flow turn turbulent inthis area. The patterns of air try to follow the sharp edges, but this is not possible.A curled movement begins which is named vortex. This kind of motion can be ob-served in every day’s life, a good example is water flowing into a sink of a basin ora hurricane.Vortexes can hide a great amount of energy. Aeroplanes also producevortexes, they cause drag and drag should be prevented as much as possible bya suitable shape of the structure or parts of the structure.
Stagnation
EASA PART 66 MODULES Airline Maintenance & Engineering Training Ltd. Page 14 of 62
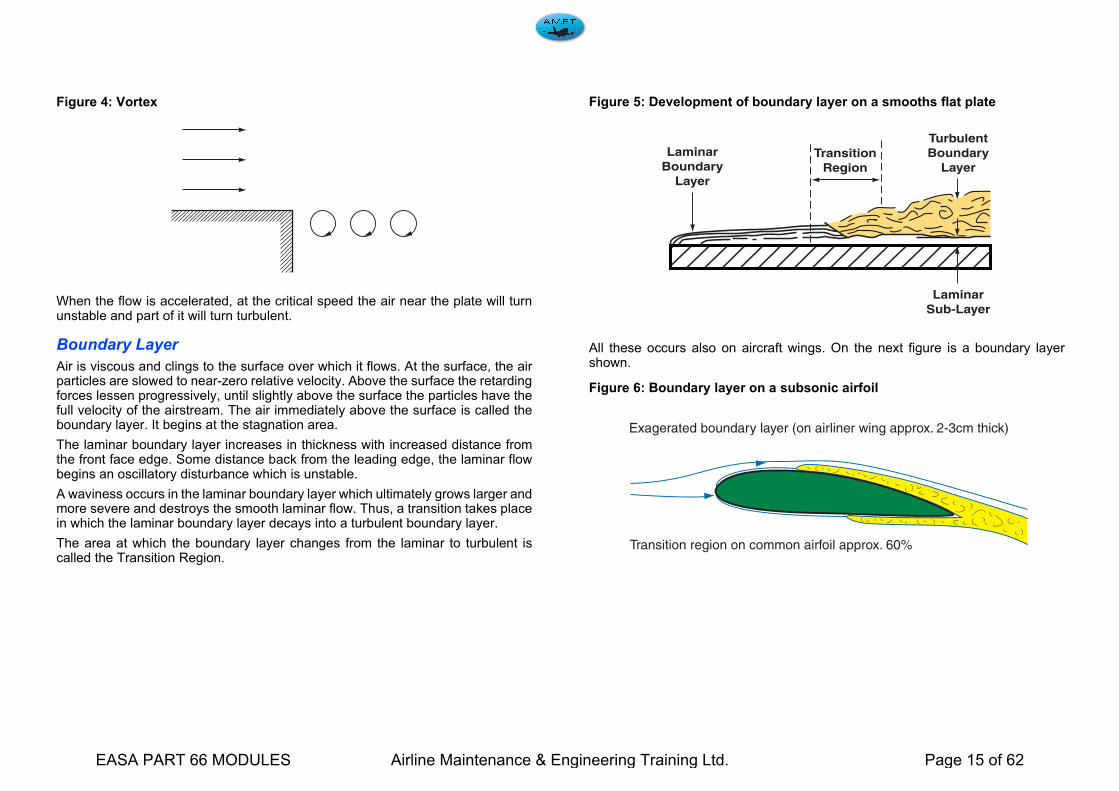
Figure 4: Vortex
When the flow is accelerated, at the critical speed the air near the plate will turnunstable and part of it will turn turbulent.
Boundary Layer
Air is viscous and clings to the surface over which it flows. At the surface, the airparticles are slowed to near-zero relative velocity. Above the surface the retardingforces lessen progressively, until slightly above the surface the particles have thefull velocity of the airstream. The air immediately above the surface is called theboundary layer. It begins at the stagnation area.
The laminar boundary layer increases in thickness with increased distance fromthe front face edge. Some distance back from the leading edge, the laminar flowbegins an oscillatory disturbance which is unstable.
A waviness occurs in the laminar boundary layer which ultimately grows larger andmore severe and destroys the smooth laminar flow. Thus, a transition takes placein which the laminar boundary layer decays into a turbulent boundary layer.
The area at which the boundary layer changes from the laminar to turbulent iscalled the Transition Region.
Figure 5: Development of boundary layer on a smooths flat plate
All these occurs also on aircraft wings. On the next figure is a boundary layershown.
Figure 6: Boundary layer on a subsonic airfoil
LaminarBoundary
Layer
TransitionRegion
TurbulentBoundary
Layer
LaminarSub-Layer
Exagerated boundary layer (on airliner wing approx. 2-3cm thick)
Transition region on common airfoil approx. 60%
EASA PART 66 MODULES Airline Maintenance & Engineering Training Ltd. Page 15 of 62

Relative Air flow
Because aeroplanes move themselves in the atmosphere and the air also moves(wind), it is necessary to describe the meaning of relative airflow.
Relative airflow is the direction of the airflow with respect to an object.
If an object moves forward horizontally the relative airflow moves backward andhorizontally. If an object moves forward and upward, the relative airflow movesbackward and downward.
Applying this to the movement of an aircraft, the flight path and relative airflow areparallel but travel in opposite directions. Relative airflow may be affected by sev-eral factors including wind speed, direction and aircraft altitude.
Technically speaking, the relative airflow is the velocity of the air with respect to abody in it.
When the wind blows, the path of the aircraft referred to the ground usually is notthe same as the path referred to the moving air. The aerodynamic forces on theaircraft are always considered as a function of the relative airflow and not of theground wind.
Figure 7: Relative Airflow
RelativeAirflow
Relative Airflow
Ground
Aircraft in a Climb
Aircraft in Level Flight
EASA PART 66 MODULES Airline Maintenance & Engineering Training Ltd. Page 16 of 62

Bernoulli's Principle
The Swiss mathematician and physicist Daniel Bernoulli explains the relationshipbetween potential and kinetic energy in a fluid. This principle is extremely impor-tant in helping us understand the way an aeroplane wing or a helicopter rotor pro-duces lift as it passes through the air.
Bernoulli’s principle explains that if we neither add nor take away energy from aflow of fluid, any increase in the velocity (kinetic energy) of the flow will cause acorresponding decrease in its pressure (potential energy).
A venturi is a specially shaped tube through which a fluid, either a liquid or a gas,flows. There is a restriction in the tube where the area gets smaller, and then it re-turns to its original size.Fluid flows through this tube, and, at position 1, the pres-sure is the value P1. The speed, or velocity, is shown as v1. If we do not add ortake away any energy from the fluid, it must speed up when it reaches the restric-tion to allow the same volume of fluid to move the same distance through the tubein the same length of time.
When it speeds up, the kinetic energy (velocity) increases. But since no energywas added, the potential energy (pressure) had to decrease. We see this on thegages P2 and v2. As soon as the tube returns to its original size, at 3, the fluidslows down so the same volume will move the same distance in the same time.When it slows down, the velocity decreases, but the pressure increases to the val-ue it had originally.
Figure 8: Venturi Tube
P1
V1 V2 V3
P2 P3
1 2 3
EASA PART 66 MODULES Airline Maintenance & Engineering Training Ltd. Page 17 of 62

Free Stream Flow
For a flow of air to remain streamlined, the volume passing a given point in a unitof time (the mass flow) must remain constant.
Figure 9 on page 6 (A) shows a diagrammatic flow of streamlines through a venturitube. If the walls of the venturi tube are drawn further apart, as shown in (B).
(B) the streamlines immediately adjacent to the wall will follow closely the contourof the wall. Further away from the wall the streamlines become less and lesscurved or deformed. In the central part of the flow the streamlines are straight.Moving the walls still further apart, until there is no interaction between the two,results in the flow pattern shown in C.
(C) here there is a curved surface with the adjacent streamlines closely followingthe contour; at a comparatively short distance away from the upper surface thestreamlines are those of the free air stream unaffected by the presence of thecurved walls. This is the flow pattern over a typical airfoil, in this case at zero angleof attack.
Figure 9: Development of an Airfoil from a Venturi
(A)
(B)
(C)
EASA PART 66 MODULES Airline Maintenance & Engineering Training Ltd. Page 18 of 62

Introduction to Lift
The curved surface shown in Figure 10 on page 7, looks like the cross section ofan aeroplane’s wing. It is named airfoil. Prior to study the generation of lift, it is nec-essary to have a closer look at the airfoil sections.
Airfoil Sections
Aerodynamic lift depends on the shape of the airfoil section and on the airfoil sur-face area.The figure bellow shows a typical subsonic airfoil section and some ofthe more important terms related to its shape.
Figure 10: Airfoil Sections
The mean camber (H) is a line drawn midway between the upper and lower cam-bers, and its curvature is one of the most important factors in determining the aer-odynamic characteristics of the airfoil. The maximum camber (F) of a typical low-speed airfoil is about 4% of the length of the chord line, and is located about 40%of the chord length behind the leading edge. The maximum thickness (E) is about12% of the chord length and is located about 30% of the chord length behind theleading edge.
Fineness Ratio
The ratio of length to breadth, is called the Fineness Ratio of a streamlined body.Applying this to airfoils, the length is L and the breath is E (maximum thickness)on Figure 10 on page 7.
For best results it should be about 4 to 1, but it really depends on the air speed;the higher the speed, the greater should be the fineness ratio, but experimentshave shown that there is not much variation in the drag for quite a large range offineness ratios.
C G
H
A
M
L
K
FE
D
B
J
Table 1: Airfoil Nomenclature
A Chord line G Upper camber
B Leading edge radius H Mean camber
C Leading edge J Trailing edge
D Location of maximum thickness K Lower camber
E Maximum thickness L Chord
F Maximum camber M Location of maximum camber
EASA PART 66 MODULES Airline Maintenance & Engineering Training Ltd. Page 19 of 62

History of Airfoils
The earliest airfoils were deeply cambered, and some were not even covered onthe bottom. The shape was copied from a bird’s wing. The next major step in airfoildevelopment was the Clark-Y airfoil, the standard airfoil section through the 1920sand into the 1930s. The National Advisory Committee for Aeronautics (NACA), theancestor of today’s NASA, developed much more streamlined airfoils that alloweda smoother flow of air and greater lift with less drag. These airfoils included bothsymmetrical and asymmetrical sections.
When aeroplanes such as the Lockheed Lightning of World War II fame began fly-ing in the transonic range, their subsonic airfoil sections left much to be desired.Shock waves formed, increasing drag and destroying control. Further study devel-oped the supersonic airfoils, with their maximum thick- ness about midway backand their equally sharp leading and trailing edges. The super critical airfoil evolvednext, with its blunter leading edge and flatter upper surface. This airfoil section re-duces the velocity of the air over the upper surface and delays the extreme dragrise that occurs as the airfoil approaches the speed of sound.
The NASA-developed GAW- 1 and GAW-2 low-speed airfoils have the samedownward cusp at the trailing edge that the super critical airfoil has. These airfoilswere developed for general aviation aircraft, and they give a wing a higher L/D ra-tio by increasing the lift and decreasing the drag.
Figure 11: Airfoil Evolution
Early Cambered Airfoil Symmetrical Airfoil
Clark-Y Airfoil Double Wedge Supersonic Airfoil
Modern Asymmetrical Airfoil Circular Arc Supersonic Airfoil
Supercritical Airfoil
GAW-1 Airfoil GAW-2 Airfoil
EASA PART 66 MODULES Airline Maintenance & Engineering Training Ltd. Page 20 of 62

Aerodynamic Forces
Lift
When the angle between the airfoil and airflow (angle of attack) increases, theasymmetrical flow causes a pressure differences between the upper and lowersurfaces of the wing. This creates upward and down-ward forces. The air particlesgo faster over the upper surface of the wing. Their speed depends on the angle ofthe wing and the airflow in relation to each other. Because of the increase inspeed, the static pressure decreases on the top of the wing (Bernoulli’s Law). Apressure difference occurs between the upper and lower surfaces of the wing andthe airflow, just before reaches the leading edge, is sucked into this low-pressurearea. This is called upwash.
Figure 12: Development of Aerodynamic Lift
The amount of lift is determined by, among others, the shape of the wing. In thecase of a flat wing shape (parallel to the direction of flow) an equal number of airparticles flow along the upper and along the lower surfaces of the wing. The dragis minimal and the pressure difference between top and bottom is nonexistent. Inthe case of a cambered wing upper surface, the air particles along the top musttravel a greater distance than the air particles moving along the bottom surface ofthe wing. According to the rule of continuity, the number of in flowing air particlesper unit of time is equal to the number of out flowing air particles. This means thatthe particles along the top of the wing must move faster than the air particles alongthe bottom of the wing. Under pressure is created. It also means that the pressure
on the underside is greater than on the topside. Taken together, they cause an up-ward force. Lift is indicated by the symbol L. The heavier the aeroplane is, thegreater the required lift must be.
The air above the surface will be pulled down into this low-pressure area and, asa result, air is forced down as the airfoil moves through it. This deflection of air,called the downwash, is what actually produces the lift (see “Figure 12” onpage 9). In order to support an aircraft, the weight of the air forced down mustequal the weight of the aircraft. The amount of lift produced can be increased byincreasing the angle of attack, and thus the downwash angle. But a maximum an-gle will be reached beyond which this is no longer true. Above this critical angle,the air will break away from the upper surface, and the airfoil will stall. Also, thefaster the airfoil is moved through the air, the greater will be the amount of air de-flected and the amount of lift produced.
Drag
The total drag on an aircraft is the sum of all of the types of drag. Drag can be clas-sified into two main headings, these are:
• Induced Drag: Drag due to lift.
• Parasite Drag: Drag due to the viscocity of the air.
Induced Drag
This is inseparable from lift and any time that lift is produced so will induced dragbe present.
It has been shown that when an airfoil produces lift there is a positive pressure be-neath the wing. This pressure moves outwards toward the lower pressure of theatmosphere.
On the top surface there is a negative pressure which moves inwards away fromthe higher pressure of the atmosphere.
As the two airflow's mix together at the trailing edge, there is a twisting motion im-parted because of the opposite relative flow directions (see “Figure 4” on page 3).This forms a series of small vortices which travel in a downward direction.
The Vortices become progressively larger from wing root to wing tip. At the wingtip high pressure air from beneath the wing spills over into the low pressure on topof the wing, this causes a large trailing vortex.
RelativeAirflow
Upwash
Stagnation Point High Pressure
Lift
Low Pressure
Downwash
EASA PART 66 MODULES Airline Maintenance & Engineering Training Ltd. Page 21 of 62

Figure 13: Wing Tip Vortices
The trailing vortex of a wing is attached to the wing by friction and is in effect actingas a brake as it is being dragged along by the aircraft. This is induced drag.
Parasite Drag
Parasite Drag can be broken down into three types:
• Form Drag.
• Interference Drag.
• Skin Friction.
Any part of the aircraft which is presented to the relative airflow will produce dragdue to the resistance of the air flowing past it.
Any part of the aircraft which does not contribute to lift will produce Parasite Drag.Typically landing gear, antennas, and the fuselage all produce Parasite Drag.
Form Drag
This is the portion of the resistance which is due to the fact that when a viscousfluid flows past a solid object, vortices are formed, and we no longer get a smoothstreamline flow. The extreme example of this type of resistance is a flat plateplaced at right angles to the airflow. The resistance is very large and is almost en-tirely due to the formation of vortices, the skin friction being negligible in compari-son.
Experiments show that not only is the pressure in front of the plate greater than theatmosphere pressure, but that the pressure behind is less than that of the atmos-phere, causing a kind of “sucking” effect on the plate.
It is essential that form drag should be reduced to a minimum in all those parts ofthe aircraft which are exposed to the air. This can be done by so shaping them thatthe flow of air past them is as smooth as possible, and much experimental workhas been carried out with this in view. The results show the enormous advantageto be gained by the streamlining of all exposed parts, in fact, the figures obtainedare so remarkable that they are difficult to believe without a practical demonstra-tion.
Low Pressure
High Pressure
EASA PART 66 MODULES Airline Maintenance & Engineering Training Ltd. Page 22 of 62
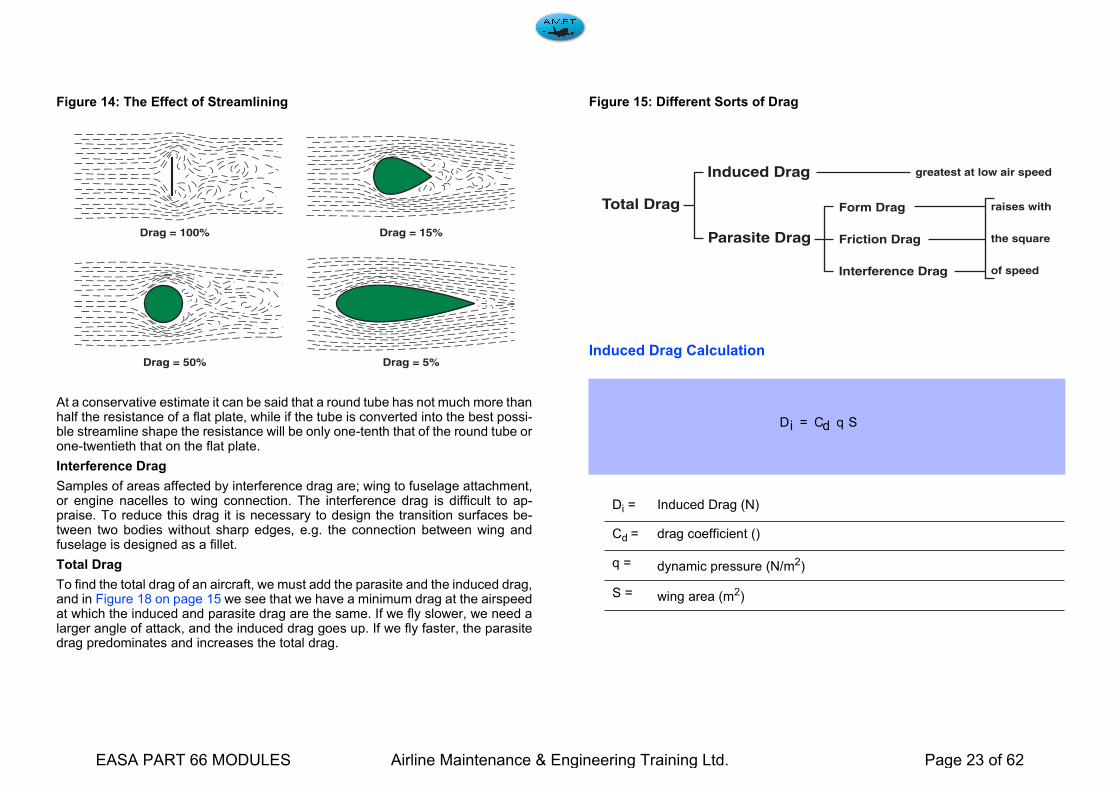
Figure 14: The Effect of Streamlining
At a conservative estimate it can be said that a round tube has not much more thanhalf the resistance of a flat plate, while if the tube is converted into the best possi-ble streamline shape the resistance will be only one-tenth that of the round tube orone-twentieth that on the flat plate.
Interference Drag
Samples of areas affected by interference drag are; wing to fuselage attachment,or engine nacelles to wing connection. The interference drag is difficult to ap-praise. To reduce this drag it is necessary to design the transition surfaces be-tween two bodies without sharp edges, e.g. the connection between wing andfuselage is designed as a fillet.
Total Drag
To find the total drag of an aircraft, we must add the parasite and the induced drag,and in Figure 18 on page 15 we see that we have a minimum drag at the airspeedat which the induced and parasite drag are the same. If we fly slower, we need alarger angle of attack, and the induced drag goes up. If we fly faster, the parasitedrag predominates and increases the total drag.
Figure 15: Different Sorts of Drag
Induced Drag Calculation
Drag = 100%
Drag = 50% Drag = 5%
Drag = 15%
Di = Induced Drag (N)
Cd = drag coefficient ()
q = dynamic pressure (N/m2)
S = wing area (m2)
raises with
the square
of speed
Form Drag
Friction Drag
Interference Drag
Parasite Drag
Total Drag
Induced Drag greatest at low air speed
Di Cd q S=
EASA PART 66 MODULES Airline Maintenance & Engineering Training Ltd. Page 23 of 62

Development of Lift and Drag
Five factors affect aerodynamic lift and induced drag:
• Shape of the airfoil section
• Area of the airfoil
• Air density
• Speed of the air relative to the airfoil surface
• Angle between the airfoil and the relative airflow (the angle of attack)
Notice that two of these factors relate to the airfoil, two to the air, and one to therelationship between the two.
The direction of the lift produced by the wing is always perpendicular to the direc-tion of the relative airflow.
Figure 16: Aerodynamic Forces
The centre of pressure is the point on the chord line of an airfoil at which all of theaerodynamic forces are concentrated. The lift vector acts from the centre of pres-sure in a direction that is perpendicular to the relative airflow, and the drag vectoracts from this same point in a direction parallel to the relative airflow.
The centre of pressure of a subsonic airfoil is typically located somewhere around30% to 40% of the chord line back from the leading edge. On an airfoil, the centre
of pressure moves forward as the angle of attack increases, and backward as itdecreases.
Lift Calculation
To find the amount of aerodynamic lift produced by an airfoils the following formu-la. When the air density is expressed as a density ratio (s) between standard airdensity at sea level and the density of the existing air, and the velocity of the air isexpressed in m/s, the dynamic pressure (q) of the air in kg per square metre isfound with the formula.
Notice that the lift is affected by the square of the airspeed. Doubling the airspeedincreases the lift four times.
Relative Airflow
Chord Line
Angle ofAttack (α)
Drag (D)
Lift (L)Resultant Force (LR)
Center of Pressure (CP)
L = aerodynamic lift (N)
CL= lift coefficient from airfoil graph ()
q = dynamic pressure (N/m2)
S = airfoil surface (m2)
L Cl
q S=
EASA PART 66 MODULES Airline Maintenance & Engineering Training Ltd. Page 24 of 62
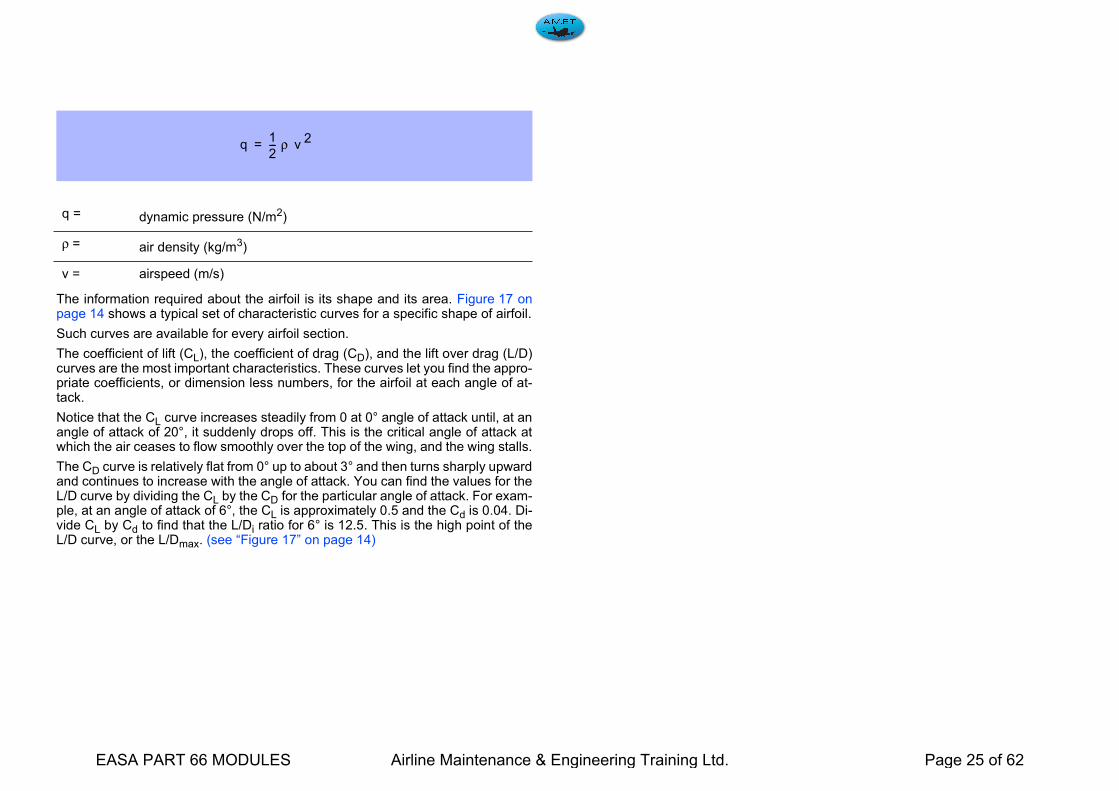
The information required about the airfoil is its shape and its area. Figure 17 onpage 14 shows a typical set of characteristic curves for a specific shape of airfoil.
Such curves are available for every airfoil section.
The coefficient of lift (CL), the coefficient of drag (CD), and the lift over drag (L/D)curves are the most important characteristics. These curves let you find the appro-priate coefficients, or dimension less numbers, for the airfoil at each angle of at-tack.
Notice that the CL curve increases steadily from 0 at 0° angle of attack until, at anangle of attack of 20°, it suddenly drops off. This is the critical angle of attack atwhich the air ceases to flow smoothly over the top of the wing, and the wing stalls.
The CD curve is relatively flat from 0° up to about 3° and then turns sharply upwardand continues to increase with the angle of attack. You can find the values for theL/D curve by dividing the CL by the CD for the particular angle of attack. For exam-ple, at an angle of attack of 6°, the CL is approximately 0.5 and the Cd is 0.04. Di-vide CL by Cd to find that the L/Di ratio for 6° is 12.5. This is the high point of theL/D curve, or the L/Dmax. (see “Figure 17” on page 14)
q = dynamic pressure (N/m2)
ρ = air density (kg/m3)
v = airspeed (m/s)
q1
2--- ρ v
2=
EASA PART 66 MODULES Airline Maintenance & Engineering Training Ltd. Page 25 of 62
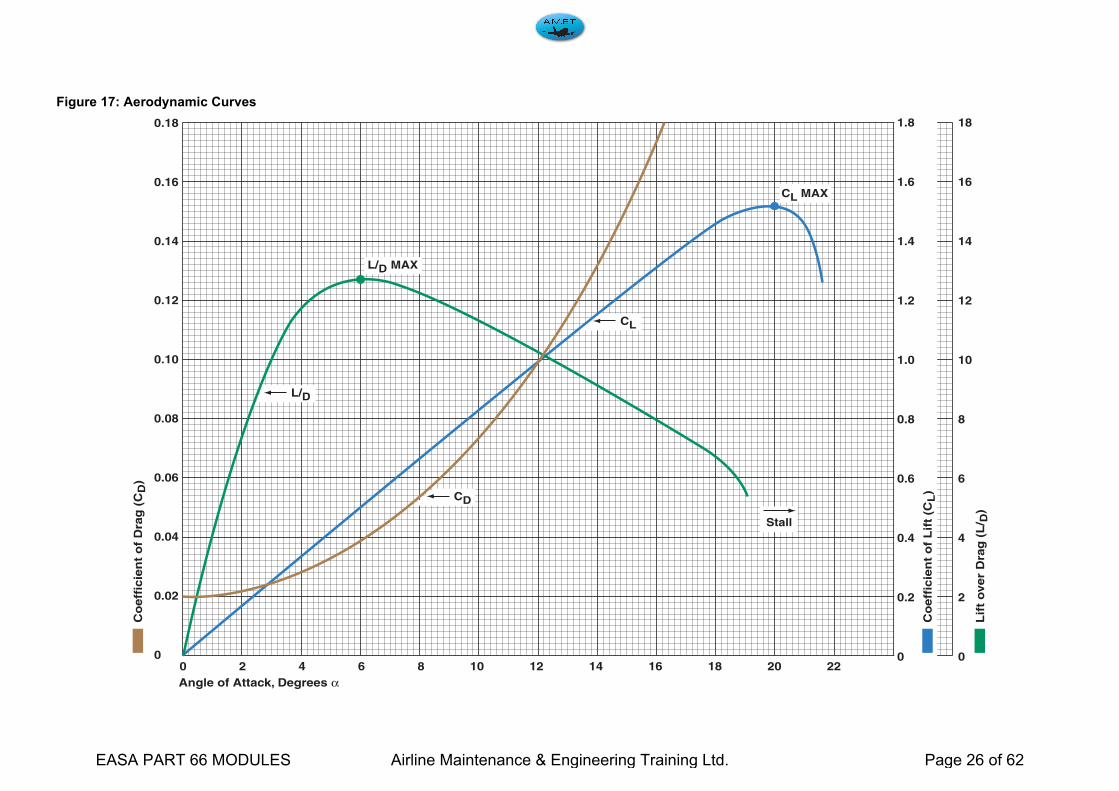
Figure 17: Aerodynamic Curves
0.18
0.16
0.14
0.12
0.10
0.08
0.06
0.04
0.02
00 2 4 6 8 10 12 14 16 18 20 22
1.8
1.6
1.4
1.2
1.0
0.8
0.6
0.4
0.2
0 0
Co
eff
icie
nt
of
Lif
t (C
L)
Co
eff
icie
nt
of
Dra
g (
CD
)18
16
14
12
10
8
6
4
2
Lif
t o
ve
r D
rag
(L
/ D)
Angle of Attack, Degrees α
CL MAX
CL
CD
L/D
L/D MAX
Stall
EASA PART 66 MODULES Airline Maintenance & Engineering Training Ltd. Page 26 of 62

Figure 18: Aerodynamic Curves
4000
3000
2000
1000
00 100 200 300 400 500 600
Velocity (Knots)
Dra
g (
Po
un
ds
)
Parasite Drag
Drag Rise Dueto Compressibility
Total Drag
Induced Drag
L/D MAX
Stall
EASA PART 66 MODULES Airline Maintenance & Engineering Training Ltd. Page 27 of 62

The Wing
It is not only the airfoil shape, which determines the amount of lift produced froman aeroplane's wing. There are many other wing dimensions which contribute tothe produced amount of Lift. The most important ones are described in this sec-tion.
At first some terms belonging to wing are described
Wing Sections
Span (b)
Is the maximum distance from tip to tip, not depending on the planform.
Area (S)
Is the surface of the planview of the apparent wing, including the parts coveredfrom the fuselage, engines and others.
Figure 19: Wing Description
b
c
ct
cr
EASA PART 66 MODULES Airline Maintenance & Engineering Training Ltd. Page 28 of 62

Angle Of Incidence
The acute angle formed between the chord of the wing and a line drawn parallelto the longitudinal axis of the aircraft.
Figure 20: Angle of Incidence and Angle of Attack
Mean Chord (c)
Normally the airfoils which form a wing vary along the wing span. A good exampleis a tapered wing with the longest chord (cr) at the root and the shortest at the tip(ct) (see “Figure 19” on page 16). The mean chord is the one which multiplied withthe span results in Wing area.
Mean Aerodynamic chord (MAC)
Is the mean chord of an equivalent unswept rectangular wing which would producethe same lift moment and lift force like the considered wing.
The position of the MAC (respective to the longitudinal axle) is very important con-sidering aeroplane's stability. On "Figure 21: Mean Aerodynamic chord” is thegraphical method to find the MAC. Notice that this method is not usable for wingswhich present a discontinuity in its chord. The MAC of such wings is normally de-scribed in the maintenance manuals.
Figure 21: Mean Aerodynamic chord
c = mean chord (m)
b = span
S = wing area (m2)
Angle ofAttack (α)
Angle of Incidence
cS
b----=
Root Chord
KinkChord
MAC
Tip Chord
FuselageCenter Line
EASA PART 66 MODULES Airline Maintenance & Engineering Training Ltd. Page 29 of 62

Area and Lift
One factor in the total lift of an airfoil is the area of the surface exposed to the air-flow. If the area is small, the region of pressure differential is small and there is littlelift. On the other hand, if the area is great, the region of pressure differential is greatand there is a large amount of lift.
Planform
The wing may have an almost infinite variety of planforms built not only for aero-dynamic reasons but for structural reasons as well. The way in which the lift permetre of span varies along the span, depends on (among other things) the way inwhich the chord varies along the span. For untapered rectangular planform wings,most of the trailing vortices are shed near the tips. In this case, the down wash willbe greatest near the tips. If a tapered wing is used, the lift is increased at the cen-tre, and trailing vortices are produced more evenly along the span.
EASA PART 66 MODULES Airline Maintenance & Engineering Training Ltd. Page 30 of 62

Figure 22: Exaggerated Wing Planforms
Sweptback Wing Taper Wing Rectangular Wing
Elliptical Wing Sweptforward Wing Delta Wing
EASA PART 66 MODULES Airline Maintenance & Engineering Training Ltd. Page 31 of 62

Theoretical analysis indicates that for a given amount of lift, the smallest amountof trailing vortex (induced) drag will be produced when the down wash is constantalong the span.
The same analysis also shows that the constant down wash condition is obtainedif the lift per metre of span varies from zero at the tips, to a maximum at the centre,following an elliptical relationship.
Figure 23: Constant downwash
An elliptical span wise variation of lift thus represents a theoretical ideal case forminimum trailing vortex drag.
On aircraft with un-swept wings, an elliptical variation of lift can be produced by us-ing a wing where the chord varies elliptically with distance along the span. Suchwings have rarely been built.
There are manufacturing problems associated with an elliptical planform and fur-thermore, this shape is not ideal from a structural point of view.
The structural designer would prefer the lift forces to be concentrated near the cen-tre of root of the wing, so as to reduce bending moments. He would also like thedepth of the wing spars to reduce towards the tips to maintain a constant level of
bending stress. If the wing section shape were then to be the same at all positions,the chord would have to reduce accordingly. This would lead to the form of wingshown by the dashed lines of Figure 24 on page 20.
Figure 24: Precise elliptical variation of chord
The trailing vortex drag depends of the lift required, which in turn depends on theaircraft weight. A wing of this better structural shape should be lighter than the el-liptical wing. The elliptical planform would only represent the shape for minimuminduced drag if the weight of the wing structure were negligible. This is never thecase, and by using a more efficient structural shape, it is possible to save weight. It therefore follows that for a real aircraft, the lowest drag would be given by a plan-form shape that was somewhere between the two extremes shown in Figure 24on page 20; a compromise between the aerodynamic and structural ideals. In fact,a straight taper gives a good compromise, and has the advantage of being easyto construct.
Lift
Constant Downwash
Preffered planform forpurely structuralconsiderations
Elliptical planform forminimum trailing vortex
EASA PART 66 MODULES Airline Maintenance & Engineering Training Ltd. Page 32 of 62
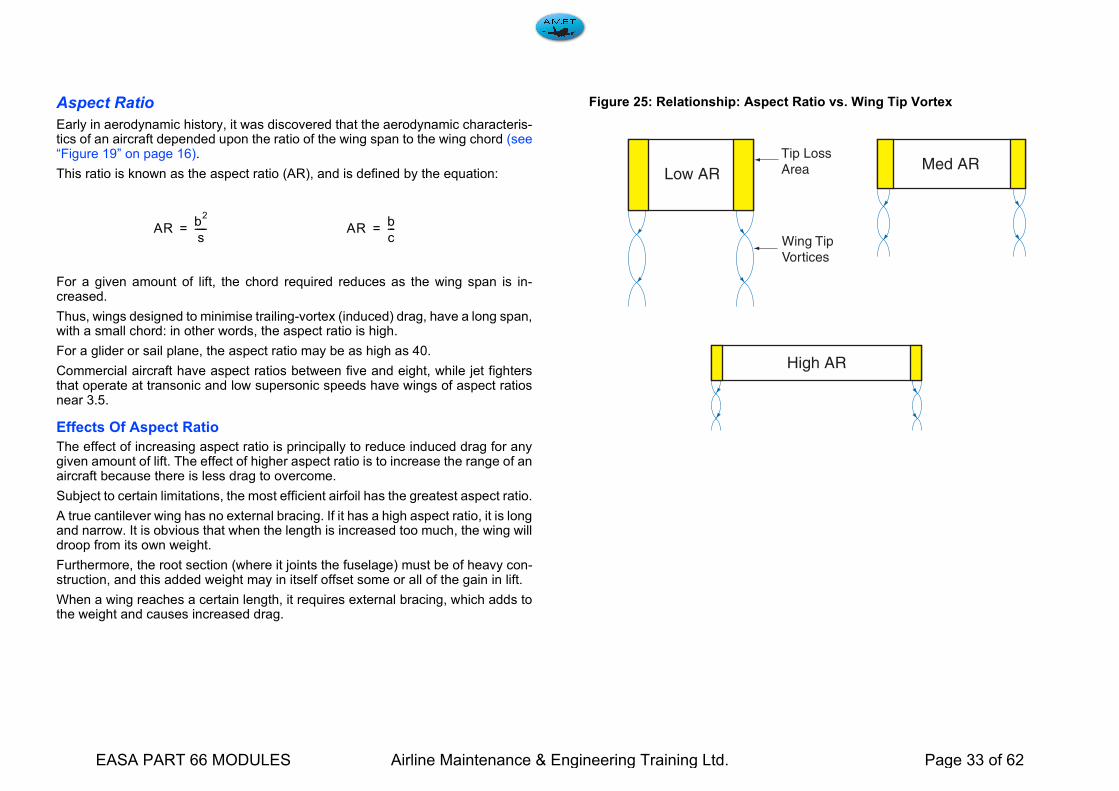
Aspect Ratio
Early in aerodynamic history, it was discovered that the aerodynamic characteris-tics of an aircraft depended upon the ratio of the wing span to the wing chord (see“Figure 19” on page 16).
This ratio is known as the aspect ratio (AR), and is defined by the equation:
For a given amount of lift, the chord required reduces as the wing span is in-creased.
Thus, wings designed to minimise trailing-vortex (induced) drag, have a long span,with a small chord: in other words, the aspect ratio is high.
For a glider or sail plane, the aspect ratio may be as high as 40.
Commercial aircraft have aspect ratios between five and eight, while jet fightersthat operate at transonic and low supersonic speeds have wings of aspect ratiosnear 3.5.
Effects Of Aspect Ratio
The effect of increasing aspect ratio is principally to reduce induced drag for anygiven amount of lift. The effect of higher aspect ratio is to increase the range of anaircraft because there is less drag to overcome.
Subject to certain limitations, the most efficient airfoil has the greatest aspect ratio.
A true cantilever wing has no external bracing. If it has a high aspect ratio, it is longand narrow. It is obvious that when the length is increased too much, the wing willdroop from its own weight.
Furthermore, the root section (where it joints the fuselage) must be of heavy con-struction, and this added weight may in itself offset some or all of the gain in lift.
When a wing reaches a certain length, it requires external bracing, which adds tothe weight and causes increased drag.
Figure 25: Relationship: Aspect Ratio vs. Wing Tip Vortex
ARb
2
s-----= AR
b
c---=
Low ARMed AR
High AR
Wing TipVortices
Tip LossArea
EASA PART 66 MODULES Airline Maintenance & Engineering Training Ltd. Page 33 of 62

Washout
Many aircraft are designed with a greater angle of incidence at the root of the wingthan at the tip; this characteristic of a wing is called washout.
The purpose of washout is to improve the stability of the aircraft as it approachesa stall condition. The section of the wing near the fuselage will stall before the outersection, thus enabling the pilot to maintain good control and reducing the tendencyof the aircraft to “fall off” on one wing.
If a wing is designed so that the angle of incidence is greater at the tip than at theroot, the characteristic is called washin.
A difference in the washout and washin of the right and left wings of an aircraft isused to compensate for propeller torque. Propeller torque causes the aircraft to rollin a direction opposite that of the propeller rotation.
To compensate for this, the right wing is rigged or designed with a smaller angleof incidence at the tip than that of the left wing. Thus, the right wing is washed outmore than the left.
Figure 26: Washin and Washout
Washout
Longitudinal Axis
Longitudinal Axis
Angle of Incidence
Chord Line
EASA PART 66 MODULES Airline Maintenance & Engineering Training Ltd. Page 34 of 62

Airfoil Contamination
Ice Accumulation
Rain, snow, and ice are transportation’s ancient enemies. Flying has added a newdimension, particularly with respect to ice. Under certain atmospheric conditions,ice can build rapidly on airfoils and air inlets. The accumulation of ice on the lead-ing edge of wings can significantly alter the geometry of the wing and cause dragpenalty and performance degradation (and in the worst case, safety can be affect-ed. The two types of ice encountered during flight are “rime” and “glaze”.
Rime ice forms a rough surface on the aircraft leading edges. It is rough becausethe temperature of the air is very low and freezes the water before it has time tospread.
Glaze ice (clear ice) forms a smooth, thick coating over the leading edges of theaircraft. When the temperature is just slightly below freezing, the water has moretime to flow before it freezes.
Ice may be expected to form whenever there is visible moisture in the air and thetemperature is near or below freezing. An exception is carburettor icing which canoccur during warm weather with no visible moisture present. If ice is allowed to ac-cumulate on the wings and empennage leading edges, it destroys the lift charac-teristics of the airfoil. Ice or rain accumulations on the windshield interfere withvision (see “Figure 28” on page 24).
Contamination Effects
Ice on an aircraft affects its performance and efficiency in many ways. Ice build upincreases drag and reduces lift. It causes destructive vibration, and hampers trueinstrument readings.
Control surfaces become unbalanced or frozen. Fixed slots are filled and movableslots jammed. Radio reception is hampered and engine performance is affected.
Ice, snow, rime formation or deteriorations of other kind having a thickness andsurface roughness of a medium sandpaper on the leading edge and upper surfaceof the wing can reduce wing lift by around 30% and increase drag by 40%.
It is important to consider that other kind of contaminations or deteriorations alsoaffect wing Lift and drag in the same way like explained for ice, rime and snow.Some examples of contamination and deterioration are:
• Misrigging of control surfaces
• Absence of seals on movable sections
• Dents on surfaces (bird strikes, accidental ground damages)
• External repair (doubler)
• Paint peeling
• Lack of cleanless
The first 20% of the wing chord is particularly sensitive, because disturbancy of airflow passing it can cause separation resulting in early stall.
These changes in Lift and drag significantly increase stall speed, reduce controla-bility and alter flight characteristics.
Figure 27: Wing Contamination Effects
Angle of Attack
Clean Wing
ContaminatedWing
Stall ProtectionActivation
Wing Tip Stall
Lift
EASA PART 66 MODULES Airline Maintenance & Engineering Training Ltd. Page 35 of 62
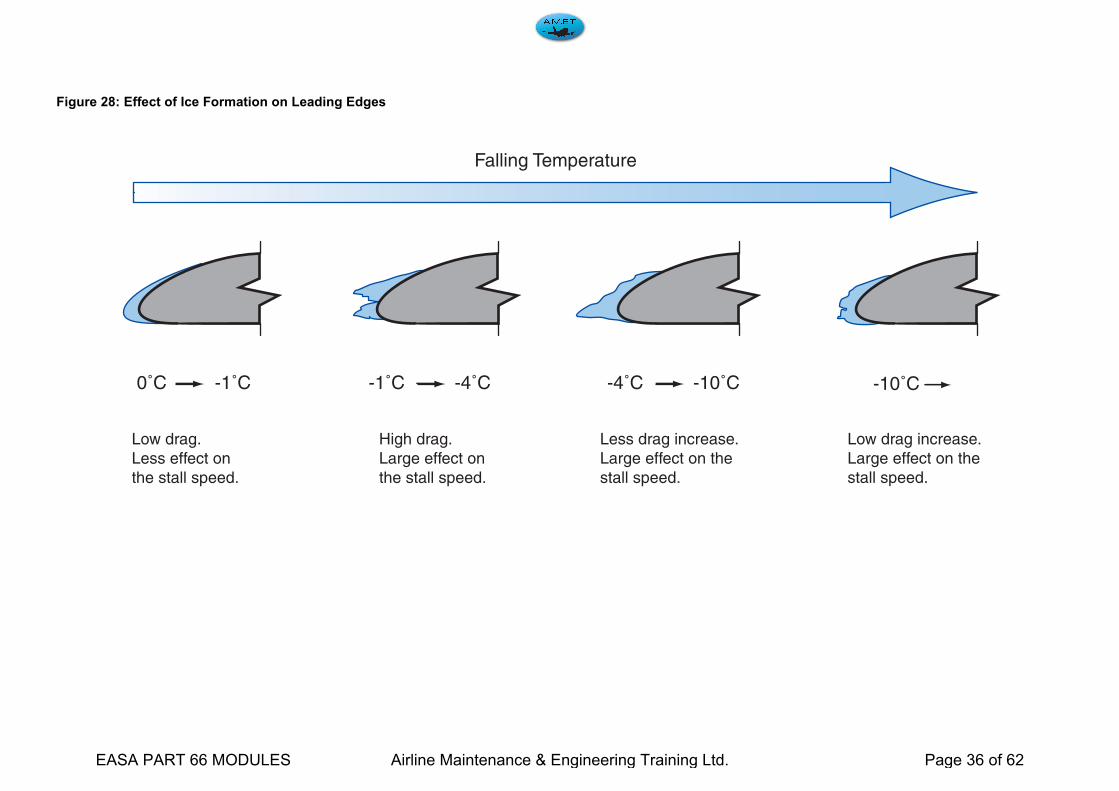
Figure 28: Effect of Ice Formation on Leading Edges
Falling Temperature
0˚C -1˚C -1˚C -4˚C -4˚C -10˚C -10˚C
Low drag.Less effect onthe stall speed.
High drag.Large effect onthe stall speed.
Less drag increase.Large effect on thestall speed.
Low drag increase.Large effect on thestall speed.
EASA PART 66 MODULES Airline Maintenance & Engineering Training Ltd. Page 36 of 62

8.3 Theory of Flight
EASA PART 66 MODULES Airline Maintenance & Engineering Training Ltd. Page 37 of 62

Forces Acting on the Aircraft in Flight
When in flight, there are certain favourable forces and other unfavourable forcesacting on the aircraft. Among the aerodynamic forces acting on the aircraft duringflight, four are considered to be basic because they act upon the aircraft during allmanoeuvres.
These basic forces are:.
Lift
In a classic configuration, nearlyall lift is generated by the wings.Lift is the force which supportsthe aircraft in flight. It acts at rightangles to the relative airflow andthe chord line. In steady constantvelocity flight lift exactly equalsweight.
Weight
Gravity is the downward force which tends to draw all bodies vertically towards thecentre of the earth. The aircraft's Centre of Gravity (CG) is the point on the aircraftat which all weight is considered to be concentrated. It is the point of balance.Thecentre of gravity is located along the centreline of the aircraft and forward near thecentre of lift of the wing. The location of the centre of gravity depends upon the lo-cation and weight of the load placed in the aircraft.
Thrust
Is the force produced by the power plant. It acts in a forward direction and is usedto overcome the force of drag.
Drag
There are two main headings for drag:
• Induced Drag - The drag due to the production of lift.
• Parasitic Drag - The resistance of air to the passage of the aircraft. In levelconstant velocity flight, Lift equals Weight and Thrust equals Drag.
Balancing the four Forces
The four forces do not necessarily act at the same point and move around as thelift, weight, thrust and drag change. The forces have to be arranged in a mannerso that the moments produced by the forces, balance each other out duringstraight and level flight (see “Figure 1” on page 2) .
Figure 1: The Four Basic Forces
The forces are arranged in couples; lift / weight and thrust / drag .
If the Centre of Pressure (CP) is acting behind the CG this will give the aircraft anose down pitching moment. If the CP is acting forward of the CG this will give theaircraft a nose up pitching moment. If the thrust line is below the CG this will givethe aircraft a nose up pitching moment. If the thrust line is above the CG this willgive the aircraft a nose down pitching moment. Ideally, the pitching moments setup from Lift / Weight and Thrust / Drag, should cancel each other out in straightand level flight so as to have no residual moments, tending to pitch the aircraft. Itis normal to design an aircraft so that the centre of pressure lies slightly behind theCG with the thrust line below the CG Then the arrangement Lift / Weight will givea nose down moment while Thrust / Drag will give a nose up moment.
Drag
Weight
Thrust
Lift
Drag
Weight
Thrust
Lift
EASA PART 66 MODULES Airline Maintenance & Engineering Training Ltd. Page 38 of 62
Axes of Rotation
The aircraft has three Axes of Rotation. These are:
Lateral Axis
Also known as the Pitch axis. A straight line passing through the CG parallel to thewing span. Pitch is controlled by the elevators. Motion about the Lateral Axis is re-ferred to as Longitudinal Control or Longitudinal Stability.
Longitudinal Axis
Also known as the Roll axis. A straight line through the fuselage of an aircraft pass-ing through the C.of G. Roll is controlled by the ailerons. Motion about the Longi-tudinal Axis is referred to as Lateral Control or Lateral Stability.
Vertical Axis
Also known as the Yaw axis or normal axis. A straight line running verticallythrough the CG (the intersection of the Longitudinal and Lateral Axis). Yaw is con-trolled by the rudder. Motion about the Vertical Axis is referred to as DirectionalControl or Directional Stability.
The aircraft can rotate around all three axes simultaneously or it can rotate aroundjust one axis. Stability of the aircraft is the combination of forces that act aroundthese three axes to keep the pitch attitude of the aircraft in a normal level flight at-titude, the wings level, and the nose of the aircraft directionally straight along thedesired path of flight.
EASA PART 66 MODULES Airline Maintenance & Engineering Training Ltd. Page 39 of 62

Figure 2: Axes of Rotation
Vertical AxisLongitudinal Axis
Lateral Axis
Pitch YawRoll
EASA PART 66 MODULES Airline Maintenance & Engineering Training Ltd. Page 40 of 62

Forces in a Glide
If an aircraft's engine should fail, it will descend in a normal flying attitude; it is thensaid to be gliding. In a steady glide, the aircraft is kept in equilibrium by only threeforces, Lift, Drag and Weight.
Glide Ratio
The ratio of every unit of vertical distance an aircraft descends, to the horizontaldistance it travels while gliding.
Large transport aircraft have a glide ratio of around 1:18.
The Glide Angle
The total reaction (the resultant of the lift and drag) must be exactly equal and op-posite to weight. The gliding angle is equal to the angle formed between the lift andthe total reaction. The higher the lift / drag ratio, the smaller the gliding angle, thusincreasing the glide ratio.
If an aircraft glides at an angle of attack either greater or less than the optimum lift/drag ratio, then in each case the path of decent will be steeper. If greater than theoptimum angle the speed will be below the correct gliding speed, if less than theoptimum angle, the speed will be greater than the correct gliding speed.
The glide angle depends on the ratio of lift to drag and is independent of weight. Ifthe weight is greater there will need to be a corresponding increase in the total re-action and greater lift and drag but the proportions remain the same. Howevergreater lift and drag can only be obtained through greater speed. The distancecovered will be the same but the time taken to descend will be reduced.
Figure 3: Forces in a Glide.
Drag
Weight
Thrust
Lift
WT
EASA PART 66 MODULES Airline Maintenance & Engineering Training Ltd. Page 41 of 62

Figure 4: Gliding Angle
0.18
0.16
0.14
0.12
0.10
0.08
0.06
0.04
0.02
00 2 4 6 8 10 12 14 16 18 20 22
1.8
1.6
1.4
1.2
1.0
0.8
0.6
0.4
0.2
0 0
Co
eff
icie
nt
of
Lif
t (C
L)
Co
eff
icie
nt
of
Dra
g (
CD
)18
16
14
12
10
8
6
4
2
Lif
t o
ve
r D
rag
(L
/ D)
Angle of Attack, Degrees α
CL MAX
CL
CD
L/D
L/D MAX
Stall
EASA PART 66 MODULES Airline Maintenance & Engineering Training Ltd. Page 42 of 62

Flight Fases
Take-Off
When a flight begins at T/O, the aircraft is loaded with enough fuel for its flight, plusthe crew and passengers or cargo. At this point it may be at its heaviest weight,which is known as Maximum Take-off Weight (MTOW). The engines will be oper-ating at their highest power settings and the aircraft will be accelerated along therunway.
Because we want the aircraft to use as short a run as possible, drag will be keptto a minimum. This means keeping the AOA as low as possible. When sufficientspeed has been reached, the pilot will increase the angle of attack by raising thenose wheel off the ground. The force for this comes from the Horizontal stabilizer,which is producing negative lift.
A partial flap setting may be used to produce more lift at a lower speed.
Climb
A change in lift occurs when back elevator pressure is first applied. Raising the air-craft's nose increases the angle of attack and momentarily increases the lift. Lift atthis moment is now greater than weight and starts the aircraft climbing.
After the flight path is stabilised on the upward incline, the angle of attack and liftrevert to about the level flight values. Generally speaking, the forces of thrust anddrag, and lift and weight, become balanced.
The airspeed stabilises at a value lower than in straight and level flight at the samepower setting. This is because a component of the aircraft's weight acts in thesame direction as, and parallel to, the total drag of the aircraft, thereby increasingthe total effective drag.
The ability to climb comes from the engines delivering enough thrust to overcomethe total effective drag. In fact, because the thrust line is inclined uphill, a portionof thrust can be assigned to supporting the weight of the aircraft and less lift is re-quired from the wings in a climb than in level flight.
Figure 5: Aircraft in Climb.
Drag
Weight
Thrust
Lift
WD
Thrust = WD + Drag
EASA PART 66 MODULES Airline Maintenance & Engineering Training Ltd. Page 43 of 62

Cruise
At the top of the climb the aircraft is levelled off. The power is reduced to the nor-mal cruise setting and the four forces stabilise.
As fuel is burned the aircraft becomes lighter and less lift is required. The angle ofattack can be reduced and unless thrust is reduced the aircraft will accelerate.
During cruise, the altitude normally remains constant, but the aircraft heading ischanged frequently. This is done by rolling the aircraft in the desired direction orturn. When this happens the distribution of the four forces is changed.
Figure 6: Level Flight (Cruise)
Descent
A descent, or glide, is a basic manoeuvre in which the aircraft is losing altitude ina controlled way with little or no engine power. Forward motion is maintained bygravity pulling the aircraft along an inclined path. The descent rate is controlled bythe pilot balancing the forces of gravity and lift.
As in climbs, the forces acting on the aircraft go through definite changes when adescent is entered from straight and level flight.When forward pressure is appliedto the elevator control to start descending, or the aircraft's nose is allowed to pitchdown, the angle of attack is decreased and, as a result, the lift of the airfoil is re-duced. This reduction in total lift and angle of attack is momentary and occurs dur-ing the time the flight path changes downward. The change to a downward flightpath is due to the lift momentarily becoming less than the weight of the aircraft asthe angle of attack is reduced. When the flight path is in steady descent, the air-foil's angle of attack again approaches the original value, and lift and weight willagain become stabilised. From the time the descent is started until it is stabilised,the airspeed will gradually increase. This is due to a component of weight now act-ing forward along the flight path, similar to the manner it acts rearward in a climband which has to be added to the engine thrust to get the overall propulsiveforce.To descend at the same airspeed as used in straight and level flight, obvi-ously, the power must be reduced as the descent is entered. The component ofweight acting forward along the flight path will increase as the angle of descent in-creases and conversely, will decrease as the angle of descent decreases. There-fore, the amount of power reduction required for a descent at the same speed, ascruise will be determined by the steepness of the descent.
Drag
Weight
Thrust
Lift
EASA PART 66 MODULES Airline Maintenance & Engineering Training Ltd. Page 44 of 62
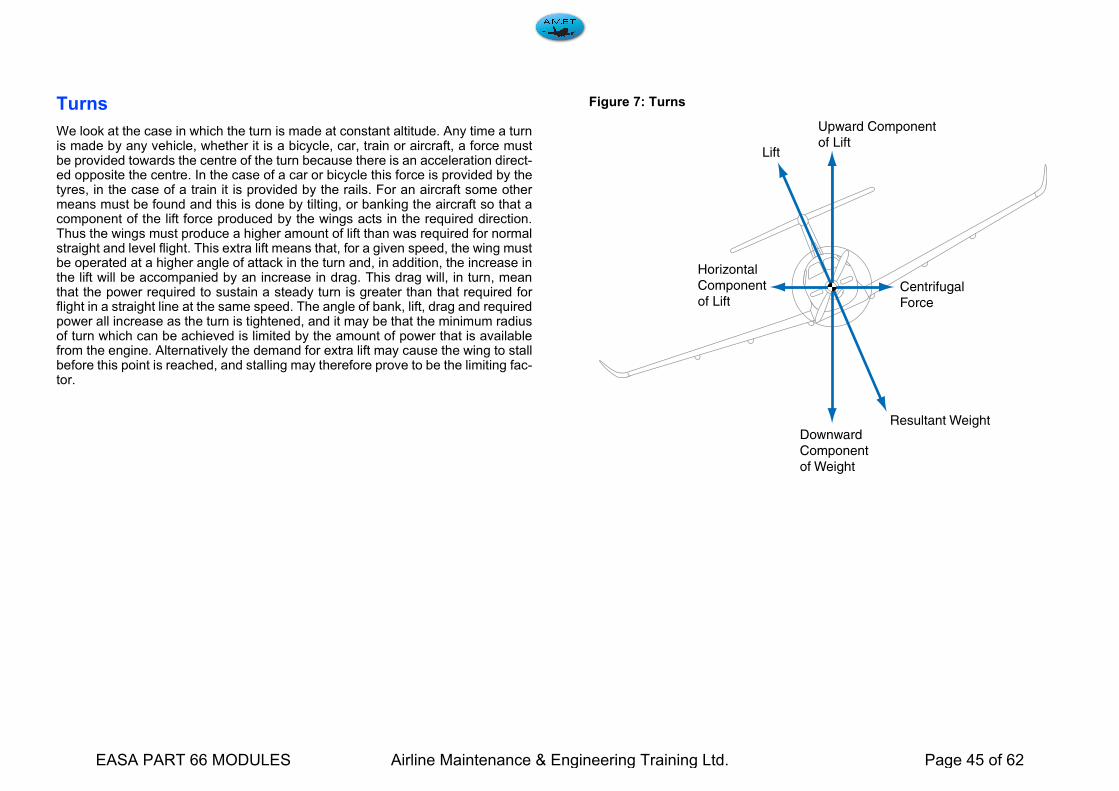
Turns
We look at the case in which the turn is made at constant altitude. Any time a turnis made by any vehicle, whether it is a bicycle, car, train or aircraft, a force mustbe provided towards the centre of the turn because there is an acceleration direct-ed opposite the centre. In the case of a car or bicycle this force is provided by thetyres, in the case of a train it is provided by the rails. For an aircraft some othermeans must be found and this is done by tilting, or banking the aircraft so that acomponent of the lift force produced by the wings acts in the required direction.Thus the wings must produce a higher amount of lift than was required for normalstraight and level flight. This extra lift means that, for a given speed, the wing mustbe operated at a higher angle of attack in the turn and, in addition, the increase inthe lift will be accompanied by an increase in drag. This drag will, in turn, meanthat the power required to sustain a steady turn is greater than that required forflight in a straight line at the same speed. The angle of bank, lift, drag and requiredpower all increase as the turn is tightened, and it may be that the minimum radiusof turn which can be achieved is limited by the amount of power that is availablefrom the engine. Alternatively the demand for extra lift may cause the wing to stallbefore this point is reached, and stalling may therefore prove to be the limiting fac-tor.
Figure 7: Turns
Upward Componentof Lift
Lift
HorizontalComponentof Lift
DownwardComponentof Weight
Resultant Weight
CentrifugalForce
EASA PART 66 MODULES Airline Maintenance & Engineering Training Ltd. Page 45 of 62
Wing Loading
This is the all up weight of the aircraft divided by the wing area, i.e. the amount ofthe total weight carried by unit area of the wing. It is usually given in kg/m2.
Load Factor
The load factor is the ratio of the weight of the aircraft to the load imposed duringa manoeuvre.
The load factor will change any time that the aircraft carries out a manoeuvre. Thisis because in straight and level flight at constant speed the aircraft is subject to 1g,any change to straight and level flight will change the G forces and therefore theload factor.
Effect of Weight (Wing Loading) on the Stall
Consider a wing which is producing sufficient lift to support a stated weight and isflying just below the stalling angle. If additional weight is placed on the wing thenew weight is greater than the lift and level flight is no longer possible under thesame conditions.To maintain level flight more lift must be produced and this canbe done by increasing either the angle of attack or the speed. Because the angleof attack in the example, is almost at the stall, this cannot be increased without los-ing lift. It is therefore necessary to increase the speed to some higher figure untilthe lift again equals the weight. Therefore, although the angle of attack is still un-changed at a figure on the verge of the stall, the corresponding speed, i.e. the stall-ing speed is higher than the speed necessary at a lower wing loading.
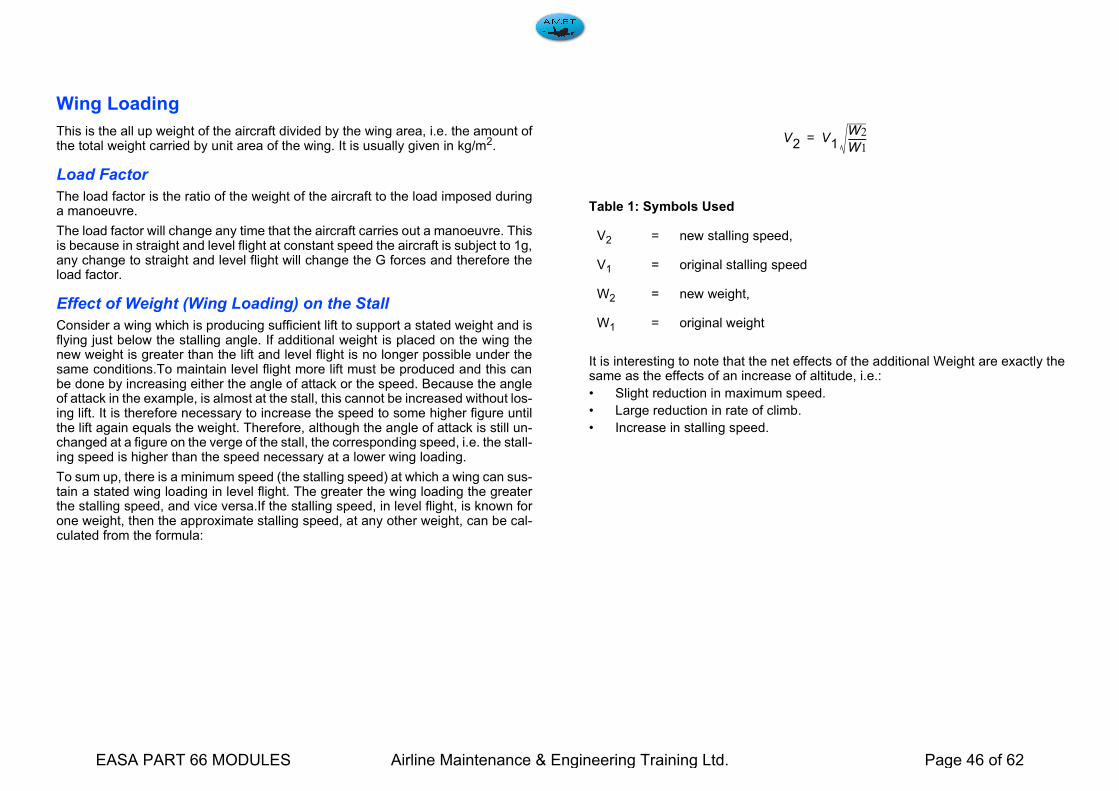
To sum up, there is a minimum speed (the stalling speed) at which a wing can sus-tain a stated wing loading in level flight. The greater the wing loading the greaterthe stalling speed, and vice versa.If the stalling speed, in level flight, is known forone weight, then the approximate stalling speed, at any other weight, can be cal-culated from the formula:
It is interesting to note that the net effects of the additional Weight are exactly thesame as the effects of an increase of altitude, i.e.:
• Slight reduction in maximum speed.
• Large reduction in rate of climb.
• Increase in stalling speed.
Table 1: Symbols Used
V2 = new stalling speed,
V1 = original stalling speed
W2 = new weight,
W1 = original weight
V2 V1W2
W1---------=
EASA PART 66 MODULES Airline Maintenance & Engineering Training Ltd. Page 46 of 62

Lift Augmentation (High-Lift Devices)
High lift devices are used to provide extra lift when the aircraft is at low airspeedsand or high angles of attack. i.e. take off and landing. This is accomplished bychanging the coefficient of lift and / or the wing area.
The main methods to achieve these changes are:
• Wing leading edge slots
• Wing leading edge slats
• Wing trailing edge flaps
The various types of high lift devices are discussed inSub Module 11.1.1 "Aerodynamics and Flight Controls". The purpose of most ofthem is the same: to increase the camber and or the wing surface of the wing soit can operate with a higher angle of attack without the airflow over the top surfacebecoming turbulent and breaking away.
Figure 8: Air Flow through High Lift Devices
Figure 9: Effects of Flaps and Slats.
When the flaps/slats are lowered and the camber is increased, both the lift and thedrag are increased. Most flap/slat installations are designed in such a way that thefirst half of flap/slat extension increases the lift more than the drag, and partialflaps/slats are used for takeoff. Lowering the flaps/slats all the way increases thedrag more than the lift, and full flaps are used for landing.
Wing FlapSlat
Retracted Position
Intermediate Position(Take Off or Approach)
Full Extend(Final Approach)
EASA PART 66 MODULES Airline Maintenance & Engineering Training Ltd. Page 47 of 62

Effect of Slats
When a small auxiliary aerofoil slat of highly cambered section is fixed to the lead-ing edge of a wing along the complete span and adjusted so that a suitable slot isformed between the two, the CL max is increased by as much as 70 percent andmore. At the same time, the stalling angle is increased by some 10 degrees. Thegraph in Figure 9 on page 11 shows the comparative figures for a slatted andunslatted wing of the same basic dimensions.The effect of the slat is to prolong thelift curve by delaying the stall until a higher angle of attack. When operating, at highangles of attack the slat itself is generating a high lift coefficient because of itsmarked camber. The action of the slat is to flatten the marked peak of the low-pres-sure envelope at high angles of attack and to change it to one with a more gradualpressure gradient. The flattening of the lift envelope means that the boundary layerdoes not undergo the sudden thickening that occurred through having to negotiatethe very steep gradient that existed immediately behind the former suction peakand so retains much of its energy thus enabling it to penetrate almost the full chordof the wing before separating. The graph below shows the alleviating effect of theslat on the low pressure peak and that, although flatter, the area of the low pres-sure region, which is proportional to its strength is unchanged, or even increased.The passage of the boundary layer over the wing is assisted by the fact that theair flowing through the slot is speeded up by the venturi effect thus adding to thekinetic energy of the boundary layer and so helping it to penetrate further againstthe adverse gradient.
As shown previously, the slat delays separation until an angle of about 25 degreesto 28 degrees is reached during which time the lift coefficient has risen steadily,finally reaching a peak considerably greater than that of an unslatted wing. Assum-ing that the CL max of the wing is increased by, say 70 percent, it is evident thatthe stalling speed at a slated wing loading can be much reduced; for example, ifan unslatted wing stalls at a speed of about 100 knots its fully slatted counterpartwould stall at about 80 knots. The exact amount of the reduction achieved de-pends on the length of the leading edge covered by the slat and the chord of theslat.
Effect of Flap on the Stalling Angle
When the trailing edge flap is lowered the angle of attack for level flight under theprevailing conditions is reduced. For each increasing flap angle there is a fixed andlower stalling angle of attack. The lower stalling angle is caused through thechange in the aerofoil section when the flap is lowered.
Effect of Flap on the Lift / Drag Ratio
Lowering the flaps produces an increase in the lift coefficient at a given speed butat the same time the greater camber also causes an increase in the total drag.Itcan be stated that when the flaps are lowered to a given angle the lift / drag ratiois always reduced. The best lift / drag ratio with the flaps lowered is obtained withthe flap at some angle between 15° and 35°, the exact angle depending principallyon the aerofoil section used and the type of flap employed and its area.
For a typical trailing edge flap, as soon as the flap starts to lower, the lift and dragstart increasing. For about the first third of range there is a steady rise in the CLand this continues to increase at a reduced rate, and during the final part of themovement a further very small increase occurs.
In conjunction with the lift, the drag also increases, but the rate of increase duringthe first third of range is small compared with that which takes place during the re-mainder of the movement, the final third of range producing very rapid increase inthe rate at which the drag has been rising. Since the flap is basically a means ofincreasing lift, the maximum angle rarely exceeds about 60°.
For landings, the high drag of the fully lowered flap is useful since it permits asteeper approach without the speed becoming excessive (i.e. it has the effect ofan airbrake). The increased lift enables a lower approach speed to be used andthe decreased stalling speed means that the touch down is made at lower speed.The high drag has another advantage in that it causes a rapid deceleration duringthe period of float after rounding out and before touching down.
EASA PART 66 MODULES Airline Maintenance & Engineering Training Ltd. Page 48 of 62

8.4 Flight Stability
EASA PART 66 MODULES Airline Maintenance & Engineering Training Ltd. Page 49 of 62

Flight Stability and Dynamics
The stability of an aircraft means its ability of return to some particular condition offlight (after having been slightly disturbed from that condition) without any effortson the part of the pilot.
An aircraft may be stable under some conditions of flight and unstable under otherconditions. Control means the power of the pilot to manoeuvre the aircraft into anydesired position.
As already stated, an aircraft which, when disturbed, tends to return to its originalposition is said to be stable. If on the other hand, it tends to move farther away fromthe original position, it is unstable.
But it may tend to do neither of these and prefer to remain in its new position. Thisis called neutral stability, and is sometimes a very desirable feature.
Static Stability
This means that when disturbed from its flight path, forces will be activated whichwill initially tend to return the aircraft to its original position.
The returning forces may be so great that the aircraft will pass beyond the originalposition and continue in that direction until stability again tries to restore the aircraftinto its original position. This will continue with the oscillations either side of theoriginal becoming larger.
Figure 1: Static Stability
Equilibrium
Tendenciy to returnto equilibrium
Neutral
Tendency to continuein displacement direction
Equilibrium
Negative
Equilibrium encounteredat any point of displacement
Positive
EASA PART 66 MODULES Airline Maintenance & Engineering Training Ltd. Page 50 of 62
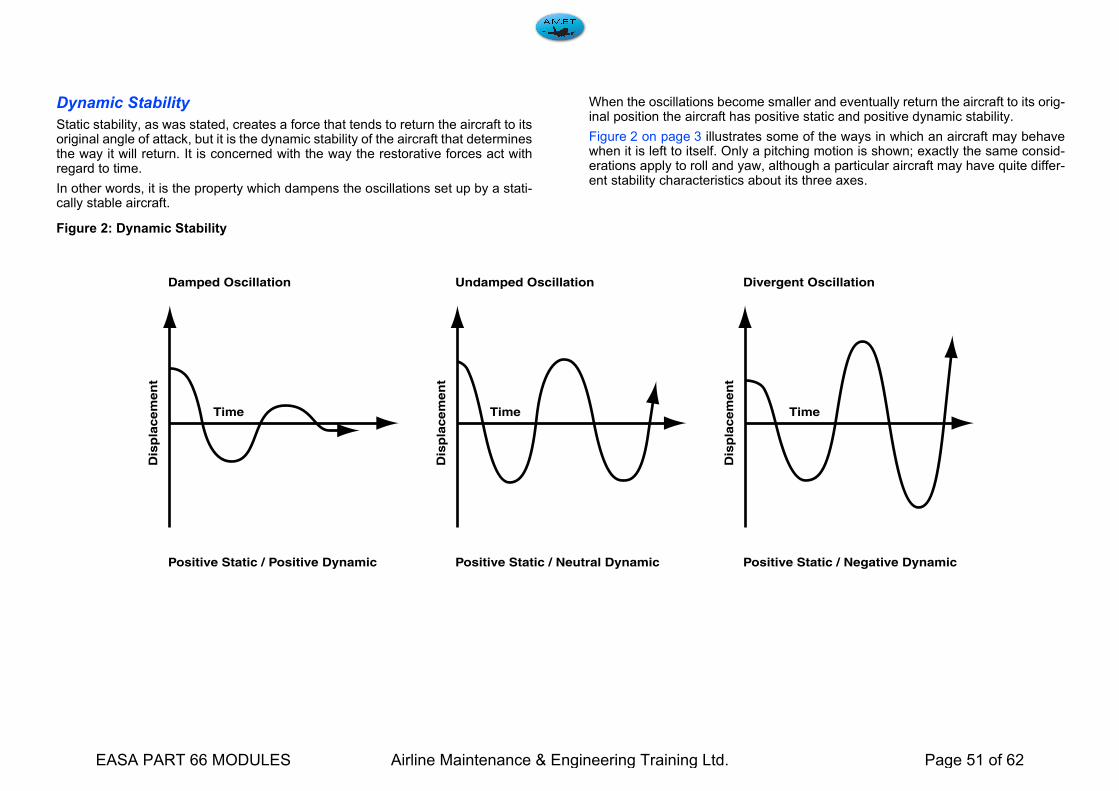
Dynamic Stability
Static stability, as was stated, creates a force that tends to return the aircraft to itsoriginal angle of attack, but it is the dynamic stability of the aircraft that determinesthe way it will return. It is concerned with the way the restorative forces act withregard to time.
In other words, it is the property which dampens the oscillations set up by a stati-cally stable aircraft.
When the oscillations become smaller and eventually return the aircraft to its orig-inal position the aircraft has positive static and positive dynamic stability.
Figure 2 on page 3 illustrates some of the ways in which an aircraft may behavewhen it is left to itself. Only a pitching motion is shown; exactly the same consid-erations apply to roll and yaw, although a particular aircraft may have quite differ-ent stability characteristics about its three axes.
Figure 2: Dynamic Stability
Damped Oscillation Undamped Oscillation Divergent Oscillation
Time Time Time
Dis
pla
cem
en
t
Dis
pla
cem
en
t
Dis
pla
cem
en
t
Positive Static / Positive Dynamic Positive Static / Neutral Dynamic Positive Static / Negative Dynamic
EASA PART 66 MODULES Airline Maintenance & Engineering Training Ltd. Page 51 of 62
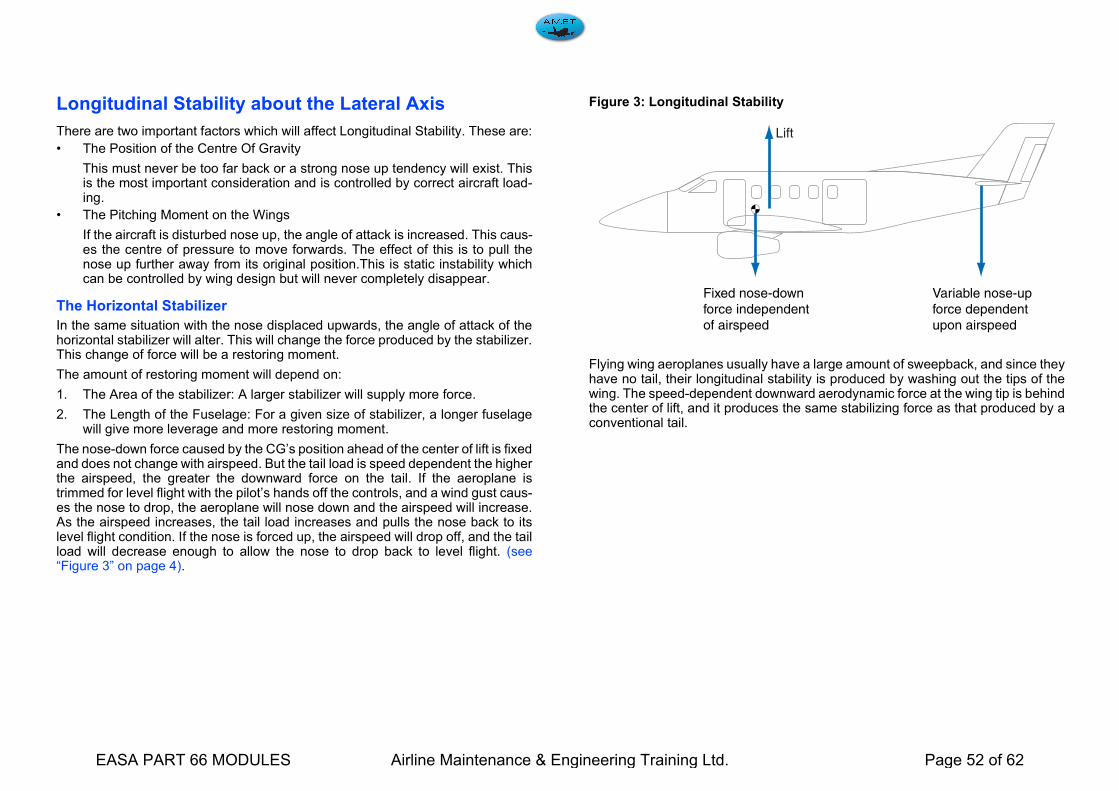
Longitudinal Stability about the Lateral Axis
There are two important factors which will affect Longitudinal Stability. These are:
• The Position of the Centre Of Gravity
This must never be too far back or a strong nose up tendency will exist. Thisis the most important consideration and is controlled by correct aircraft load-ing.
• The Pitching Moment on the Wings
If the aircraft is disturbed nose up, the angle of attack is increased. This caus-es the centre of pressure to move forwards. The effect of this is to pull thenose up further away from its original position.This is static instability whichcan be controlled by wing design but will never completely disappear.
The Horizontal Stabilizer
In the same situation with the nose displaced upwards, the angle of attack of thehorizontal stabilizer will alter. This will change the force produced by the stabilizer.This change of force will be a restoring moment.
The amount of restoring moment will depend on:
1. The Area of the stabilizer: A larger stabilizer will supply more force.
2. The Length of the Fuselage: For a given size of stabilizer, a longer fuselagewill give more leverage and more restoring moment.
The nose-down force caused by the CG’s position ahead of the center of lift is fixedand does not change with airspeed. But the tail load is speed dependent the higherthe airspeed, the greater the downward force on the tail. If the aeroplane istrimmed for level flight with the pilot’s hands off the controls, and a wind gust caus-es the nose to drop, the aeroplane will nose down and the airspeed will increase.As the airspeed increases, the tail load increases and pulls the nose back to itslevel flight condition. If the nose is forced up, the airspeed will drop off, and the tailload will decrease enough to allow the nose to drop back to level flight. (see“Figure 3” on page 4).
Figure 3: Longitudinal Stability
Flying wing aeroplanes usually have a large amount of sweepback, and since theyhave no tail, their longitudinal stability is produced by washing out the tips of thewing. The speed-dependent downward aerodynamic force at the wing tip is behindthe center of lift, and it produces the same stabilizing force as that produced by aconventional tail.
Lift
Fixed nose-downforce independentof airspeed
Variable nose-upforce dependentupon airspeed
EASA PART 66 MODULES Airline Maintenance & Engineering Training Ltd. Page 52 of 62
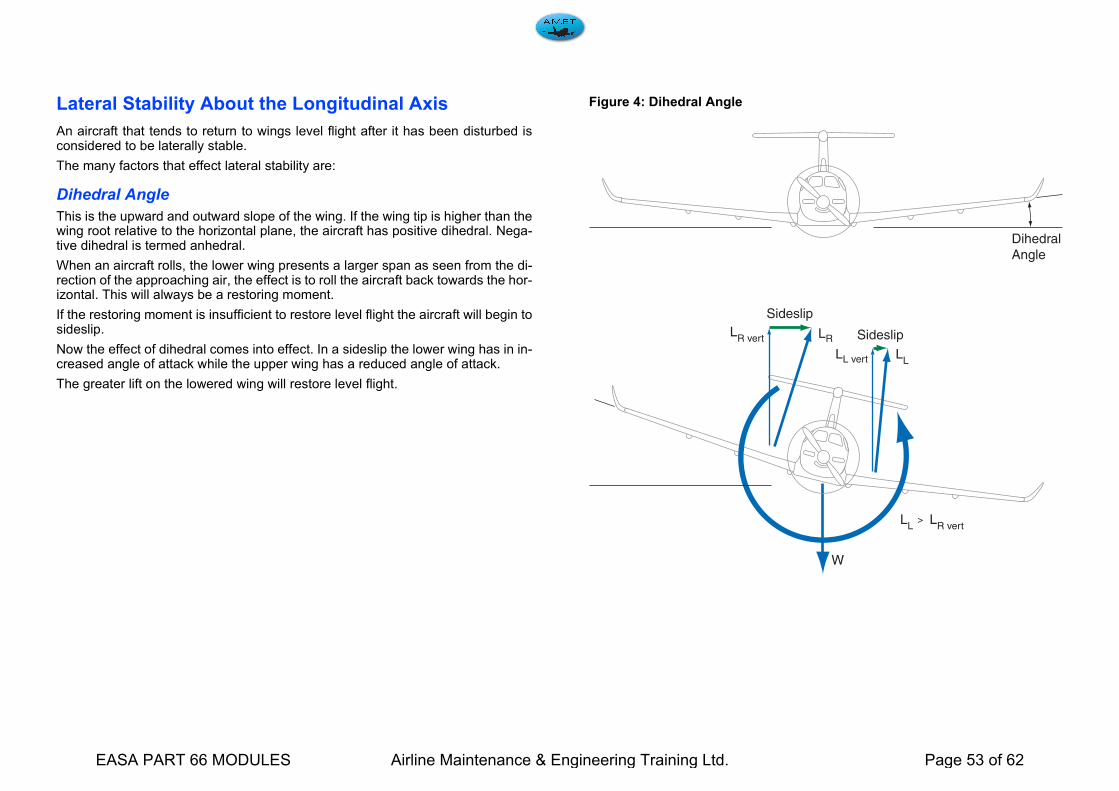
Lateral Stability About the Longitudinal Axis
An aircraft that tends to return to wings level flight after it has been disturbed isconsidered to be laterally stable.
The many factors that effect lateral stability are:
Dihedral Angle
This is the upward and outward slope of the wing. If the wing tip is higher than thewing root relative to the horizontal plane, the aircraft has positive dihedral. Nega-tive dihedral is termed anhedral.
When an aircraft rolls, the lower wing presents a larger span as seen from the di-rection of the approaching air, the effect is to roll the aircraft back towards the hor-izontal. This will always be a restoring moment.
If the restoring moment is insufficient to restore level flight the aircraft will begin tosideslip.
Now the effect of dihedral comes into effect. In a sideslip the lower wing has in in-creased angle of attack while the upper wing has a reduced angle of attack.
The greater lift on the lowered wing will restore level flight.
Figure 4: Dihedral Angle
DihedralAngle
Sideslip
Sideslip
W
LL
LRLR vert
LL vert
LL LR vert>
EASA PART 66 MODULES Airline Maintenance & Engineering Training Ltd. Page 53 of 62

Sweepback
Sweepback Angle is the angle at which the wing points backwards from the rootto the tip.
Sweepback is used mainly on high-speed aircraft and its primary purpose is to de-lay the formation of sonic shock waves which are produced at high speeds andcause a large increase in drag.
The secondary effect of sweepback is to improve lateral stability. When a side-slipoccurs, the lower wing presents a larger span as seen from the direction of the ap-proaching air, and as with dihedral, the effect is to roll the aircraft back towards thehorizontal.
In general, as the sweepback angle is increased the dihedral angle will be re-duced.
Figure 5: Sweepback and Lateral Stability
Dire
ctio
n of
Mot
ion
Dire
ctio
n of
Mot
ion
due
to S
ides
lip
Sideslip
Direction of Airflow Direction of Airflow due to Sideslip
Effective
SpanEffective
Span
Higher aspect ratio and more
lift on this wing
EASA PART 66 MODULES Airline Maintenance & Engineering Training Ltd. Page 54 of 62

Keel Effect
If an aircraft begins to sideslip, all of the keel surface above the centre of gravitywill be presented to the relative airflow which will give a force to help in correctingthe roll.
Figure 6: Keel Effect
High Wings
Mounting the wings above the centre of gravity aids lateral stability because theweight of the aircraft will act as a pendulum to restore level flight.
Figure 7: Keel Effect
Center of Gravity
Line
EASA PART 66 MODULES Airline Maintenance & Engineering Training Ltd. Page 55 of 62

Directional Stability about the Vertical Axis
Directional Stability is displayed around the vertical axis and depends to a greatextent on the quality of lateral stability. If the longitudinal axis of an aircraft tendsto follow and parallel the flight pattern of the aircraft through the air, whether instraight flight or curved flight, that aircraft is considered to be directionally stable.
Directional stability is accomplished by placing a vertical stabilizer or fin to the rearof the centre of gravity on the upper portion of the tail section.
The surface of this fin acts similar to a weather vane and causes the aircraft toweathercock into the relative wind. If the aircraft is yawed out of its flight path, ei-ther by pilot action or turbulence, during straight flight or turn, the relative windwould exert a force on one side of the vertical stabilizer and return the aircraft toits original direction of flight.
Figure 8: Directional Stability
Area Forward of C.G. Area AFT of C.G.
Fuselage and Fin for Directional/Vertical Stability
Relative Wind
YAW
EASA PART 66 MODULES Airline Maintenance & Engineering Training Ltd. Page 56 of 62

Wing sweepback aids in directional stability. If the aircraft is rotated about the ver-tical axis, the aircraft will be forced sideways into the relative wind.
Because of sweepback this causes the leading wing to present more frontal areato the relative wind than the trailing wing. This increased frontal area creates moredrag, which tends to force the aircraft to return to its original direction of flight.
Figure 9: Sweepback Wings Effect on Directional Stability
Even though an aircraft has inherent stability, it does not always tend to fly straightand level. The weight of the load and its distribution affect stability. Various speedsalso affect its flight characteristics.
If the fuel in one wing tank is used before that in the other wing tank, the aircrafttends to roll toward the full tank. All of these variations require constant exertion ofpressure on the controls for correction.
While climbing or gliding, it is necessary to apply pressure on the controls to keepthe aircraft in the desired attitude.
Low Drag High Drag
CW Momentum
CG
EASA PART 66 MODULES Airline Maintenance & Engineering Training Ltd. Page 57 of 62

Interaction between Lateral and Directional Stability
The sideslip essential to lateral stability will cause an air pressure on the side sur-faces which have been provided for directional stability. The effect of this pressurewill be to turn into the relative wind, i.e. in this case, towards the direction of side-slip. The aircraft, therefore will turn off its original course and in the direction of thelower wing. The greater the directional stability the greater will be the tendency toturn off course in a sideslip. This turn will cause the raised wing, now on the outsideof the turn, to travel faster than the inner or lower wing, and therefore to obtainmore lift and so bank the aeroplane still further.
If the left wing drops and the pilot applies rudder so as to turn the aircraft to theright, he will probably prevent it from departing appreciably from its course. We cannow explain the modern technique of turning an aeroplane. Suppose, when wewant to turn left, instead of applying any rudder we simply bank the aeroplane tothe left, as we have already seen it will slip inwards and turn to the left.
So effective is this method that is has become unnecessary to use the rudder onsome aircraft for turning purposes. So far as the yaw is concerned and a turn in-volves a yaw the rudder with the help of the fin is still responsible,. The differenceis simply that the rudder and fin are brought into effect by the inward sideslip, in-stead of by application of rudder which tends to cause an outward skid. The pilotmay do nothing about it but the inherent stability of the aircraft puts a force on therudder for him.
Just: as a slight roll results in a sideslip and then a yawing motion so if an aircraftmoves in a yawed position, that is if it moves crabwise (which is really the samething as slipping or skidding) lateral stability will come into play and cause the air-craft to roll away from the leading wing. Thus a roll causes a yaw, and a yaw caus-es a roll, and the study of the two cannot be separated.
EASA PART 66 MODULES Airline Maintenance & Engineering Training Ltd. Page 58 of 62

Figure 10: Stability Interaction
If an aircraft is very stable directionally and not very stable laterally, e.g. if it haslarge fin and rudder and little or no dihedral angle. or other “dihedral effect”, it willhave a marked tendency to turn into a sideslip, and to bank at steeper and steeperangles, that it may get into an uncontrollable spiral this is sometimes called spiralinstability, but note that it is caused by too much stability (directional).
If, on the other hand, the aeroplane is very stable laterally and not very stable di-rectionally, it will sideslip without any marked tendency to turn into the sideslip.Such an aircraft is easily controllable by the rudder, and if the rudder only is usedfor a turn the aircraft will bank and make quite a nice turn. The main point to beemphasised is that too much stability (of any type) is almost as bad as too little sta-bility.
Sideslip
Wei
ght
Wei
ght
Lift LiftSideforce
on Fin
Roll
h
h = Pendulum Arm
EASA PART 66 MODULES Airline Maintenance & Engineering Training Ltd. Page 59 of 62

Dutch Roll
“Dutch Roll” is an inherent characteristic of all swept wing aircraft.
Any aircraft, straight or swept, will tend to roll as the aircraft is yawed. This is dueto the increased velocity of the forward moving wing and the decreased velocity ofthe backward moving wing.
However, swept wing aircraft, in addition to this effect while the aircraft is beingyawed, will also tend to roll even in a steady state of yaw. The reason for this isillustrated on Figure 11 on page 13.
In a straight winged aircraft with a steady yaw both wings are at an equal angle tothe incident air flow and will therefore lose lift to a slight extent equally. There isconsequently no tendency to roll with steady yaw.
A swept wing aircraft, on the other hand, in a steady state of yaw tends to continueto roll. This is due to a loss of lift on the trailing wing (due to increased effectivesweep) and an increase of lift on the forward wing due to a more direct incident airflow. (see “Figure 9” on page 9)
It follows that if a swept wing aircraft is yawed slightly. it will roll to marked degree.
The roll at first tends to create a situation of side slip, which increases the yaw. Thiscontinues until the natural stability of the aircraft and the extra drag on the leadingwing comes into effect and starts to correct the yaw. The aircraft then yaws in theother direction and consequently rolls in the other direction. This leads to an un-stable state of yawing and rolling from side to side in a corkscrew manner. Thisphenomenon is Dutch roll.
Since “Dutch Roll arises primarily from yawing of the aircraft, the rudder is the pri-mary correcting medium. The basic method of correcting Dutch Roll is to use therudder and the yaw damper works this way.
When correcting Dutch Roll” manually, however, the timing of rudder correctionsis difficult and miss - timing can accentuate the corkscrew.
The simplest method of correction is therefore to keep wings level using the ailer-ons.
If all the corrections needed to dampen out Dutch Roll were accomplished manu-ally this would put an excessive work load on the pilot. Therefore an automatic yawdamp system is required.
EASA PART 66 MODULES Airline Maintenance & Engineering Training Ltd. Page 60 of 62
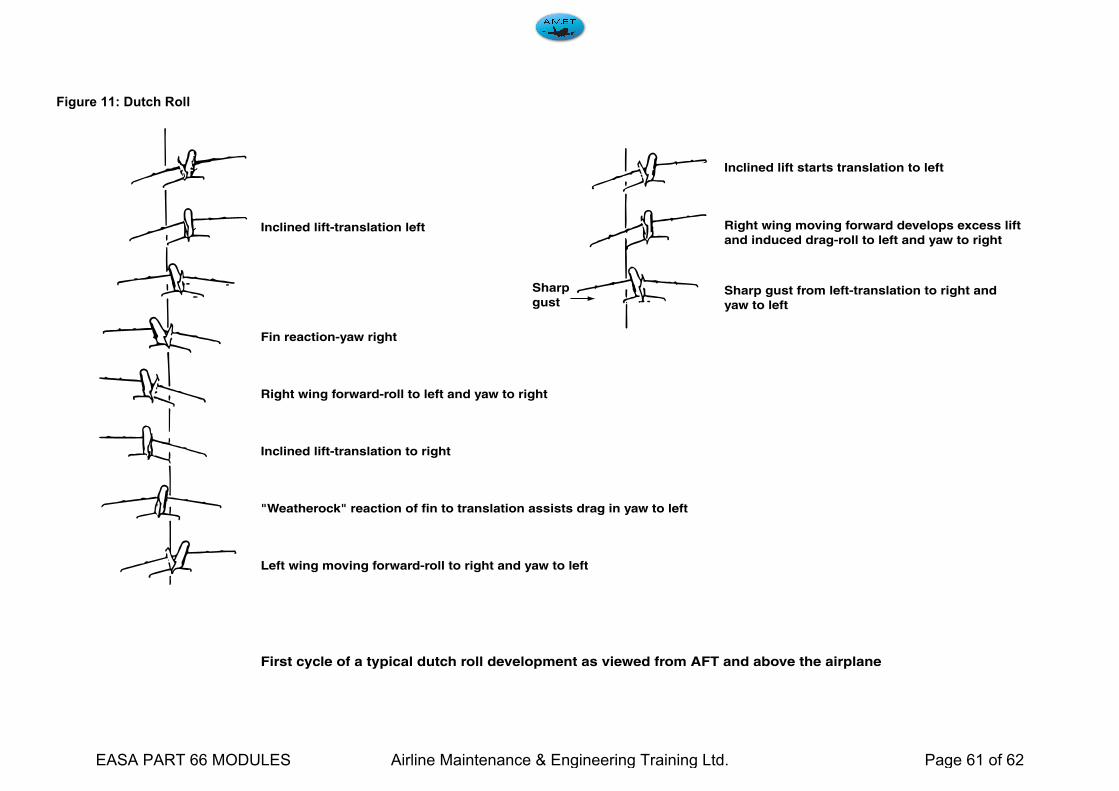
Figure 11: Dutch Roll
Inclined lift-translation left
Fin reaction-yaw right
Right wing forward-roll to left and yaw to right
Sharpgust
Inclined lift-translation to right
"Weatherock" reaction of fin to translation assists drag in yaw to left
Left wing moving forward-roll to right and yaw to left
First cycle of a typical dutch roll development as viewed from AFT and above the airplane
Inclined lift starts translation to left
Right wing moving forward develops excess liftand induced drag-roll to left and yaw to right
Sharp gust from left-translation to right andyaw to left
EASA PART 66 MODULES Airline Maintenance & Engineering Training Ltd. Page 61 of 62
Active Stability
Static stability is good for most aeroplanes, but not for highly manoeuvrable mili-tary fighter aircraft. These aircraft are designed with what is known as relaxed stat-ic stability, and have little or no static stability. The aeroplane must be flown at alltimes, an almost impossible task for the pilot. To overcome this limitation, aero-planes with relaxed static stability have sophisticated electronic stability augmen-tation systems that compensate for the lack of natural static stability.
An other example are aeroplanes that have Dutch Roll problem. These are usuallyequipped with a yaw damper, a special automatic flight control device that sensesthe Dutch roll and applies corrective rudder action to prevent or at least greatly at-tenuate it.
System Description: aircraft yaw, pitch and roll movement along with air data orinertial reference are detected by various aircraft instruments which will send sig-nals to a computer. The computer will then process the information and send a sig-nal to the rudder actuators to move the rudder to dampen yaw, thus considerablyreducing the effects of Dutch Roll. Manual operation of the rudder pedals has pri-ority over yaw damp.
EASA PART 66 MODULES Airline Maintenance & Engineering Training Ltd. Page 62 of 62