Embed Size (px)
Citation preview

1
HANTEC RESEARCH WEBINARS - TECHNICAl ANAlySIS SERIES
What is the Stochastic Oscillator?
The Stochastic Oscillator was first developed in 1957 by a group of futures traders, one of whom, George C. lane, is widely credited with its creation. lane contributed significantly to the acceptance and popularity of the stochastic oscillator as a technical indicator. The “Slow” Stochastic Oscillator came later and was publicized after 1978.
The Stochastic Oscillator compares where the price is trading relative to the range (high/low) over a given period. The basic premise is that in an uptrend, the price should be closing near the highs of the trading range, signalling upward momentum in the security. In downtrends, the price should be closing near the lows of the trading range, signalling downward momentum.
While many terms in technical analysis are imprecisely defined, and can be open to interpretation, this is not the case with the Stochastics, which are solidly defined and have rigid formulae for calculation.
l
As touched upon earlier, there are two different types of Stochastic Oscillators: Fast and Slow. The Fast Stochastic Oscillator consists of two lines:
• %K (or Main Line) = this is essentially the raw measure used to formulate the idea of momentum behind the oscillator the main Stochastics line and it displayed as a solid line.
• %D (or Signal Line) = this is simply a moving average of the %K, it is sometimes called the Signal line, and is displayed as a dotted line.
However, the Fast Stochastics can be quite volatile, so traders will often use the Slow Stochastics, which is an extension of the relationship but is designed to reduce volatility. This involves replacing the Main line (%K) with %D and subsequently replacing Signal line (%D) with a moving average of %D.
INTERMEDIATE
8. Optimised Trading with Stochastics
Parameters for Slow Stochastics *
Number of periods in the range 14
Number of periods for %D calculation 3
Number of periods for Slow Stochastic %D moving average 3
Understanding Technical Momentum Indicators
Think of momentum in technical analysis as similar to throwing a ball into the air.
The velocity, or upside momentum, of the ball will begin to slow down as the ball nears its peak height. Therefore upside momentum will be declining whilst the ball is still rising and subsequently before it begins to fall.
In a similar way, in technical analysis, momentum will change direction before the price will.
* These are the accepted parameters, but these can be adjusted to meet the needs of the user.

How to read the Stochastics
The table below shows the basic interpretation of the Stochastics:
1
2
HANTEC RESEARCH WEBINARS - TECHNICAl ANAlySIS SERIES
8. Optimised Trading with Stochastics
The formulae for the calculation of Fast and Slow Stochastics are as follows:
Fast Stochastics: %K and %D
%K = 100 x (C - ln) (Hn - ln)
where C = the latest (or closing) price H = the highest closing price over the last n periods L = the lowest closing price over the last n periods
%D = 100 x H3 l3
where H3 = the 3 day sum of (C - ln) L3 = the 3 day sum of (Hn - ln)
Stochastics level Outlook
0 - 20 very bearish, but over-extended
30 - 50 and rising unwinding a bearish configuration
50 - 70 and rising increasingly bullish
80 - 100 very bullish, but over-extended
50 - 70 and falling unwinding a bullish configuration
30 - 50 and falling increasingly bearish
Slow Stochastics
Extends this relationship a step further to help smooth it
replaces the %K line with the %D line and replaces the %D line with a 3 day moving average of %D
The Stochastics are plotted within a range of zero and 100, with 50 as the neutral level. The trigger levels are added to the chart at 20 and 80. When the Stochastic lines are above 80, the price is considered to be overbought, and when the price is below 20, it is considered to be oversold.
Divergences
As with other momentum indicators, divergences can often give an early warning signal of a change in the direction of the trend. Therefore, in an uptrend, look for bearish divergences where the price continues to make higher highs, while the Stochastic lines are either in decline or making lower highs. Alternatively, in a downtrend which has the price making lower lows, a bullish divergence shows the Stochastics advancing or beginning to make higher lows.
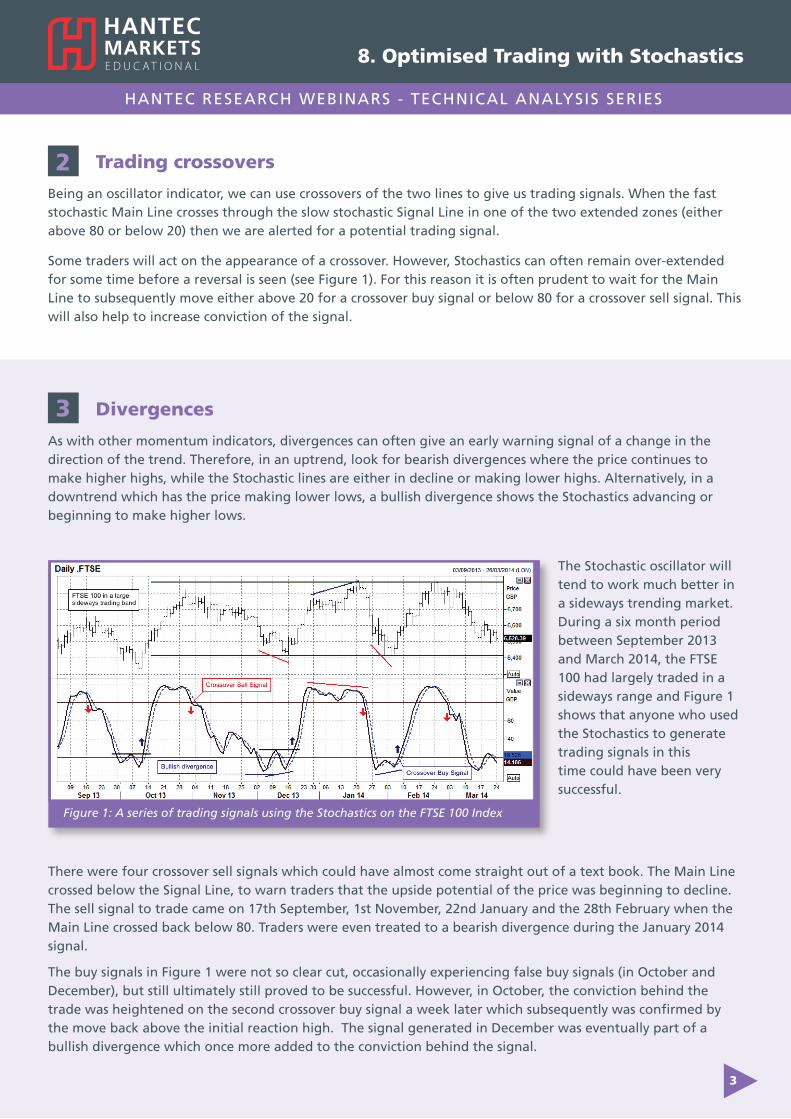
There were four crossover sell signals which could have almost come straight out of a text book. The Main line crossed below the Signal line, to warn traders that the upside potential of the price was beginning to decline. The sell signal to trade came on 17th September, 1st November, 22nd January and the 28th February when the Main line crossed back below 80. Traders were even treated to a bearish divergence during the January 2014 signal.
The buy signals in Figure 1 were not so clear cut, occasionally experiencing false buy signals (in October and December), but still ultimately still proved to be successful. However, in October, the conviction behind the trade was heightened on the second crossover buy signal a week later which subsequently was confirmed by the move back above the initial reaction high. The signal generated in December was eventually part of a bullish divergence which once more added to the conviction behind the signal.
The Stochastic oscillator will tend to work much better in a sideways trending market. During a six month period between September 2013 and March 2014, the FTSE 100 had largely traded in a sideways range and Figure 1 shows that anyone who used the Stochastics to generate trading signals in this time could have been very successful.
3
3
HANTEC RESEARCH WEBINARS - TECHNICAl ANAlySIS SERIES
8. Optimised Trading with Stochastics
Trading crossovers
Being an oscillator indicator, we can use crossovers of the two lines to give us trading signals. When the fast stochastic Main line crosses through the slow stochastic Signal line in one of the two extended zones (either above 80 or below 20) then we are alerted for a potential trading signal.
Some traders will act on the appearance of a crossover. However, Stochastics can often remain over-extended for some time before a reversal is seen (see Figure 1). For this reason it is often prudent to wait for the Main line to subsequently move either above 20 for a crossover buy signal or below 80 for a crossover sell signal. This will also help to increase conviction of the signal.
2
Figure 1: A series of trading signals using the Stochastics on the FTSE 100 Index

Figure 4: Range trading using the Bollinger Bands on Silver
Risk Warning for Educational Material
This document is issued by Hantec Markets limited, who is authorised and regulated by the Financial Conduct Authority (FCA) in the UK, No. 502635. The document is prepared and distributed for information and education purposes only. Trading in Foreign Exchange (FX), Bullion and Contracts for Differences (CFDs) is not suitable for all investors due to the high risk nature of these products. Forex, Bullion and CFDs are leveraged products that can result in losses greater than your initial deposit. The value of an FX, Bullion or CFD position may be affected by a variety of factors, including but not limited to, price volatility, market volume, foreign exchange rates and liquidity. you may lose your entire initial stake and you may be required to make additional payments. Please ensure you fully understand the risks involved, seeking independent advice if necessary prior to entering into such transactions. Before deciding to enter into FX, Bullion and/or CFD trading, you should carefully consider your investment objectives, level of experience, and risk appetite. you should only invest in FX, Bullion and/or CFD trading with funds you are prepared to lose entirely. Therefore, only your excess funds should be placed at risk and anyone who does not have such excess funds should completely refrain from engaging in FX and/or CFD trading. Do not rely on past performance figures. If you are in any doubt, please seek further independent advice. This document does not constitute personal investment advice, nor does it take into account the individual financial circumstances or objectives of the clients who receive it. All information and research produced by Hantec Markets is intended to be general in nature; it does not constitute a recommendation or offer for the purchase or sale of any financial instrument, nor should it be construed as such. All of the views or suggestions within this document are those solely and exclusively of the author, and accurately reflect his personal views about any and all of the subject instruments and are presented to the best of the author’s knowledge. Any person relying on this document to undertake trading does so entirely at his/her own risk and Hantec Markets does not accept any liability.
T: +44 (0) 20 7036 0888 │| F: +44 (0) 20 7036 0899 |│ E: [email protected] │| W: hantecfx.com
Hantec House, 12-14 Wilfred Street, london SW1E 6PlT: +44 (0) 20 7036 0888F: +44 (0) 20 7036 0899E: [email protected]
W: hantecfx.com
Trust Through Transparency
HANTEC RESEARCH WEBINARS - TECHNICAl ANAlySIS SERIES