Embed Size (px)
Citation preview

8. Hypotheses 8.4 Two more things
K. Desch – Statistical methods of data analysis SS10
Inclusion of systematic errors
LHR methods needs a prediction (from MC simulation) for the expected numbers of s and b in each bin („channel“)
Statistical p.d.f.´s for these numbers are poissonian (or gaussian, if large)
Prediction of s and b also have systematic uncertainties
- finite MC statistics- theoretical uncertainties in production cross section- uncertainties from detector efficiencies and acceptances- uncertainty in integrated luminosity- …
some of these uncertainties can be correlated between channelstough job: determine these systematic uncertainties
statistical procedure: convolute the (estimated) p.d.f.´s for systematics(usually assumed gaussian) with the poissonians statistical p.d.f.´s

8. Hypotheses 8.4 Two more things
K. Desch – Statistical methods of data analysis SS10
(rather) easy-to-use root class
Tlimit()
public: TLimit() TLimit(const TLimit&) virtual ~TLimit() static TClass* Class() static TConfidenceLevel* ComputeLimit(TLimitDataSource* data, Int_t nmc = 50000,
bool stat = false, TRandom* generator = 0) static TConfidenceLevel* ComputeLimit(Double_t s, Double_t b, Int_t d,
Int_t nmc = 50000, bool stat = false, TRandom* generator = 0) static TConfidenceLevel* ComputeLimit(TH1* s, TH1* b, TH1* d, Int_t nmc = 50000,
bool stat = false, TRandom* generator = 0) static TConfidenceLevel* ComputeLimit(Double_t s, Double_t b, Int_t d, TVectorD* se,
TVectorD* be, TObjArray*, Int_t nmc = 50000, bool stat = false, TRandom* generator = 0)
static TConfidenceLevel* ComputeLimit(TH1* s, TH1* b, TH1* d, TVectorD* se, TVectorD* be, TObjArray*, Int_t nmc = 50000, bool stat = false, TRandom* generator = 0)
only needs vectors of signal, background, observed data (and their errors)and computes (e.g.) CLb, CLs+b,CLs, exptected CLb, CLs+b,CLs and much more…

8. Hypotheses 8.4 Two more things
K. Desch – Statistical methods of data analysis SS10
The „look elsewhere“ effect
The LHR test is a „either-or“ test of two hypotheses(e.g. „Higgs at 114 GeV“ or „no Higgs at 114 GeV“)
When the question of a discovery of a new particle is asked, often many „signal“ hypotheses are tested against the background hypothesissimultaneously (e.g. m=105, m=108, m=111, m=114, …)
The probability that any of these hypotheses yields a „false-positve“result is larger than the probability for a single hypothesis to be false-positiveThis is the „look elsewhere“ effect
If the probabilites are small, the 1-CLb can simply be multiplied by thenumber of different hypotheses that are tested simultaneously
In case there is continous „test mass“ in principle infinitely many hypothesesare tested – but they are correlated (excess for mtest = 114 will also causeexcess for mtest = 114.5)

8. Hypotheses 8.4 Two more things
K. Desch – Statistical methods of data analysis SS10
The „look elsewhere“ effect (ctd.)
need an „effective“ number of tested hypotheses
hard to quantify exactly
Ansatz: two hypotheses are uncorrelated if their reconstructed mass distributions do not overlap
Estimate:
effective number of hypotheses =
range of test masses / average mass resolution

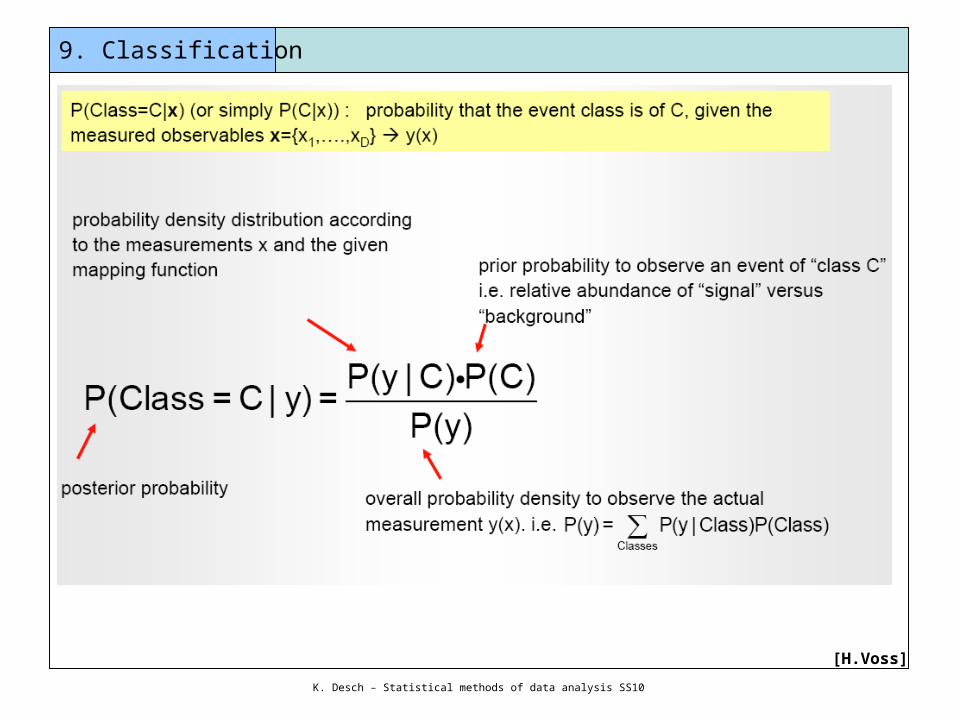
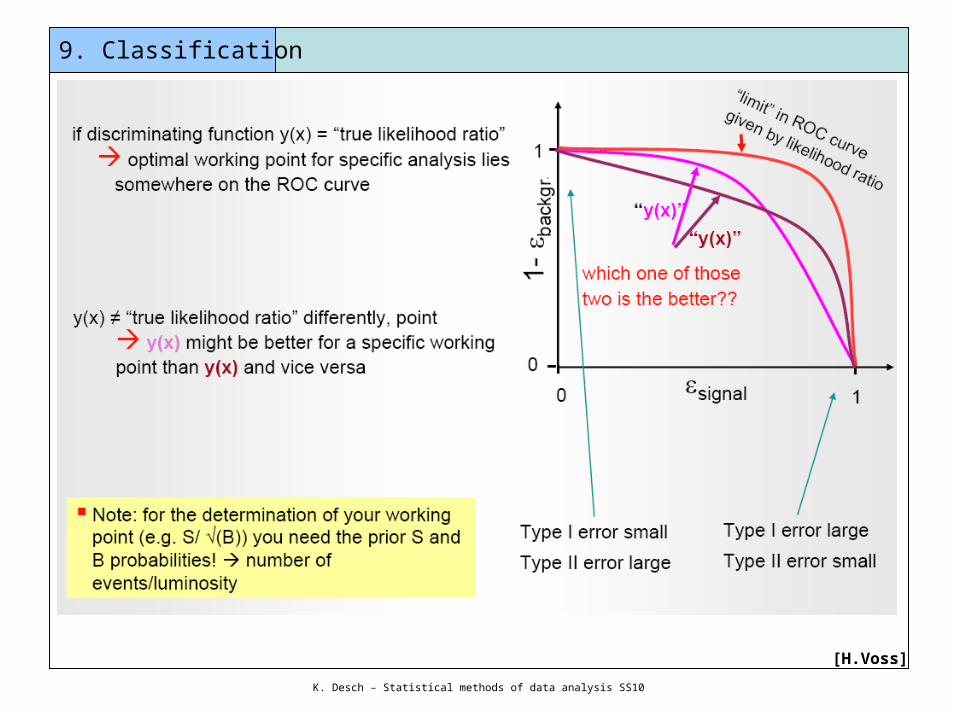
9. Classification
K. Desch – Statistical methods of data analysis SS10
Task: how to find needles in haystacks? how to enrich a sample of events with „signal-like“ events?
Why is it important?
Only one out of 1011 LHC eventscontains a Higgs (decay) if it exists.
Existence („discovery“)can only be shown if a statistically significant excess can be extractedfrom the data
Most particle physics analysesrequire separation of a signal frombackground(s) based on a set of discriminating variables

9. Classification
K. Desch – Statistical methods of data analysis SS10
Different types of input information (discriminating variables) multivariate analysis
Combine these variables to extract the maximum of discriminating powerbetween signal and background
• Kinematic variables (masses, momenta, decay angles, …)
• Event properties (jet/lepton multiplicity, sum of charges, …)
• Event shape (sphericity, …)
• Detector response (silicon hits, dE/dx, Cherenkov angle, shower profiles, …)
• etc.

9. Classification
K. Desch – Statistical methods of data analysis SS10
We have found discriminating input variables x1, x2, …
What decision boundary should we use to select events of type H1 ?
Suppose data sample with two types of events: H0, H1
Linear boundary Nonlinear boundary(ies)Rectangular cuts
H1
H0
x1
x2 H1
H0
x1
x2 H1
H0
x1
x2

9. Classification
K. Desch – Statistical methods of data analysis SS10
[H.Voss]

9. Classification
K. Desch – Statistical methods of data analysis SS10
[H.Voss]
9. Classification
K. Desch – Statistical methods of data analysis SS10
[H.Voss]

9. Classification
K. Desch – Statistical methods of data analysis SS10
[H.Voss]

9. Classification
K. Desch – Statistical methods of data analysis SS10
[H.Voss]
9. Classification
K. Desch – Statistical methods of data analysis SS10
[H.Voss]

9. Classification
K. Desch – Statistical methods of data analysis SS10
[H.Voss]

9. Classification MVA algorithms
K. Desch – Statistical methods of data analysis SS10
Finding the optimal Multivariate Analysis (MVA) algorithm is not trivialLarge variety of different algorithms exist

9. Classification (Projective) Likelihood-Selection
K. Desch – Statistical methods of data analysis SS10
[H.Voss]

9. Classification (Projective) Likelihood-Selection
K. Desch – Statistical methods of data analysis SS10
[H.Voss]