Embed Size (px)
Citation preview
2014
The Judicial Businessof theUnited States Courtsof theSeventh Circuit

Report on the Business of the Federal Courts of the Seventh CircuitFor the Twelve Month Period From January 1, 2014 to December 31, 2014
The following annual report is submitted to the 64 annual joint meeting of the Judicial Conference of theth
Seventh Circuit and the Seventh Circuit Bar Association held on May 3 through May 5, 2015 at the Pfister Hotel in
Milwaukee, WI. This report is a collection of statistical data from every court of the circuit and national comparison
data for the Circuit Courts of Appeal.
There are a number of people responsible for the collection and assembly of the data contained in these
pages. Ms. Catherine J. Whitaker and members of the Statistics Division of the Administrative Office were helpful.
We thank them for their hard work, professional service and good advice. Also, thanks to Mr. Christopher Conway,
Mrs. Jeanette King, Ms. Asia Brown and Ms. Jane Oberheide of the Court of Appeals. This data is available on the
Court of Appeals web page at: www.ca7.uscourts.gov.
This report shows that the federal courts of the Seventh Circuit continue to be busy and productive.
Respectfully submitted,
Gino J. Agnello
Clerk, U.S. Court of Appealsfor the Seventh Circuit

COURT OF APPEALSFOR THE
SEVENTH CIRCUIT TABLES

Table 1
Year Filed Percent of Change Terminated Percent of Change
2000 3,419 -0.4 3,804 19.4
2001 3,447 0.8 3,523 -7.4
2002 3,466 0.6 3,333 -5.4
2003 3,418 -1.4 3,275 -1.7
2004 3,399 -0.6 3,349 2.3
2005 3,926 15.5 3,750 12.0
2006 3,518 -10.4 3,839 2.4
2007 3,151 -10.4 3,078 -19.8
2008 3,409 8.2 3,301 7.2
2009 3,245 -4.8 3,468 5.1
2010 3,098 -4.5 3,336 -3.8
2011 3,005 -3.0 2,987 -10.5
2012 3,031 0.9 3,010 0.8
2013 2,992 -1.3 3,034 0.8
2014 2,917 -2.5 3,023 -0.4
AVG.(91-00) 3,243 1.8 3,283 4.0
AVG.(01-10) 3,409 -1.2 3,460 2.2
AVG.(11-14) 2,986 -1.5 3,014 -2.3
NOTE: This table does not include data for the U.S. Court of Appeals for the Federal Circuit. Beginning in March 2014, data include miscellaneous cases not included previously
¹ Percent change not computed when fewer than 10 cases reported for the previous period.
² Revised.
Appeals Commenced and Terminated During the Twelve Month Periods Ended December 31, 2000 Through 2014
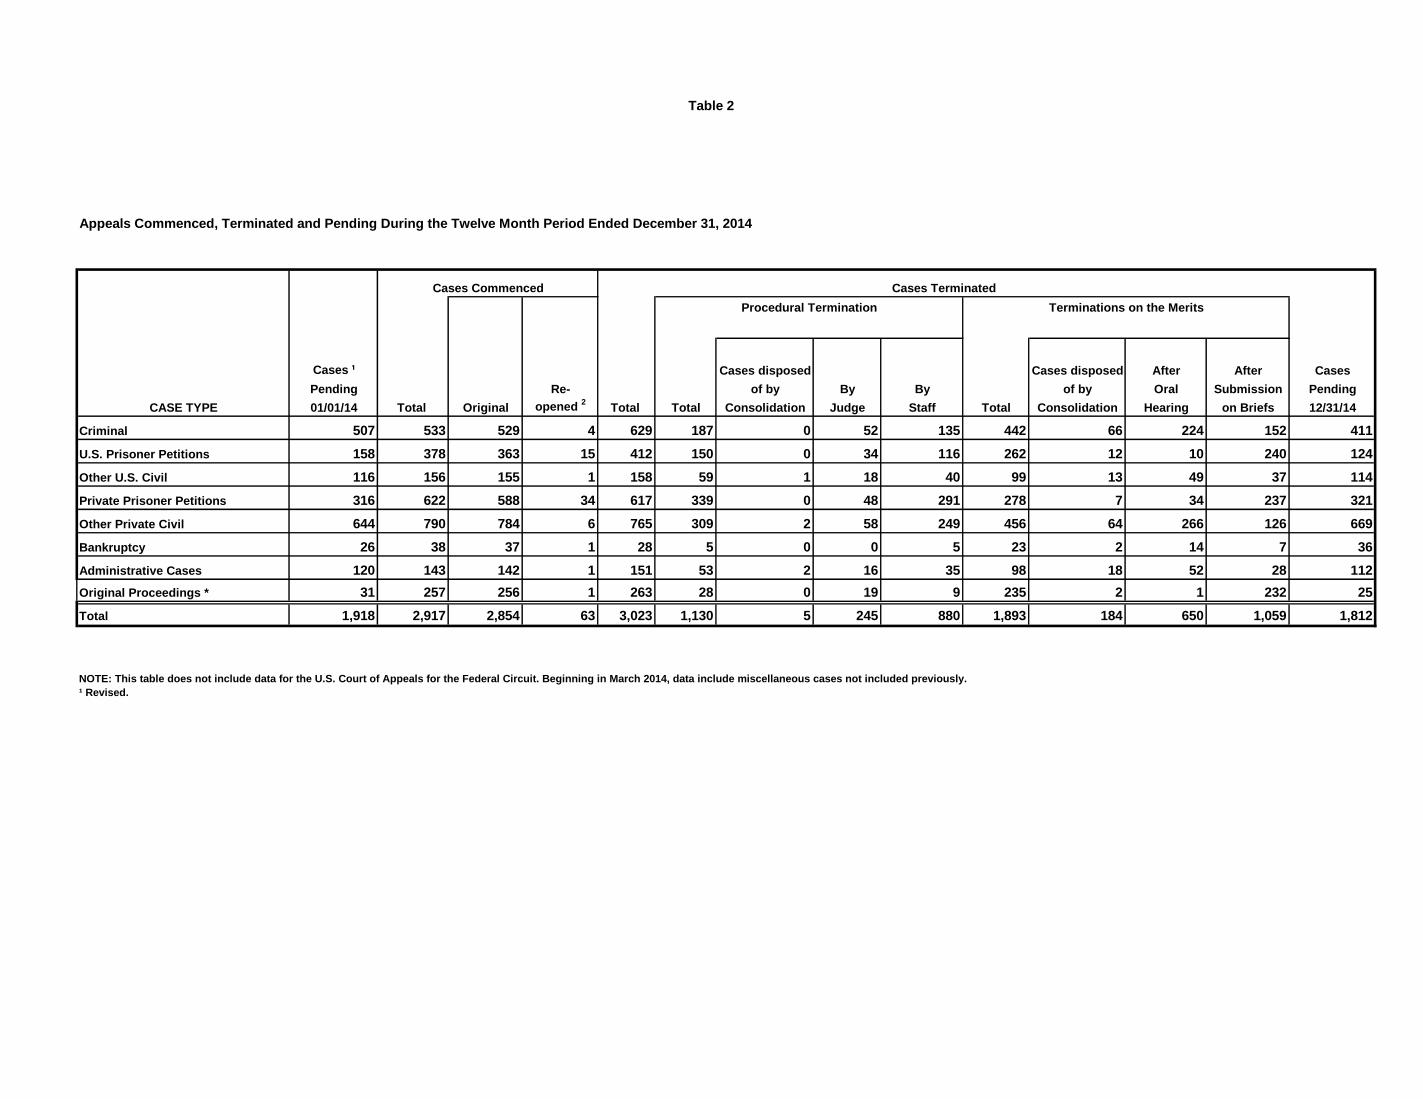
Table 2
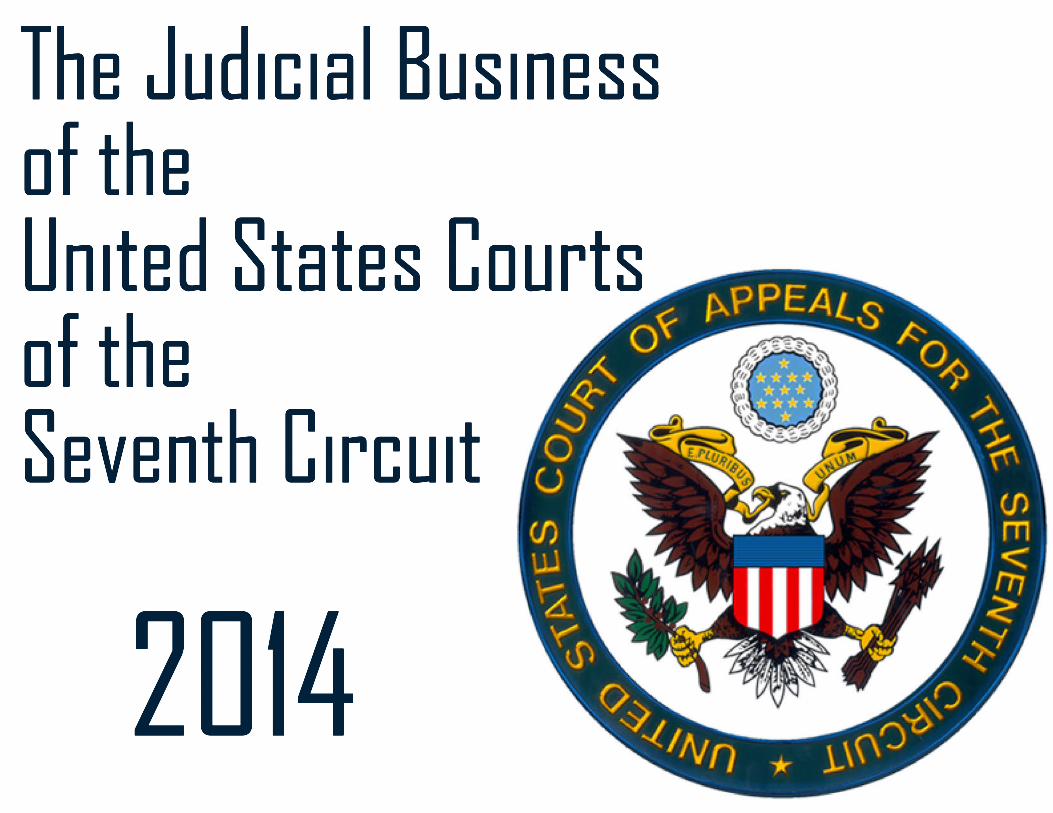
Cases ¹ Cases disposed Cases disposed After After Cases
Pending Re- of by By By of by Oral Submission Pending
CASE TYPE 01/01/14 Total Original opened 2
Total Total Consolidation Judge Staff Total Consolidation Hearing on Briefs 12/31/14
Criminal 507 533 529 4 629 187 0 52 135 442 66 224 152 411
U.S. Prisoner Petitions 158 378 363 15 412 150 0 34 116 262 12 10 240 124
Other U.S. Civil 116 156 155 1 158 59 1 18 40 99 13 49 37 114
Private Prisoner Petitions 316 622 588 34 617 339 0 48 291 278 7 34 237 321
Other Private Civil 644 790 784 6 765 309 2 58 249 456 64 266 126 669
Bankruptcy 26 38 37 1 28 5 0 0 5 23 2 14 7 36
Administrative Cases 120 143 142 1 151 53 2 16 35 98 18 52 28 112
Original Proceedings * 31 257 256 1 263 28 0 19 9 235 2 1 232 25
Total 1,918 2,917 2,854 63 3,023 1,130 5 245 880 1,893 184 650 1,059 1,812
NOTE: This table does not include data for the U.S. Court of Appeals for the Federal Circuit. Beginning in March 2014, data include miscellaneous cases not included previously.
¹ Revised.
Procedural Termination Terminations on the Merits
Cases TerminatedCases Commenced
Appeals Commenced, Terminated and Pending During the Twelve Month Period Ended December 31, 2014

Table 3
Source of Appeals and Original Proceedings Commenced
for the Twelve Month Periods Ended December 31, 2010 Through 2014
Source 2010 2011 2012 2013 2014
Illinois
Northern 1,000 1,034 978 1,004 998
Central 321 313 301 316 303
Southern 261 230 240 250 259
Indiana
Northern 218 301 203 236 174
Southern 334 293 330 322 317
Wisconsin
Eastern 346 285 303 282 270
Western 203 178 185 169 158
Bankruptcy 49 41 51 38 38
Admin. Agency, Total 169 146 178 156 143
I.R.S 6 8 25 11 12
N.L.R.B. 35 11 22 15 11
B.I.A. 114 98 107 112 100
All Other
Agencies 14 29 24 18 20
Original
Proceedings 197 184 262 219 257
Total 3,098 3,005 3,031 2,992 2,917
NOTE: This table does not include data for the U. S. Court of Appeals for the Federal Circuit.
Administrative Agency cases previously reported as Imigration Service (INS) are shown under
Board of Immigration Appeals (BIA) and US Tax Court is shown under IRS.Appeals of decisions by the U.S. Tax Court are shown as Internal Revenue Service (IRS) appeals.Beginning in March 2014, data include miscellaneous cases not included previously.
Table 4
Source of Appeals in Civil and Criminal Cases from U.S. District Courts
During the Twelve Month Period Ended December 31, 2014
Appeals Filed Appeals Terminated
District Courts Total Civil Criminal Total Civil Criminal
Illinois Northern 998 770 228 978 713 265
Illinois Central 303 229 74 338 254 84
Illinois Southern 259 206 53 272 208 64
Indiana Northern 174 133 41 206 145 61
Indiana Southern 317 273 44 325 267 58
Wisconsin Eastern 270 211 59 302 232 70
Wisconsin Western 158 124 34 160 133 27
Total 2,479 1,946 533 2,581 1,952 629
NOTE: Totals include appeals reopened and remanded as well as original appeals.

Table 5
Filings Terminations Pending
Percent Percent Percent
Nature of Proceedings Number Of Total Number Of Total Number Of Total
Criminal 533 18.3 629 20.8 411 22.7
U.S. Prisoner Petitions 378 13.0 412 13.6 124 6.8
Other U.S. Civil 156 5.3 158 5.2 114 6.3
Priv. Prisoner Petitions 622 21.3 617 20.4 321 17.7
Other Private Civil 790 27.1 765 25.3 669 36.9
Bankruptcy 38 1.3 28 0.9 36 2.0
Administrative Cases 143 4.9 151 5.0 112 6.2
Original Proceedings 257 8.8 263 8.7 25 1.4
Total 2,917 100.0 3,023 100.0 1,812 100.0
NOTE: Totals include appeals reopened and remanded as well as original appeals.
Beginning in March 2014, data include miscellaneous cases not included previously.
Appeals Filed, Terminated and Pending from U.S. District Courts During the Twelve Month Period Ended December 31, 2014

Table 6
Appeals Commenced, Terminated and Pending by Nature of Suit or Offense During the Twelve Month Period Ended December 31, 2014
Nature Of Suit Or Offense Filed Terminated Pending
Total Cases 2,479 2,581 1,639
Total Criminal Cases 553 629 411
Total Civil Cases 1,946 1,952 1,228
U.S. Cases 534 570 238
U.S. Plaintiff 22 18 18
Negotiable Instruments 0 0 0Other Contract Actions 5 4 2Condemnation Of Land 0 0 0Other Real Property Actions 0 0 0Tort Actions 1 0 1Civil Rights: Employment 2 2 1 Other Civil Rights 0 0 0Forfeiture And Penalty 0 0 1Fair Labor Standards Act 0 0 0Other Labor 0 0 2Secur., Commod., & Exchg. 4 2 2Tax Suits 2 1 1All Other 8 6 8
U.S. Defendant 512 552 220
Contract Actions 4 1 4Real Property Actions 2 1 3Tort Actions 9 7 6Civil Rights: 45 40 24 Employment 11 10 7 Other Civil Rights 34 30 17Prisoner Petitions: Motions to Vacate Sentence 209 234 74 Habeas Corpus 100 108 26 Habeas Corpus - Death 3 2 1 Prisoner Civil Rights 2 3 1 Prison Condition 55 53 18 Other Prisoner Petitions 9 12 4Labor Suits 2 3 3Social Security Laws 45 48 34Tax Suits 1 2 2Environmental Matters 2 12 3Freedom of Information Act 4 3 1All Other 20 23 16
Private Cases 1,412 1,382 990

Table 6
Appeals Commenced, Terminated and Pending by Nature of Suit or Offense During the Twelve Month Period Ended December 31, 2014 [continued]
Nature Of Suit Or Offense Filed Terminated Pending
Federal Question 1,292 1,284 867
Marine Contract 2 0 2Other Contract Actions 23 17 23Employers Liability Act 1 2 1Marine Injury 0 0 0Other Tort Actions 69 76 53Antitrust 2 3 2Civil Rights: Employment 138 144 119 Other Civil Rights 249 243 184Prisoner Petitions: Habeas Corpus 259 264 129 Habeas Corpus - Death 2 0 5 Prisoner Civil Rights 9 6 9 Prison Condition 349 343 178 Other Prisoner Petitions 3 4 0Labor Mgmt. Relations Act 3 6 4Other Labor 40 43 47Copyright, Patent & Trademark 22 22 13Secur., Commod., & Exchg. 5 3 8Const. of State Stats. 12 4 11All Other 104 104 79
Diversity of Citizenship 120 98 123
Insurance 40 42 23Other Contract Actions 80 56 100Real Property Actions 0 0 0Personal Injury - Prod. Liability 0 0 0Other Personal Injury 0 0 0Personal Property Damage 0 0 0All Other 0 0 0
0 0 0
General Local Jurisdiction 0 0 0
0 0 0Contract Actions 0 0 0real Property Actions 0 0 0Tort Actions 0 0 0Prisoner Petitions 0 0 0All Other 0 0 0
Total Criminal Cases 533 629 411
Violent Offenses 41 34 35
Homicide 2 2 1 Robbery 26 22 21 Assault 2 4 1 Kidnapping 2 2 3 Racketeering - Violent Crime 9 2 9 Carjacking 0 1 0
Terrorism 0 1 0
Other Violent Offenses 0 0 0

Table 6
Appeals Commenced, Terminated and Pending by Nature of Suit or Offense During the Twelve Month Period Ended December 31, 2014 [continued]
Nature Of Suit Or Offense Filed Terminated Pending
Property Offenses 89 111 75
Burglary 0 0 0Larcent & Theft, Total 12 7 6 Bank 0 0 0 Postal 0 0 0 Theft, U.S. Property 5 2 4 Transport, Etc. of Stolen Property 7 5 2 Other Larceny and Theft Offenses 0 0 0
Embezzlement 3 2 2
Fraud, Total 69 99 61
Tax 4 9 5 Financial Institutions 11 10 7 Securities and Exchange 0 3 0 Mail 4 16 5 Wire, Radio or Television 11 17 14 Social Security 4 4 3 Citizenship and Naturalization 0 0 0 Passport 0 0 0 Identification Documents & Information 3 3 1 False claims and Services, Gov't. 5 6 3 False Statements 1 1 2 Conspiracy To Defraud the U.S. 2 3 3 Unauthorized Access Devices 5 7 3 Health Care 8 7 5 Other Fraud Offenses 11 13 10
Forgery and Counterfeiting 4 2 5Other Property Offenses 1 1 1
Drug Offenses 208 252 154Marijuana, Total 8 9 6 Sell, Distribute, or Dispense 5 7 3 Import / Export 0 0 0 Manufacture 3 2 3 Possession 0 0 0All Other Drugs, Total 194 237 145 Sell, Distribute, or Dispense 192 230 144 Import / Export 0 0 0 Manufacture 2 7 1 Possession 0 0 0Other Drug Offenses 6 6 3

Table 6
Appeals Commenced, Terminated and Pending by Nature of Suit or Offense During the Twelve Month Period Ended December 31, 2014 [continued]
Nature Of Suit Or Offense Filed Terminated Pending
Firearms, Explosives Offenses 88 116 66Firearms, Total 85 107 66 Possession By Prohibited Persons 43 45 38 Furtherance of Violent / Drug Trafficking Crimes 35 45 22 Other Firearms Offenses 7 17 6Explosives 3 9 0
Sex Offenses 37 47 36 Sexual Abuse of Adults 1 0 1 Sexual Abuse of Minors 18 17 17 Sexually Explicit Material 11 19 14 Other Sex Offenses 7 11 4
Justice System Offenses 7 12 6 Obstruction of Justice 3 9 2 Escape from Custody 1 0 1 Failure to Appear 0 3 0 Other Justice System Offenses 3 0 3
Immigration Offenses 17 18 8 Alien Smuggling 0 0 0 Improper Entry by Alien 0 0 0 Improper Reentry by Alien 17 18 8 Other Immigration Offenses 0 0 0
General Offenses 26 26 14
Money Laundering 11 13 7 RICO 1 7 4 6 Extortion and Threats 7 8 1 Other General Offenses 1 1 0
Regulatory Offenses 9 6 10
Traffic Offenses 0 0 0
Unclassified Offenses 11 7 7
NOTE: This table does not include data for the U.S. Court of Appeals for the Federal Circuit.1 RICO = Racketeer Influenced and Corrupt Organizations.

Table 7
Appeals Terminated on the Merits, by Circuit, During the Twelve Month Period Ended December 31, 2014
Total Percent Disposed
Nature Appeals of Total of by Affirmed / Certificate of Percent
of Proceeding Terminated 1
Terminations Total Consolidation Enforced 2
Dismissed Reversed Remanded Other Appealability Reversed 3
Totals 3,023 56.5 1,709 184 1,046 121 200 36 13 293 12.9
Criminal 629 59.8 376 66 222 85 53 11 5 0 14.1
U. S. Prisoner Petitions 412 60.7 250 12 80 4 5 0 1 160 2.0
Other U. S. Civil 158 54.4 86 13 44 6 26 10 0 0 30.2
Priv. Prisoner Petitions 617 43.9 271 7 110 4 23 1 0 133 8.5
Other Private Civil 765 51.2 392 64 313 8 64 4 3 0 16.3
Bankruptcy 28 75.0 21 2 14 1 5 1 0 0 23.8
Administrative Appeals 151 53.0 80 18 47 5 15 9 4 0 18.8
Original Proceedings 263 88.6 233 2 216 8 9 0 0 0 0
NOTE: Beginning in March 2014, data include miscellaneous cases not included previously
Affirmed includes merit terminations, affirmed in part and reversed in part.
Percent not shown where the total number of cases terminated on the merits is less than 10. No percentages of cases
reversed have been computed for original proceedings because of their difference from appeals, nor have they been included
in the percentage of total appeals reversed.
Terminations on the Merits

Table 8
Appeals Terminated by Procedural Judgments During the Twelve Month Period Ended December 31, 2014
Procedural Terminations
Cases Cert.
Appeals Disposed of Juris. FRAP Appeal- FRAP
Nature of Proceeding Terminated Total By Consolidation Total Defects 42* Default ability Other Total 42* Default Other
Totals 3,023 1,130 5 245 156 7 12 0 70 880 398 460 22
Criminal 629 187 0 52 42 0 0 0 10 135 122 12 1
U.S. Prisoner Petitions 412 150 0 34 25 1 1 0 7 116 13 100 3
Other U.S. Civil 158 59 1 18 5 1 0 0 12 40 21 18 1
Priv. Prisoner Petitions 617 339 0 48 41 0 1 0 6 291 32 254 5
Other Private Civil 765 309 2 58 38 4 9 0 7 249 181 66 2
Bankruptcy 28 5 0 0 0 0 0 0 0 5 4 1 0
Administrative Appeals 151 53 2 16 5 1 1 0 9 35 25 9 1
Original Proceedings 263 28 0 19 0 0 0 0 19 9 0 0 9
NOTE: Totals include appeals reopened and remanded as well as original appeals.
Juris defects=jurisdictional defects; cert.appealability=certificate of appealability.
Beginning in March 2014, data include miscellaneous cases not included previously.
* Voluntary dismissal under Rule 42(b), Federal Rules of Appellate Procedure.
By StaffBy Judges

Table 9
All Appeals Prisoner Petitions Other Civil Criminal Bankruptcy
Total Cases 36,095 1,893 9,745 540 8,812 555 8,649 442 3,513 98 557 23
Cases Disposed of by Consolidation 2,899 184 256 19 1,210 77 811 66 283 18 99 2
Average Nat. 7th Cir. Nat. 7th Cir. Nat. 7th Cir. Nat. 7th Cir. Nat. 7th Cir. Nat. 7th Cir.
From Filing of Notice of
Appeal or Docket Date 1
to Filing Last Brief 5.8 5.3 6.9 6.4 4.8 4.7 6.4 6.3 7.4 5.3 4.6 4.6
From Filing Last Brief
to Hearing or Submission 3.8 2.0 4.0 2.2 3.9 2.0 3.1 1.8 5.6 1.9 4.5 2.5
From Hearing
to Final Disposition 2.1 2.9 1.9 2.7 2.3 3.2 1.9 2.8 1.7 1.9 2.4 2.8
From Submission
to Final Disposition 0.4 0.3 0.2 0.4 0.8 0.1 0.6 0.1 0.5 0.3 0.7 0.0
From Filing of Notice of
Appeal or Docket Date 1
to Final Disposition 8.4 7.0 6.2 5.0 10.7 9.7 10.8 10.1 14.3 9.1 12.1 10.8
From Filing in Lower Court
to Final Disposition
in Appellate Court 27.6 27.6 24.6 19.1 30.3 30.8 28.5 33.7 0.0 0.0 23.1 23.1
NOTE: This table does not include data for the U.S. Court of Appeals for the Federal Circuit.
1 Docket date is used when computing the median time interval for original proceedings and appeals from administrative agencies
* All time intervals are reported in months.
Admin. Agency
Median Time Intervals* in Cases Terminated after Hearing or Submission by Circuit During the Twelve Month Period Ended December 31, 2014

Table 10
Certiorari Data During the Twelve Month Period Ended December 31, 2014
U.S. Private Administrative
Civil Civil Criminal Prisoner Appeals Total
Petitions Pending
01/01/14 1 17 12 28 8 66
Petitions Filed
01/01/14 to 12/31/14 16 61 82 125 5 289
Petitions Granted
01/01/14 to 12/31/14 1 1 1 0 0 3
Petitions Denied
01/01/14 to 12/31/14 13 66 76 123 11 289
Petitions Dismissed
01/01/14 to 12/31/14 1 2 0 2 1 6
Petitions Pending
12/31/14 2 9 17 28 1 57

U.S. COURT OF APPEALSCOMPARISON TABLES

U.S.C.A. Table 1
Type of Opinion or Order Filed in Cases Terminated on the Merits after Oral Hearing or Submission on Briefs
During the Twelve Month Period Ended December 31, 2014
Cases Written, Reasoned Written, Unsigned
Disposed of by Written & Signed & Unsigned * Without Comment Percent
Circuit Total Consolidation Oral Published Unpublished Published Unpublished Published Unpublished Unpublished
D.C. 616 152 0 211 0 7 245 0 1 53.0
First 887 63 0 290 14 1 500 3 16 64.3
Second 3,253 353 0 214 2,617 66 3 0 0 90.3
Third 2,227 95 0 172 1,328 2 498 2 130 91.7
Fourth 3,734 167 0 205 421 3 2,938 0 0 94.2
Fifth 5,171 989 0 354 41 59 3,707 1 20 90.1
Sixth 3,745 252 1 303 706 10 2,471 0 2 91.0
Seventh 1,893 184 0 586 2 28 1,083 0 10 64.1
Eighth 2,425 117 0 543 0 43 548 1 1,173 74.6
Ninth 6,693 287 0 484 0 29 2,989 28 2,876 91.6
Tenth 1,450 35 0 312 934 2 167 0 0 77.8
Eleventh 4,001 205 0 246 32 45 3,351 0 122 92.3
Total 36,095 2,899 1 3,920 6,095 295 18,500 35 4,350 87.2
This table does not include data for the U.S. Court of Appeals for the Federal Circuit.
* Includes only opinions and orders which expound the law as applied to the facts of the case and detail the judicial reasons upon which the judgment is based.

U.S.C.A. Table 2
Appeals Terminated on the Merits after Oral Hearing or Submission on Briefs During the Twelve Month Period
Ended December 31, 2014
Cases After Oral Hearing After Submission on Briefs
Disposed of by Percent Percent
Circuit Total Consolidation Total Of Total En Banc Panel Total of Total En Banc Panel
D.C. 616 152 236 50.9 1 235 228 49.1 1 227
First 887 63 245 29.7 0 245 579 70.3 0 579
Second 3,253 353 855 29.5 1 854 2,045 70.5 0 2,045
Third 2,227 95 239 11.2 2 237 1,893 88.8 0 1,893
Fourth 3,734 167 328 9.2 3 325 3,239 90.8 0 3,239
Fifth 5,171 989 828 19.8 5 823 3,354 80.2 0 3,354
Sixth 3,745 252 576 16.5 1 575 2,917 83.5 0 2,917
Seventh 1,893 184 650 38.0 4 646 1,059 62.0 0 1,059
Eighth 2,425 117 425 18.4 5 420 1,883 81.6 1 1,882
Ninth 6,693 287 1,450 22.6 17 1,433 4,956 77.4 2 4,954
Tenth 1,450 35 412 29.1 0 412 1,003 70.9 0 1,003
Eleventh 4,001 205 464 12.2 1 463 3,332 87.8 0 3,332
Total 36,095 2,899 6,708 20.2 40 6,668 26,488 79.8 4 26,484
This table does not include data for the U.S. Court of Appeals for the Federal Circuit.

U.S.C.A. Table 3
Appeals Commenced, Terminated and Pending by Circuit for the Twelve Month Periods Ended December 31, 2013 and 2014
Percent Percent Percent
Circuit 2013 2014 Change 1
2013 2014 Change 1
2013 2
2014 Change 1
D.C. 1,020 1,092 7.1 999 1,034 3.5 1,445 1,503 4.0
First 1,575 1,413 -10.3 1,467 1,297 -11.6 1,353 1,469 8.6
Second 4,996 4,988 -0.2 5,976 5,181 -13.3 3,715 3,522 -5.2
Third 3,910 3,962 1.3 4,214 3,262 -22.6 2,109 2,809 33.2
Fourth 4,969 4,727 -4.9 5,013 4,843 -3.4 2,340 2,224 -5.0
Fifth 7,455 7,765 4.2 7,547 7,996 5.9 4,869 4,638 -4.7
Sixth 4,981 4,605 -7.5 5,404 5,141 -4.9 3,785 3,249 -14.2
Seventh 2,992 2,917 -2.5 3,034 3,023 -0.4 1,918 1,812 -5.5
Eighth 2,838 2,968 4.6 2,835 3,000 5.8 1,532 1,500 -2.1
Ninth 12,761 11,311 -11.4 12,592 11,378 -9.6 14,267 14,200 -0.5
Tenth 2,071 1,964 -5.2 2,155 2,058 -4.5 1,265 1,171 -7.4
Eleventh 6,254 6,087 -2.7 6,505 6,239 -4.1 3,663 3,511 -4.1
Total 55,822 53,799 -3.6 57,741 54,452 -5.7 42,261 41,608 -1.5
This table does not include data for the U.S. Court of Appeals for the Federal Circuit. Beginning in March 2014, data include miscellaneous cases
not included previously.1 Percent change not computed when fewer than ten cases reported for the previous period.
2 Revised.
Filed Terminated Pending

U.S.C.A. Table 4
Cases Pending, By Length of Time in Months and Circuit, During the 12-Month Period Ending December 31, 2014
Total 0 - 3 4 - 6 7 - 9 10 - 12 Over
Circuit Pending Months Months Months Months 12 Months
D.C. 1,503 281 277 196 92 657
First 1,469 336 243 260 198 432
Second 3,522 1,015 627 701 361 818
Third 2,809 743 626 923 192 325
Fourth 2,224 991 581 252 145 255
Fifth 4,638 1,550 1,234 906 484 464
Sixth 3,249 983 859 626 299 482
Seventh 1,812 577 409 276 158 392
Eighth 1,500 597 345 237 155 166
Ninth 14,200 2,190 2,208 1,714 1,318 6,770
Tenth 1,171 411 291 196 114 159
Eleventh 3,511 1,286 899 536 278 512
Total 41,608 10,960 8,599 6,823 3,794 11,432

U.S.C.A. Table 5
Appeals Disposed of after Oral Hearing During the Twelve Month Periods Ended December 31, 2010 Through 2014
Percent Change
Circuit 2010 2011 2012 2013 2014 2013-2014
D.C. 223 253 199 237 236 -0.4
First 264 307 262 258 245 -5.0
Second 1,068 780 880 933 855 -8.4
Third 326 333 280 232 239 3.0
Fourth 367 406 434 423 328 -22.5
Fifth 929 955 834 785 828 5.5
Sixth 731 687 800 629 576 -8.4
Seventh 711 699 614 673 650 -3.4
Eighth 544 507 411 374 425 13.6
Ninth 1,912 1,722 1,495 1,532 1,450 -5.4
Tenth 378 362 326 351 412 17.4
Eleventh 501 478 457 440 464 5.5
Total 7,954 7,489 6,992 6,867 6,708 -2.3
This table does not include data for the U.S. Court of Appeals for the Federal Circuit.

U.S.C.A. Table 6
Total Case Participation in Cases Terminated on the Merits after Oral Hearing or Submission During the Twelve Month
Period Ended December 31, 2014
Cases Disposed Case Participation by
of by Resident Active Resident Senior Visiting Senior and
Consolidation Circuit Judges Circuit Judges Judges Visiting Judges
Circuit Total Number Percent* Number Percent* Number Percent* Number Percent* Percent*
D.C. 1,869 456 24.4 1,121 79.3 292 20.7 0 0 20.7
First 2,660 189 7.1 1,743 70.5 236 9.6 492 19.9 29.5
Second 9,651 1,026 10.6 6,087 70.6 2,225 25.8 313 3.6 29.4
Third 6,686 285 4.3 5,023 78.5 1,274 19.9 104 1.6 21.5
Fourth 11,254 515 4.6 9,416 87.7 1,286 12.0 37 0.3 12.3
Fifth 14,273 2,864 20.1 9,140 80.1 2,210 19.4 59 0.5 19.9
Sixth 10,029 744 7.4 6,221 67.0 1,958 21.1 1,106 11.9 33.0
Seventh 5,397 543 10.1 3,782 77.9 966 19.9 106 2.2 22.1
Eighth 7,340 361 4.9 6,049 86.7 909 13.0 21 0.3 13.3
Ninth 19,071 917 4.8 12,731 70.1 4,583 25.2 840 4.6 29.9
Tenth 4,350 105 2.4 2,995 70.6 1,237 29.1 13 0.3 29.4
Eleventh 10,113 587 5.8 7,697 80.8 1,344 14.1 485 5.1 19.2
Total 102,693 8,592 8.4 72,005 76.5 18,520 19.7 3,576 3.8 23.5
* NOTE: Due to rounding, percents may not add up to 100.
This table does not include data for the U.S. Court of Appeals for the Federal Circuit.

U.S.C.A. Table 7
CIRCUIT
SOURCE TOTAL 1ST 2ND 3RD 4TH 5TH 6TH 7TH 8TH 9TH 10TH 11TH D.C.Total Administrative 6,810 428 157 861 296 246 449 280 143 148 3,351 127 324
AGRI 4 1 0 0 0 0 1 1 1 0 0 0 0 ARMY 1 0 0 0 0 0 0 0 0 0 0 1 0 BATF 1 0 0 0 1 0 0 0 0 0 0 0 0 BCA 3 0 0 0 - 0 0 0 0 0 3 0 0 BIA 5,733 1 139 789 248 164 396 226 100 97 3,211 94 268 BOP 1 0 0 0 0 0 0 0 0 0 1 0 0 BPA 1 0 0 0 0 0 0 0 0 0 1 0 0 BRB 79 0 1 0 6 33 10 11 0 0 16 2 0 CFTR 1 1 0 0 0 0 0 0 0 0 0 0 0 CMCR 1 1 0 0 0 0 0 0 0 0 0 0 0 CPSC 1 0 0 0 0 0 0 0 0 0 0 1 0 DEA 5 1 0 0 1 0 1 0 0 0 1 0 1 DHS 26 0 0 3 0 4 9 1 1 5 1 0 2 DOE 6 0 0 0 0 0 2 0 3 0 1 0 0 DOJ 4 1 0 0 0 1 1 0 0 1 0 0 0 DVA 1 - 0 0 0 0 1 0 0 0 0 0 0 EDUC 3 1 0 0 0 1 1 0 0 0 0 0 0 EEOC 3 1 0 0 0 0 0 0 0 0 1 0 1 EPA 238 174 3 8 2 9 2 1 3 3 23 9 1 FAA 17 8 0 2 0 0 0 1 0 1 5 0 0 FCC 42 37 0 0 1 0 0 0 0 1 2 0 1 FDIC 2 0 0 0 0 0 1 0 0 0 1 0 0 FERC 40 29 0 4 0 0 1 0 3 0 3 0 0 FLRA 6 4 0 0 0 0 0 0 2 0 0 0 0 FMC 4 3 0 0 0 0 0 0 0 0 1 0 0 FMCS 3 1 0 0 0 0 0 0 1 0 0 1 0 FRA 1 1 0 0 0 0 0 0 0 0 0 0 0 FTC 1 0 0 0 0 0 0 0 0 0 0 0 1 HHS 8 1 1 0 0 1 4 0 0 0 1 0 0 HUD 1 - 1 0 0 0 0 0 0 0 0 0 0 IRS 185 12 4 22 12 13 9 7 12 17 47 5 25 LABR 21 1 0 5 1 2 1 1 1 0 1 3 5 LOC 2 2 0 0 0 0 0 0 0 0 0 0 0 MSHA 13 5 0 0 2 2 0 1 0 0 0 1 2 MSHR 6 3 0 0 0 1 0 2 0 0 0 0 0 MSPB 9 5 0 0 0 0 1 0 0 0 1 2 0 NCUA 2 2 0 0 0 0 0 0 0 0 0 0 0 NLRB 254 93 5 21 16 14 8 22 11 19 24 8 13 NRC 6 6 0 0 0 0 0 0 0 0 0 0 0 NTSB 6 5 0 0 0 0 0 0 0 0 1 0 0 OSHA 8 3 1 0 1 1 0 2 0 0 0 0 0 OSHC 21 - 1 5 3 0 0 2 4 3 0 0 3 OWCP 2 0 0 0 1 0 0 0 0 0 0 0 1 PRC 4 4 0 0 0 0 0 0 0 0 0 0 0 RRRB 3 1 0 0 0 0 0 0 1 0 1 0 0 SEC 15 11 0 2 0 0 0 0 0 0 2 0 0 SSA 2 1 0 0 0 0 0 0 0 0 1 0 0 STB 4 0 1 0 1 0 0 1 0 1 0 0 0 TRAN 4 3 0 0 0 0 0 1 0 0 0 0 0 TSA 5 4 0 0 0 0 0 0 0 0 1 0 0 USPS 1 1 0 0 0 0 0 0 0 0 0 0 0
Administrative Agency Proceedings Commenced for the Twelve Month Period Ended December 31, 2014
Note: Administrative Agency cases previously reported under the Immigration and Naturalization Service (INS) are now reported under the Board of Immigration Appeal (BIA).

SEVENTH CIRCUITDISTRICT COURTS
CIVIL TABLES

Civil Table 1
Period Period Period Period Period Period
Ended Ended Ended Ended Ended Ended
Dec. 31, Dec. 31, Percent Dec. 31, Dec. 31, Percent Dec. 31, Dec. 31, Percent
2013 2014 Change 2013 2014 Change 2013 2014 Change
Total 23,397 23,481 0.4 20,525 25,993 26.6 31,828 29,316 -7.9
Illinois Northern 9,893 10,983 11.0 9,984 9,601 -3.8 10,337 11,719 13.4
Illinois Central 1,476 1,377 -6.7 1,389 1,296 -6.7 1,543 1,624 5.2
Illinois Southern 4,217 2,458 -41.7 2,087 7,805 274.0 13,071 7,724 -40.9
Indiana Northern 2,392 3,114 30.2 1,731 2,086 20.5 2,647 3,675 38.8
Indiana Southern 2,987 2,909 -2.6 2,942 2,739 -6.9 2,338 2,508 7.3
Wisconsin Eastern 1,507 1,693 12.3 1,466 1,531 4.4 1,141 1,303 14.2
Wisconsin Western 925 947 2.4 926 935 1.0 751 763 1.6
¹ Percent change not computed when fewer than 10 cases reported for the previous period.
² Revised
Civil Cases Commenced, Terminated and Pending, in the District Courts, During the Twelve Month Periods Ended December 31, 2013 and 2014
Filed Terminated Pending

Civil Table 2
Civil Cases Commenced by Nature of Suit and District During the Twelve Month Period Ended December 31, 2014
Illinois Indiana Wisconsin TotalND CD SD ND SD ED WD
Total Civil Cases 10,983 1,377 2,458 3,114 2,909 1,693 947 23,481
United States Cases
Total U.S. Civil Cases 1,136 240 283 410 581 326 260 3,236
Contract 165 3 1 2 13 5 3 192
Real Property 23 34 27 4 12 7 9 116
Tort Actions 62 1 11 7 14 4 5 104
Civil Rights 55 7 6 9 21 6 11 115
Forfeitures and Penalties 31 8 7 36 12 15 15 124
Labor Suits 9 0 2 3 5 1 4 24
Social Security 411 127 74 295 385 215 162 1,669
All Others 227 8 15 11 14 34 21 330
Prisoner Petitions
Motion to Vacate Sentence 125 49 54 42 79 38 21 408
Habeas Corpus 7 0 73 0 5 1 9 95
Death Penalty 0 0 0 0 0 0 0 0
Prison Cond. 6 2 7 0 21 0 0 36
Mandamus & Other 11 1 0 1 0 0 0 13
Private Cases
Total Private Cases 9,847 1,137 2,175 2,704 2,328 1,367 687 20,245
Contract 806 74 68 111 170 99 70 1,398
Real Property 276 25 10 5 18 9 13 356
FELA 8 0 9 6 1 1 1 26
Marine Personal Injury 5 1 7 1 1 0 1 16
Motor Vehicle Personal Injury 69 8 31 44 48 8 3 211
Other Personal Injury 1,345 56 1,305 1,660 182 50 46 4,647
Other Tort Action 143 8 80 8 19 15 12 285
Civil Rights 1,329 201 102 308 448 189 104 2,681
Intellectual Property 775 11 7 27 116 71 58 1,065
Labor Suits 1,326 81 55 96 245 135 82 2,020
All Other 1,731 81 55 120 406 312 89 2,794
Prisoner Petitions
Habeas Corpus 208 49 50 157 389 169 41 1,063
Death Penalty 0 0 0 0 2 0 0 2
Civil Rights & Prison Cond. 1,823 538 394 160 283 307 167 3,672
Mandamus & Other 3 1 2 1 0 2 0 9
¹ FELA = Federal Employers Liability Act

Civil Table 3
Civil Cases Terminated, by District and Action Taken, During the Twelve Month Period Ended December 31, 2014
Court Action
Without Trial
No During or Percent
Court Before After Non Reaching
District Total Action Total Pretrial Pretrial Total Jury Jury Trial
Illinois Northern 9,599 2,534 7,065 6,432 519 114 25 89 1.2
Illinois Central 1,292 518 774 739 4 31 3 28 2.4
Illinois Southern 7,804 584 7,220 7,190 12 18 3 15 0.2
Indiana Northern 2,086 291 1,795 1,255 519 21 8 13 1.0
Indiana Southern 2,739 337 2,402 1,526 852 24 9 15 0.9
Wisconsin Eastern 1,531 260 1,271 1,226 26 19 9 10 1.2
Wisconsin Western 935 224 711 403 290 18 4 14 1.9
Total 25,986 4,748 21,238 18,771 2,222 245 61 184 0.9
During or After Trial
Note: 174 Land Condemnation Cases Omitted

Civil Table 4
Median Time Intervals from Filing to Disposition of Civil Cases Terminated, by District and Method of Disposition,
During the Twelve Month Period Ended December 31, 2014
Total Cases Court Action
Before Pretrial During or After Pretrial Trial
Number Number Number Number Number
of of of of of
District Cases Median* Cases Median* Cases Median* Cases Median* Cases Median*
Illinois Northern 7,962 7.0 2,206 4.6 5,184 7.6 473 10.4 99 33.7
Illinois Central 683 10.5 303 7.8 368 12.5 4 0 8 0
Illinois Southern 7,271 40.5 544 15.9 6,711 41.3 7 0 9 0
Indiana Northern 1,749 9.8 269 3.3 963 8.7 497 16.1 20 26.1
Indiana Southern 1,966 9.1 256 4.3 869 6.4 821 11.4 20 27.1
Wisconsin Eastern 1,113 6.0 230 3.0 847 7.1 24 11.6 12 27.3
Wisconsin Western 707 8.1 177 3.2 283 7.1 233 11.0 14 18.5
Total 21,451 13.5 3,985 4.9 15,225 17.9 2,059 12.1 182 27.6
*Median time intervals computed only if ten or more cases.
Excludes: land condemnation cases, prisoner petitions, deportation reviews, recovery of overpayments and enforcement of judgments.
Action
No Court

Civil Table 5
Civil Cases Pending, by District and Length of Time Pending, as of December 31, 2014
Total Less Than 1 to 2 2 to 3 Three Years & Over
District Cases Pending 1 Year years Years Number Percent
Illinois Northern 11,719 6,894 2,304 1,427 1,094 9.3
Illinois Central 1,624 921 451 172 80 4.9
Illinois Southern 7,724 1,813 2,718 1,041 2,152 27.9
Indiana Northern 3,675 2,345 969 257 104 2.8
Indiana Southern 2,508 1,883 493 83 49 2.0
Wisconsin Eastern 1,303 932 250 66 55 4.2
Wisconsin Western 763 575 143 36 9 1.2
Total 29,316 15,363 7,328 3,082 3,543 12.1

SEVENTH CIRCUITDISTRICT COURTSCRIMINAL TABLES

Criminal Table 1
Criminal Cases Commenced, Terminated and Pending (Including Transfers) During the Twelve Month Periods Ended December 31, 2013 and 2014
Filed Terminated Pending
Percent Percent Percent
District 2013 2014 Change *2013 2014 Change *
2013 2014 Change *
Illinois Northern 641 442 -31.0 621 567 -8.7 1,301 1,159 -10.9
Illinois Central 312 280 -10.3 334 333 -0.3 335 284 -15.2
Illinois Southern 366 286 -21.9 356 281 -21.1 282 281 -0.4
Indiana Northern 316 239 -24.4 353 312 -11.6 378 302 -20.1
Indiana Southern 310 288 -7.1 293 247 -15.7 259 297 14.7
Wisconsin Eastern 223 227 1.8 257 229 -10.9 249 248 -0.4
Wisconsin Western 143 117 -18.2 136 145 6.6 204 173 -15.2
Total 2,311 1,879 -18.7 2,350 2,114 -10.0 3,008 2,744 -8.8
* Percent change not computed when fewer than ten cases reported for the previous period.

Criminal Table 2
Criminal Defendant's Commenced, Terminated and Pending (Including Transfers) During the Twelve Month Period Ended December 31, 2014
Commenced
Class A Total Class A
Misde- Petty Com- Misde- Petty Re- Trans-
District Total Felony meanor Offense menced Total Felony meanor Offense Open2
fers
Illinois Northern 2,001 1,982 19 0 664 660 664 16 0 1 3
Illinois Central 521 514 7 0 341 340 293 46 1 0 1
Illinois Southern 368 362 4 2 398 393 393 0 0 3 2
Indiana Northern 514 508 6 0 310 308 304 4 0 1 1
Indiana Southern 478 477 1 0 385 381 373 6 2 1 3
Wisconsin Eastern 412 402 10 0 387 378 372 6 0 6 3
Wisconsin Western 238 235 3 0 130 129 125 4 0 1 0
Total 4,532 4,480 50 2 2,615 2,589 2,504 82 3 13 13
Terminated Not Terminated as of December 31, 20141
Total Class A Class A
Termi- Misde- Petty Re- Trans- Misde- Petty
District nated Total Felony meanor Offense Open2
fers Total Felony meanor Offense
Illinois Northern 847 846 822 21 3 1 0 1,780 1,757 23 0
Illinois Central 477 476 443 31 2 0 1 390 367 23 0
Illinois Southern 375 374 370 4 0 1 0 386 381 3 2
Indiana Northern 392 388 382 6 0 1 3 427 423 4 0
Indiana Southern 392 391 384 7 0 1 0 463 461 0 2
Wisconsin Eastern 375 372 361 10 1 2 1 435 427 8 0
Wisconsin Western 166 163 159 4 0 3 0 199 195 4 0
Total 3,024 3,010 2,921 83 6 9 5 4,080 4,011 65 4
1 Excludes defendants who had been fugitives more than 12 months before the end of the period indicated.
2. Includes appeals from magistrate judges, reopens, remands, and retrials after mistrial.
NOTE: This table includes defendants in all cases filed as felonies or Class A misdemeanors, but includes only those defendants in cases filed
as petty offenses that were assigned to district court judges rather than magistrate judges.
Not Terminated as of December 31, 20131

Criminal Table 3
U.S. District Courts-- Criminal Defendants Commenced, by Offense and District, During the Twelve Month Period Ended December 31, 2014
Violent Offenses Property Offenses
Burglary Forgery &
Larceny, Embezzle- Counter-
District Total Homicide Robbery Assault Other and Theft ment Fraud feiting Other
Total 2,602 1 78 7 37 107 33 502 28 3
Illinois Northern 661 0 46 1 11 43 12 197 13 1
Illinois Central 340 0 1 1 0 8 4 42 3 0
Illinois Southern 396 1 8 1 4 8 3 80 3 1
Indiana Northern 309 0 11 0 5 23 6 53 1 0
Indiana Southern 382 0 7 1 2 11 4 61 3 0
Wisconsin Eastern 384 0 5 1 14 9 0 53 4 1
Wisconsin Western 130 0 0 2 1 5 4 16 1 0
Firearms & Justice
Explosives Sex System General Regulatory Traffic
Offenses Offenses Offenses Offenses Offenses Offenses
All Other Improper
Other Reentry
District Marijuana Drugs by Alien Other
Total 44 791 486 172 37 117 9 56 50 44
Illinois Northern 0 130 83 17 13 49 3 26 16 0
Illinois Central 8 107 54 29 1 26 4 3 5 44
Illinois Southern 5 185 55 25 4 8 0 4 1 0
Indiana Northern 13 73 94 10 6 2 1 5 6 0
Indiana Southern 3 130 70 46 5 17 1 8 13 0
Wisconsin Eastern 7 122 106 35 7 4 0 10 6 0
Wisconsin Western 8 44 24 10 1 11 0 0 3 0
NOTE: This table includes all felony and class A misdemeanor cases, but includes only those petty offense cases that have been assigned
to district judges.
Immigration
Offenses
Drug
Offenses

Criminal Table 4
Median Time Intervals from Filing to Disposition of Criminal Defendants, by District, During the Twelve Month Period
Ended December 31, 2014
Total Dismissed Plea of Guilty Court Trial Jury Trial
Median * Median * Median * Median * Median *
District Number Months Number Months Number Months Number Months Number Months
Illinois Northern 847 18.1 45 14.6 743 17.6 3 0.0 56 26.0
Illinois Central 476 13.0 19 17.0 447 12.8 1 0.0 9 0.0
Illinois Southern 375 9.0 12 7.5 356 9.0 0 0.0 7 0.0
Indiana Northern 389 10.1 40 18.7 335 9.4 0 0.0 14 22.4
Indiana Southern 392 11.7 26 16.4 354 10.5 1 0.0 11 17.0
Wisconsin Eastern 374 7.3 33 43.1 334 6.8 4 0.0 3 0.0
Wisconsin Western 166 6.3 18 11.8 144 5.8 1 0.0 3 0.0
Total 3,019 11.8 193 16.5 2,713 11.0 10 23.0 103 21.9
* Medians are computed only for ten or more defendants.
filed to the date the defendant was either found not guilty or was sentenced.
NOTE: This table includes defendants in all felony and class A misdemeanor cases, but includes only those
petty offense defendants whose cases have been assigned to district judges. Median time interval computed from the date case was

SEVENTH CIRCUITDISTRICT COURTS COMBINED
CIVIL & CRIMINAL TABLES

Civil / Criminal Table 1
Weighted Filings Per Judgeship Unweighted Filings Per Judgeship
Supervised Supervised
Release Release
District Judgeships Civil Criminal Hearings Total Civil Criminal Hearings Total
Illinois Northern 22 503 28 1.75 533 440 30 12.09 482
Illinois Central 4 300 73 5.18 378 332 85 34.75 452
Illinois Southern 4 434 101 6.01 541 593 99 39.50 732
Indiana Northern 5 479 61 3.36 543 571 62 20.00 653
Indiana Southern 5 583 74 1.25 658 564 77 7.20 648
Wisconsin Eastern 5 322 79 5.38 406 323 76 37.40 436
Wisconsin Western 2 491 62 4.33 557 451 65 29.50 546
Total 47 3,112 478 27.3 3,616 3,274 494 180.4 3,949
NOTE: Case weights are based on the 2003-2004 district court case weighting study conducted by the Federal Judicial Center.
This table excludes civil cases arising by reopening, remand, or transfer to the district by the order of the Judicial Panel on Multidistrict Litigation.
This table includes defendants in all felony and class A misdemeanor cases, but includes only those petty offense defendants whose cases have been
assigned to district judges. Remands and reopens for criminal defendants are excluded. This table excludes data for the territorial courts.
Data are reported for supervised release and probation hearings (both evidentiary and non-evidentiary) previously not presented in this table.
Data are obtained from the monthly reports of trials and other court activities conducted by resident and visiting judges.
Due to rounding, subtotals for weighted and unweighted civil, criminal, and revocation filings may not equal totals for weighted and unweighted filings.
Weighted and Unweighted Filings per Authorized Judgeship During the Twelve Month Period Ended December 31, 2014

Civil / Criminal Table 2
Civil and Criminal Trials Completed, by District, During the Twelve Month Period Ended December 31, 2014
Total Non Non
District All Trials Total Jury Jury Total Jury Jury
Illinois Northern 268 149 67 82 119 58 61
Illinois Central 124 49 22 27 75 57 18
Illinois Southern 90 23 17 6 67 52 15
Indiana Northern 99 22 13 9 77 64 13
Indiana Southern 92 52 37 15 40 31 9
Wisconsin Eastern 52 18 7 11 34 27 7
Wisconsin Western 36 25 14 11 11 7 4
Total 761 338 177 161 423 296 127
NOTE: Includes trials conducted by district and appellate judges only; All trials conducted by magistrates are excluded.
Includes land condemnation trials, hearings on temporary restraining orders and preliminary injunctions, hearings on
contested motions, miscellaneous civil cases, and other contested proceedings in which evidence is introduced.
1 Includes trials of miscellaneous cases.
CriminalCivil

SEVENTH CIRCUITBANKRUPTCY COURTS TABLES

Bankruptcy Table 1
Bankruptcy Petitions Commenced, Terminated and Pending During the Twelve Month Periods Ended December 31, 2013 and 2014
Filed Terminated Pending
Percent Percent Percent
District 2013 2014 Change 1
2013 2014 Change 1
2013 2
2014 Change 1
Illinois Northern 55,094 51,274 -6.9 55,202 51,243 -7.2 57,606 57,636 0.1
Illinois Central 6,762 6,018 -11.0 7,451 7,024 -5.7 7,775 6,769 -12.9
Illinois Southern 4,807 4,215 -12.3 5,672 5,257 -7.3 7,532 6,490 -13.8
Indiana Northern 13,617 11,649 -14.5 14,444 13,533 -6.3 16,687 14,803 -11.3
Indiana Southern 20,229 17,586 -13.1 22,200 21,845 -1.6 32,917 28,657 -12.9
Wisconsin Eastern 16,801 15,597 -7.2 16,979 16,632 -2.0 18,286 17,251 -5.7
Wisconsin Western 6,240 5,479 -12.2 6,641 5,910 -11.0 5,450 5,019 -7.9
Total 123,550 111,818 -9.5 128,589 121,444 -5.6 146,253 136,625 -6.6
1 Percent change not computed when fewer than ten cases reported for the previous period.
² REVISED.
NOTE: Due to differences among districts in reporting intra-district transfers, the total provided above for cases pending on December 31, 2014 may not equal the
number obtained by adding totals for cases pending at the end of the prior period plus cases filed during the current period, then subtracting cases terminated during
the current period.

Bankruptcy Table 2
Ended December 31, 2014
Pending Filed Terminated Pending
District 1/1/2014 ¹ 2014 2014 12/31/14
Illinois Northern 928 1,038 1,181 785
Illinois Central 134 209 194 149
Illinois Southern 72 203 214 61
Indiana Northern 397 504 565 336
Indiana Southern 521 362 440 443
Wisconsin Eastern 462 709 754 417
Wisconsin Western 95 176 188 83
Total 2,609 3,201 3,536 2,274
¹ REVISED
Adversary Proceedings Commenced, Terminated and Pending Under the Bankruptcy Code During the Twelve Month Period

Bankruptcy Table 3
2013 2014 2013 2014 2013 2014 2013 2014 2013 2014
Total Total Percent Chap Chap Chap Chap Chap Chap Chap Chap
District Filings Filings Of Change 7 7 11 11 12 12 13 13
Illinois Northern 55,094 51,274 -6.9 36,303 31,670 302 217 1 1 18,488 19,386
Illinois Central 6,762 6,018 -11.0 5,256 4,880 25 26 1 1 1,480 1,111
Illinois Southern 4,807 4,215 -12.3 2,974 2,672 11 17 1 0 1,821 1,526
Indiana Northern 13,617 11,649 -14.5 10,415 8,837 34 23 5 2 3,163 2,787
Indiana Southern 20,229 17,586 -13.1 13,987 12,129 83 75 1 5 6,158 5,377
Wisconsin Eastern 16,801 15,597 -7.2 12,102 11,264 26 26 5 8 4,668 4,299
Wisconsin Western 6,240 5,479 -12.2 5,190 4,614 29 27 22 14 999 824
Total 123,550 111,818 -9.5 86,227 76,066 510 411 36 31 36,777 35,310
Total
Business Chap Chap Chap Chap
District Filings 7 11 12 13
Illinois Northern 1,051 802 188 1 60
Illinois Central 133 93 25 1 14
Illinois Southern 83 56 17 0 10
Indiana Northern 145 108 18 2 17
Indiana Southern 339 239 72 5 23
Wisconsin Eastern 265 206 25 8 26
Wisconsin Western 189 131 21 14 23
Total 2,205 1,635 366 31 173
Total
Non-Business CHAP CHAP CHAP
District Filings 7 11 13
Illinois Northern 50,223 30,868 29 19,326
Illinois Central 5,885 4,787 1 1,097
Illinois Southern 4,132 2,616 0 1,516
Indiana Northern 11,504 8,729 5 2,770
Indiana Southern 17,247 11,890 3 5,354
Wisconsin Eastern 15,332 11,058 1 4,273
Wisconsin Western 5,290 4,483 6 801
Total 109,613 74,431 45 35,137
Business and Nonbusiness Bankruptcy Cases Commenced, by Chapter of the Bankruptcy Code,
During the Twelve Month Periods Ended December 31, 2013 and 2014
NOTE: These figures include the following cases not
reflected elsewhere:
Chapter 9
RI=1 SC=1 MS, S=1
AR, W=1 MO, E=1 NE=4
CA, N=1 CO= 1
Chapter 15
NY, E=6 NY, S = 21 DE = 12
NJ=4 CA, C =1 CA, S = 1
NV = 5 CO = 3 FL, M = 4
FL, S= 1
Chapter 15 was added and Section 304 was
terminated by changes in the bankruptcy laws
effective October 17, 2005.
(1) Section 101 of the U.S. Bankruptcy Code defines
consumer (nonbusiness) debt as that incurred by an
individual primarily for a personal, family, or
household purpose. If the debtor is a corporation or
partnership, or if debt related to operation of a
business predominates, the nature of the debt is
business.

SEVENTH CIRCUITPROBATION OFFICE TABLES

Probation Table 1
Persons
Under Total Term Of Received
Supervision Total Less Supervised BOP By
District 01/01/14 Received Transfers Probation1
Release Parole2
Custody3
Transfer
Illinois Northern 2,581 931 896 125 768 3 0 35
Illinois Central 762 365 338 14 323 1 0 27
Illinois Southern 792 400 385 43 341 1 0 15
Indiana Northern 782 422 406 72 328 4 2 16
Indiana Southern 705 368 352 45 305 2 0 16
Wisconsin Eastern 1,158 546 513 64 443 6 0 33
Wisconsin Western 359 192 173 27 145 1 0 19
Total 7,139 3,224 3,063 390 2,653 18 2 161
Persons
Term Of Removed Under
Total Less Supervised BOP By Supervision
District Removed Transfers Probation1
Release Parole2
Custody3
Transfer 12/31/14
Illinois Northern 970 915 163 748 4 0 55 2,545
Illinois Central 311 294 21 270 3 0 17 816
Illinois Southern 340 315 36 278 1 0 25 852
Indiana Northern 426 414 51 353 9 1 12 776
Indiana Southern 317 299 54 236 9 0 18 755
Wisconsin Eastern 521 490 91 393 6 0 31 1,179
Wisconsin Western 173 160 17 140 3 0 13 379
Total 3,058 2,887 433 2,418 35 1 171 7,302
1 Includes judge and magistrate probation.
2 Includes parole, special parole, mandatory release, and military parole
3 BOP = Bureau of Prisons
People Received for Supervision During the Twelve Month Period Ended December 31, 2014
People Removed from Supervision During the Twelve Month Period Ended December 31, 2014


![“Reasoning about Assassinations” · 5hdvrqlqj derxw $vvdvvlqdwlrqv &ulwlfdo 7klqnlqj lq 3rolwlfdo &rqwh[wv-dphv )hw]hu 8qlyhuvlw\ ri 0lqqhvrwd 'xoxwk 8qlwhg 6wdwhv ri $phulfd](https://img.dokumen.tips/doc/110x75/5ada08517f8b9a6d318c2208/reasoning-about-assassinations-derxw-vvdvvlqdwlrqv-ulwlfdo-7klqnlqj-lq-3rolwlfdo.jpg)


![1R HW DO - oag.dc.gov · ly 8qlwhg 6wdwhv y /rsh] 8 6 8qlwhg 6wdwhv y 0dvfldqgdur ) g wk &lu](https://img.dokumen.tips/doc/110x75/5e03281cd9e2ea2f20420534/1r-hw-do-oagdcgov-ly-8qlwhg-6wdwhv-y-rsh-8-6-8qlwhg-6wdwhv-y-0dvfldqgdur-.jpg)


![· )heuxdu\,q wkh 8qlwhg 6wdwhv ghfoduhg phdvohv zdv hudglfdwhg wkdqnv wr wkh 005 ydfflqh wzr ghfdghv odwhu wkh :ruog +hdowk 2ujdql]dwlrq kdv uhsruwhg](https://img.dokumen.tips/doc/110x75/5ea8937f9b9e8a037f7baefc/heuxduq-wkh-8qlwhg-6wdwhv-ghfoduhg-phdvohv-zdv-hudglfdwhg-wkdqnv-wr-wkh-005-ydfflqh.jpg)
![JURISDICCION 07 CONSEJO DE LA MAGISTRATURA · dfwxdol]dflyq gho 3rghu -xglfldo \ gh odv upsolfdv gh orv 7doohuhv gh od 2ilflqd gh od 0xmhu gh od &ruwh 6xsuhpd gh -xvwlfld gh od 1dflyq](https://img.dokumen.tips/doc/110x75/5fcf7e05892c40467e65c37f/jurisdiccion-07-consejo-de-la-dfwxdoldflyq-gho-3rghu-xglfldo-gh-odv-upsolfdv.jpg)