Embed Size (px)
Citation preview

Hiroshima J. Med. Sci. Vol. 58, No. 4, 75,_,s2, December, 2009 HIJM58-11
Arterial Mechanical Impedance is a Sensitive Stress Response Monitor During General Anesthesia
Ryuji NAKAMURA1), Noboru SAEKJl), Abdugheni KUTLUK2),
Kenji SHIBA2), Toshio TSUJI2), Hiroshi HAMADA1) and Masashi KAWAMOT01)
1) Department of Anesthesiology and Critical Care, Division of Clinical Medical Science, Graduate School of Biomedical Sciences, Hiroshima University, Kasumi 1-2-3 Minami-ku, Hiroshima 734-8551, Japan
2) Department of Artificial Complex Systems Engineering, Graduate School of Engineering, Hiroshima University, 1-4-1 Kagamiyama, Higashi-hiroshima 739-8527, Japan
ABSTRACT Arterial mechanical impedance is a characteristic of arterial dynamics that is determined by
photoplethysmographic amplitude and direct arterial pressure, while mechanical impedance is indicated by stiffness, viscosity, and inertia. We compared the parameters of mechanical impedance and photoplethysmographic amplitude to estimate the magnitude of stress response in patients undergoing general anesthesia by measuring direct arterial pressure. After sedating each patient with propofol, photoplethysmographic amplitude and mechanical impedance were measured as baseline control values, then 3 min after fentanyl administration (2 µg kg-1), the parameters were measured again as post-fentanyl values. Thereafter, a direct laryngoscopy procedure was performed and post-laryngoscopy values for the parameters were determined. The magnitudes of response to each event were compared by using the ratio of the measurements from the preceding event. Then, comparisons of the magnitudes were performed after coordinating each response in the same direction. Our results showed that both stiffness and viscosity of mechanical impedance had greater variations than photoplethysmographic amplitude. In conclusion, we propose stiffness and viscosity derived from arterial mechanical impedance as sensitive parameters to monitor stress responses during general anesthesia.
Key words: Plethysmography, Autonomic response, Depth of anesthesia
75
General anesthetic agents and regional nerve blocks have been developed to suppress vital reactions against nociceptive stimuli during surgery. However, anesthesiologists must adjust the dosage of the anesthetics based mainly on clinical experience2,5,21). No established useful indicator has been presented that is effective for estimating stress response in order to determine the optimal dose of anesthetic agents, though some procedures to detect sympathetic nervous activity that are dependent on fingertip blood flow changes to titrate the dosage of anesthetic agents have been proposed7,12,13,2o). Recently, attention has been given to monitoring stress response and sympathetic nervous activity using a photoplethysmogram with a pulse oximeterl,3,4,B,s,n,12,15,22,21), while
<lure has been reported17,19,23>, in the present study we used a mechanical impedance model, which has shown increased prediction accuracy regarding the parameters of arterial dynamics as compared to the conventional procedure18).
we have considered that the arterial mechanical characteristics of the fingertip could be used as an index of stress response. We previously reported procedures used to estimate the characteristics of arterial dynamics based on both on photoplethysmographic (PPG) amplitude and direct arterial pressure (DAP)18). Although an analogous proce-
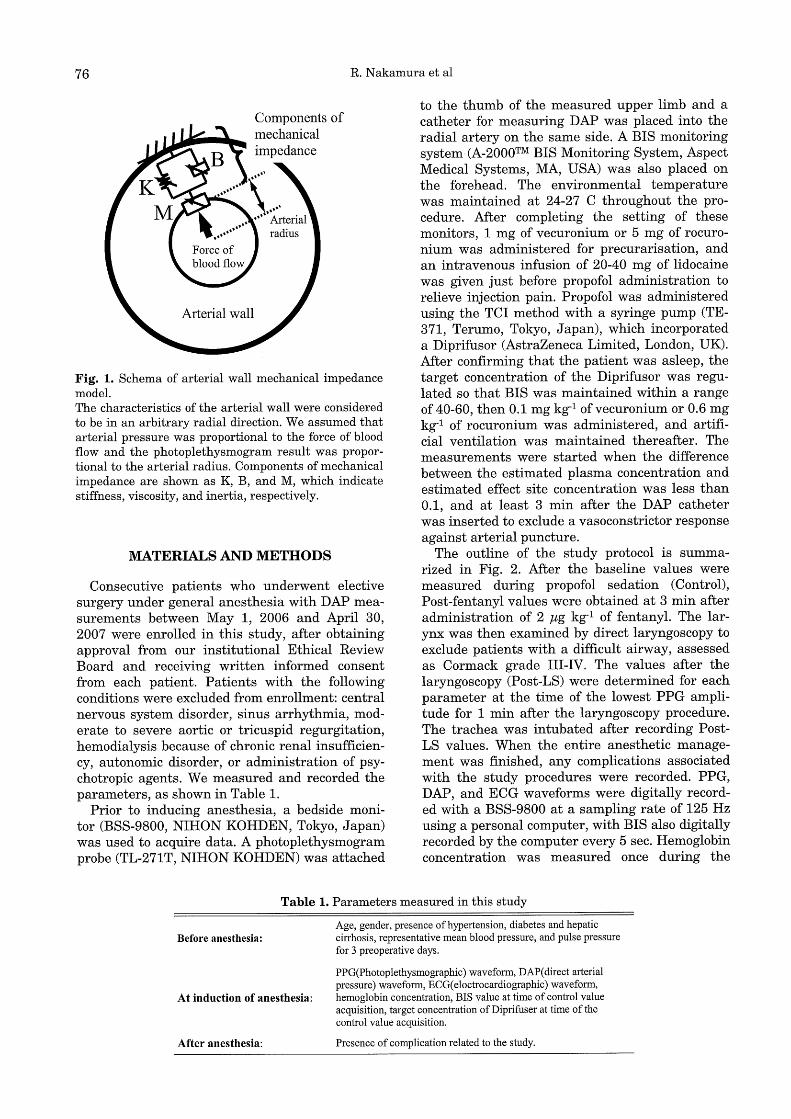
We ref er to the mechanical characteristics estimated by our methods as "mechanical impedance," which is shown by stiffness (K), viscosity (B), and inertia (M) (Fig. 1). Since this impedance is derived from a combination of PPG amplitude and DAP, we speculated that it may reflect stress response more accurately than PPG amplitude alone. There are no known reports that have compared mechanical impedance with PPG amplitude, thus we investigated the magnitude of mechanical impedance as an index of stress response and compared the results to PPG amplitude. In the present study, we administered fentanyl to reduce stress and performed a laryngoscopy to add stress, and then compared PPG amplitude response and mechanical impedance associated with each event.
76 R. Nakamura et al
Components of mechanical impedance
Fig. 1. Schema of arterial wall mechanical impedance model. The characteristics of the arterial wall were considered to be in an arbitrary radial direction. We assumed that arterial pressure was proportional to the force of blood flow and the photoplethysmogram result was proportional to the arterial radius. Components of mechanical impedance are shown as K, B, and M, which indicate stiffness, viscosity, and inertia, respectively.
MATERIALS AND METHODS
Consecutive patients who underwent elective surgery under general anesthesia with DAP measurements between May 1, 2006 and April 30, 2007 were enrolled in this study, after obtaining approval from our institutional Ethical Review Board and receiving written informed consent from each patient. Patients with the following conditions were excluded from enrollment: central nervous system disorder, sinus arrhythmia, moderate to severe aortic or tricuspid regurgitation, hemodialysis because of chronic renal insufficiency, autonomic disorder, or administration of psychotropic agents. We measured and recorded the parameters, as shown in Table 1.
Prior to inducing anesthesia, a bedside monitor (BSS-9800, NIHON KOHDEN, Tokyo, Japan) was used to acquire data. A photoplethysmogram probe (TL-271 T, NIH ON KOHDEN) was attached
to the thumb of the measured upper limb and a catheter for measuring DAP was placed into the radial artery on the same side. A BIS monitoring system (A-2000™ BIS Monitoring System, Aspect Medical Systems, MA, USA) was also placed on the forehead. The environmental temperature was maintained at 24-27 C throughout the procedure. After completing the setting of these monitors, 1 mg of vecuronium or 5 mg of rocuronium was administered for precurarisation, and an intravenous infusion of 20-40 mg of lidocaine was given just before propofol administration to relieve injection pain. Propofol was administered using the TCI method with a syringe pump (TE-371, Terumo, Tokyo, Japan), which incorporated a Diprifusor (AstraZeneca Limited, London, UK). After confirming that the patient was asleep, the target concentration of the Diprifusor was regulated so that BIS was maintained within a range of 40-60, then 0.1 mg kg-1 ofvecuronium or 0.6 mg kg-1 of rocuronium was administered, and artificial ventilation was maintained thereafter. The measurements were started when the difference between the estimated plasma concentration and estimated effect site concentration was less than 0.1, and at least 3 min after the DAP catheter was inserted to exclude a vasoconstrictor response against arterial puncture.
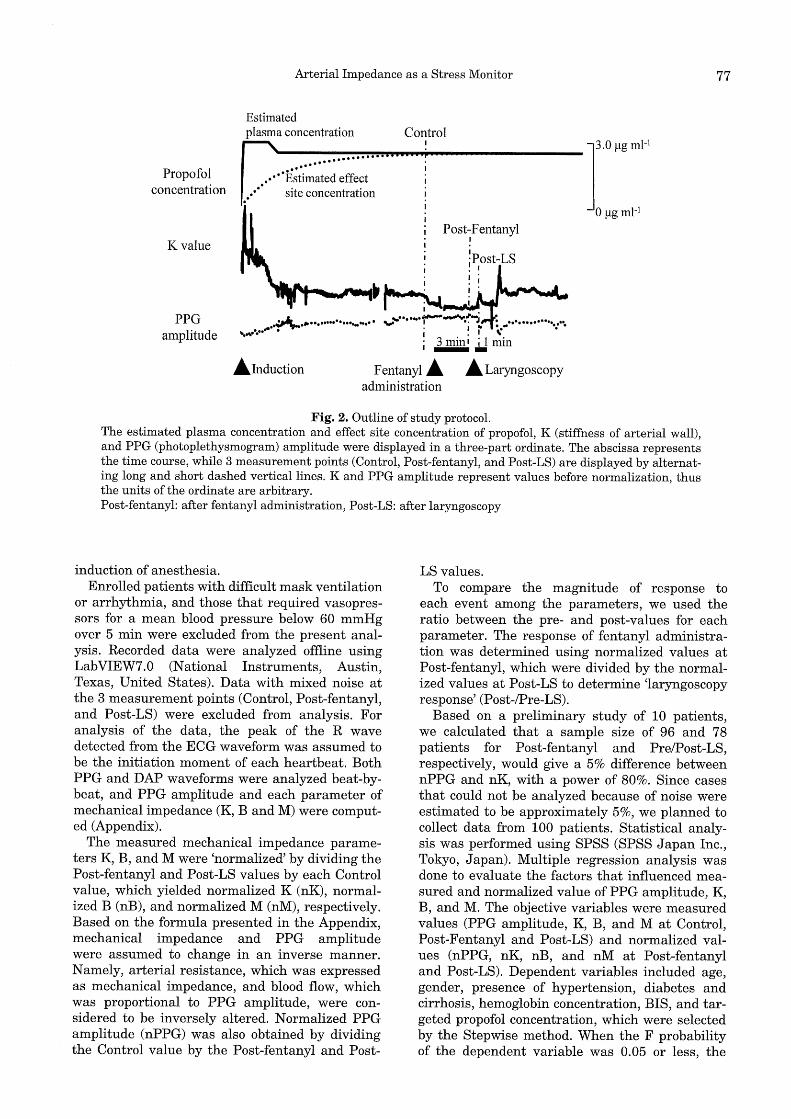
The outline of the study protocol is summarized in Fig. 2. After the baseline values were measured during propofol sedation (Control), Post-fentanyl values were obtained at 3 min after administration of 2 µg kg-1 of fentanyl. The larynx was then examined by direct laryngoscopy to exclude patients with a difficult airway, assessed as Cormack grade III-IV. The values after the laryngoscopy (Post-LS) were determined for each parameter at the time of the lowest PPG amplitude for 1 min after the laryngoscopy procedure. The trachea was intubated after recording PostLS values. When the entire anesthetic management was finished, any complications associated with the study procedures were recorded. PPG, DAP, and ECG waveforms were digitally recorded with a BSS-9800 at a sampling rate of 125 Hz using a personal computer, with BIS also digitally recorded by the computer every 5 sec. Hemoglobin concentration was measured once during the
Table 1. Parameters measured in this study
Before anesthesia:
At induction of anesthesia:
After anesthesia:
Age, gender, presence of hypertension, diabetes and hepatic cirrhosis, representative mean blood pressure, and pulse pressure for 3 preoperative days.
PPG(Photoplethysmographic) waveform, DAP( direct arterial pressure) waveform, ECG( eloctrocardiographic) waveform, hemoglobin concentration, BIS value at time of control value acquisition, target concentration of Diprifuser at time of the control value acquisition.
Presence of complication related to the study.
Arterial Impedance as a Stress Monitor 77
Propofol concentration
K value
Estimated plasma concentration
................ ••••
•• •• .. ·ii~ii:Uated effect site concentration
Control I r·o µgmJ-1
0 µgmI- 1
Post-Fentanyl I
~~ PPG
amplitude
.~ • ~ .......... ..,_,,,., ............ '!'-.i .~ ....................... -.r"
............. • i ! r ,. i .= .iJmin
~Induction Fentanyl ~ ~Laryngoscopy administration
Fig. 2. Outline of study protocol. The estimated plasma concentration and effect site concentration of propofol, K (stiffness of arterial wall), and PPG (photoplethysmogram) amplitude were displayed in a three-part ordinate. The abscissa represents the time course, while 3 measurement points (Control, Post-fentanyl, and Post-LS) are displayed by alternating long and short dashed vertical lines. K and PPG amplitude represent values before normalization, thus the units of the ordinate are arbitrary. Post-fentanyl: after fentanyl administration, Post-LS: after laryngoscopy
induction of anesthesia. Enrolled patients with difficult mask ventilation
or arrhythmia, and those that required vasopressors for a mean blood pressure below 60 mmHg over 5 min were excluded from the present analysis. Recorded data were analyzed offline using LabVIEW7.0 (National Instruments, Austin, Texas, United States). Data with mixed noise at the 3 measurement points (Control, Post-fentanyl, and Post-LS) were excluded from analysis. For analysis of the data, the peak of the R wave detected from the ECG waveform was assumed to be the initiation moment of each heartbeat. Both PPG and DAP waveforms were analyzed beat-bybeat, and PPG amplitude and each parameter of mechanical impedance (K, B and M) were computed (Appendix).
The measured mechanical impedance parameters K, B, and M were 'normalized' by dividing the Post-fentanyl and Post-LS values by each Control value, which yielded normalized K (nK), normalized B (nB), and normalized M (nM), respectively. Based on the formula presented in the Appendix, mechanical impedance and PPG amplitude were assumed to change in an inverse manner. Namely, arterial resistance, which was expressed as mechanical impedance, and blood flow, which was proportional to PPG amplitude, were considered to be inversely altered. Normalized PPG amplitude (nPPG) was also obtained by dividing the Control value by the Post-fentanyl and Post-
LS values. To compare the magnitude of response to
each event among the parameters, we used the ratio between the pre- and post-values for each parameter. The response of fentanyl administration was determined using normalized values at Post-fentanyl, which were divided by the normalized values at Post-LS to determine 'laryngoscopy response' (Post-/Pre-LS).
Based on a preliminary study of 10 patients, we calculated that a sample size of 96 and 78 patients for Post-fentanyl and Pre/Post-LS, respectively, would give a 5% difference between nPPG and nK, with a power of 80%. Since cases that could not be analyzed because of noise were estimated to be approximately 5%, we planned to collect data from 100 patients. Statistical analysis was performed using SPSS (SPSS Ja pan Inc., Tokyo, Japan). Multiple regression analysis was done to evaluate the factors that influenced measured and normalized value of PPG amplitude, K, B, and M. The objective variables were measured values (PPG amplitude, K, B, and M at Control, Post-Fentanyl and Post-LS) and normalized values (nPPG, nK, nB, and nM at Post-fentanyl and Post-LS). Dependent variables included age, gender, presence of hypertension, diabetes and cirrhosis, hemoglobin concentration, BIS, and targeted propofol concentration, which were selected by the Stepwise method. When the F probability of the dependent variable was 0.05 or less, the

78 R. Nakamura et al
dependent variable was adopted, while the dependent variable was removed when the F probability of the dependent variable was 0.10 or greater. Standardized partial regression coefficients of the adopted dependent variables and determination coefficients were obtained. When performing comparisons of measurements between events, PPG amplitude, K, B, and M at Control, Post-
Table 2. Preoperative characteristics and perioperative measurements
Age (years)
Gender (Male/Female)
Hypertension (Yes/No)
Diabetis mellitus (Yes/No)
Liver cirrhosis (Yes/No)
MBP (mmHg) pp (mmHg)
Hb (g dl-1)
BIS
Propofol target concentration (ng mI-1)
63.2±13.2 72/22
25/69 20/74 22/72
85.1±11.0
52.0±14.0
11.5±1.8
47.7±10.9
2.5±0.5
Values shown represent the mean (SD) or a number (n). MBP, mean blood pressure for 3 preoperative days; PP, pulse pressure for 3 preoperative days; Hb, hemoglobin measured at the induction of anesthesia. BIS and targeted propofol concentration were obtained at the time of Control value acquisition for each subject.
fentanyl and Post-LS were compared within each parameter. When comparisons were conducted between parameters, the response of PPG amplitude, K, B, and Mat fentanyl administration and laryngoscopy were compared within each event. Comparisons were performed using a Wilcoxon signed-rank test with Bonferroni's correction and the level of significance was set at p<0.05.
RESULTS
A total of 111 patients were enrolled in this study, with 11 excluded from registration for receiving vasopressors (n=5), difficult mask ventilation (n=4), and arrhythmia (n=2). Of the 100 registered patients, 6 were excluded from analysis because of contaminating noise. Thus, demographic data from the remaining 94 patients (Table 2), and the determination coefficients for each measurement and standard regression coefficients of the dependent variables (Table 3) are presented. Though all parameters of Control and Post-fentanyl and PPG amplitude and B of PostLS had a significant regression model, nK and nB did not have a significant regression model. Gender, presence of hypertension, and presence of liver cirrhosis were significantly related
Table 3. Multiple regression analysis results
Measured values
Control
Post-fentanyl
Post-LS
Normalized values
Post-Fentanyl
Post-LS
Objective variables
PPG K B M
PPG K B M
PPG K B M
nPPG nK nB nM
nPPG nK nB nM
Coefficient of Age determination
0.05 0.1 0.32 0.18 0.28 0.07
0.11 -0.29 0.15 0.24 0.18 0.28 0.08 0.28
0.09
0.04 0.21
0.05
0.04
0.04
Standard partial regression coefficient of each dependent variable
Gender HT DM LC Hb BIS Propofol
-0.23
0.24 0.27
0.23 0.23 0.24
0.31
-0.2 -0.24
-0.23
-0.23
The coefficients of determination for measured values and normalized values of PPG amplitude, K, B, and M for the
Control, Post-fentanyl and Post-LS measurements are shown. Each row shows each regression model. The dependent
variables removed from regression had no standard partial regression coefficient. The regression without the coeffi
cient of determination had no significant regression model. PPG, amplitude of photoplethysmogram; K, stiffness of arterial wall; B, viscosity of arterial wall; M, inertia of arte
rial wall; nPPG, normalized PPG amplitude; nK, normalized K; nB, normalized B; nM, normalized M; HT, presence
of hypertension; DM, presence of diabetes mellitus; LC, presence of liver cirrhosis; Hb, hemoglobin measured at the
induction of anesthesia; BIS, BIS obtained at the time of Control value acquisition for each subject; Propofol, targeted
propofol concentration obtained at the time of Control value acquisition for each subject.
Arterial Impedance as a Stress Monitor 79
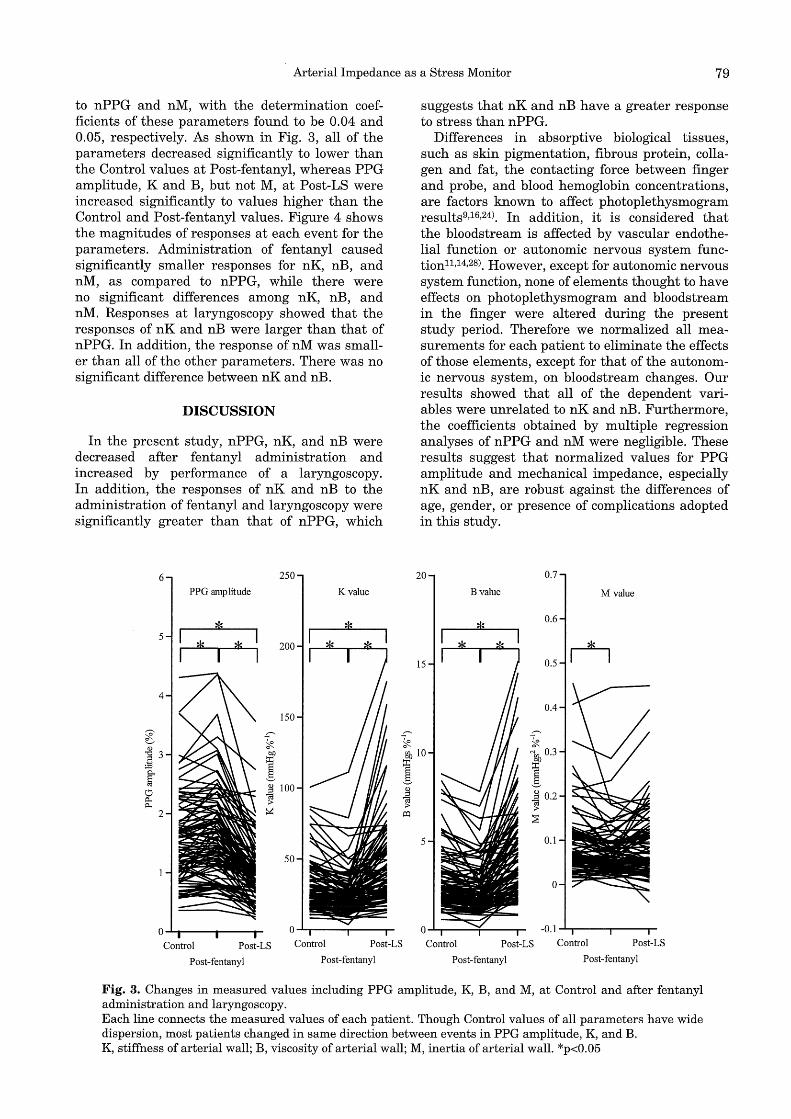
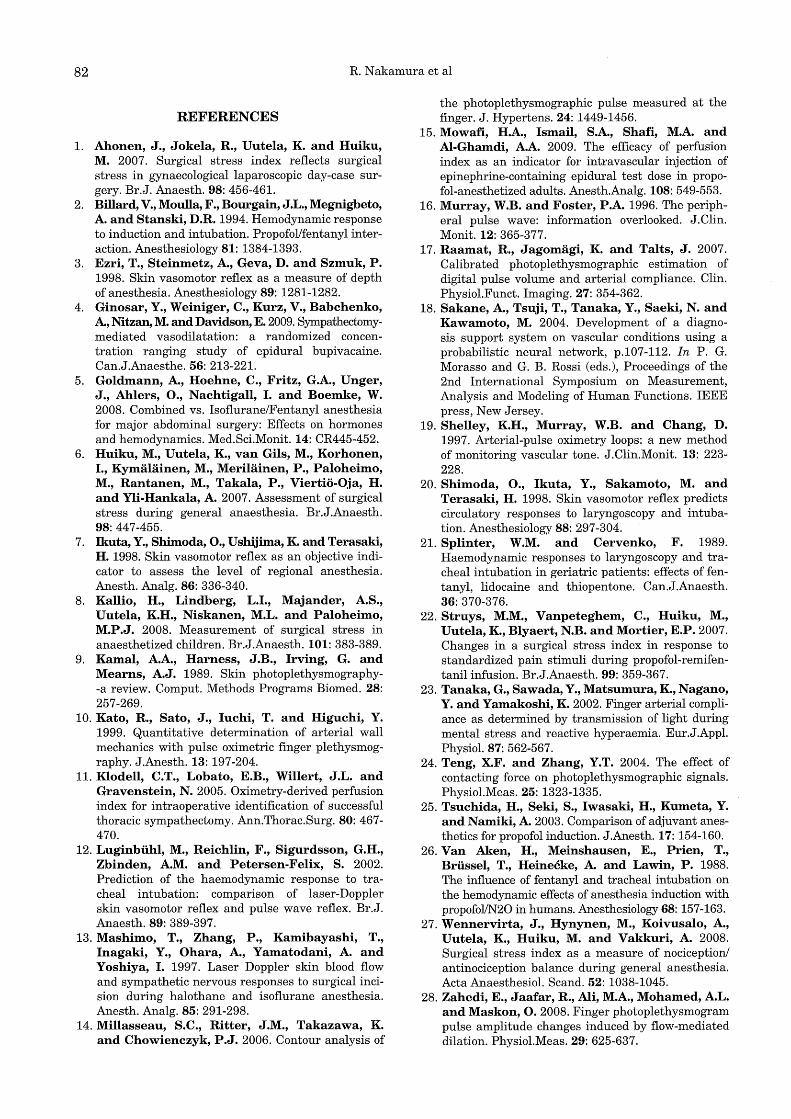
to nPPG and nM, with the determination coefficients of these parameters found to be 0.04 and 0.05, respectively. As shown in Fig. 3, all of the parameters decreased significantly to lower than the Control values at Post-fentanyl, whereas PPG amplitude, Kand B, but not M, at Post-LS were increased significantly to values higher than the Control and Post-fentanyl values. Figure 4 shows the magnitudes of responses at each event for the parameters. Administration of fentanyl caused significantly smaller responses for nK, nB, and nM, as compared to nPPG, while there were no significant differences among nK, nB, and nM. Responses at laryngoscopy showed that the responses of nK and nB were larger than that of nPPG. In addition, the response of nM was smaller than all of the other parameters. There was no significant difference between nK and nB.
DISCUSSION
In the present study, nPPG, nK, and nB were decreased after fentanyl administration and increased by performance of a laryngoscopy. In addition, the responses of nK and nB to the administration of fentanyl and laryngoscopy were significantly greater than that of nPPG, which
6 250
PPG amplitude K value
!ls !ls 5
!ls rJs 200
4
150 ,......._ ,......._
~ ~ .g 3 bJ)
;:El I ~ ;g 100 tJ c;J 11< ;> 11<
~ 2
50
0-'-ti-------Control Post-LS Control Post-LS
Post-fentanyl Post-fentanyl
,......._
~
suggests that nK and nB have a greater response to stress than nPPG.
Differences in absorptive biological tissues, such as skin pigmentation, fibrous protein, collagen and fat, the contacting force between finger and probe, and blood hemoglobin concentrations, are factors known to affect photoplethysmogram results9,16,24). In addition, it is considered that the bloodstream is affected by vascular endothelial function or autonomic nervous system function 11,14,28). However, except for autonomic nervous system function, none of elements thought to have effects on photoplethysmogram and bloodstream in the finger were altered during the present study period. Therefore we normalized all measurements for each patient to eliminate the effects of those elements, except for that of the autonomic nervous system, on bloodstream changes. Our results showed that all of the dependent variables were unrelated to nK and nB. Furthermore, the coefficients obtained by multiple regression analyses of nPPG and nM were negligible. These results suggest that normalized values for PPG amplitude and mechanical impedance, especially nK and nB, are robust against the differences of age, gender, or presence of complications adopted in this study.
20 0.7
Bvalue M value
!ls 0.6
15 0.5 n 0.4
,-...,
~ g}j 10 "'gji 0.3
I I ~ ~ 0.2 ;> ;>
o::i :;s
5 0.1
0
-0.1 ......... --.......-----.-
Control Post-LS Control Post-LS
Post-fentanyl Post-fentanyl
Fig. 3. Changes in measured values including PPG amplitude, K, B, and M, at Control and after fentanyl administration and laryngoscopy. Each line connects the measured values of each patient. Though Control values of all parameters have wide dispersion, most patients changed in same direction between events in PPG amplitude, K, and B. K, stiffness of arterial wall; B, viscosity of arterial wall; M, inertia of arterial wall. *p<0.05

80 R. Nakamura et al
We found that nK and nB were decreased by a greater degree than nPPG upon fentanyl administration. Administration of fentanyl under propofol anesthesia causes a reduction in blood pressure, systemic vascular resistance, and cardiac output2,25,26>. When blood flow is considered as a slow viscous constant flow through a tube, it is proportional to blood pressure and inversely proportional to the fourth power of the radius according to Hagen-Poiseuille's law. In other words, a decrease in blood pressure reduces blood flow, while reduction of vascular resistance induced by vasodilation increases blood flow. A photoplethysmogram reflects blood flow in the fingertip9,16>. Even when a blood vessel dilates upon opioid administration, the increase in blood flow with vasodilation is counteracted if blood pressure decreases, thus the increase in PPG may become small. In fact, blood pressure was decreased in approximately 90% of the present subjects after opioid administration (data not shown). On the other hand, mechanical impedance can detect changes in vascular smooth muscle contraction induced by changes in sympathetic nervous activity, while eliminating the influence of blood pressure changes.
The magnitude of the responses to laryngoscopy for nK and nB were significantly greater than that for nPPG. N ociceptive stimuli cause contraction of peripheral arteries as a result of stress response, thereby decreasing blood flow to the skin13, 20>. Although a laser Doppler flow meter has
100 F entany 1 response Laryngoscopy response
10
*
0.1....._ ______ _
nPPG nK nB nM nPPG nK nB nM
Fig. 4. Comparison of magnitudes of responses between parameters. The magnitudes of responses to each event were compared by determining the ratio of normalized values from preceding event values. The ordinate was expressed as a log scale. Boxes and center lines indicate interquartile range and median value, respectively. Whiskers show minimum and maximum ranges. nPPG, normalized photoplethysmogram amplitude; Nk, normalized stiffness of arterial wall; nB, normalized viscosity of arterial wall; nM, normalized inertia of arterial wall. *p<0.05 in comparison with the other parameters. **p<0.05 in comparison with nK and nB.
been used to monitor skin blood flow in past studies, it is not commonly utilized during surgeries, because the optical fiber is expensive and difficult to handle. Recently, a photoplethysmogram examination with a pulse oximeter has attracted attention as a simple and convenient stress response monitorl,s,4,6,s,n,i2,15,22,27>, In the present study, we measured mechanical impedance from a pulse oximeter by using a DAP waveform, which is commonly used for monitoring during operations, together with it. Based on our results, we propose that both nK and nB be considered as new stress response monitors that are more sensitive than nPPG.
Unlike Kand B, M did not change with laryngoscopy stimulation. M is a parameter that indicates inertia in mechanical impedance, while inertia in a vascular mechanical impedance model represents the change in density per unit of area in the radial direction of the vessel walls. Vasoconstriction increases vascular wall density per area unit by smooth muscle contraction. However, this change is considered to be extremely small, thus it is not clear whether a change in inertia by dilation or contraction is actually detectable. In our study, M was decreased upon fentanyl administration, whereas no significant change was observed with the laryngoscopy, suggesting that this parameter is not useful for monitoring stress response.
In the present study, sampled values were normalized by calculating the ratio of each measurement relative to the Control value. However, since Control values were determined for each subject and differed among them, we could not compare the magnitude of stress response among the subjects. In previous evaluations of stress response, a surgical stress index was proposed6,s,22,27) in which PPG amplitude was the main element, as in the present study. The surgical stress index normalizes each value with a reference value6), a part of which is determined by the measured value of each patient, while the remaining values are determined based on a data pool collected from other patients. In contrast, we did not use a data pool of measurements obtained from other patients to determine the individual Control values for patients, because the individual differences in PPG amplitude and mechanical impedance were large and irregular. In order to develop a monitoring method that can compare stress responses among patients, it is important to develop a normalization method that is much less dependent on individual patients.
When a blood vessel shrinks blood pressure increases, thereby increasing the tension of the vessel walls. If a blood vessel is considered to be structured like an elastic pipe, it is expected that both stiffness and viscosity will increase when the vessel shrinks. In the present study, nK and nB

Arterial Impedance as a Stress Monitor 81
showed similar changes, and their clinical meaning could not be distinguished, thus further studies are needed.
In the present study, correlations between all parameters and dependent variables were low. Since the variability of nK and nB after performance of fentanyl administration and a laryngoscopy were much greater than that of nPPG, we propose that both nK and nB are sensitive stress response indicators.
ACKNOWLEDGEMENTS
We are grateful to Mr. Teiji Ukawa (NIHON KOHDEN) for his knowledge and support regarding the monitoring equipment, and Mr. Akira Sakane, PhD, for his skill in software programming.
(Received September 24, 2009) (Accepted December 11, 2009)
APPENDIX
1. Mode ling arterial dynamic characteristics. We propose a procedure to estimate the charac
teristics of arterial dynamics using a mechanical impedance model. In this method, which considers only the characteristics of the arterial wall in an arbitrary radial direction, the impedance characteristics can be expressed based on radial force and wall displacement, as follows:
F(t )= Mr(t )+ Br(t )+ K(r(t )- re)·· .(1) where F(t) is the force of the blood flow on the arterial wall, and M, B, and K represent inertia, viscosity, and stiffness, respectively; r(t), r(t), r(t) are the position, velocity, and acceleration of the arterial wall, respectively, and re is the arterial radius with zero pressure. When using to to denote the start time of displacement, the dynamic characteristics of the blood vessel at time t are expressed as follows:
dF(t)= Mdr(t)+ Bdr(t)+ Kdr(t).. ·(2) where dr(t)= r(t)-t(toJ dr(t)= r(t)-r(toJ dr(t)= r(t)- r(toJ and dF(t)= F(t)- F(tJ When estimating impedance parameters using (2), F(t) and r(t) must be measured. Assuming that arterial pressure is proportional to force, F(t) can be expressed as follows:
F(t)= k1~ (t} · ·(3) where kr is a proportionality constant and Pb(t) is arterial pressure.
2. Photoplethysmogram. Directly measuring r(t) is difficult in a clinical
setting. Therefore, the arterial radius is estimated from a photoplethysmogram with this protocol. Using Lambert-Beer's law, the change in absorbance M(t) can be expressed as follows:
L1A(t)=A(t)-AD = log(ID!(ID - /JJ(f )))= ECiW(t} · ·( 4) where A(t) is absorbance, An is absorbance due to the arterial diameter of D, C is the density of light absorbing material, D is the arterial diameter, E is an absorbance constant unique to the material, In is the intensity of transmitted light on a blood vessel with diameter D, and 11D(t) is the change in arterial diameter. A photoplethysmogram measures M(t). When simply assuming that the arterial radius is proportional to the photoplethysmogram, then the photoplethysmogram Pz(t) can be expressed as follows:
~ (t)= kprv (t). · · (5) where kp is a proportionality constant and ru(t) is the sum of all arterial radii at the measurement location.
3. Impedance model. Using arterial pressure Pb (t) (of (3)) as the force
acting on the arterial wall and photoplethysmogram Pz (t) (of (5)) for the arterial radius, arterial wall impedance is estimated from the following equation:
d~ (t)=Kdf1(t)+BdA(t)+ifdl1(t}. ·(6) where
and
d~ (t) = ~ (t)-~ (t0 ) df1(t)= ~ (t)-~ (t0 ) dA (t)= A (t)-A (t0 ) dl1(t)=11 (t)-11 (t0 )
4. Fitting In this method, the impedance parameters
K, B, and M are estimated using Pb(t) and Pz(t). The electrocardiogram, invasive arterial pressure (Pb(t)), and photoplethysmogram (Pz(t)) were simultaneously measured. All Pb(t) and Pz(t) values obtained in the interval between the R wave and subsequent R wave were used as a dataset. Impedance parameters were estimated by least square fitting using a dataset and (6). Without noisy waveform data, almost all of the correlation coefficient of real Pb(t) and estimated Pb(t) was greater than 0.95. Therefore, if the correlation coefficient of a dataset was under 0.95, the dataset was interpreted as noise contaminated data and excluded. In this study, we describe K, B, M as K, B, and M, respectively.
82 R. Nakamura et al
REFERENCES
1. Ahonen, J., Jokela, R., Uutela, K. and Huiku, M. 2007. Surgical stress index reflects surgical stress in gynaecological laparoscopic day-case surgery. Br.J. Anaesth. 98: 456-461.
2. Billard, V., Moulla, F., Bourgain, J.L., Megnigbeto, A. and Stanski, D.R. 1994. Hemodynamic response to induction and intubation. Propofol/fentanyl interaction. Anesthesiology 81: 1384-1393.
3. Ezri, T., Steinmetz, A., Geva, D. and Szmuk, P. 1998. Skin vasomotor reflex as a measure of depth of anesthesia. Anesthesiology 89: 1281-1282.
4. Ginosar, Y., Weiniger, C., Kurz, V., Babchenko, A., Nitzan, M. and Davidson, E. 2009. Sympathectomymediated vasodilatation: a randomized concentration ranging study of epidural bupivacaine. Can.J.Anaesthe. 56: 213-221.
5. Goldmann, A., Hoehne, C., Fritz, G.A., Unger, J., Ahlers, 0., Nachtigall, I. and Boemke, W. 2008. Combined vs. Isoflurane/Fentanyl anesthesia for major abdominal surgery: Effects on hormones and hemodynamics. Med.Sci.Monit. 14: CR445-452.
6. Huiku, M., Uutela, K., van Gils, M., Korhonen, I., KymaUiinen, M., Merilainen, P ., Paloheimo, M., Rantanen, M., Takala, P., Viertio-Oja, H. and Yli-Hankala, A. 2007. Assessment of surgical stress during general anaesthesia. Br.J.Anaesth. 98: 447-455.
7. Ikuta, Y., Shimoda, 0., Ushijima, K. and Terasaki, H. 1998. Skin vasomotor reflex as an objective indicator to assess the level of regional anesthesia. Anesth. Analg. 86: 336-340.
8. Kallio, H., Lindberg, L.I., Majander, A.S., Uutela, K.H., Niskanen, M.L. and Paloheimo, M.P.J. 2008. Measurement of surgical stress in anaesthetized children. Br.J.Anaesth. 101: 383-389.
9. Kamal, A.A., Harness, J.B., Irving, G. and Mearns, A.J. 1989. Skin photoplethysmography-a review. Comput. Methods Programs Biomed. 28: 257-269.
10. Kato, R., Sato, J., Iuchi, T. and Higuchi, Y. 1999. Quantitative determination of arterial wall mechanics with pulse oximetric finger plethysmography. J.Anesth. 13: 197-204.
11. Klodell, C.T., Lobato, E.B., Willert, J.L. and Gravenstein, N. 2005. Oximetry-derived perfusion index for intraoperative identification of successful thoracic sympathectomy. Ann.Thorac.Surg. 80: 467-470.
12. Luginbiihl, M., Reichlin, F., Sigurdsson, G.H., Zbinden, A.M. and Petersen-Felix, S. 2002. Prediction of the haemodynamic response to tracheal intubation: comparison of laser-Doppler skin vasomotor reflex and pulse wave reflex. Br.J. Anaesth. 89: 389-397.
13. Mashimo, T., Zhang, P., Kamibayashi, T., Inagaki, Y., Ohara, A., Yamatodani, A. and Y oshiya, I. 1997. Laser Doppler skin blood flow and sympathetic nervous responses to surgical incision during halothane and isoflurane anesthesia. Anesth. Analg. 85: 291-298.
14. Millasseau, S.C., Ritter, J.M., Takazawa, K. and Chowienczyk, P.J. 2006. Contour analysis of
the photoplethysmographic pulse measured at the finger. J. Hypertens. 24: 1449-1456.
15. Mowafi, H.A., Ismail, S.A., Shafi, M.A. and Al-Ghamdi, A.A. 2009. The efficacy of perfusion index as an indicator for intravascular injection of epinephrine-containing epidural test dose in propofol-anesthetized adults. Anesth.Analg. 108: 549-553.
16. Murray, W.B. and Foster, P.A. 1996. The peripheral pulse wave: information overlooked. J.Clin. Monit. 12: 365-377.
17. Raamat, R., Jagomagi, K. and Talts, J. 2007. Calibrated photoplethysmographic estimation of digital pulse volume and arterial compliance. Clin. Physiol.Funct. Imaging. 27: 354-362.
18. Sakane, A., Tsuji, T., Tanaka, Y., Saeki, N. and Kawamoto, M. 2004. Development of a diagnosis support system on vascular conditions using a probabilistic neural network, p.107-112. In P. G. Morasso and G. B. Rossi (eds.), Proceedings of the 2nd International Symposium on Measurement, Analysis and Modeling of Human Functions. IEEE press, New Jersey.
19. Shelley, K.H., Murray, W.B. and Chang, D. 1997. Arterial-pulse oximetry loops: a new method of monitoring vascular tone. J.Clin.Monit. 13: 223-228.
20. Shimoda, 0., Ikuta, Y., Sakamoto, M. and Terasaki, H. 1998. Skin vasomotor reflex predicts circulatory responses to laryngoscopy and intubation. Anesthesiology 88: 297-304.
21. Splinter, W.M. and Cervenko, F. 1989. Haemodynamic responses to laryngoscopy and tracheal intubation in geriatric patients: effects of fentanyl, lidocaine and thiopentone. Can.J.Anaesth. 36: 370-376.
22. Struys, M.M., Vanpeteghem, C., Huiku, M., Uutela, K., Blyaert, N.B. and Mortier, E.P. 2007. Changes in a surgical stress index in response to standardized pain stimuli during propofol-remifentanil infusion. Br.J.Anaesth. 99: 359-367.
23. Tanaka, G., Sawada, Y., Matsumura, K., Nagano, Y. and Yamakoshi, K. 2002. Finger arterial compliance as determined by transmission of light during mental stress and reactive hyperaemia. Eur.J.Appl. Physiol. 87: 562-567.
24. Teng, X.F. and Zhang, Y.T. 2004. The effect of contacting force on photoplethysmographic signals. Physiol.Meas. 25: 1323-1335.
25. Tsuchida, H., Seki, S., Iwasaki, H., Kumeta, Y. and Namiki, A. 2003. Comparison of adjuvant anesthetics for propofol induction. J.Anesth. 17: 154-160.
26. Van Aken, H., Meinshausen, E., Prien, T., Briissel, T., Heinecke, A. and Lawin, P. 1988. The influence of fentanyl and tracheal intubation on the hemodynamic effects of anesthesia induction with propofol/N20 in humans. Anesthesiology 68: 157-163.
27. Wennervirta, J., Hynynen, M., Koivusalo, A., Uutela, K., Huiku, M. and Vakkuri, A. 2008. Surgical stress index as a measure of nociception/ antinociception balance during general anesthesia. Acta Anaesthesiol. Scand. 52: 1038-1045.
28. Zahedi, E., Jaafar, R., Ali, M.A., Mohamed, A.L. and Maskon, 0. 2008. Finger photoplethysmogram pulse amplitude changes induced by flow-mediated dilation. Physiol.Meas. 29: 625-637.