Embed Size (px)
Citation preview

742 / EDUCATION Item 327~44
EDUCATION
Summary of state education expenditures ............................... . Federal support to California schools ....................................... . State and local support to public schools ................................ .. Department of Education ............................................................. .
Summary of issues ....................................................................... . Budget Act items ....................................................................... . Overall expenditures ................................................................. . Program I-Instruction ............................................................. .
A. Child development ....................... ; ................................... . B. Educationally disadvantaged ......................................... . C. Special education ............................................................. . D. Vocational education ....................................................... . E. General education .................................... ~ ........................ .
Program II-Instructional support ......................................... . Program III-School administration support.. ................. ' .... . Program IV-School finance and state aid ........................ .. Program V-Library services ................................................. . Program VI-Departmental. management ........................... .
Contribution to Teachers' Retirement ..................................... . Commission on Teacher Preparation and Licensing ............. .
SUMMARY OF STATE EXPENDITURES FOR EDUCATION
Page 743 745 745 748 750 753 754 757 757 764 778 791 794 800 808 810 814 816 823 824
California's system of public education is composed of elementary, secondary and unified school districts; the community colleges; the California State University and Colleges; the University of California; the California Maritime Academy; and the state-operated schools for handicapped children. Support £or education is deriv~d from a variety of sources, including the State School Fund, local property taxes, state General Fund appropriations, and programs of federal· aid.
In 1974-75, state expenditures for education continue to account for the largest share of the budget dollar. The budget summaries which follow indicate that in 1974-75 more than $3.8 billion will be spent by the State of California for all facets of education. Budget summaries indicate that such expenditures represent 46.9 percent of the proposed General Fund expenditures during the budget year and 39.4 percent of all expenditures. These amounts include (1) support for the University of California, the California State University and Colleges, the public school system and state special schools, (2) support for special programs such as the MillerUnruh Basic Reading Act, compensatory education, vocational education, debt service on public school bonds and (3) capital outlay expense for the university, the state colleges and the state-operated schools for handicapped children. Table 1 shows total state operational expenditures and subventions from the General Fund for the past fiscal year, estimated expenditures for the current year and the amounts proposed for 1974-75 associated with education.
Table 2 shows capital outlay for the same three-year period. Summary information in Table 3 indicates that a total expenditure of
$3,845 million is estimated for the budget year, which is an increase of,2.8 percent over the current year.

Items 327-344 EDUCATION / 743
Table 1 General 'Fund Expenditures for Education
Actual Estimated Proposed Chan!I.e from 1973-74 197~7J 1973-74 1974-75 Amount Percent
State Operations Department of Education $8,~31,745 $14,039,642 $13,984,849 $-54,793 -0.4 Special schools """,,,,,,,,,,,,,, 9,330,117 10,833,815 12,032,347 +1,198,532 +11.1 Commission for Teacher
Preparation and Li-censing ,." ....... "."." .. " ... 20,000 -20,000 -100.0
Coordinating Counsel for Higher Education """ 527,753 487,291 -487,291 -100.0
Postsecondary Education Commission """"""""" 215,227 858,625 +643,398 +298,9
Western Interstate Com-mission, for Higher Education." ... ".".""" .. " 15,000 28,000 28,000
University of California "" 384,705,421 454,305,363 474,390,015 +20,084,652 +4.4 Hastings College of Law " 1,700,539 2,216,364 2,475,916 +259,552 +11.7 California State University
and Colleges """""""" 373,180,600 444,860,573 454,583,504 +9,722,931 +2.2 California Maritime
Academy."""""""""". 1,008,018 1,263,055 1,280,531 +17,476 +1.4 California Community
Colleges ""''''''''','''''''''' 970,330 1,139,358 1,266,690 +127,332 +11.2 State Scholarship and Loan
Commission """""""'''' 28,479,925 38,703,838 42,988,952 +4,285,114 +11.1
Totals-State Opera-tions"""""."""""""". $808,849,448 $968,112,526 $1,003,889,429 $+35,776,903 +3.7
Subventions K-12 apportionments """" $1,579,262,193 $2,197,971,966 $2,068,656,612 $- 1"29,315,354 -5.9 Community college appor-
tionments """"""""."". (188,066,262) .(259,592,870) 307,329,173 +307,329,173 +100,0 Novato Unified School Dis-
trict ."".".""."""".".""" 628,000 -628,000 -100.0 Continuous schools pro-
gram """"."""".".",:"." 800,000 800,000 Loans to school districts"" 291,670 -343,150 -271,396 +71,754 +20.9 Bilingual-bicultu~al ad-
ministration """'''''''''''' 140,000 141,6!)5 143,335 +1,670 +1.2 Bilingual education pro-
gram "".".""""""""."". 913,800 3,886,200 4,000,000 +113,800 +2.9 Indian education program 82,000 322,226 260,590 -61,636 -19.1 Abstract conceptually ori-
ented mathematics program "."""""""""". 494,989 315,000 -315,000 "-100.0
Instructional television """ 567,128 570,000 570,000 Project SHARE"."."."""."" 500,000 400,000 -400,000 -100.0 Compensatory education" 10,424,615 10,818,000 3,045,000 -7,773,000 -71.9 Special elementary scpool
reading program """" 18,399,069 18,399,625 15,349,625 -3,050,000 -16.6 Bilingual aids".""""""".""" 243,000 +243,000 +100.0 Child development """""" 7,414,443 42,693,2&~ 43,036,761 +343,478 +0.8 Grants to teachers of hand-
icapped children "~"."",, 105,556 Pilot program for severely
retarded """""".".,,,,,.,,,,,, 155,000 -155,000 -'-100.0 free textbooks """"".".""" 13,063,417 23,989,497 25,241,939 +1,252,442 +5.2

744 / EDUCATION Items 327-344
Assistance to Pllblic librar-ies ........................................ 800,000 1,000,000 1,000,000
Vocational education ........ 500,000 425,000 425,000 Career guidance centers .. 82,137 38,976 -43,161 -52.5 Assistance to new commu-
nity colleges .................... 326,370 -326,370 -100.0 Contributions to teachers'
retirement ........................ 135,000,000 135,000,000 135,000,000 Debt service on public
school building bonds .... 48,488,764 46,272,299 47,999,799 +1,727,500 +3.7 Community colleges ex-
tended opportunity pro-gram .................................. 4,850,000 6,170,500 6,170,500
Totals-Subventions .. $1,821,297,644 $2,490,023,618 $2,659,038,914 $+169,015,296 +6.8 GRAND TOTALS .................. $2,630,147,092 $3,458,136,144 $3,662,928,343 $+204,792,199 +5.9
Table 2 Capital Outlay for Education
Actual Estimated Proposed Change from 197.3-74 197~73 197.3-74 1974-75 Amount Percent
University of California: General Fund ...................... $3,093,500 $4,806,500 $-4,806,500 -HlO.O Tideland oil· revepues ........ 1,893,000 7,331,000 $12,000,000 +4,669,000 +63.7 Educati(;mal fee funds ........ 32,140,000 12,922,000 15,690,000 +2,768,000 +21.4 Health sciences bond
funds .................................. 220,800 73,548,200 40,918,000 -32,630,200 -44.4 Withholding tax revenues 4,785,009 12,743,991 16,197,000 +3,453,009 +27.1
State University and Col-leges:
General Fund ...................... 81,013 20,774 -20,774 -100.0 Tideland oil revenues ........ 22,062,293 69,999,028 10,505,000 -59,494,028 -85.0 Construction bond funds .. -446,503 453,955 -453,955 -100.0 Withholding tax revenues 23,967,000 22,307,000 -1,660,000 -6.9
Community Colleges: Construction bond funds .. 27,313,685 73,638,137 44,054,600 -29,583,537 -40.2
Special Schools: Tideland oil revenues ........ 3,100,000 19,942,000 + 16,842,000 +543.3
California Maritiine Acade-my:
General Fuml ...................... 12,501 75,000 +75,000 +100;0
Totals .......................................... $91,155,298 $282,530,585 $181,688,600 $-100,841,985 -35.7 General Fund ...................... 3,187,014 4,827,274 75,000 -4,752,274 -98.4 Capital Qutlay Fund for
Public Higher Educa-tion:
A. TideliJ'nd oil reve-nues .............................. 23,955,293 80,430,028 42,447,000 -37,983,028 -47.2
B. Withholding tax revenues ...................... 4,785,009 36,710,991 38,504,000 +1,793,009 +4.9
Educational fee funds ........ 32,140,000 12,922,000 15,690,000 +2,768,000 +21.4 Health sciences bond
funds ........... ~; ..................... 220,800 73,548,200 40,918,000 -32,6.30,200 -44.4 ConstructJon bond funds .. 26,867,182 74,092,092 44,054,600 -30,037,492 -40.5
--, Items 327-344
Table 3 Total State Expenditures for Education
State operations .................... .. Subventions ............................ .. Capital outlay ........................ ..
Totals ..................................... .
Actual Estimated Proposed 197~73 1973-74 1974-75
$808,849,448 $968,112,526 $1,003,889,429 1,821,297,644 2,490,023,618 2,659,038,914
91,155,298 282,530,585 181,688,600
$2,721,302,390 $3,740,666,729 $3,844,616,943
EDUCATION / 745
Change from 1973-74 . Amount Percent
$+35,776,903 +3.7 +169,015,296 +6.8 -100,841,985 -35.7
$+103,950,214 +2.8
General Fund.......................... $2,633,334,106 $3,462,963,418 $3,663,003,343 $+200,039,925 +5.8
Capital Outlay Fund for Pub-lic Higher Education:
A. Tideland oil revenues .. $23,955,293 $80, 430, 028 $42,447,000 $-37,983,028 -47.2 B. Withholding tax reve-
nues .......................... 4,785,009 36,710,991 38,504,000 +1,793,009 +4.9 Educational fee funds ............ 32,140,000 12,922,000 15,690,000 +2,768,000 +21.4 Health sciences bond funds 220,800 73,548,200 40,918,000 -32,630,200 -44.4 Construction bond funds ...... 26,867,182 74,092,092 44,054,600 -30,037,492 -40.5
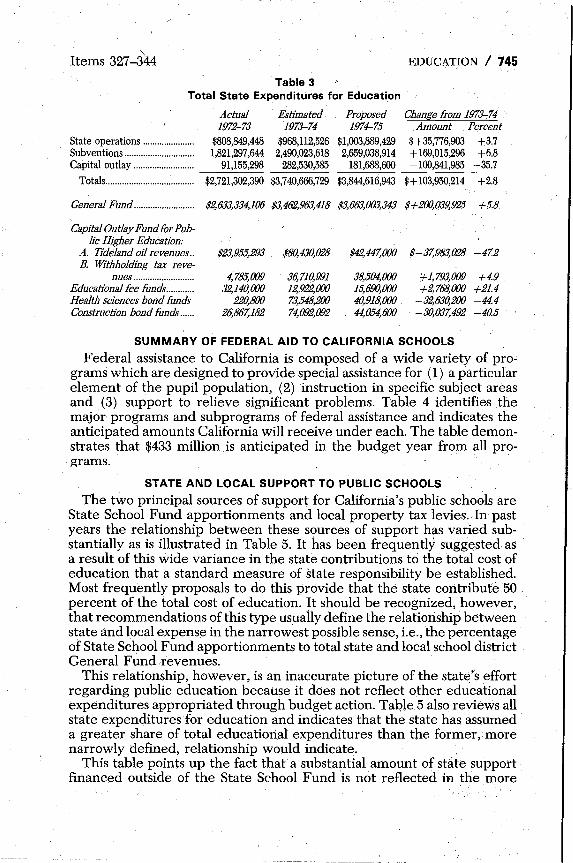
SUMMARY OF FEDERAL AID TO CALIFORNIA SCHOOLS
Federal assistance to California is composed of a wide variety of programs which are designed to provide special assistance for (1) a particular element of the pupil population, (2) instruction in specific subject areas and (3) support to relieve significant problems. Table 4 identifies the major programs and subprograms of federal assistance and indicates. the anticipated amounts California will receive under each. The table demonstrates that $433 million is anticipated in the budget year from all programs.
STATE AND LOCAL SUPPORT TO PUBLIC SCHOOLS
The two principal sources of support for California's public schools are State School Fund apportionments and local property tax levies. In past years the relationship between these sources of support has varied substantially as is illustrated in Table 5. It has been frequently suggested as a result of this wide variance in the state contributions to the total cost of education that a standard measure of state responsibility be established. Most frequently proposals to do this provide that the state contribute 50 percent of the total cost of education. It should be recognized, however, that recommendations of this type usuaily define the relationship between state and local expense in the narrowest possible sense, i.e., the percentage of State School Fund apportionments to total state and local school district General Fund ,revenues.
This relationship, however, is an inaccurate picture of the state's effort regarding public education because it does not reflect other educational expenditures appropriated through budget action. Taqle 5 also reviews all state expenditures for education and indicates that the state has assumed a greater share of total educatiorial expenditures than the former, more narrowly defined, relationship would indicl1te.
This table points up the fact that a substantial amount of state support financed outside of the State School Fund is not reflected in the more

746 / EDUCA nON Iterns 327-344
narrow relationship. For example, in 1972-73 approximately $242 rnillion was spent for categorical aid programs such as compensatory education, contributions to teache:rs' retirement and free textbooks in addition to State School Fund apportionments.
Table 4 Federal Support to California Public Schools
Actual Estimated Estimated Program 197~73 1973-74 1974-75
Elementary and Secondary Education Act: Title I: Compensatory Education .
Low-income families (disadvantaged) .................. $113,468,998 $119,736,620 $119,736,620 In schools for handicapped ...................................... 1,625,616 1,477,000 1,477,000 In institutions for delinquent... ................................. 1,648,046 1,688,000 1,688,000 Migrant-assistance to impacted districts ............ 7,474,812 8,501,500 8,501,500 Migrant-preschool .................................................... 184,350 65,650 65,650 Urban and rural schools : ........... : ............................... 1,774,356 2,226,170 2,226,170 State administration .................................................... 1,586,410 2,399,309 2,448,651
Subtotals, Title I ...................................................... $127,762,588 $136,094,249 $136,143,591 Title II: School Library Resources .............................. 7,950,201 9,173,934 8,030,983 Title III: Supplementary Centers and Services ...... 14,215,069 12,366,567 9,314,902 Title IV: Planning and Evaluation-(Right to Read) 56,440 358,288 365,470 Title V: Strengthening State Department ................ 2,279,181 2,269,628 2,265,133 Title VI: Special Education .......................................... 2,292,132 2,495,219 2,586,397 . Title VII: Bilingual Education ...................................... 10,540,693 10,600,000 12,000,000
Subtotals, ESEA ............................................................ $165,096,304 $173,357,885 $170,706,476 Economic Opportunity Act:
Followthrough programs ............................................ 6,386,983 6,526,202 4,685,416 National Defense· Education Act:
Title ill: Critical Subjects .......................................... 168,257 Education Professions Development Act:
Vocational-Technical ................................................ 623,712 763,662 763,662 Vocational Education Act: . Occupational preparation .......................................... 32,034,979 45,017,092 40,074,J04
Research and development in career education 705,568 705,568 705,568 Adult Education Act (Basic) ........................................ 2,978,937 2,894,786 2,578,526 Manpower Development and Training Act:
Occupational preparation .......................................... 11,569,778 12,370,500 12,370,500 Economic Opportunity Act: .
Headstart.. .................................... : ................................. 28,249,000 30,000,000 30,050,000 Aid to Federally Impacted Areas, PL 874 ................. 80,000,000 80,000,000 80,000,000 Child Nutrition Act of 1966, PL 93-150 ................ ; ..... 82,014,420 89,094,829 89,094,829 Food and nutrition services payments to welfare
agencies ...................................................................... 522,443 432,755 Rural Area Redevelopment Act, PL 87-27 ................ 434,697 2,000,000 2,000,000
Totals, Federal Aid ........................................... : .......... $410,785,078 $443,163,279 $433,029,081

Table 5 Revenues for Public School Support from State and Local Sources
1962-63 Through 1972-73 (Thousands)
Total General Fund revenues of school
districts Other state Total state Year (state and local) • State School Fundb subventions c subventions
1962-63 ...................................... $1,886,167 $762,964 $99,828 $862,792 1963--64 ...................................... 2,193,337 839,341 103,443 942,784 1964-65 ...................................... 2,443,975 937,400 117,880 1,055,280 1965-66 ...................................... 2,663,827 997,288 127,473 1,124,761 196&-67 ...................................... 2,973,706 1,049,793 170,627 1,220,420 1967...Q8 ...................................... 3,403,000 1,271,933 169,579 1,441,512 1968-69 ...................................... 3,699,560 1,315,158 189,810 1,504,968 1969-70 ...................................... 4,067,690 1,432,997 201,851 1,634,848 1970-71 ...................................... 4,491,956 1,518,899 212,991 1,731,890 1971-72 ...................................... 4,829,150 1,500,341 240,794 1,741,135 1972-73 ...................................... 5,198,500 1,770,043 242,968 2,013,011
Percent of . Percent of total state
State School Fund subventions to to total revenue total revenue
40.5% 45.7% 38.3 43.0 38.5 43.4 37.4 42.3 35.3 41.0 37.4 42.4 35.5 AO.7 35.2 40.2 33.8 .38.6 31.1 36.1 34.0 38.7
• From Controller's reports: financial transactions concerning school districts of California, and state budget documents, 1962 to present. b Includes apportionments to California Community Colleges. 'Includes many items funded outside State -School Fund (i.e., free textbooks, child care centers, contributions to Teachers' Retirement Fund, etc.).
>'-< ..... (1)
S rJJ
(j;)
~ :t
trl t:I c::: o d o z .......
~ .....

748 / EDUCATION " Items 327-344
General Fund
Department of Education
STATE OPERATIONS
Requested 1974-75 ........................................................................ .. Estimated 1973-'-74 ........................................................................... . Actual 1972-73 ................................................................................ ..
Requested increase $3,360,254 (16.1 percent) Total recommended reduction ................................................... .
Budget Act Item 327 328 330 331 333
Educational Commission of the States General activities National defense education Special schools State library
State School Building Aid Fund
Budget page
199 195 196 197 199
Program page 1I-381 1I-310 1I-323 1I-331 1I-364
Requested 1974-75 ......................................................................... . Estimated 1973-74 ....................................................................... _ .. .. Actual 1972-73 ................................................................................ ..
Requested decrease $8,224 (2.5 percent) Total recommended reduction .................................................. ..
Budget Act Item 329 School facilities planning
Budget page
198
Program page 1I-349
$24,293,203 20,932,949 17,531,324
-$647,538
Analysis page
822 752 795 785 814
$319,498 327,722 275,521
-$13,313
Analysis page
808

Items 327-344 EDUCATION / 749
Surplus Property Revolving Fund
Requested 1974-75 ......................................................................... . Estimated 1973-74 ........................................................................ ; .. . Actual 1972-73 ................................................................................. .
Requested increase $144,376(2.1 percent) Total recommended reduction ................................................... .
Budget Act Item
Budget page
332 Educational Agency for Surplus Property
General Fund
198
Department of Education
LOCAL ASSISTANCE
Program page
II-354
Requested 1974-75 ......................................................................... . Estimated 1973-74 ........................................................................... . Actual 1972-73 .................................................................................. .
Requested increase $3,533,194 (4.0 percent) Total recommended increase ..................................................... .
Budget Act Item 334 Year· round schools 335 Bilingual education 336 Indian education 337 Instructional television 338 Demonstration programs 339 Early childhood·Miller·Unruh 340 Bilingual aides 341 Child development
Budget page
L-58 L-56 L-57 L-56 L-57 L-57 L-56 L-57
Program page II-353 II-324 II-329 II-349 II-330 II-338
. II-326 II-336
$6,922,618 6,778;242 3,855,912
None
Analysis page
805
$87,822,845 84,289,651 53,565,512
+$240,000
Analysis page 808 777 778 797 767 757 777 757

750 / EDUCATION Items 327-344
California Environmental Program Protection Fund
Requested 1974-75 ........................................................................... . Estimated 1973-74 ........................................................................... . Actual 1972-73 ................................................................................. .
Requested increase $275,000 Total recommended reduction ................................................... .
Budget Act Item 342 Conservation education
Budget page
196
Program page L-56
SUMMARY OF MAJOR ISSUES AND RECOMMENDATIONS
$275,000
None
Analysis page
797
AnaJysis PROGRAM I-INSTRUCTION page
1. Child Development. Recommend continuation of Chap- 758 ter 1191, Statutes of 1973 (AB 1244), funds for 1974-75 program.
2. Preschool. Recommend action subsequent to Depart- 761 ment of Finance report.
3. Demonstration Programs. Delete $2,333,000 from Gen- 767 eral Fund (Item 328). Recommend program reduction from $3,045,000 to $712,000.
4. CQmpensatory Education Administration. Delete $135,000 770 from General Fund (Item 328). Recommend administra-tive staff deletion.
5. Operation SHARE. Recommend evaluation report on 772 March 1, 1974 for fiscal year 1972-73; and on November 30, 1974 for fiscal year 1973-74.
6. Performance Contracting. Delete $250,000 from General 772 Fund (Item 328). Recommend termination of performance contracting program.
7. Bilingual Education. Recommend extension of existing 776 program rather than new legislation.
8. Bilingual Education. Recommend transfer of administra- 777 tion from general education unit to disadvantaged students unit.
9. Bilingual Evaluation. Recommend report on 1972-73 pro- 778 gram by MarchI, 1974; and 1973-74 program by November 30, 1974.
10. Indian Education. Recommend report on 1972-73 pro- 778 gram by March 1, 1974; and 1973-74 program by November 1, ~974.
U. Development Centers. Augment General Fund support 780 (Item 341) by $2.4 million. Rec9mmend full state funding.
12. Special Schools. Reduce Item 389 for construction of sec- 786 ond school for the deaf
13. Deaf Program. Recommend redirection of students to 10- 786 cal programs in accordance with Special Education Master
Plan.

Items 327 --344 EDUCATION / 751
14. Special Education AdministratIon. Delete $14,000 !rom 791 Generaj Fund (item 328). Recommend deletion of funds erroneously included in General 'Fund when reimbursem.ents ceased.
15. MDTA Matching. Recommenddeletioll of $425,000 from 793, General Fund (Item 344) [or matching funds.
16. Area Planning. Recommend joint study between Chan- 793 cellor of the Community Colleges and Department of Education regarding the continuation of area adult continuing
, education coordinating councils and area vocational plan-'u,ing committees with report by December 1, 1974
17. Regional Occupation Centers. Recommend interim leg- 794 islative hearing on legal status of regional occupational centers-programs, high schools and community colleges i:p. the provision of vocational education services.
18. NDEA III Reduce General Fund $96,786 (Item 330). 795 Recommend reduction in state matching funds.
19. Instructional Television. Augment General Fund Item 797 337 by $270,000. Recommend full program funding.
PROGRAM 1I-INSTi=lUCTIONAL SUPPORT 20. Framework Development. Delf?te program expenses of 802
$78,800 (Item 328, General Fund ~$28,OO8, federal funds -$50,000). Eliminate frameworkdevel()pment program in accordance with 1973 legislative gecision.
21. California Editions. ReconUriend the State Printer be re- 803 stricted to print only those materials that will be economi-
, cal to reprint.. ' 22. Textbook Warehouse. Recommend that the Depart~ 804
ments of Education' and General Services reconcile their workload estimates.
23. Food Services. Recommend verification of matching re- 807 quirements. '
PROGRAM III-SCHOOL ADMINISTRATION SUPPORT 24. School Planning. Delete four positions related to decreas- 808
ing workload-$160,OOO (Item 328, -$146,687; Item 329, ~$13,313).
PROGRAM VI-DEPARTMENTAL MANAGEMENT AND SPECIAL SERVICES 25. Program Planning andDevelopment. Delete three pro- 816
fessional and two,ciericai positions -111,017 (Item 328), Recommend deletiori of Organization Redirection Task Force positions. , ,
, 26. Statewide Testing. Augment $232, 735 to provide one pro- ,8'18 fessional position and to provide for scoringgrades2, 3, 6 and 12 tests (federal funds--::$200,0OO). (Item 328, $32,735).
27. Budgeting. Recommend department report on failure to 819 comply with legislative directive.
28. Out-of-State TraveL Redllce $53,244 in Item 328 (General 820 Fllnd-$5,ooo, federal funds ~$48,244).

752 / EDUCATION Items 327-344
DEPARTMENT OF EDUCATION-Continued
29. Board of Education. Delete $~OOO for personnel secretar- 821 ial aid in Item 328.
30. Commission of States. Recommend report on benefits to 822 California.
Summary of Recommended Fiscal Changes to 1974-75 Budget
Program or activity Performance contracting .. Demonstration programs .. Compensatory education .. Development centers ........ Special education adminis·
tration .......................... .. Manpower Development
Training Act .............. .. National Defense Educa-
tion .............................. .. , Instructional television .... ..
Framework development School planning ................ .. Program planning and de-
velopment .................. .. State testing program ....... . Out-of-state travel ............. . State Board of Education ..
Increases .......................... . Decreases ....................... ..
Net decrease .................. ..
Amount -$250,000
-$2,333,000 -135,000
+2,400,000
-14,000
-425,000
-96,786 +270,000 -78,800
-160,000
-1ll,017 +232,735 -53,244 -4,000
+$2,902,735 -3,660,847
-$758,112
GENERAL PROGRAM STATEMENT
General Fund
-$250,000 - $2,333,000
-135,000 +2,400,000
-14,000
-425,000
-96,786 +270,000 -28,800
-146,687
" +32,735 -5,000 -4,000
+$2,702,735 -3,438,273
-$735,538
State School Bw7ding Aid Fund
-$13,313
$-13,313
. -$13,313
Federal funds
-$50,000
-1ll,017 +200,000 -48,244
$+200,000 -209,261
$-9,261
The budget of the State Department of Education is composed of both state operation and local assistance items. State operation items provide support for state-level administration of the public school system, the State Library, the state special schools, national defense education and the Educational Commission of the States. The local assistance items provide for various subvention programs of state interest. The regular state school apportionments (K-14) which will total approximately $2.38 billion in 1974-75 are not appropriated in the Budget Act. Table 1 displays all

Items 327-344 EDUCATION'/ 753
Budget Act items related to the State Department of Education for state operations and local assistance.
Table 1 State Department of Education
1974 Budget Act Items
Budget Act Item
State Operations: Purpose
327 Educational Commission of the States ................... . 328 General Activities ......................................................... . 329 State School Building Aid ........................................... . 330 National Defense Education ..................................... . 331 Special Schools ............................................................... . 332 Surplus Property Revolving Fund ........................... . 333 State Library ............................... ; .. , .............................. .
Subtotal, State Operations-General Fund Only ................. . Local Assistarice:
334 Continuous Schools ..................................................... . 3.15 Bilingual Education ..................................................... . 336 Indian Early Childhood ..................................... ; ....... . 337 Instructional Television ............................................... . 338 Compensatory Education ........................................... . 339 a. Miller·Unruh Reading ............................................. .
b. Early Childhood ....................................................... . 340 Bilingual Aids ................................................................. . 341 Child Development Programs ........... ; ..................... . 342 Conservation Education ............................................. . 343 Assistance to Libraries ................................................. . 344 Vocational Education ................................................... .
Subtotal, Local Assistance-General Fund ............................. . Grand Totals-General Fund ..................................................... . Grand Totals-All Funds ............................................................. .
• Special funds. b Appropriated by Chapter 1406, Statutes of 1972.
Actual Estimated Proposed 197~73 1973-74 1974-75
$24,000 $24,000 5,980,938 7,655,263 (275,521) (327,722) 172,280 192,589
9,330,117 10,833,815 (3,855,912) (6,778,242) 2,023,989 2,227,282
$17,531,324 $20,932,949
$1,ooo,oood 82,000
567,128 10,424,615 18,399,069
$800,000 4,000,oood
322,226 570,000
10,818,000 18,399,625 25,000,000 b
$24,000 9,382,938 (319,498) a
193,572 12,032,347 (6,922,618) a
2,660,346
$24,293,203
$8()(),000 4,000,000
260,590 570,000
3,045,000 15,349,625 40,000,000
243,000 21,742,700 22,829,800 22,079,630
(275,000) a.
800,000 1,000,000 1,000,000' 550,000 550,000 475,000
$53,565,512 $84,289,651 $87,822,845 c
71,096,836 $105,222,600 $112,116,048 75,228,269 $112,328,564 $119,633,164 c
, Does not include nUmerous federal and statutory programs shown in Table 2. d Appropriated by Chapter 1521, Statutes of 1972 (AB 2284)
Program expenditures for the past, current and budget year from all sources of funding are shown in Table 2.
The relationships between amounts proposed for appropriation by funding source in the Budget Act of 1974 and program totals in the budget documents (commonly referred to as a crossover) are not complete in the Governor's Budget. We will, however, attempt to relate programs to funding source throughout this Analysis. Table 3 relates the Department of Education 1974 Budget Act items to the six program areas.
The Analysis which follows will address ~ll six programs in the order shown in Table 2.

I I
i Table 2 State Department of Education ..... State Operations and Local Assistance U1
Expenditures by~Program "" "-Actual Estimated Proposed Change Analysis [.!:j Program 197~73 1973-74 1974-75 Amount Percent page v I. Instruction c:::
() (a)· State Operations .................................... ~ ................... ,. $27,771,576 $27,265,841 $38,172,064 $906,223 2.4% 757 ~ (b) Local Assistance ............................................................ 295,804,968 347,071,387 326,332,917 -20,738,470 6.0 -II. Instructional Support 0
Z (a) State Operations ........................................................... 6,450,361 10,038,087 10,426,980 388,893 3.8 800 (b) Local Assistance ............................................................ 96,167,408 114,169,218 114,984,720 815,502 0.7
III. School Administrative Support (a) State Operations .......................................................... 1,331,437 1,421,459 912,502 -508,957 35.8 808 (b) Local Assistance ............................................................ 800,000 800,000
IV. School Finance and State Aid (a) State Operations .......................................................... ·775,345 816,442 870,235 53,793 6.6 810 (b) . Local Assistance ............................................................ 1,582,657,657 2,201,870,168 2,071,385,216 -130,484,952 5.9
V. Library ServiCes (a) State Operations .......................................................... 4,314,513 9,119,806 9,293,254 173,448 1.9 814 (b) Local Assistance ........................... : ................................ 800,000 1,000,000 1,000,000
VI. Department Management (a) State Operations .......................................................... 3,169,556 4,855,812 4,940,186 84,374 1.7 816 (b) Local Assistance ............................................................
Reimbursements (a) State Operations ...................................................................... -3,919,291 -5,520,595 -5,999,188 478,593 8.7 (b) Local Assistance ...................................................................... -57,677,988 -48,033,120 -47,474,000 -559,120 1.2 Subtotal-State Operations .......................................................... $39,893,497 $57,996,852 $58,616,033 $619,181 1.1 Subtotal-Local Assistance ........... , .............................................. 1,917,752,045 2,616,877,671 2,467,028,853 -149,848,818 5.7 GRAND TOTAL ALL PROGRAMS .......................................... $1,957,645,542 $2,674,874,523 $2,525,644,886 $ -149,229,637 5.6
General Fund .............................................................................. 1,651,220,742 ~ 2,327,454,276 2,188,556,638 -138,897,638 6.0 ...... State School Fund ...................................................................... 2,756,376 2,950,{}()() 2,700,{}()() -250,{}()() 8.5 ......
(1) Federal funds .............................................................................. 299,189,573 337,027,283 326,571,132 -10,456,151 3.1 S Surplus Property Revolving Fund ......................................... 3,855,912 6,778,242 6,922,618 144,376 2.1 en
c..:> School Building Aid Fund ........................................................ 275,521 327,722 319,498 -8,224 2.5 1'0 Califorma Water Fund .............................................................. 75,611 37,{}()() -37,{}()() -.:t
L Motor Vehicle Transportation Tax ........................................ 300,{}()() 300,{}()()
"'" Environmental Protection Fund ............................................ 275,{}()() 275,{}()() "'" State Transportation Fund ...................................................... 271,807

Table 3 Crossover Between Budget Act Items and Education Programs
Instruction Instruction support
Item (I) (II) 327 Educational Commission of the States .................... 328 General activities .......................................................... $4,550,658 $1,209,249 329 State School Building Aid ............................................ (27,919) 330 National defense education ................................. : ...... 193,572 331 Special schools ................................................................ 12,032,347 332 Surplus Property Revolving Fund ............................ (6,922,618) 333 State Library .................................................................. 334 Continuous schools ........................................................ 335 Bilingual education ...................................................... 4,000,000 336 Indian early childhood ................................................ 260,590 337 Instructional television ................................................ 570,000 338 Compensatory education ............................................ 3,045,000 339 a. Miller-Unruh. reading .............................................. 15,349,625
b. Early childhood ........................................................ 40,000,000 340 Bilingual aids .................................................................. 243,000 341 Child development programs .................................... 22,079,630 342 Conservation education .............................................. (275,000) 343 Assistance to libraries ............................................... , ... 344 Vocational education .................................................... 425,000 50,000
Totals, General Fund ............................................ $102,179,422 $1,829,249 • Special funds. bReconciles to total General Fund expenditures shown in Table 2 as follows:
Budget Act items, as above Statutory requirements ............................................................................................................ .. Miscellaneous legislation ........................................................................................................... .. Apportionments to school districts ........................................................................................ .. Less early childhood education appropriation ................................ , L'lstructional materials fund ..................................................................................................... .
Admini-strative School support finance
(III) (IV)
$529,979 $860,001 (291,579)
800,000
$1,329,979 $860,001
$112,116,048 436,912
22,376,523 2,068,385,216 -40,000,000
25,241,939
$2,188,556,638
Library (V)
$2,660,346
1,000,000
$3,660,346
Department management
(VI)
$24,000 2,233,051
$2,257,051
Total
$24,000 9,382,938 (319,498) a
193,572 12,032,347 (6,922,618) a
2,660,346 800,000
4,000,000 260,590 570,000
3,045,000 15,349,625 40,000,000
243,000 22,079,630
(275,000) a
1,000,000 475,000
$112,116,048 b
-...... (1)
S '" . c.J
~ t
t"l o c::: n :> >-l " o z ....... ..... U'I UI

Table 4 Program I
Instruction Program Expenditures and Funding
Program Element
A. Child Development.. ............................................................... . B. Educationally Disadvantaged C. Special Education ................................................................... . D. Occupational Preparation E. General Education Management... ...................................... . F. Statewide Testing ....................... ; ............................................. .
Totals Funding· State Operations:
General Fund ............................................................................. . School Building Aid Fund ....................................................... . Federal funds Reimbursements
Local Assistance: General Fund ...... : ...................................................................... . Federal funds ............................................................................. . Reimbursements ....................................................................... . California Environmental Protection Program Fund ..... .
Totals, Funding General·Fund ............................................................................. . Federal funds Reimbursements School Building Aid .................................................................. . Environmental Protection ....................................................... .
Actual Estimated Proposed 197~73 1973-74 1974-75
$57,942,587 $87,359,399 $87,116,940 158,742,339 167,366,903 156,117,744 20,906,950 24,158,458 25,367,180 50,651,645 70,233,466 63,900,977 35,156,980 34,752,602 31,059,140
176,043 476,400 943,000
$323,576,544
$13,121,328 18,720
11,668,088 2,963,440
38,974,472 199,152,508 57,677,988
52,095,8()() 210,820,596
60,641,428 18,720
$384,337,228
$17,572,122 27,712
15,824,497 3,841,510
77,555,999 221,482,268
48,033,120
95,128,121 237,306,765 51,874,630
27,712
$364,504,981
$18,554,523 27,919
15,525,092 4,064,530
66,503,311 212,080,606
47,474,000 275,000
85,057,834 227,605, 698 51,538,530
27,919 275,000
.... en
."
"-t'l 0 c: n
Change >->-l
Amount Percent -0 $-242,459 -0.3% Z
-11,249,159 -6.7 1,208,722 5.0
-6,332,489 -9.0 -3,693,462 -10.6
466,600 97.9
$-19,832,247 5.2%
$982,401 5.6 207
-299,405 1.9 223,020 5.8
-11,052,688 14.2 -9,401,662 4.2
-559,120 1.2 275,000
-10,070,287 10.6 .,...9,701,067 4.1
-336,J()() 0.6 ...... ...... 207 (1)
275,000 a '" v:> t-o -.J.
L ,j>.. ,j>..

Items 327-344 EDUCATION / 757
DEPARTMENT OF EDUCATION-Continued
PROGRAM I INSTRUCTION
The instruction program consists of six budgeted elements;. Table 4 displays expenditures and funding for these elements in their order of importance for legislative review purposes.
The Governor's Budget displays lO elements in the instruction program. However, three of them show no budgeted funds and the fourth is included within the remaining 'six budgeted elements. We find this an awkward and misleading presentation. Our presentation simplifies program review. All totals tie to the Governor's Budget.
A. CHILD DEVELOPMENT
Child development services of the Department of Education consist of the activities of child care services, preschool program and early childhood education with expenditures and funding as shown in Table 5.
Table 5" Child Development
Expenditures and Funding
Actual Estimated 1972-73 1973-74
1. Child care services ......................... . $36,589,155 $62,649,513 2. Preschool program ......................... . 21,335,356 24,459,886 3. Early childhood education ........... . 18,076 250,000
Total ............................................. . $57,942,587 $87,359,399 General Fund ................................... . ~~3~ 3~1m100 Federal funds ..................................... . 61,303 175,786 Reimb'lrsements ..... ; ......... : ............... . 55,271,895 49,004,513
• Includes: State Operations ....................................................................................................................... . Local assistance:
Federal funds ......................................................................................................................... . Pilot study ............................................................................................................................... . Colton Unified School District .............................. , .......................................................... . Budget Act Items .......................................................................................... $25,854,630 Less development centers ................................ ,......................................... 6,012,630
TotaL ................................................................................................................................... . b Includes:
Chapter 1005, Statutes of 1972 appropriation .......... ~ ........................................................ . Title I, ESEA-Department of Education administration ............................................... .
Total ....................................... ~ ................................................................................................. .
1. CHILD CARE SERVICES
Proposed 1974-75
$66,808,831 a
19,958,109 b
350,000
$87,116,940 38,026,500
153,109 48,937,331
$1,563,331
43,699,000 1,700,000
4,500
19,842,000
$66,8ll8,831
$19,805,000 153,109
$19,958,109
Pursuant to Chapter 670, Statutes of 1972 (AB 99) , the Child Development Act, as amended by Chapter 1191, Statutes of 1973 (AB 1244), the State Department of Education has administrative responsibility for a

758 / EDUCATION Items 327-344
INSTRUCTION-Continued
variety of child care services including those services previously administered by the State Department of Social Welfare. Services may be provided by public or private agencies for prekindergarten children and school age children up to 14 years, as well as for the parents of such children. Services may include supervision, developmental aCtivities, and instruction for any part of a workday including night shifts. In addition, social services, referral and counseling services, health screening and treatment, and nutrition services may be included.
Administration
The Child Development Act requires the Department of Education to (1) formulate and promote a child development program in all California communities where the need exists; (2) adopt rules, regulations and standards for neighborhood family day care homes; (3) establish rules for program eligibility and priority of service; (4) establish fee schedules; (5) prescribe minimum educational standards; (6) give priority to children of families who qualify under federal regulations as former, current, or potential recipients of public assistance and other low-income and disadvantaged . families; and (7) generate maximum federal reimbursement for federally eligible children.
In order for a child care program to qualify for federal matching funds available under Title IV-A of the Social Security ACt, it must comply with applicable federal social services regulations. Revised federal regulations became effective November 1, 1973. In anticipation of the revised regulations, the Legislature provided augmentations for various child development programs in the Budget Act of 1973 to cover any loss of federal funds. However, these augmentations were vetoed by the Governor. Later in the 1973 Legislative Session Chapter 1191, Statutes of 1973 (AB 1244), was enacted which accomplished the same purpose by appropriating from the state General Fund amounts to replace any loss of federal funds in specified child development programs due to the revised regulations~ The actual need for the augmentations provided by Chapter 1191 would have been considerably less than the appropriated amounts because the revised regulations when finally issued provided a six-month period beyond the . anticipated effective date of November 1, 1973, in which they were to be implemented. However, federal legislation (HR 11333) which was adopted on January 3, 1974, suspends the revised federal regulations until December 31, 1974. This means that (a) the broader regulations in effect prior to November 1, 1973, will apply through December 1974 unless modified and made effective sooner and (b) approximately $5.5 million in AB 1244 will revert to the General Fund at the end of 1973-74.
Unexpended State Child Care Funds
We recommend that the unexpended balances of the amounts appropriated by Chapter 1191, Statutes of 1973 (AB 1244), be carried forward fOT expenditure in 1974-75 for the same purposes.
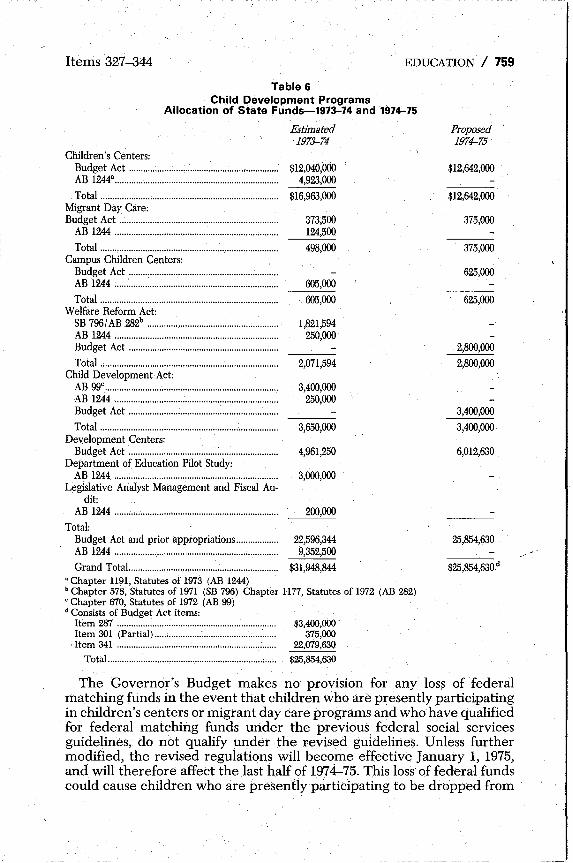
Table 6 summarizes state funding for child development programs in 1973-74 and proposed by the Governor's Budget for 1974-75.
Items 327-344 EDUCATION / 759
Table 6 Child Development Programs
Allocation of State Funds-1973-74 and 1974-75
Estimated 1973-74
Children's Centers: Budget Act ................................................. ;.............. $12,040,000 AB 1244" ............ \......................................................... 4,923,000 ' Total ........................................................................... .
Migrant Day Care: Budget Act ................................................................... .
AB 1244 ..................................................................... .
Total ........................................................................... . Campus Children Centers:
Budget Act ............................................................... . AB 1244 " ..... ' ............................................................... .
Total ........................................................................... . Welfare Reform Act:
SB 796/ AB 282b ........... : ........................................... .
AB 1244 ..................................................................... . Budget Act ........................................................... : ... .
Total ........................................................................... . Child Development Act:
AB 99c •••••.••••..............••.••.•••••••••••••......•.............•....••••••
AB 1244 ..................................................................... . Budget Act ............................................................... .
Total ........................................................................... . Development Centers:
Budget Act ............................................................... . Department of Education Pilot Study:
AB 1244 ..................................................................... . Legislative Analyst Management and Fiscal Au
dit: AB 1244 ..................................................................... .
Total:
$16,963,000
373;500 124,500
498,000
605,000 . 605,000
1,821,594 250,000
2,071,594
3,400,000 250,000
3,650,000
4,961,250
3,000,000
200,000
Budget Act and prior appropriations .................. 22,596,344 . AB 1244 ...................................................................... 9,352,500
Grand TotaL............................................................... $31,948,844 a Chapter 1191, Statutes of 1973 (AB 1244) b Chapter 578, Statutes of 1971 (SB 796) Chapter 1177, Statutes of 1972 (AB 282) c Chapter 670, Statutes of 1972 (AB 99) d Consists of Budget Act items:
Item 287 ................................................................... . Item 301 (Partial) ..... : ............................................. . Item 341, ............................................................. : ..... .
Total ....................................................................... .
$3,400,000 375,000
22,079,630
$25,854,630
Proposed 1974-75
$12,642,000
$12,642,000
375,000
375,000
625,000
625,000
2,800,000
2,800,000
3,400,000
3,400,000
6,012,630
25,854,630
$25,854,630d
The Governor's Budget makes no provision for any los~ of federal matching funds in the event that children who are presently participating in children's centers or migrant day care programs and who have qualified for federal matching funds Ulider the previous federal social services guidelines, do not qualify under the revised guidelines. Unless further modified, the revised regulations will become effective January 1, 1975, and will therefore affect the last half of 1974-75. This loss' of federal funds could cause children who are presently participating to be dropped from

760 / EDUCATION Items 327-344
I NSTR UCTION-Continued
the program. \ Although postponing the effective date of the revised social services
regulations until January 1, 1975, will eliminate the need for most of Chapter 1191 (AB 1244) appropriated funds for child development programs in 1973-74, it appears likely that such need could occur in 1974-75. For these reasons we recommend that Chapter 1191 funds be continued for this purpose through budget act language.
2. PRESCHOOL PROGRAM
In 1965 the Legislature instructed the State Department of Social Welfare to contract with the State Department of Education to operate a statewide system of preschool programs for three- to five-year-old children from low-income families. This legislation required all programs to follow program guidelines developed by the Department of Education.
Until 1973-74, state appropriations for the preschool program were matched by federal funds on a 75-25 federal-state matching basis, under the Federal Social Security Act Amendment of 1967. Federal funding for the preschool program was eliminated in 1973-74 due to revised federal social services regulations under Title IV-A of the Social Security Act, effective November 1, 1973. Table 7 summarizes funding of the preschool program from 1971-72 through 1974-75.
Table 7 Funding of the Preschool Program
from 1971-72 through 1974-75
1971-72 ........................................................... . 1972-73 ........................................................... . 1973-74 ............................................................ . 1974-75 ........................................................... .
State $5,122,000 5,328,453
23,314,100 19,805,000
• Appropriated by Chapter 1005, Statutes bf 1973 (AB 451). b Appropriated as follows:
Budget Act of 1973-Item 309.............................. $5,828,550 Budget Act of 1973-Item 309.5 .......................... 5,828,550 Chapter 1005 ............................................................ 11,657,000
Total.................................................................... $23,314,100
Federal Matching
$15,366,000 15,985,359
Total $20,488,000 21,313,812 23,314,100 b
19,805,000 a
Table 7 indicates that the preschool program was funded in 1973-74 partly by the Budget Act of 1973 and partly by Chapter 1005, Statutes of 1973 (AB 451). The Budget Act of 1973 appropriated $11,657,100, sufficient only to fund the preschool program for the first six months of 1973-74. Chapter 1005 was subsequently enacted to provide funding for the second half of 1973-74.
Table 8 summarizes the scope of the preschool program from 1970-71 through 1973-74.
The. table indicates that the estimated program level of operation in 1973-74 is about the same as 1972-73. The Department of Education estimates that approximately 19,400 children are being served in 1973-74.

Items 327-344 EDUCATION / 761
Table 8 Scope of ,preschool Program From 11170-71 Through 1973-74
Number of applicant agencies
1970-71 ............................... ,.................................... 144 1971-72 ............................................... ,.................... 166 1972-73 .................................................................... 191 1973-74 .................................................................... 184
1974-75 Appropriation
Number of sites (est.)
not available 669 852 852
Number of preschool
classes (est) 981
1,088 1,295 1,295
We recommend that the fiscal committees consider the preschool program budget after the Department of Finance fiscal and management audit· of the preschool program has been submitted anq reviewed
As shown previously in Table 7, Chapter 1005 authorized $19,805;000 for the preschool program in 1974-75. This is approximately 85 percent of 1973-74 funding. The Department of Education estimates that an additional $4,630,650 would be necessary to fund the program through 1974-75 at the 1973-74 operating level. Chapter 1005 stated that the preschool program should be able to operate at the lower funding level because of anticipated cost savings to result from a Department of Finance fiscal and management audit of the program, to be submitted to the Joint Legislative Budget Committee by February 1, 1974.
We will review the Department of Finance audit report and recommend to the fiscal committees a. program funding level for the preschool program in 1974-75. We believe that the funding level of85 percent of the 1973-74 funding, based Qn possible cost savings, was arbitrarily determined and that the 1974-75 preschool program flluding level should be determined not only on the basis of any potential cost savings but also on the basis of the benefits of the program and the unmet peed for such services~
The State Department of Education estimates that 400,000 California children between the ages of three and five reside in families whose income is at or below the poverty level. Approximately one~half of these children are current welfare recipients and the balance areformef or potential recipients. Less than 60,000 of these children are served by one of the a'vailable federal or state programs, such as Iiead Start, ESEA Title I, the State Program for the Educationally Disadvantaged, or the children's centers programs.
3. EARLY CHILDHOOD EDUCATION
Chapter 1147, Statutes of 1972 (SB 1302), authorized an Early Childhood Education Program for children in grades K-3 and appropriated $25 million for local assistance expenditures in 1973-74 and $40 million in 1974-75. The act also appropriated $250,000 for initial administration by the Department of Education.
Goals
The stated goal of the Department of Education for this program is "to provide equal access to education for all children in kindergarten and grades 1 through 3. It is intended to provide opportunities and.experiences so that all children will master the basic skills of reading, communicating,

762 / EDUCATION Items 327-344
INSTRUCTION-Continued
computing, problem solving, and adapting to change. Its central aims are (a) to provide greater individualization of instruction and diversity of programs offered, (b) to increase parent and community participation in educational decisionmaking, and (c) to focus the wide variety of present educational programs into one coordinated, comprehensive effort."
Table 9 summarizes program activity in 1973-74 and 1974-75. Table 9
Participation in the Early Chil~!lood Education Program
Districts .................................................................................... .. Schools .................................................................. : ................... .. Pupils ......................................................................................... . Amount allocated ................................................................... .
Estimated 1973-74
799 1,012
176,&67 $24,065,086
Estimated 1974-75
940 1,400
273,000 $41,000,000
The table indicates a total allocation of approximately $24 million in 1973-74 which leaves an unallocated balance of about $1 million for carry over to the 1974-75 appropriation of $40 million. The department estimates that the 1973-74 progam is reaching approximately 13 percent of the total K-3 pupil population and proposes to expand participation in 1974-75 to approximately 20 percent.
The budget request for administrative costs for the Department of Education in 1974-75 is $350,000. This will provide for three additional consultants and related costs, for a total staffing of 7 professional and 5.5 clerical positions. We concur in this increased staff to meet the expanding growth of the program. In addition, the Budget Bill reappropriates the $40 million in Chapter 1147 in combination with $15,349,625 for the MillerUnruh Reading Program totaling $55,349,625 in Item 339.
Relationship Between Early Childhood Education and Miller-Unruh Reading
A major issue for legislative review is the interrelationship between the Early Childhood Education Program and the Miller-Unruh Basic Reading Program. Chapter 1147 was sponsored by the Superintendent of Public Instruction who has stated that early childhood education is one of the priority educational needs in California. The measure vvas approved by the Governor on November 23, 1972. Prior to the Governor's approval, a written agreement between the State Department of Finance's chief deputy and the State Department of Education's chief deputy dated November 17, 1972, established a plan for the expansion of the Early Childhood Education Program to eventually include all K-3 pupils in California. Included in the agreement was a provision that the Miller-Unruh Basic Reading Act Program, which also serves K-3 pupils, would be incorporated into the expanding Early Childhood Education Program. This appears to be in conformance with Chapter 1147 which specified that the state apportionment per pupil for the Early Childhood Education Program would be reduced by the amount per pupil apportionment of the MillerUnruh Reading Act appropriation. It was understood that the expansion would require legislative action supplementary to Chapter 1147.
Reference to the agreement has been made at subsequent meetings by

EDUCATION / 763
Department of Education representatives, and the Department of Fi" nance sent additional copies of the agreement to the Department of Education's Deputy Superintendent for Administration and Chief of Management services on January 16, 1973. However, in a letter of November 27, 1973 to the Director of Finance, the Superintendent of Public Instruction repudiated the agreement on the basis that he lacked knowledge of it. We are concerned that lack of such knowledge implies an extremely poor management reporting system within the Department of Education. Education. .
Table 10 projects program activity and funding through 1978-79 as reflected by the agreement. The table projects a total annual cost for the K-3 program in 1975-76 of $87,600,000, increasing to $219,000,000 in 1978-79, and remaining at that level beyond 1978-79 subject to an annual inflationary factor.
Table 10 Early Childhood Education Program Actual and Projected Allocations
Through 1978-79
Fiscal year 1973-74 ..................................... . 1974-75 ..................................... . 1975-76 ..................................... . 1976-77 ................. : ................... . 1977-78 ..................................... . 1978-79 ................................... .' ..
Students· served 176,567 273,000 547,572 821,359
1,095,145 1,368,931
1,368,931 Students K-3
Percent 01 population
13% 20 40 60 80
100
Schools served 1,012 1,400 1,818 2,700 3,600 4,500
Annual cost
(in thousands) $25,000 40,000 87,600
131,400 175,200 . 219,000'
Annual increase
(in thousands)
$15,000 47,600 43,800 43,800 43,800
• Miller·Unruh Reading dollars will be phased into the total early childhood allocatiori orr a percentage basis annually.
Miller-Unruh Reading Program 1974-75 Funding Level
The Governor's Budget proposes to reduce support for Miller-Unruh specialist teacher salaries in 1974-75 by $2.8 million to $15,349,625 (see Table 18). This reduction represents the amount of overlap experienced by 173 schools eligible for both the Miller-Unruh and early childhood ed'ucation programs in 1973-74. The Miller-Unruh appropriation would be further reduced in subsequent years as the early childhood education appropriation is increased, the reduction to be applied to additional schools entering the Early Childhood Education Program which previously utilized Miller-Unruh teachers.
It is important to note that Early Childhood Education Program guidelines require a school to assess its own particular needs based on pupil population, community desires, and available resources and to develop an. appropriate program. A school with particular reading deficiencies could elect to utilize its early chi,ldhood education allocation for reading resource teachers in the same manner as Miller-Unruh reading resource teachers are utilized, or it could elect to develop other supplementary programs to meet its particular needs within guidelines established by the State Department of Education. We believe school districts should have this latitude which is included in the plan to incorporate Miller-Unruh funding as the Early Child Education Program expands.

7641 EDUCATION Items 327-344
INSTRUCTION-Continued
B. INSTRUCTION FOR EDUCATIONALLY DISADVANTAGED STUDENTS
Instruction for educationally disadvantaged students consists of (1) federal and state subventions for educationally disadvantaged students, (2) special state compensatory education projects, (3) the Miller-Unruh Reading Program (page 770), and (4) Project SEED. These programs are administered by the Department of Education's Division of Compensatory Education.
Table 11 summarizes expenditures and funding sources for this program as shown in the Governor's Budget.
Table 11 Instruction for Educationally Disadvantaged Student
Expenditures and Funding Sources
Actual Estimated Proposed 1972-73 1973-74 1974-75
State Operations Personal Services .................................. $2,747,488 $3,739,338 $3,785,179
Local Assistance State Compensatory Education Pro-
grams .................................................... 10,424,615 10,818,000 3,045,000 Miller-Unruh Reading .......................... 18,399,069 18,399,625 15,349,625 ESEA Title I .......................................... 126,176,178 133,694,940 133,694,940 Project SEED ........................................ 494,989 315,000 Project SHARE ...................................... 500,000 400,000 Bilingual Aides .................................... ,. 243,000
Subtotal ................................................ $155,994,851 $163,627,565 $152,332,565 TOTAL ........................................................ $158,742,339 $167,366,903 $156,117,744 a
General Fund ........................................ 30,417,985 31,314,207 20,,082,682 Federal funds ......... : ................................ 128,121,028 135,996, 784 135,986,063 State School Building AM Fund ........ 18,720 27,712 27,9~9 Reimbursements .................................... 184,606 28,200 21,080
• Does not include $82 million state educationally disadvantaged youth program funded by Chapter 1406, Statutes of 1972 (SB 90).
Table 12 presents General Fund support by Budget Act item. Table 12
Instruction for Educationally Disadvantaged Students General Fund Budget Act Appropriations
Budget Act Item
State operations 328 (partial)
Local assistance 338
Purpose
Department of Education general activities .............. ..
Demonstration programs in reading and mathematics ............................................................... .
339 (partial) Miller-Unruh Reading Program ........................................ .. 340 Bilingual reading aides ........................................................ ..
Total, General Fund ................................................................................ : .............. .
Amount
$1,445,057
$3,045,000 15,349,625
243,000
$20,082,682

Items 327 -344 EDUCATION / 765
1. FEDERAL AND STATE SUBVENTION PROGRAMS
The federal Elementary and Secondary Education Act (ESEA) Title I and the state Educationally Disadvantaged Youth Program (EDY) provide subventions to school districts on the basis of the number of lowincome, transient, or bilingual children for the support of compensatory education programs. Table 13 summarizes the categories of ESEA, Title I and presents estimated expenditures for the past year.
Table 13 Elementary and Secondary Education Act. Title I
1972-73
Component Amount
(in millions) District entitlements by program:
Reading ....................................................................................................... . English as a second language ................................................................. . Mathematics ............................................................................................... . Health, library and guidance services ................................................. . Parent Involvement ................................................................................. . Intergroup relations ........................................................ ; ........................ . Staff development ..................................................................................... . Cooperative projects ............................................................................... .
Subtotal ................................................................................................... . Handicapped in state schools ..................................................................... . Delinquents in local institutions ............................................................... . Delinquents in CYA institutions ............................................................... . Migrant education ......................................................................................... .
Total ......................................................................................................... .
$45.5 . 2.9 29.9 lOA 3.8' 3.8 3.6 9.9
$109.8 1.5 0.6 1.7 8.5
$122.1 •
Percentage
37.3% 204
24.5 8.5 3.1 3.1 2.9 8.1
89.9% 1.2 0.5 1.4 7.0
100.0% 'Data provided by Division of Compensatory Education, does not reconcile to Governor's Budget
(pp. 388) of $126.2 million.
State Disadvantaged Youth Program
Chapter 1406, Statutes of 1972 (SB 90) established the state Educationally Disadvantaged Youth Program (EDY) and appropriated $82 million for 1973-74 primarily for local assistance. This program extends compensatory education programs similar to those established under ESEA, Title I to an additional 100,000 students. The Governor's Budget proposes to continue this program in the budget year at the same level of $82 million. The Department of Education is permitted to utilize 1 percent of the subven-
Table 14 State Level Expenditures and Administration for Educationally Disadvantaged
Youth Program
Expenditures: Administration ....................................... . Subventions ........................................... .
Professional Positions: Division of Compensatory Education Office of Program Evaluation ........... . Assistants to Age Span Managers ..... . Clerical positions ................................... .
Subtotal positions ..................... .
Actual 197~73
Estimated 1973-74
$479,323 • 81,520,677
5 4 3 4.5
---16.5
• Represents three quarters of a year program administration.
Propo;'ed 1974-75
$560,784 81,439,216
5 4 3 4.5
---16.5

766 I EDUCATION I terns 327-344
INSTRUCTION-Continued
tion amount or a maximum of $820,000 for the state level administration of the EDY program. Table 14 presents proposed expenditures and staffing for this program.
2. STATE COMPENSATORY EDUCATION PROGRAMS
State Compensatory Education, in addition to subventions authorized under the Educationally Disadvantaged Youth Program, consists of the following special programs:
(1) Special Teacher Employment Program (STEP). This program provides funds to school districts in areas of concentrated poverty for the employment of additional classroom teachers.
(2) Professional Development Centers (PDC). These centers provide in-service training to teachers in selected schools with a high percentage of low-achieving students.
(3) Research and Teacher Education Program (RATE). This program consists of experimental teacher-intern projects and in-service teacher training projects for teachers of disadvantaged students.
(4) Demonstration Projects in Reading and Mathematics. These projects consist of experimental programs in reading and mathematics for disadvantaged students in grades 7-9.
(5) New Careers Program. This program provides stipends to lowincome persons to enable them to earn elementary teaching credentials for the purpose of teaching disadvantaged students.
Table 15 summarizes expenditures for these programs. Table 15
State Compensatory Education Programs 1972-73 to 1974-75
Actual Program 197~73
Special Teacher Employment Program (STEP) ................................................ $6,500,000
Professional Development Centers (PDC) .................................................. 750,000
Research and Teacher Education (RATE) ................................................ 268,000
Demonstration Projects in Reading and Mathematics ........................................ 3,000,000
New Careers .............................................. 250,000
Totals ............................................ $10,768,000
Program Fragmentation Problem
Estimated 1973-74
$6,500,000
750,000
568,000
3,000,000 250;000
$1l,068,000
Proposed 1974-75·
$3,045,000 250,000
$3,295,000
The 1974-75 Governor's Budget states the Departmenfof Education's policy: " ... in the past several years, federal and state legislators, have created a variety of specially financed pr9grams to Ae,lp. . . pupils. These efforts were fragmented, often resulting in educational programs that were neither more efficient or more effective. .'f, .
"The need is for the Department of Education to have,school districts design programs that merge available funds with student needs ... "

Items 327-344 EDUCATION / 767
To this end, the Department of Education has recently instituted a consolidated application form which will require school districts to coordinate separate funding sources into a general program outline. In addition, the department has prepared a consolidated evaluation form to en~ourage school districts to evaluate individual projects in terms of a unified program outline and general objectives.
We believe that the integration of RATE, PDC, STEP and demonstration projects into a total program would be in keeping with these recent efforts to promote consolidation and coordination of all education program components within a district and avoid the fragmentation which results from categorical funding.
Progra'll Reductions
Table 15 indicates that the 1974-75 Governor's Budget proposes to eliminate support for the STEP;PDC and RATE programs in the budget year. The Department of Finance justifies this action on the basis of funding duplication and lack of program effectiveness. In the case of STEP, the department believes that new funds appropriated under the State Edilca-· tionally Disadvantaged Youth Program and the Early Childhood Education Program will enable districts to hire additional teachers without the need for a special state categorical aid program. in the case of RATE,the departInent states that institutions of higher education already receive support for teacher training through general budget act appropriations. PDC programs are primarily programs for in-service teacher training and thus do not directly duplicate precservke higher education training programs. Nevertheless, these high cost projects have operated on an experimental basis for as long as four years in some cases. We believe that their experimental status should be discontinued and they should now be adopted as ongoing programs by school districts which believe them to be appropriate and effective in-service training models.
Alternate Funding Sources
Many school districts, including districts now operating STEP, PDC and RATE programs, currently receive new funds under the Educationally Disadvantaged Youth Program which could be used to implement these programs on an operational basis. Table 16 presents school districts now operating (1) STEP programs in excess of $50,000 per year, (2) PDC programs and (3) RATE programs. The table summarizes alternate sources df revenue in the event these districts choose to continue their STEP, PDC, or RATE program. An additional 22 school districts not shown in the table receive STEP subventions of less than $&0,000 per year.
This table indicates that of the 19 local educational agencies which will lose state STEP, PDC or RATE funds; 15 receive sufficient new funds under the Educationally Disadvantaged Youth and Early Childhood Education programs to continue the special state programs if they so choose. In fact, funds received under the new disadvantaged and early childhood Programs represent an approximate eight-fold increase over funds previously received under the STEP, PDC and RATE appropriations.

Table 16 Alternate Funding Sources for School Districts With State Compensatory Education Programs (197~74)
New State Funds State programs to Educationally Early State be eliminated in Disadvantaged Childhood Federal Miller-Unruh
County District 1974-75 Youth (SB 90) Education ESE A Title! Reading Alameda Oakland .................................... $336,303 (STEP) $4,445,680 $276,705 $3,952,620 Contra Costa Pittsburg .................................. 52,796 (STEP) 306,026 24,375 319,153
Richmond ................................ 231,984 (STEP) 1,107,039 203,320 1,673,942 $11,668 Fresno Fresno ...................................... 189,195 (STEP) 1,883,335 274,950 2,035,058 124,498
147,406 (PDC) Kern Bakersfield .............................. 205,377 (STEP) 889,220 165,100 970,502 38,621 Los Angeles Compton .................................. 273,903 (STEP) 3,371,012 169,065 3,164,868 163,352
Garvey ....................................... 82,633 (STEP) 419,123 47,710 298,121 23,336 Long Beach ............................ 168,393 (PDC) 311,480 2,083,261 40,848
187,989 (STEP) Los Angeles ............................ 3,269,771 (STEP) 25,586,720 2,936,407 29,730,223 2,426,944 Pasadena .................................. 115,671 (STEP) 843,344 93,689 1,261,308 203,834
118,000 (RATE) Pomona ................. : .................. 1:14,130 (PDC) 820,591 107,715 949,988 169,653
San Bernardino Colton ...................................... 117,000 (RATE) 339,596 38,025 379,375 San Bernardino ...................... 177,441 (STEP) 1,282,245 159,250 1,541,365 43,638 Upland ...................................... 100,000 (RATE) 35,165 71,592
San Diego San Diego ................................ 188,388 (STEP) 604,867 3,244,638 396,829 San Joaquin Stockton .................................. 236,954 (STEP) 1,687,850 162,335 1,586,279 210,024 Santa Clara Berryessa .................................. 100,000 (RATE) 49,605 49,002 1ll,429 Tehama Tehama County ............... , .... 168,550 (PDC) 13,099 120,177 123,916 28,730 Tulare Visalia ........................................ 144,060 (PDC) 350,681 69,615 399,968 19,602
Totals.............................................................................................. $6,611,814 $43,345,561 $5,849,555 $53,835,179 $4,013,006
2 C/) -I :u c: C') -I (5 2 I C') o ::::I ~. ::::I c: I» Q,
.... m co ........ til o e
~ o z
>-< ..... CD
S en c;..:J ~
~ t

Items 327-344 EDUCATION / 769
This table also presents four local education agencies (Upland, Berryessa, Long Beach, and Tehama County) which do not receive sufficient new state funds to compensate for the loss of STEP, PDC and RATE programs. However, the table illustrates that these local agencies do receive sufficient funds from ESEA Title I sources to continue a STEP, PDC or RATE program if they so choose. This does not suggest that. these sources represent district surpluses but only that all of the school districts presented in the table could redirect alternate federal and state resources into STEP, RATE or PDC program models in spite of the loss of special state funding for these programs.
Demonstration Programs in Reading and Mathematics
We recommend that state support for the demonstration projects in reading and mathematics be reduced from $3,045,000 to $712,000 for a General Fund savings of $2,333,000 (Item 338).
The state demonstration projects in reading and mathematics utilize innovative teaching techniques and low pupil-to-teacher ratios to teach low-achieving students in grades 7-9. The original projects have been in. operation since the 1969-70 school year. We believe new entitlement funds now provide the opportunity for participating school districts to convert these experimental programs to an operational basis. Table 17 indicates that 15 of the 19 school districts operating the 24 demonstration projects receive sufficient new funds under the state Educationally Disadvantaged Youth Program to adopt these projects on an ongoing basis if
Table 17 Demonstration Programs in Reading and Mathematics
1973-74
Number of
District projects
Bakersfield .................................................. 1 Colton .......................................................... 1 Compton...................................................... 1 Fresno .......................................................... 1 Garvey.......................................................... 1 Greenfield ......................................... :.......... 1 Jurupa .......................................................... 1 Long Beach ................................................ 2 Los Angeles ................................................ 2 Monrovia...................................................... 1 Oakland........................................................ 2 Ontario-Montclair ...................................... 1 Pittsburg ...................................................... 1 Pomona........................................................ 1 Riverside................................................. ..... 1 San Diego.................................................... 1 San Francisco .............................................. 2 San Jose ........................................................ 1 Santa Barbara ............................................ 2
Total.......................................................... 24
27-85645
SkiD area R-reading M-math
R RIM
R R R R M M
RIM R
RIM R R R
RIM R R
RIM R
Project expenditures
$90,335 78,753
121,407 89,779 87,099
116,109 141,284 192,639 287,532 79,679
278,485 164,184 155,932 144,971 93,813 90,466
226,801 183,708 312,376
$2,935,352
State educationally disadvantaged youth (SB 9fJ)
$889,220 339,596
3,371,012 1,883,335
419,123
264,123
25,586,720 168,962
4,445,680 310,192 306,026 820,591 264,123
5,629,099 745,002
$45,442,804

770 / EDUCATION Items 327-344
INSTRUCTION-Continued
they so choose. We believe that special funds for the demonstration projects in the school districts should be eliminated and that districts should decide for themselves whether the results of theirprojects warrant adoption on an ongoing basis using new entitlement funds. It should be noted that these new funds would be sufficient even if certain school districts decide to use a portion of their new funds to compensate for the loss of STEP, RATE, and PDC funding (see page 768).
Four school districts (Greenfield, Long Beach, San Diego, Santa Barbara) did not receive sufficient new funds to continue their demonstration projects. We therefore recommend that the four projects in the Greenfield, Long Beach, Santa Barbara, and San pie go school dstricts be permitted to operate in 1974-75 at a state cost of approximately $712,000. Legal authorization for these projects terminates at the end of the budget year.
Administration
We recommend the elimination of three professional positions and two clerks from the staff of Research and Teacher Education for Disadvantaged Children Unit and the Professlonal Development Bureau for a savings of $135,000 (Item 328).
The 1974-75 Governor's Budget proposes to eliminate state support for the Research and Teacher Education Program, professional development centers, and the Special Teacher Employment Program. In addition, we recommend the elimination of the state Demonstration Projects in Reading and Mathematics. We conclude that the professional positions in the Department of Education responsible for the administration of these programs should also be eliminated to reflect this reduction in workload. The Governor's Budget indicates two professional positions and one clerk in the Research and Teacher Education for Disadvantaged Children Unit and one professional position and one clerk in the Professional Development Bureau. The elimination of these positions would result in a savings
. of approximately $135,000 to the General Fund.
3. MILLER-UNRUH PROGRAM
The Miller-Unruh Basic Reading Program provides state allowances to enable 262 school districts in the state to employ reading specialists in grades K-3. Miller-Unruh specialists are chosen by examination from school district personnel. Over 90 percent of the total program allocation is spent for salaries of these specialist teachers. Chapter 841, Statutes of 1972, redirected a small portion of the regular Miller-Unruh appropriation in 1972-73 and 1973-74 to the following activities: (1) Operation SHARE, (2) bilingual teaching aides, (3) the Guaranteed Learning Act, and (4) state-level administration of the Miller-Unruh program. In the budget

Items 327-344 EDUCATION /771
year, these activities will be funded under separate items. Table 18 summarizes expenditures for all components of the Miller-Unruh program.
Table 18 Expenditures for the Miller-Unruh Program
A. Specialist Teachers ......... . B. Bilingual Aides ................. . C. Operation SHARE ........... . D. Guaranteed Learning ..... . E. Administration:
Personal Services ......... . In-service Training ....... . Evaluation ....................... . Operating Expense and
, Equipment ............. . Subtotal Administration
Total ..................................... . 'Item 339 b Item 340 'Item 328
Actual Estimated Proposed 1972-73 1973--74 1974-75
$18;149,069 $18,149,625 $15,349,625 a
95,000 153,000 243,000 b
500,000 400,000 - ° -. 250,000 250,000 250,000 c
114,735 123,375 90,000 c
72,267 90,000 -0-40,000 40,000 20,000 c
53,369 72,000 35,000 c
$280,371 $325,375 $145,000
$19,274,440 $19,278,000 $15,987,625
Change -$2,800,000
+.90,000 -400,000
-0-
-33,37.5 -90,000 -20,000
-37,000
-180,375
- $3;290,375
The table indicates the reduction of $2.8 million in total state allowances for specialists teacher salaries. This reduction represents the amount of overlap between the Miller-Unruh Reading and the Early Childhood Education Programs which is discussed in the previous section. Support for bilingual aides has been increased by $90,000 to enable school districts to employ additional bilingual aides to assist Miller-Unruh reading specialists to teach bilingual students.
Evaluation
, Under the MillercUnruh Reading Program, the Department bf Education is required to submit an annual evaluation report to the Legislature. A preliminary draft of the 1972-73 report indicates that (1) reading scores in Miller-Unruh school districts showed more improvement in grades 1 to 2 than in non-Miller-Unruh districts, but that this improvement could not be traced into the 3rd grade, and (2) Miller-Unruh students had a more positive attitude toward reading, school and themselves than non-MillerUnruh students. .
4_ OPERATION SHARE
Chapter 1199, Statutes of 1970, provided for the operation of three pilot SHARE volunteer tutoring projects in 1971-72 for underachieving students with severe language handicaps. These projects were to be operated by agreement between the Superintendent of Public Instruction and county offices of education in cooperation with the Santa Clara County Superintendent of Schools. Chapter 841, Statutes of 1972, authorized cohtinuation of the program in 1972-73 and 1973-74 with fihal termination of state program funding as of July 1, 1974. Table 19 summarizes funding of this, program from its inception. iiI

772 / EDUCATION
I NSTR UCTION-Continued
Table 19 Operation SHARE Authorized Funds
Year PUPIls Tutored 1971-72 ............................................................ 4,711 1972-73 ............................................................ 5,585 1973-74............................................................ 5,000 (est.) • Chapter 555, Statutes of 1971 (AB 2586) . b Chapter 841, Statutes of 1972 (AB 612) .
Funding Total Amount
$475,000' 500,000 b 400,OOOb
Items 327--344
A verage Cost per Pupil
$100 90 80
Both Chapter 555 and Chapter 841 provided that Operation SHARE funds would be obtained by reducing the Miller-Unruh Reading Program appropriation.
SHARE Evaluation
We recommend that the Superintendent of Public Instruction submit to the Legislature hy March 1, 1974, an evaluation report on the costeffectiveness of Operation SHARE programs in 1971-72 and 1972-73.
We further recommend that a second report of the Operation SHARE program in 1973-74 be submitted to the Legislature by November 30, 1974.
The enabling legislation, Chapter 1199, specified that the Superintendent of Public Instruction was to provide for state evaluation of SHARE projects on a cost-effectiveness basis and report to the State Board of Education and the Legislature annually as to the success of such projects.
The program is now in its third year of operation; However, as ofJanuary 1974, the Department of Education has not submitted to the Legislature the required evaluation report for either 1971-72 or 1972-73. The Department of Education's Office of Program Evaluation and Research did submit to our office, an informal memorandum dated April 3, 1973, which reviewed the Operation SHARE annual report for 1971-72 prepared by the Santa Clara County Superintendent of Schools. This memorandum criticized the evaluation design of the program as developed by the Operation SHARE staff. In our opinion this memo did not comply with the evaluation requirements of Chapter 1199. The Department of Education is deficient in this respect. The tutorial method utilized by Operation SHARE may be of considerable benefit to underachieving students with severe language handicaps. However, the director of Operation SHARE has informed us that the project has not been successful in obtaining preand post-test data for pupils in the SHARE program. The director has also stated that a major thrust of the program is in the improvement of the self-image of SHARE pupils rather than in improving their academic achievement. This appears to be in contradiction of the legislative intent of Chapter 1199 which is to increase student achievement in reading and mathematics.
5. PERFORMANCE CONTRACTING
We recommend that the experimental projects in performance contracting be discontinued for a General Fund savings to the state of $250,000 (Item 328).
The Guaranteed Learning Achievement Act of 1971 authorized experimental performance contracts between public schools and private firms

Items 327-344 EDUCATION / 773
to (1) increase reading and mathematic achievement levels in K-6 grades, (2) test the applicability of business principles, such as performance incentives and accountability, in the public schools and (3) demonstrate the effectiveness of innovative approaches ,to learning which can be utilized throughout the entire school system.
Under this program, five school districts in the state established' performance contract programs in one or two elementary schools within each district. Four of the five districts contracted with a private corporaton to provide a comprehensive reading or reading/mathematics program consisting of (1) in-service training by company consultants, (2) teaching equipment and materials, and (3) teacher aides. Expenditures for these activities normally constituted a baseline budget which the company received regardless of the academic behavior of the students. Remaining funds averaging 10 percent of the project cost were distributed to the company based on the improvement of student test scores. In the fifth district, Woodland Joint Unified, the faculty of the project school formed a legal corporation and acted as the private contr;tctor. Incentive funds earned by improved student growth were utilized to purchase additional equipment. Table 20 indicates the amounts of the performance contracts and the private contractor.
Table 20 Performance Contracts
School District
Oakland ....................................................... . Woodland .................................................... . Pittsburg ...................................................... . Southern Kern ........................................... . Ontario-Montclair ..................................... .
1973-74 $70,000 44,000 46,609 40,000 48,831
$249,440
Contractor Behavioral Research Laboratories
School faculty Behavioral Research Laboratories American Learning Corporation
Appleton-Century-Craft
The five projects began in the 1972-73 school year. Preliminaryevaluations indicate that the projects have resulted in improved reading and math achievement levels. Although we recognize this improvement in student scores, we question whether the existing programs are properly designed totest the effectiveness of performance contracting. We believe that these projects prove only that a concentration of state funds in a single school results in an increase in pupil test scores. The current projects do not permit this increase to be attributed to the unique characteristics of performance contracting, such as fiscal incentives based on pupil growth and cost-effectiveness. A survey of participating school districts indiCates that the incentive grants for successful student growth average less than 10 percent of the total contract amount. That is, private companies are generally assured of 90 percent of their program expenditures without regard to student growth. We question if this small incentive can actually be considered a factor in motivating a company to improve student achievement.
Our survey also revealed that private contractors contributed unbudgeted amounts of supplemental consulta.nt time to insure that their projects proved successful. This indicates that fiscal reward is not the primary

774 / EDUCATION Items· 327-344
INSTRUCTION-Continued
factor motivating private companies to operate successful projects. This use of unbudgeted supplemental aid also eliminates the possibility of determining the cost effectiveness of the projects and prevents a comparison of the cost of a "business approach" to education with the cost of traditional public school method.
We conclude that the insignificant role of incentive awards and the use of unbudgeted consultant time indicate that the projects have not been designed to test the effectiveness and feasibility of performance contracts. We believe that continuation of this program should be made contingent upon redesign of the project and establishment of project management standards and procedures which will reason'ably assure project results consistent with their original purpose. Pending review of such steps we cannot recommend the item.
6 . . PROJECT SEED
Chapter 638, Statutes of 1972, established "The Abstract, ConceptuallyOriented Mathmatics Program Act" (commonly referred to as Project SEED) for the purpose of providing special mathematics programs in selected elementary schools in a maximum of four school districts. These programs are taught by mathematics specialists who are not credentialed teachers. They are directed toward providing pupils with an understanding of the underlying relationship and structure of mathematics.
To be eligible for the program a school district must maintain one, or more elementary schools which have a high percentage of educationally needy children and which qualify for federal Title I ESEA funds. Class size for the special program is limited to not more than 35 students. The maximum grant is $4,500 per class per full school year. The selected school districts are Los Angeles Unified, Oakland City Unified, Sacramento City Unified and San Jose Unified.
,The Superintendent of Public Instruction contracted with a nonprofit corporation (Project SEED, Inc.), to recruit, train,select, place and supervise the mathematics specialists used in the program and to provide program coordination and in-service training for local teaching staffs involved in the program. The Superintendent of Public Instruction contracted with Northwest Regional Education Laboratory, a nonprofit company to conduct an independent evaluation of the program in at least 40 of the SEED classes.
Table 21 summarizes funding of the program. Table 21
Appropriations for Project SEED
1972-73
SEED classes ................................................................................................ .. Evaluation ....................................................................................................... . Administration .............................................................................................. ..
$440,000 34,000 26,000
Total .......................................................................................................... $500,000
1973-74
$315,000 40,000
$355,000
The Governor's Budget does not include funding for this program in 1974-75 which is in accordance with the intent of the Department of

Items 327-344 EDUCATION / 715
Education. The intent is that school districts should locally determine whether or not they wish to utilize the SEED method of mathematics instruction and, if so, apply district or other state and federal compepsatory funds for supplementary SEED instruction. This appears reasonable.
Evaluation
The Budget Act of 1973 specified that the State Department of Education and Northwest Regional Education Laboratory include in the 1973,....74 evaluation designfor the SEED program an assessment of the effectiveness of the program's in-service training component for school district participating teaching staffs. One of the major benefits of the program, and the one with the most potential for ~tatewide application in school district mathematics instruction, may be the in-service training component. The degree to which school district teaching staffs can utilize SEED instructional techniques to improve mathematics instruction in elementary grades is important in determining the future utilization of the SEED method of instruction.
The 1973-74 evaluation report of Northwest Regional Education Laboratory is to be submitted to the Department of Education by May 31, 1974.
7. BILINGUAL PROGRAMS
The Superintendent of Public Instruction has stated that bilingual-bicultural education is one of the Department of Education's priority programs. Accordingly, a bilingual task force was established to assess the needs arid develop programs for bilingual education. The stated goals of the task force for 1974,-75 are "to enhance the quality of life of students whose background of language(s) and culture(s) differs from the learning and social environment of the dominant society." In addition, the following bilingual programs were implemented in California school districts.
Chapter 1521, Statutes of 1971. This legislation appropriated $75,000 to the Department of Education to develop, norm, and implement bilingual scholastic aptitude tests in Spanish-English, Chinese-English and other languages which have an impact on California public schools. Such tests Ilre to be utilized in determining eligibility for classes for mentally retarded minors. The act also appropriated $425,000 for expenditure in 1972,-73,1973-74 and 1974,-75 for a three-year bilingual study program for K-12 Spanish speaking pupils in San Diego Unified School District and a similar three-year program- for K-12 Chinese-speaking pupils in San Francisco Unified School District. The Superintendent of Public Instruction is to submit to the Legislature a report of its eVll.luation of the programs at the end of the three-year period. Th~ Bilingual Education. Act of 1972. Chapter 1258, Statutes of 1972 (AB
2284), (1) required all school districts to undertake a census of the number and primary language of those pupils within the district who are unable to speak English or have limited English-speaking ability, and (2) authorized school districts to apply for state-funded bilingual-bicultural projects to develop competence in English and in the primary language of each pupil. The act appropriated $1 million for expenditure in 1972,-73 and $4 million in 1973-74 for such projects. The act stated that school districts should assume future funding of bilingual programs as a part of the regular

776/ EDUCATION Items 327-344
INSTRUCTION-Continued
Instruction program. The Department of Education is required annually to provide the Legislature with an evaluation of bilingual programs in California. The Department of Education reports that in 1973-74 there are state bilingual projects in 69 school districts serving approximately 19,000 children. In addition, there were 71 additional acceptable projects submitted which could not be approved because of insufficient funds.
SHARE-Bilingual. Chapter 1199, Statutes of 1970, authorized Operation SHARE to conduct three pilot volunteer tutoring projects for underachieving students with severe language handicaps. This program is discussed on page 771 of the Analysis.
Miller-Unruh-Bilingual. Chapter 841, Statutes of 1972 (AB612), directed that in 1972-73 and 1973-74, a portion of the Miller-Unruh Reading Program appropriation be allocated for the employment of special reading aid,es in, MilleI:~U.nr4hschoqls where 15 percent or more of the pupils live in homes in which a ianguage other than English is the primary language. $95,000 was,allocateq for this purpose in 1972-73 and $153,000 in 1973-74. The Governor's Budget proposes that $243,000 be allocated separatdy (in Item 340) for this purpose rather than fund the program as a part of the Miller-Unruh Reading Program appropriation.
There are also provisions in other legislation such as Chapter 1147, Statutes of 1972 (SB 1302), the Early Childhood Education Program, and Chapter 1406, Statutes of 1972 (SB 90), Program for the Educationally Disadvantaged, which require the inclusion of a bilingual component in any authorized project when there is a demonstrated need .
. Title VII. In addition to state-funded programs the federal Title VII, Elementary and Secondary Education Act, provides funds to assist students with a native language other than English to achieve the following objectives: (1) maintain their language and culture, (2) develop their English proficiency to the fullest extent possible along with native language maintenance, and (3) develop a positive self-image .
. Projects are funded directly by the U.S. Office of Education based on proposals submitted by local education agencies. The Department of Education does not receive any Title VJI funds, either for local assistance or foraqmi~istration. However, the department does function in l:lliaisOn capacity with local education agencies in this program. In 1973-74 there a,re57 projects in California school districts and one project in a state university, with total funding of approximately $10 million.
Uncertain Bilingual Proposal for 1974-75
We recommend that the language of Item 33~ which appropriates $4 million for bilingual educatiofl in 1974-7~ be revised to read "For addi·tional Chapter 1258 (AB 2284) projects in school districts."
Because of the high priority classification assigned to bilingQal education by the Superinterindent of Public Instruction, we were concerned that the initial 1974-75 Department of Education budget program outlines provided to our office in October 1973, only proposed continuation of the . bilingual task force. The department did not propose any local assistance funds for bilingual education under the provisions of Chapter 1258 (AB

Items 327-344 EDUCATION / 777
2284). We requested a clarification of the department's position with respect to bilingual education and the department's staffresponse declared that there is a large unmet need for billngual programs but that additional state funding for local assistance would be the subject of separate legislation based on the Chapter 1258 model to be introduced in the 1974 Legisla~ tive Session.
However, the department apparently reconsidered its position because the Superintendent of Public Instruction in a letter written subseque:q.tly to the Director of Finance requested a budget augmentation for 1974-7.5 of $8 million for bilingual education. Approximately $4 million would be for continuation of the existing Chapter 1258 programs and $4 million for expansion of the program.
The letter indicated that approximately 200,000 pupils in California public schools have limited or no English language ability. The majority of these children speak Spanish, Mandarin, Cantonese, or Tagalog at home and are unable to function in the English environment of the classroom.
1974-75 Budget
In response to this last minute request the Governor's cabinet decided to include $4 million in the 1974-75 budget. These funds are not to support Chapter 1258 programs but to support undefined legislation to be· introduced in 1974. There is apparently no argument about the need for local bilingual programs and the fact that state funds should be addressed to this program. However, there is a difference between the Superintendent of Public Instruction and the Governor's cabinet as to how to meet the need. The superintendent supports the continuation of Chapter 1258 programs. The cabinet supports as yet undefined legislation without identifying specific problems with the current recently developed program.
We can identify no demonstrated problem in the Chapter 1258 program and believethat the cabinet's position creates a great deal of unnecessary apprehension and·confusion at the local district level. If new legislation is successful it will not be chaptered until after the 1974-75 Budget Act. In the interim, existing Chapter 1258 programs will be disbanded causing disruption in the delivery of services. We believe a more reasonable course of action would be to continue funding the existing program. Ifprogtam changes are necessary, they can be accomplished through separate legislation which modifies existing law. Attention should be focused On applying state funds in a needy school only for the minimum 'time needed to establish an effective program which can subsequently be funded from other entitlement sources. When this condition has been achieved, state funds should be transferred to other needy schools for similar program initiation.
Transfer of Administration
We recommend that the Department of Education transfer its bilingual program administration from the general education support unit to the disadvantaged students support unit.
The current bilingual administration unit is located under the general education program (GEM) manager but operationally reports elsewhere, i.e., to the intermediate education, program manager. Bilingualism is generally recognized as a component problem found within large elements

778 / ,EDUCATION Items 327 -344
INSTRUCTION~Continued
of disadvantaged students. Effective solution of this problem would be facilitated by the integration of this program into the total services provided by the state for disadvantaged youth. The current organization of the Department of Education does not reflect this coordination. We suggest that the department reorganize accordingly.
Chapter 1258 Evaluation
We recommend that the Superintendent of Public Instruction submit to the Legislature by March 1, 1974, an evaluation report on the Chapter 1258, Statutes of 1972 (AB 2284), bilingual education programs in 1972-73 and by November 30, 1974 a report on the 1973-74 programs.
The Department of Education is deficient in not adequately assessing the effectiveness of Chapter 1258 and other bilingual programs in California. The department has not complied with the provisions of Chapter 1258 requiring an annual evaluation report to the Legislature on such programs. An evaluation of existing bilingual programs should be available to the Legislature before new programs are authorized.
8. INDIAN EDUCATION ,-
We recommend that the Superintendent of Public Instruction submit to the Legislature by March 1, 1974, a report on the implementation and evaluation of the pilot programs for Indian pupils established and operated in 1972-73 pursuant to Chapter 1052, Statutes of 1972, and that a simJiar report on the operation of the programs in 1973-74 be submitted to the Legislature by November 30, 1974.
Chapter lO52, Statutes of 197~ (SB 1258), authorized up to lO three-year pilot projects for Indian pupils in grades K-4 in rural school districts receiving state equalization aid and having a concentration of at least lO percent Indian students. The program is to improve competence in reading and mathematics. The Superintendent of Pubiic Instruction is to submit to, the Legislature an annual report concerning the implementation and evaluation of the program. The act appropriated $lOO,OOO for the program in 1972-73 and $400,000 for 1973-74. The Governor's Budget proposes $260,590 in Item 336 for continuation of the local assistance program in 1974-75 and $81,115 for Department of Education administration in Item 328.
We believe the Indian Education Program should continue through the three-year cycle as contemplated by the enabling legislation and concur in proposed total funding of $341,705. However, we are concerned that the Department of Education has not submitted the required evaluation report for the operation of the program in 1972-73.
C. INSTRUCTION FOR SPECIAL EDUCATION STUDENTS
The Instruction for Special Education Students Program is composed of the activities of the Division of Special Education and local assistance to school districts for the support of education programs for exceptional children. Exceptional children are students requiring special assistance beyond the regular school program because of mental or physical handicaps, or exceptional learning ability. I

Items 327-344 EDUCATION / 779
Table 22 summarizes expenditures and funding sources for all activities supervised by the division.
Table 22 Expenditure and Funding Sources for the
Division of Special Education 0
Actual Estimated 197~73 1973-74
1. Handicapped .......................................... $10,162,051 $11,529,221 Mentally retarded .............................. (325,000) (348,912) Educationally and physically
handicapped ........... , .............. (1,297,573) (1,550,337) Development centers ...................... (4,753,722) (5,311,250) EHA Title VI local projects ............ (2,292,132) (2,495,219) Educational improvement of
handicapped .......................... (1,400,624) (1,736,585) Gifted ............................................ : ....... (93,000) (86,918)
2. Special schools ...................................... 10,744,899 12,629,237
Totals .............................................. $20,906,950 $24,158,458 Funds:
State Operations: General Fund .................................... $10,762,513 $12,897,289 Federal funds ...................................... 1,588,467 1,736,585 Reimbursements ................................ 1,433,282 1,583,115
Subtotal ............................................ $13,784,262 $16,216,989 Local Assistance:
General Fund .................................... $4,830,556 $5,446,250 Federal funds .. · .................................... 2,292,132 2,495,219
Subtotal ............................................ 7,122,688 $7,941,469 • Bracketed figures are estimates of expenditures in each handicap category.
Proposed 1974-75
$11,995,644 (379,569)'
(1,246,479) (6,058,548) (2,586,397)
(1,635,582) . (89,069)'
13,371,536
$25,367,180
$13,505,462 1,635,582 1,627,109
$16,768,135
$6,012,630 2,586,397
$8,599,027
Table 23 summarizes budget act items which appropriate support for special education programs.
Item State operations:
328 (partial) 331
Local assistance:
Table 23 Budget Act Appropriations for Special Education
Purpose
Division of Special Education ................................. . Special schools ........................................................... .
Amount
$1,473,115 12,032,347
341 (partial) Development centers ................................................ 6,012,630
Totals .................................................................................................................................. $19,518,092
1. HANDICAPPED STUDENTS
Responsibility for the many categories of handicapped students is divided between three bureaus in the Division of Special Education: (1) the Bureau for Physically Exceptional Children which offers guidance to deaf, blind, orthopedically handicapped and multihandicapped programs in' local school districts, (2) the Bureau for Mentally Exceptional Children which offers guidance to educable and trainable mentally retarded, educationally handicapped, and gifted programs, and (3) the federally supported Bureau for Educational Improvement for Handicapped Children which administers federal aid programs and assists local school districts to

780 / EDUCATION Items 327-344
INSTRUCTION-Continued
initiate, expand, and improve programs for handicapped children. Table 24 summarizes expenditures for the instruction of handicapped
and gifted students. Table 24
Support for the Instruction of Handicapped Students lricluding Gifted
Actual Esbmated Proposed 1972-73 1973-74 1974-75
State Level: Administration ........................................ ($155,034) ($201,940) ($211,842) Mentally exceptional ................ ' ............ 312,848 435,830 468,638 Physically exceptional .......................... 1,082,612 1,165,640 1.032,712 Educational improvement
of handicapped ................................. , 1,400,624 1,736,585 1,635,582 Special education research .................. 243,279 249,697 259,685
Subtotal ................................................ $3,039,363 $3,587,752 $3,396,617 Local Assistance:
Development centers .......................... $4,830,556 $5,446,250 $6,012,630 Federal funds .......................................... 2,292,132 2,495,219 2,586,397
Subtotal ................................................ $7,122,688 $7,941,469 $8,599,027
Totals .................................................... $10,162,051 $11,529,221 $11,995,644
Table 25 presents expenditures for special education programs conducted by school districts. Figures for the physically handicapped program include children who receive only a few hours a week of remedial speech and physical education and thus contribute little to ADA. The per pupil expense for the special schools includes acomprehensive residential program .
. Development Centers for Handicapped Minors
Chapter 1235, Statutes of 1965, established the Development Center Program to provide day care and treatment for children unable to attend special education classes because of a severe physical handicap and/ or
. mental retardation. The program is designed to develop basic self-help skills and to, provide a placement alternative to the state mental hospitals. State allowances include $.1.75 per attendance hour plus $675 per ADA for transportation. For the 1973-74 school year, the state appropriated $5 million from the General Fund for development centers. State and local costs for the program are shown in Table 26
Under-Funding of Development Centers
We recommend that the Legislature fully fund pupils currently in development center programs by a General Fund augmentation of $2.4 million in Item 34l.
Eighty-one development centers are currently in operation, serving approximately 2,400 students. Under the current formula of reimbursement ($1.75/hr. X 6 hrs./day X 230 days/yr. = $3,100/pupil,plus local cost) the state's obligation for the 2,400 students already in development

Table 25 Expenditures for Special Education Programs
(1972-73)
Local State Total district
expenditure apportionments expenditure
Program Physically Handicapped
Hearing ............................................................................. , ........... . Vision ........................................................................................... . Orthopedic or other ................................................................. . Aphasic ............................................ : ............................................ . Deaf-Blind ........................................................... , ..................... , .. Other multihandicapped ......................................................... . Pregnant minors ....................................................................... . Other-physically handicapped ............................................. . Special blind allowance ........................................................... .
Subtotal, Physically Handicapped ................................. , ... . Mentally Retarded
Educable ..................................................................................... . Trainable ..................................................... ~ ................................ .
Subtotal, Mentally Retarded ............................................... . Special Transportation ................................................................. . Educationally Handicapped ............................ ; .......................... . Mentally Gifted ....................... ; ..................................................... . Development Centers ................................................................. . Special Schools ............................................................................... .
ADA
4,122 1,677 5,646
877 78
459 2,234
19,301 1,272
35,666
31,217 7,451
38,668 19,085 42,627
146,169 2,300 1,256
Totals.......................................................................................... 285,771
(millions)
$2.4 1.2 5.4
.5
.4 1.0
12.8
$23.7
$28.4 7.2 --
$35.6 $2.6 37.2 6.5 5.1 1.4
$112.1
(millions) (millions)
$11.2 $13.6 3.8 5.0 8.2 13.6 2.6 3.1
.5 .5 1.4 1.8 3.2 4.2
27.8 40.6 1.2 1.2 -- -
$59.9 $83.6
$31.0 $59.4 10.6 17.8 -- -
$41.6 $77.2 $8.2 $10.8 70.3 107.5 11.9 18.4 4.7 9.8 9.3 10.7
$205.9 $318.1
~ ~ (1)
3 CIJ
c.J ~
~ ~ ~
State Percent and paid by local
state expense/ADA
82.3% $3,299 76:0 2,981 60.2 2,408 83.8 3,534
100.0 6,410 77.7 3,921 76.1 1,880 68.4 2,103
100.0 . 943 -
71.6% $2,343
52.1 % $1,901 63.5 2,388
53.8% $1,996 75.9 $565
tz:l 65.3 2,521 ti 64.6 125 c::: 47.9 4,260 (j
:> 86.9 8,519 >-l -64.7% $1,113 0
Z .........
.... co ....

782 / EDUCATION
INSTRUCTION-Continued
Table 26 Funding for Development Centers
State operations ....................................................... . State local assistance ......................................... ... Local contribution ............................................... .
Total .................................................................... . Enrollment ........................................................... . Costs per enrollment ......................................... .
Actual 1972--73
$28,722 4,725,000 5,109,693
$9,863,415 2,300
$4,288
EsHmated 1973-74
$42,455 4,961,250 8,750,000
$13,753,705 2,400
$5,730
Items 327-344
Proposed 1974-75
$45,918 6,012,630
10,000,000
$16,058,548 2,700
$5,947
centers would be approximately $5.8 million plus $675 I student for transportation for a total of $7.5 million. The current year appropriation for development centers of $5 million is approximately $2.4 million below the Education Code formula derivation amount of $7.4 million.
In addition to the $5 million General Fund appropriation in the current fiscal year, the 1973-74 budget also anticipated the receipt of approximately $3.3 million in Social Security Title IV-A funds for full funding and expansion of development center programs. These funds did not materialize due to changes in federal eligibility regulations.
Because federal funds did not become available, the Governor's Budget proposes that the development center program be expanded by 200 pupils for the remaining .six months of the current year at a cost of $330,000 to the General Fund without fully funding the existing program. Funds would be continued in the budget year for these pupils plus an additional 100 pupils for a total of 2,700. The 1974-75 budget provides a total increase of $990,000 over the current fiscal year appropriation of $5 million for this purpose, again without fully funding the state's obligation.
We estimate that an additional $2.4 million would be required to fund the state's share for 2,700 students in development centers. There are an additional 700 pupils screened and eligible for admittance to development centers on waiting lists. The state cost to include these pupils in development center programs would be approximately $2.2 million at an average cost of $3,100 per pupil.
Title VI·B Funds
Education of the Handicapped Act (PL 91-230) Part B funds are available for state and local educational agencies to initiate, expand, or improve programs and projects for exceptional individuals in grades preschool-12. Approximately 5 percent of the state grant may be used for state administration of the act with the remainder for local projects and programs. State residential schools are not eligible for project funds. Current grant level is 'approximately $3.4 million in 1973-74. Projects may be written to cover from one to three years. Annually, about 50 percent of total grant funds are for continued projects and 50 percent are for new projects. Table 27 provides a breakdown of Title VI-B funds for fiscal years 1971-72 through 1973-74.

Items 327;;..344
Table 27· Education of Handicapped Act Title VI-B
Administration ........................................... . Projects ....................................................... .
Total ..................................................... . Projects:
Continuing ............................................. . New ......................................................... . Comprehensive planning projects ... .
Total ..................... '. ............................... .
Gifted Minors
Actual Actual 1971-72 1972-73 $150,048 $169,270
2,850,921 3,216,125
$3,000,969 $3,385,395
30 30
60
33 33
66
EDUCATION /783
Estimated 197~74
$169,270 3,216,125
$3,385,395 '
36-17 7
60
In 1961 the Legislature established a permissive program for mentally gifted minors in California. When a student's schoolwork and general mental ability test scores indicate that the student is in the top 2 percent of the statewide school population, the student is identified as gifted and eligible for programs designed to encourage academic excellence, creative problem-solving and leadership development. In 1972-73, approximately 156,000 students were. enrolled in two general categories of gifted programs. Ten percent of the total gifted enrollment attended special day classes consisting of advanced instruction certified as "qualitatively different" from regular classes. Ninety percent received special services, such as the use of advanced materials in the regular classroom, tutoring, correspondence courses, college courses, or special seminars. .
Allowance Increases. Chapter 994, Statutes of 1972, authorized an increase from $4Qto $50 in state allowances to local school districts in 1972-73 for the identification of gifted minors, and an increase from $60 to $70 in 1972-73, to $80in i973-74, to $90 in 1974-75, to $100 in 1975-76 and subsequent years for the instruction of mentally gifted minors. This increase is estimated to result in an additional state cost of approximately $1.6 million per year until full implementation in 1975-76.
Failure to Report. Chapter 1339, Statutes of i969; authorizes the State Board of Education to establish minimum standards for gifted minors programs. Regulations adopted in 1969 (Title 5, Administrative Code, Section 3831) require school districts to submit annual reports to the Department of Education demonstrating that their gifted programs are "qualitatively different" from the regular school program. All reports must be reviewed and approved by the department before school districts are eligible to receive state giftt:)d allowances.
In the 1973-74 Analysis of the Budget Bill we recommended that the Department of Education report to the Joint Legislative Budget Committee by November 1, 1973, on simplification of the repo:rting requirements for gifted' programs. We pointed out that districts submit voluminous reports which in some cases exceed 150 pages in length. Furthermore, the volume of material submitted made it unfeasible for the department consultants to review the reports and summarize the pertinent data for pro-

784 I EDUCATION Items 327--344
INSTRUCTION-Continued
. gram review. As of this writing, a final report has not been submitted for legislative review.
Master Plan for Special Education
In 1971 the Division of Special Education conducted a series of conferences throughout the state with parents, teachers, and administrators to discuss every aspect of special education. Opinions gathered at these conferences were then developed into a tentative Master Plan for Special Education. The division presented the master plan to the Advisory Commission on Special Education. The commission reviewed the master plan and suggested extensive revisions. Once the plan was reviewed by the commission it was sent to all school districts in the state for field review. Consideration of school districts' recommendation was made by the commission with further master plan revisions. In December 1973 the State Board of Education acknowledged receipt of the master plan and directed the Department of Education to prepare suggested implementing legislation for approval by the board. The Master Plan for Special Education and the proposed legislation were to be approved at the January 1974 meeting of the State Board of Education. .
The master plan proposes to eliminate the five categorical classifications of physically handicapped, educable mentally retarded, trainable mentally retarded, educationally handicapped and gifted by substitution of a single designation "Individuals with Exceptional Needs". All special education programs would be mandatory for pupils aged 3-21 (development centers, educationally handicapped, and mentally gifted programs are now permissive) . Pupils below the mandatory age would be served upon identification of their handicap or gifted characteristics. Every school distri<:!t, individually or jointly, would be required to develop a comprehensive plan to meet all of the special education needs identified in the district (s). State funding for exceptional individuals would be provided under two headings:
1. Support Services, which include: a) identification, assessment, and instructional planning, b) management and support services, c) special transportation services, and d) capital outlay, and
2. Instructional Services, which include: a) special classes and centers, b) a resource specialist program, c) designated instruction and services and d) nonpublic school services.
The master plan proposes state funding of all special education costs above the regular foundation program. Funds would be allocated on the basis of student need rather than by categorical disability.

Items 327--344 EDUCATION I 785
Local Responsibilities
A major feature of the master plan is the requirement for local district comprehensive planning to meet the needs of all exceptional pupils within the given geographic boundary of the plan. Districts unable to develop a comprehensive plan would be required to join together with other districts or the county if necessary. Low incidence handicaps such as deaf:p.ess or blindness would continue to be provided at the state special schools if a local comprehensive program cannot be established. Comprehensive plans would be developed based on criteria established by the State Board of Education. Plan approval by the State Board of Education would also be required before a district could begin implementation. All funds allocated by the state would pass through the county superintendent of schools to the district.
Phase-In
The Department of Education proposes a four-year phase-in period to test the feasibility of the master plan before extending the program state-. wide. At the end of the four-year period the Department of Education would evaluate the phase-in results and make recommendations for changes or improvements in a report to the State Board of Education and the Legislature. In the first three years of implementation, at least five to eight plans would be developed per year. The first year of planning would be conducted entirely with federal funds. However, the second year would require $8.0 million, the third year $15:7 million and the fourth year $22.9 million for a total of $46.6 million from the General Fund for planning, implementation and evaluation.
2. SPECIAL SCHOOLS
The State of California operates five special schools to provide services to handicapped minors whose districts of residence do not offer adquate \ special education services. These five schools are the: (1) California School for the Deaf, Berkeley, (2) California School for the Deaf, Riverside, (3}
Table 28 Estimated Support for Special Schools-1974-75
Total local General Reimbursements and state Expenditure Fund from districts support Enrollment per capita
Special Schools California School for Deaf,
Berkeley ............................. $3,182,371 $415,000 $3,587,371 356 $10,076 California School for Deaf,
Riverside .......................... 4,469,586 421,000 4,890,586 583 8,388 California Schools for
Neurologically Hand-icapped Children,
Northern .......................... 1,012,680 57,980 1,070,660 55 19,466 Southern .......... , ................. 940,213 84,295 . 1,024,508 55 i8,627 Central .............................. 857,009 50,940 907;949 55 16,508
California School for Blind, Berkeley ............................ 1,570,488 309,974 1,880,462 159 11,826
TOTALS ........................ $12,032,347 $1,339,189 $13,371,536 1,263 $10,587

786 / EDUCATION Items 327-344
INSTRUCTlpN:-Continued
Diagnostic School for Neurologically Handicapped Children, Northern California, (4) Diagnostic School for Neurologically Handicapped Children, Southern California, and (5) California School for the Blind, Berkeley.' All five residential schools are operated by the Division of Special Education. A sixth residential school, the Diagnostic School for Neurologically Handicapped Children, Central California, was authorized by the Legislature by Chapter 634, Statutes of 1973, but is not expected to become operational until the spring of 1974 with full scale operations in the 1974-75 school year. Table 28 summarizes support for the schools and per capita expenditures.
Deletion of Second School for the Deaf
We recommend that the proposed funds for a new school for the deaf be eliminated (See Capital Outlay Item 389).
We recommend that the Department of Education be directed to (1) designate by June 30, 1974 those areas in the state where regional elementary and secondary deaf programs could be established, (2) assist local school districts in the designated areas to establish regional programs for the deaf by September 1,1975, (3) return students enrolled at the schools for the deaf to local comprehensive programs that meet the requirements for education of the deaf; and (4) transfer the remaining students enrolled at the' California School for the Deaf; Berkeley, who lack a comprehensive local program, to the California School for the Deat; Riverside. (See Recommendation under Capital Outlay Item 389 deletion offunds for the School for the Deaf.)
The California School for the Deaf, Berkeley and the California School for the Blind occupy a joint facility in Berkeley consisting of40 buildings on a 50-acre hillside site. The Office of Architecture and Construction reports that approximately half of these buildings were constructed prior to the Field Act of 1933, and do not meet current fire and earthquake safety requirements. The State Fire Marshal agreed to permit the schools to remain open unfil June 30,1975. Existing law requires all pre-Field Act school facilities in the state, including the state special schools, to be . rehabilitated by this date or abandoned.
The Department of Education reports that earthquake hazards of the present site and high rehabilitative costs necessitated the relocation of the schools. The 1973-74 Governor's Budget proposed a $20 million appropriation to relocate the schools which was reduced by the Legislature to $2.1 million because construction could not be started in the current year. Chapter 1l20, Statutes of 1973, added an additional $1 million for a total of $3.1 million for site acquisition, site development and preliminary plans and drawings. The 1974-75 Governor's Budget proposes an additional $19.9 million for a total estimated state cost for the blind and deaf schools relocation of $23· million.
From our analysis of the relationship between state and local programs under the new state master plan it does. not appear that the state should build a new school for the deaf since the facility at Riverside is adequate to handle the state's share of the combined state-local program respon$'bilities ..

Items. 327-344 EDUCATION / 787
Growth of Local Programs
The ability of local school districts to initiate programs for the deaf is demonstrated from a review of statewide enrollments and enrollment growth. Table 29 shows the total enrollment for the hearing handicapped in 1972-73.
Table 29 1972-73 S~atewide Enrollment for Hearing Handicapped
Severely Percent of Percent Percent Hard of Hard of of
Deaf of Deaf Hearing Hearing Total Total Local Program Special Day
Classes and Schools Northern California ............ 1,069 701 1,770 Southern California ............ 1,851 1,092 2,943
Subtotal .............................. 2,920 77% 1,793 97% 4,713 83% State of California Schools for
the Deaf Berkeley ......................... : ...... 395 30 425 Riverside .............................. 495 25 520
Subtotal .............................. 890 23% 55 3% 945 17% -- -- --TOTAL ...................................... 3,810 100% 1,848 100% 5,658 100%
Enrollments at the state schools represent 17 percent of statewide e:nrollment with 83 percent in local districts. In the last 10 years the number of deaf students in local programs has increased from approximately 1,700 to 3,000 students while the state schools declined from 1,000 to 829 students. Local districts have absorbed all of the program growth in the past 10 years and are responsible for the education of more pupils at boththe elementary and secondary levels than the state schools for' the deaf.
State School Enrollments
Table 30 shows the enrollments at the state schools for the deaf over the past four-year period for both schools. Enrollment growth has occurred only at the high school level.
Despite the demonstrated shift of program responsibilities to the local level the state special schools have continued to enroll students from areas which provide local programs. The 903 students at the two special schools for the deaf in 1972-73 were from 45 of the state's 58 counties. (Enrollment at the schools in 1973-74 is down to 829 students.) However, 748 of the 903 students in 1972-73 were from 12 counties which operate county or district programs for the deaf as shown in Table 31.
Table 31 also show.s that the majority of deaf students at the state special schools are largely concentrated in a few urban counties. The policy of the Department of Education requires the special schools to serve students who (1) live in sparsely populated areas, (2) lack a comprehensive secondary educational program ~esigned for the deaf, (3) reside in an area where

Table 30 Enrollment in California Schools for the Deaf, 1970-1974 Q
1970-71 1971-72 1972-73 School Level NCb Scc Total NC SC Total NC SC Total
Elementary .......................... 175 266 441 150 2!Y7 357 126 186 312 (-84) (-45)
Junior High .......................... 157 146 303 152 134 286 67 115 182
High School .......................... (-17) (-104)
152 145 297 158 183 341 200 209 409 (+44) (+68)
Totals .............................. 484 557 . 1,041 460 524 984 393 510 903 • Excludes multihandicapped enrollment at Riverside (noneat Berkeley). b NC =Berkeley • SC = Riverside "8'
1970-71-1973-74 1973-74 percent increase
NC SC Total or decrease 97 131 228 -48%
(-84) 72 114 186 -39%
(+4). 187 228 415 +40%
(+6)
356 473 829 -20%
z en -I ::II C 0 -I (5 z I 0 0 :::I ... :;' c CD Q.
..... CO CO
........ t:rJ 0 c::: (j
~ 0 Z
-..... (l)
a en
"" ~ t

Items 327-344 EDUCATION / 789
TABLE 31 Partial Enrollments at the Schools for the Deaf
EnroUment Berkeley
Alameda .......................................................................................................... 95 Contra Costa .................................................................................................. 46 Fresno .............................................................................................................. 26 Sacramento ................................................................................... ; .............. ~... 17 San Francisco ........................................... ;...................................................... 22 San Mateo ................................................. ,...................................................... 21 Santa Clara ...................................................................................................... 40
Subtotal, Berkeley .................................................................................... 267 Riverside
Los Angeles .................................................................................................... 202 Orange.............................................................................................................. 34 Riverside .......................................................................................................... 126 San Bernardino .............................................................................................. 72 San Diego ........................................................................................................ 47
Subtotal, Riverside .................................................................................... 481
Subtotal ............................................................................................................ 748 Total enrollment at both schools .................................................................. 903
Percent
30%
53%
83% 100%
the local program does not meet the student's needs, and (4) have special circumstances such as family situation, local environment, or transportation problems. This policy is so broad as to allow practically any student to enroll even if a local program is available. We believe the present enrollment policy at the state special schools actually serves as a disincentive to the development of adequate local programs by taking students that could otherwise be served locally.
Special Education Master Plan Reinforcement
The concept of local responsibility is further reinforced by the new Master Plan for Special Education. As discussed previously, the master plan recently adopted by, the State Board of Education, proposes some major changes in the way exceptional children's needs are met at the local level. The master plan proposes that all local programs for exceptional children be made mandatory. In order to assure adequate programs all districts will be required to develop a local comprehensive master plan that specifies how every exceptional child within the boundaries of the master plan will be served. If a district cannot serve all exceptional children it will be required to join with other districts or the county superintendent of schools in the formation of its plan. This policy for a local master plan should result in improved local programs for the deaf and an increase in the number of regional elementary and secondary age deaf programs. An increase in regional programs reduces the need for two state schools for the deaf.
Problem of Secondary Programs
The State Department of Education has argued that despite the department's policy shift to an emphasis on local programs for the deaf, two state deaf schools are necessary to serve secondary students who do not have

790 / EDUCATION Items 327-344
INSTRUCTION-Continued
adequate local programs. This argument is weakened since several important local secondary programs have been established. For example, the Los Angeles County Superintendent of Schools established a program which serves approximately 140 students from 20 school districts in SouthEast Los Angeles County (SELACO) and a program for the deaf was established by Los Angeles Unified which serves over 150 students. These two programs, particularly the SELACO program, serve as models for esta)Jlishing other regional secondary deaf programs. The SELACO model was reviewed by the Superintendent of Public Instruction in 1973 and he endorsed it by stating "California should have 25 schools like SELACO."
The Department of Education has indicated that there are areas in the state where in accordance with the recent master plan additional regional programs for the deaf could be established (San Diego, Los Angeles and Sacramento Counties, and the Bay area). These areas correspond approximately with the 12 counties shown in Table 31.
The establishment of regional programs for the deaf in these areas could reduce the demand on the state special schools to the point where the School for the Deaf, Riverside, would have sufficient capacity to handle all deaf students statewide who lack a local program. Regional programs for which the state already provides financial assistance would improve programs for the deaf by increasing local enrollments and would meet the deadline for evacuation of the Berkeley facility by June 30, 1975.
Riverside Capacity
The capacity at the School for the Deaf, Riverside, is 540 residential students and 60 day students exclusive of the multihandicapped for a total of 600 students. The present deaf enrollment are 473 students at Riverside and 356 at Berkeley for a total of 829. If Riverside is operated at its residential capacity approximately 288 students would have to be returned to local programs (829-540 = 288) under our proposal. In addition, approximately 80 students are graduated each year. If these vacancies at the schools were not filled, the total enrollment shift would be further re-
; duced to approximately 200 students.
Financial Assistance in the Development of Local Programs
Under existing law, districts can apply to the state through the state school building aid program for apportionments to construct exceptional children facilities. Eligible districts are forgiven 50 percent of the state apportionment and allowed 20 years to repay the remainder. The Legislature could divert the funds proposed for the relocation of the School for the Deaf, Berkeley, into this program to further assist local districts in developing local programs.
The policy of the state to construct a replacement facility for the School for the Deaf, Berkeley, is an unnecessary one and we recommend against such Construction. We believe the establishment of local regional programs is preferable because most of the deaf students at the schools for the deaf are from urban counties which already operate district and county programs (see Table 31 page 789). Regional programs would maintain important community and family relationships for students and put the

Items 327-344 EDUCATION / 791
state residential schools as the place of last resort for an educational program.
Construction of School for the Blind
The precedmg arguments for elimination of the school for the deaf do not apply to the school. for the blind. The enrollments at the school for the blind are approximately 130 students in the current fiscal year. Over'90 percent of the enrollment consists of multihandicapped blind with most of the normal blind educated in local districts. Because of the low incidences of statewide multihandicapped blind, it is impractical to return these students to local districts. We believe the Department of Education should continue to seek a suitable site for the relocation of the school for the blind.
Funding E~ror We recommend a General Fund reduction of $14,000 from Item 328 for
the support of the Division of Special Education. In the budget year a 0.5 consultant position reimbursed from federal
vocational education funds was erroneously included in the General Fund support item for the Division of Special Education. Justification was not given for this change and we recommend therefore that the General Fund support be deleted.
D. OCCUPATIONAL PREPARATION
The Occupational Preparation Program administration in the Department of Education is a 100 percent federally funded program with a professional and clerical staff of 192 positions. The purpose of the occupationlil preparation unit is to (1) assist local education agencies in providing training and retraining in occupational skills, including remediation for persons with socioeconomic handicaps, (2) develop youth leadership in vocational organizations such as FFA, FHA, etc., and (3) assist teacher training institutions in the preparation and upgrading of teacher skills.
Occupational preparation including local assistance is supported by federal, state and local funds. Federal funds are authorized under the Vocational Education Act of 1968 (P.L. 90-576), the Manpower Development and Training Acf (P.L. 87-415) and under the Education Professions Development Act (P.L. 90-35). Table 32 shows the expenditures and funding by source of the occupation preparation program as shown in the Governor's Budget.
Table 32 Support for Occupational Preparation
Expenditures ............................................. . State Operations:
Federal funds ......................................... . Reimbursements ................................... .
Local Assistance: Gener3J Fund ....................................... . Federal funds .......................................... .
Actual Estimated 1972-73 1973-74
$50,651,645 $70,223,466
5,338,654 146,825
500,000 44,666,166
8,794,444 147,200
425,000 60,856,822
Proposed 1974-75
$63,900,977
8,152,319 154,368
425,000 55,169,290

792 / EDUCATION Items 327--344
INSTRUCTION-Continued
Table 33 provides a more complete breakdown of federal funds by state administration, contracts and local assistance. This table does not reflect later adjustments shown previously in Table 32. The Department of Edu
_ cation was not able to provide a reconciliation of these figures with the expenditure figures shown in the Governor's Budget for Vocational education.
Table 33 Federal Support for Vocational Education
State Operations: Administration ....................................... .
Contracts: Contract Water Resources ............ .. Contract Surplus Property ... , ........ .. Contract Community Colleges .... .. Teacher Training:
Program Operations .................. .. Agriculture ..................................... . Business .......................................... .. Homemaking ................................. . Industrial ......................................... .
Data Processing Program Services ........................ .. MDTA ............................................. . EPDA-Part F ............................. , ..
AMID5.-Teacher Training .......... .. PEDR-Direct Agreement .......... ..
Subtotal-Contracts ................ ..
Total .................................................... .. l.ocal Assistance:
Part A-Disadvantaged ....................... . Part B-Basic Grant.. .......................... .. Part C-Research ................................ .. Part D-Exemplary Programs and
Projects .............................................. .. Part F-Consumer and Homemak-
ing ............ , ........................................... .. Part G-Cooperative .......................... .. Part H-Work Study .......................... .. EPDA-Teacher Training ................ .. MDTA-"':Manpower Development.. .. Rural Area Redevelop~ent .............. ..
Subtotal ............................................... .
GRAND TOTAL.. .............. : ....... ; ...... .
Actual Estimated 1972-73 1973-74
$3,276,139
149,627 , 727,326
15,000 166,084 95,000
236,000
117,412 12,503
373,563 170,000
$2,062,515
$5,338,654
$1,911,290 25,567,291
530,978
227,305
1,916,047 1,177,471
704,597 623,712
11,569,778 437,697
$44,666,166
$50,004,820
$4,285,144
9,400 160,000 811,248
15,000 186,543 97,067 8,000
302,906
145,900 10,000 5,000
1,000,000 750,000
$3,501,064
$7,786,208
$1,788,364 36,492,401 2,1ll,136
479,864
2,469,658 1,055,582
620,087 763,662
12,370,500 2,000,000
$60,151,254 $67,937,462 ,
Proposed 1974-75
$4,797,848
9,400 160,000 811,248
15,000 193,421 97,332 8,000
303,538
145,900 10,000 5,000
1,000,000 750,000
$3,508,839
$8,306,687
$1,567,034 33,171,123 1,411,136
347,864
2,008,458 1,012,082
556,407 763,662
12,370,500 2,000,000 ---
I $55,208,266
$63,514,953
Budget estimates in Table 32 show a $20 million increase in the current over the past year and a $7 million decrease in the budget year. Fluctuations from year to year result from uncertainty in the availability of federal funds. For example; the actual grant amount for the current 1973-74 year is not known even though we are over six months into the fiscal year.

Items 327..:.344 EDUCATION / 793
Administrative Costs
Unlike most of the other federal education programs there are no federal vocational education administrative cost limitations imposed on the state. Consequently, vocational education administrative costs bemd to be higher than state administrative costs in other federal programs. However, the state administrative costs shown in Table 33 also include staff initiated projects and special contracts that are not true administrative costs. Inclusion of these funds in the administrative budget tends to distort the actual state administrative costs for vocational education. The Department of Education should provide a more comprehensive budget presentation in future years that more accurately reflects the allocation of vocational education funds by program subelements.
MOTA Matching Funds
We recommend the elimination of General Fund matching support for the Manpower Development Training Act for a General Fund savings in . 1974-75 of $425,000 (Item 344).
The Federal Comprehensive Employment Training Act of 1973 (CETA) eliminates the present state matching requirements under the Manpower Development and Training Act (MDTA). Under existing federal law states are required to match MDTA flinds on a 90/10 federal-state basis. The MDTA program expires as of June 30, 1974 and is superseded by CET A. The CETA manpower program contains no matching requirements. Because of the change in the federal law the appropriation contained in Item. 344 in the 1974-75 Budget Act should be reduced by $425,000.
Area Planning and Adult Continuing Education Committees
We recommend that the functions and responsibilities of the are,a adult continuing education coordination councils and area vocational planning. committees be reviewedjointly by the Chancellor of the California Community Colleges and the State Superintendent of Public Instruction to determine whether the two groups could be combined and to report their findings and recommendations to the Joint Legislative Budget Committee by December 1, 1974.
In 1968, the Legislature directed the Department of Education, the Board of Governors· of the California Community Colleges and the Department of Human Resources Development to divide the state into no more than 15 vocational planning areas and to establish no more thaI}. five pilot educational planning committees ip. five out of the 15 areas. Five area committees were established and have been operational for approximate·ly three years. The area planning committees are responsible for the review of vocational programs in the area. The committees are to develop (1) short-term recommendations for the improvement of vocational education and (2) area master plans with recommendations for implementation of the plans.
Chapter 701, Statutes of 1972 (SB 94), provides for the establishment of area adult continuing education coordinating councils where there is at least one community college and one high school which offer adult classes or programs. The councils (1) make recommendations to local boards to

794 / EDUCATION Items 327-344
INSTRUCTION-Continued
eliminate program duplication and (2) " ... make reasonable efforts to bring about agreement among district boards concerning adult and con-tinuing education plans and offerings." .
Existing law requires the area vocational planning committees to develop and submit "an area master plan providing for maximum coordination between vocational, technical, adult, and continuing education agencies within the area ... ". Area adult continuing education coordinating councils are also required to meet and review adult continuing education plans offerings". . . and make necessary recommendations to the respective school boards, in order to eliminate unnecessary duplication of offerings . . . .". The responsibilities of the respective boards. appear to be duplicative particularly as they relate to adult and continuing education program review. Therefore, we conclude a review is necessary to determine whether the two committees could be combined.
Regional Occupational Centers and Regional Occupational Programs (ROC/ROPs)
We recommend that the Legislature conduct an interim hearing to review the current legal ~tatus of vocational education services in regional occupation centers, regional occupation programs, high schools and community colleges.
In 1973 the Legislature directed the Legislative Analyst to conduct a study of area vocational planning committees. In the course of preparing that study we were made aware of a growing con,cern, especially among community colleges, over the role of ROC/ROPs in providing vocational education. The community colleges see themselves as "regional" organizations heavily involved in vocational education yet effectively excluded from the decisionmaking of ROC/ROPs. This situation has resulted in unnecessary duplication of program offerings, facilities and competition for students, among high schools, ROC/ROPs and community colleges.
In recent years there have been several items of spec~allegislation that provide loans for the construction of single ROCs and permit the establishment of single district ROC/ROPs. The speciaUegislation solves problems of particular school districts but does not meet the statewide need for a definition of the role of ROC/ROPs in the provision of vocational education in California. There is a need to determine (1) the optimum geographic size and population of a ROC/ROP, (2) the managerial relationship of ROC/ROPs to high school and community college vocational edm;ation programs, both for regular students and adults, (3) what vocational education programs are to be offered by which education agency and (4) a uniform funding formula for regional vocational education programs. The existing management system for vocational education among the several ed)lcational agencies 'promotes unnecessary duplication all(~ consequently wastes state and local resources and therefore, we recommend an interim hearing for speciallelSislative review.
E. GENERAL EDUCATION MANAGEMENT
The General Education Management (GEM) unit represents the consolidation of seven independent bureaus formerly operating as the Division of Instruction. These bureaus have been reorganized into a new

, Items 327-344 EDUCATION / 795
management structure to eliminate duplication in the administration of general education programs. Programs within GEM are assigned to one of the following six core areas:
(1) Federal core, including ESEA Title II and Title. III, NDEA, and federally funded guidance service and adult education programs.
(2) Health core, including health education, drug and alcohol abuse programs, and nutrition. .
. (3) Curriculum core, including all traditional academic programs such as reading and mathematics.
(4) Physical education and safety core, including traffic safety, civil defense and driver training programs.
(5) High-visibility core, including areas of special short-term emphasis such as conservation, curriculum frameworks, bilingual-cross cultural education, and mathematics and reading task force activities.
(6) Adult education core, including state-funded adult education programs in high schools and county jails.
Table 34 summarizes expenditures and funding sources for each core area.
Table 34 General Education Management Expenditures and Funding Sources
Actual Estimated Proposed Chanlle Core 1972-73 1973-74 1974-75 Amount Percent
1. Federal core ........................ $23,501,613 $23,017,904 $18,868,234 $-4,149,670 -18.0% 2. -Health core .......................... 680,598 820,144 615,615 -204,529 -24.9 3. Curriculum core ................ 119,238 189,732 193,746 4,014 2.1 4. Physical education and
siUety core .................... , ... 503,656 505,813 491,077 -14,736 -2.9 5. High visibility core ............ 3,989,065 6,935,762 7,996,271 1,060,509 15.3 6. Adult education core ........ 6,362,810 3,283,247 2,894,197 -389,050 -U.8 --
Totals .............................. $35,156,980 $34,752,602 $31,059,140 $-3,693,462 -10.6
Funding State Operations:
General Fund ...................... $1,663,514 $2,039,784 $1,954,135 $-85,849 -4.2 Federal funds ...................... 2,734,814 2,815,838 2,997,459 181,621 6.4 Reimbursements ................. 379,988 1,016,602 798,642 -217,960 -21.4
Local Assistance: General Fund ...................... 1,135,800 4,350,091 4,403,925 53,834 1.2 California Environmental
Protection Program Fund .............................. 275,000 275,000
Federal funds ...................... 26,018,032 24,435,287 20,629,979 -3,805,308 -15.6 Reimbursements ................ 3,224,832 95,000 -95,000
NDEA Title III
We recommend that state matching funds for federal NDEA Title III be reduced from $193,572 to $96, 786 for a General Fund savings of $96, 786 (Item 330). . Title III of the National Defense Education Act (NDEA) provides funds to school districts on a project basis for the purchase of instructional equipment (projectors, recorders, charts) and for minor remodeling of classrooms. Title III support consists of two separate sections: (1) state-level
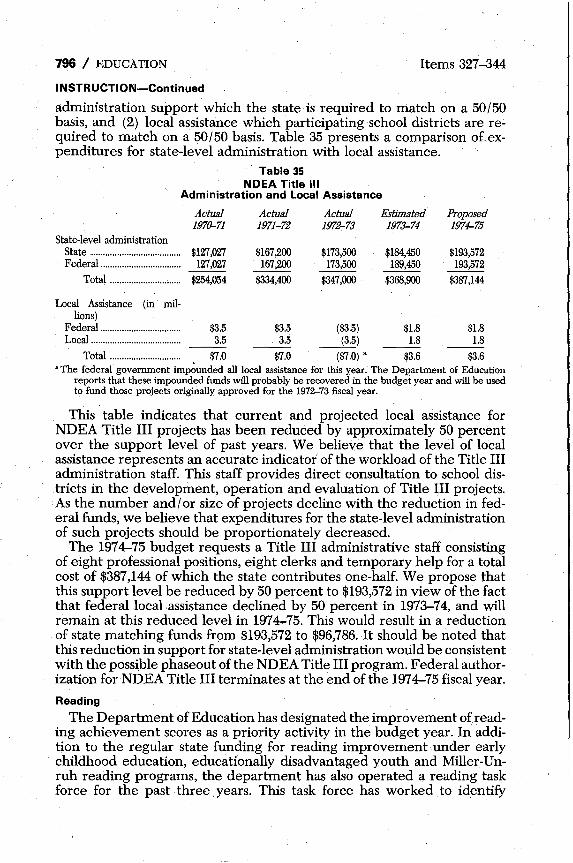
796 / EDUCATION Items 327-344
INSTRUCTION-Continued
administration support which the state is required to match on a 50/50 basis, and (2) local assistance which participating school districts are required to match on a 50/50 basis. Table 35 presents a comparison oLexpenditures for state-level administration with local assistance.
State·level administration State ..................................... . Federal ................................. .
Total ............................. .
Local Assistance (in millions)
Table 35 NDEA Title 11\
Administration and Local Assistance
Actual 1970-71
Actual Actual Estimated
$127,027 127,027
$254,054
1971-72
$167,200 167,200
$334,400
1972-;-73 1973-74
$173,500 $184,450 173,500 189,450
$347,000 $368,900
Proposed 1974-75
$193,572 193,572
$387,144
Federal.................................. $3.5 $3.5 ($3.5) $1.8 $1.8 Local...................................... 3.5 3.5~) 1.8 1.8
Total .............................. $7.0 $7.0 ($7.0) • $3.6 $3.6 • The federal government imp~unded all local assistance for this year. The Department of Education
reports that these impounded funds will probably be recovered in the budget year and will be used to fund those projects originally approved for the 1972-73 fiscal year.
This table indicates that current and projected local assistance for NDEA Title III projects has been reduced by approximately 50 percent over the support level of past years. We believe that the level of local assistance represents an accurate indicator of the workload of the Title III administration staff. This staff provides direct consultation to school districts in the development, operation and evaluation of Title III projects. As the number and/ or size of projects decline with the reduction in federal funds, we believe that expenditures for the state-level administration of such projects should be proportionately decreased.
The 1974-75 budget requests a Title III administrative staff consisting of eight professional positions, eight clerks and temporary help for a total cost of $387,144 of which the state contributes one-half. We propose that this support level be reduced by 50 percent to $193,572 in view of the fact that federal local assistance declined by 50 percent in 1973-74, and will remain at this reduced level in 1974-75. This would result in a reduction of state matching funds from $193,572 to $96,786. It should be noted that this reduction in support for state-level administration would be consistent with the possible phaseout of the NDEA Title III program. Federal authorization forNDEA Title III terminates at the end of the 1974-75 fiscal year.
Reading
The Department of Education has designated the improvement of reading achievement scores as a priority activity in the budget year. In addition to the regular state funding for reading improvement. under early childhood education, educationally disadvantaged youth and Miller-Unruh reading programs, the department has also operated a reading task force for the past three. years. This task force has worked to identify

Items 327-344 EDUCATION / 797
"target" schools in the state with excessively deficient reading programs. At the same time, the task force has identified exemplary reading pro, grams which could be implemented in these target schools to improve reading achievement. For the budget year, personnel of the reading task force have been merged wth personnel responsible for the administration of the new federally funded Right-to-Read program. This program will assist selected school districts to implement and evaluate exemplary reading programs with a major emphasis on administrator and teacher inservice training.
Mathematics
The Department of Education has provided special emphasis to the improvement of mathematics programs in school districts since statewide test results indicated a decrease in mathematic skills in the 6th and 12th grades. The department has operated a mathematics task force for three years to identify exemplary mathematics programs and program characteristics which resulted in improved student achievement. In the 1973-74 Analysis of the Budget Bill, we recommended that this task force (1) be expanded to better implement corrective mathematics programs and (2) submit a report in conjunction with the Office of Evaluation identifying precisely the weaknesses in existing mathematics programs. This report, now published, indicates that mathematics skill deficiencies appeared in grades 5 through 8, and were concentrated in computational skills, particularly inthe use of fractions and decimals. These results were confirmed by a subsequent study utilizing the State of California Inventory of Mathematical Achievement test (SCIMA). In the budget year, the mathematics task force will develop and circulate a cata.logue of promising practices which have been proven to result in increased student test scores, particularly in the areas of greatest deficiency such as computational skills.
Conservation Edu.cation
Chapter 1616, Statutes of 1970, directed the Department of Education to assist school districts to establish conservation education programs consisting of (1) in-service teacher training, (2) conservation classes, (3) nature centers and wildlife education camps, (4) information depositories, and (5) an internship summer program for high school students. School districts are required to submit project applications and receive support according to the merit of the project design, the availability of state funds, and the willingness of the district to provide local funds. The Department of Education has $275,000 budgeted from the Environmental Protection Fund for grants to school districts in 1974-75. The Department of Resources has restricted the use of these funds to "high visibility" activities such as site purchase, construction of nature centers and camps, and the purchase of conservation education equipment.
Instructional Television (lTV)
We recommend that General Fund Item 337 be increased by $270,000 to atotal of $840,000 for instructional support. '
Chapter 1236, Statutes of 1965 (The Farr-Quimby Act), authorizes the Superintendent of Public Instruction to provide funds to encourage use of
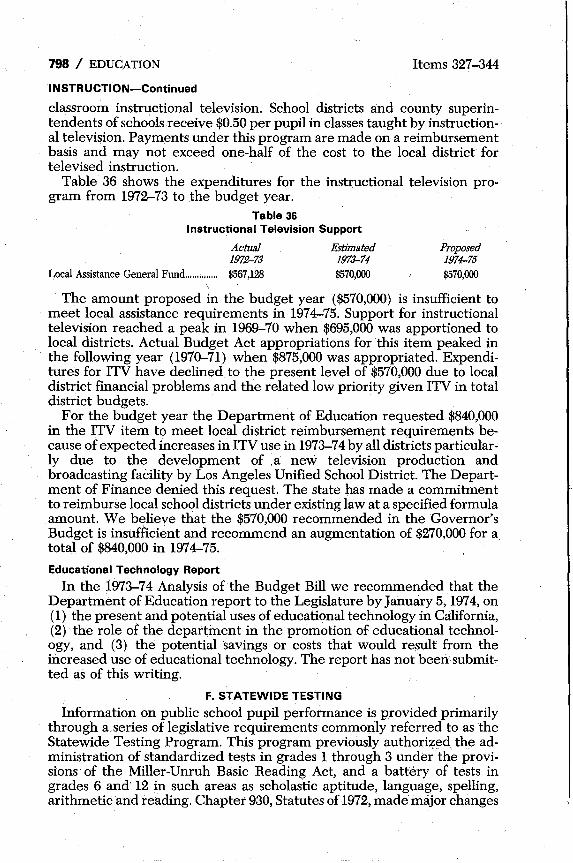
798 / EDUCATION Items 327-344
INSTRUCTION-Continued
classroom instructional television. School districts and county superintendents of schools receive $0.50 per pupil in classes taught by instructional television. Payments under this program are made on a reimbursement basis and may not exceed one-half of the cost to the local district for televised instruction.
Table 36 shows the expenditures for the instructional television program from 1972-73 to the budget year.
Table 36 Instructional Television Support
Actual Estimated 197~73 1973-74
Local Assistance General Fund.............. $567,128 $570,000 \
Proposed 1974-75 $570,000
The amount proposed in the budget year ($570,000) is insufficient to meet local assistance requirements in 1974-75. Support for instructional television reached a peak in 1969-70 when $695,000 was apportioned to local districts. Actual Budget Act appropriations for this item peaked in the following year (1970-71) when $875,000 was appropriated. Expenditures for lTV have declined to the present level of $570,000 due to local district financial problems and the related low priority given lTV in total district budgets.
For the budget year the Department of Education requested $840,000 in the ITV item to meet local district reimbursement requirements because of expected increases in lTV use in 1973-74 by all districts particularly due to the development of ,a new television production and broadcasting faCility by Los Angeles Unified School District. The Department of Finance denied this request. The state has made a commitment to reimburse local school districts under existing law at a specified formula amount. We believe that the $570,000 recommended in the Governor's Budget is insufficient and recommend an augmentation of $270,000 for a total of $840,000 in 1974-75.
Educational Technology Report
In the 1973-74 Analysis of the Budget Bill we recommended that the Department of Education report to the Legislature by January 5,1974, on (1) the present and potential uses of educational technology in California, (2) the role of the department in the promotion of educational technology, and (3) the potential savings or costs that would result from the increased use of educational technology. The report has not been submit" ted as of this writing.
F. STATEWIDE TESTING
Information on public school pupil performance is provided primarily through a.series of legislative requirements commonly referred to as the Statewide Testing Program. This program previously authori:zed the administration of standardized tests in grades 1 through 3 under the provisions of the Miller-Unruh Basic Reading Act, and a battery of tests in grades 6 and 12 in such areas as scholastic aptitude, language, spelling, arithmetic and reading. Chapter 930, Statutes of 1972, made major changes

Items 327-344 EDUCATION / 799
in the statewide testing program, beginning in the 1973-74 school year, The grade 1 reading test administered in the spring has been replaced with an entry level test for all grade 1 pupils which was administered for the first time in October of the 1973-74 school year. This test is used as a baseline for school and district evaluation rather than for individual pupil assessment, and will identify schools and districts with special needs .or unusually effective or ineffective programs.
A second major change to be implemented by 1974-75 is the use of sampling procedures for the tests in grades 2, 3, 6, and 12 so that all test items will not be administered to~ll students. This change will (1) reduce testing time (2) reduce school district costs and (3) provide a more comprehensive assessment of performance of each school and district in California.
The revised tests for grades 2 and 3 will be given for the first time -in the spring of 1974. The results of these tests will be compared with the first grade entry level test results and an evaluation report will be submitted to the Legislature and to each school district. The revised tests for grades 6 and 12 will be given for the first time in the 1974-75 school year. An evaluaton report of these test results will also be submitted to the Legislature and to each school district.
Performance Results
The results of the statewide reading test administered in grades 1,2 and 3 in the spring of 1973 are reported in the Governor's Budget, Vohime 2,' page 343. The test results show that the median scores of California pupils are slightly abo~e the median scores of the publisher's norm group and indicate a continuation of a slight annual improvement over the previous year.
The results ofthe statewide Comprehensive Tests of Basic Skills admInistered to all pupils in grade 6 in 1972-73 are reported in the Governor's BUQget, Volume 2, page 344. Achievement test scores in spelling for sixth grade pupils, in '1972-73 continued the gradual decline _ which has been ___ _ consistent since 1969-70. Achievement test scores'fOi'sixth grade pupils iii -reading, language, and mathematics in 1972-73 improved very slightly reversing a three-year downward tr~nd. However, it should be noted that median scores for California sixth grade pupils remained below the medi-an scor~sof the publisher's norm group in all areas tested.
The results of the statewide Iowa Tests of Educational Development administered to all pupils in grade 12 are reported in Volume 2, 'page 345 of the Governor's Budget. Scores of California pupils on achievement tests in all basic skills tested, i.e., spelling, mathematics, reading, and language expression in 1972-73, continued to decline slightly from the previous year, continuing a three-year downward trend. The median scores of' California 12th grade pupils remained below the median scores bf the publishers' norms irrall areas tested.
PUblisher'~NOr!l1S ,
It should be noted that the publisher's norm is the result of a nationwide sampling of usually 20,000 to 50, 000 students and should not be considered absolute inqic:!atorsof achievement levels. Publisher's norms,can vary sig-

800 I EDUCATION Items 327-344
INSTRUCTION-Continued
nificantly'depending 'on the sampling procedures and sample size. Comparisons with the publisher's norm provide only a very general
assessment of California pupils. We believe the new matrix testing system will provide a much more dependable assessment of the achievement of California pupils.
PROGRAM II INSTRUCTIONAL SUPPORT
The instructional support program is aimed at improving the educational environment in which the student learns. Program expenditures and funding are shown in Table 37.
Table 37 Expenditures and Funding Sources for Instructional Support Program
Actual Estimated Proposed Change Program elements 1972-73 1973-74 1974-75 Amount Percent
A. Direct instructional services ...................... $19,270,778 $33;920,775 $35,283,416 $1,362,641 4.0%
B. Pupil services .............. 83,346,991 90,286,530 . 90,128,284 -158,246 -0.2
Totals .......................... $102,617,769 $124,207,305 $125,411,700 $1,204,395 0.9 Funding: State operations:
General Fund .............. 1,462,691 1,335,755 1,580,130 244,375 18.3 Surplus Property Re-
volving Fund ............ . 3,855,912 6,778,242 6,922,618 144,376 2.1 Federal funds .............. 496,082 1,037,998 914,782 -123,216 -11.9 Reimbursements .......... 635,676 886,092 1,009,450 123,358 13.9
-Subtotal ...................... $6,450,361 $1o,rJ38,087 $10,426,980 388,893 3.9
Local assistance: General Fund .............. 13,630,545 652,137 608,976 -43,161 -6.6 Federal funds .............. 82,536,863 89,527,584 89,133,805 -393,779 -0.4 Instructional Materials
Fimd-General Fu-nd ................................ 23,989,497 25,241,939 1,252,442 5.2
Reimbursements .......... Subtotal ...................... $96,167,408 $114,169,218 $114,984,720 $815,502 0.7
A. DIRECT INSTRUCTIONAL SERVICES
Direct Instructional Services include (1) school approvals, (2) intergroup relations, (3) the Task Force on the Resolution of Conflict, (4) textbook distribution, (5) surplus property, (6) educational technology, (7) year-round schools and (8) teacher evaluation. Expenditures and funding for this element are shown in Table 38.
CURRICULUM FRAMEWORKS AND INSTRUCTIONAL MATERIALS Selection Unit and Textbook Distribution Unit
State adoption and· acquisition of elementary school textbooks is required by Article IX, Section 7.5 of the State Constitution. The mechanics of the textbook selection and adoption process are provided by statute.
The textbook adoption process can be divided into seven sequential steps: (1) request for framework development by the State Board of Education, (2) preparation of textbook selection criteria based on the adopted framework, (3) issuance of a 'call for bids to all publishers by the Depart-

Items 327-344 EDUCATION / 801
Table 38 Expenditures and Funding for Direct Instructional Services
Expenditures: State operations:
School approvals ......................................................... . Intergroup relations ................................................... . Resolution of conflict ................................................. . Textbook distribution ................................................. . Surplus property ......................................................... . Educational technology ............................................. . Year-round schools ........ , ............................................ . Teacher evaluation ..................................................... . Food services ............................................................... . Management services ................................................. .
Local assistance: Textbooks ..................................................................... . Instructional TV ......................................................... .
Total ........................................................................... . Funding: State operations:
General Fund .............................................................. . Federal funds ............................................................... . Surplus Property Revolving Fund ........................ .. Reimbursements ......................................................... .
Local Assistance: General Fund ............................................................. .. Instructional Material Fund .................................... ..
• Reimbursements b Moved to Program III, Pupil Services
$783,818 390,710 86,622
227,254 3,946,362'
105,551
99,879 37"
13,063,417 567,128
$19,270,778
$945,485 2o:J,l60
3,855,912 6.J5,676
13,630,545
$792,255 $925,907 654,846 239,587 30,685 389,005
382,554 356,411 6,850,479 6,994,561
169,005 163,591 89,850 .50,000
391,604 _b
352,415
23,989,497 25,241,939 570,000 570,000
$33,920,775 $35,283,416
$1,244,970 $1,122,004 473,574 439,005
6,778,242 6,922,618 864,492 987,850
570,000 570,000 23,989,497 25,241,939
ment of Education, (4) publisher submission of textbooks for review by the Curriculum Commission, (5) recommendation of textbook adoption ~ to the State Board of Education by the Curriculum Commission, (6) state board adoption of textbooks and Department of Education solicitation of district textbook orders and (7) manufacture of textbooks by the State Printer for distribution by the Department of Education or purchase of textbooks directly from the publishers by the districts. The textbook selection, adoption, acquisition and distribution process is on a two-year cycle.
r
Instructional Materials Fund
Chapters 929 and 1233, Statutes of 1972, established the State Instructional Materials Fund with afixed derivation formula to replace the annu-' al appropriation item for textbooks. The derivation amount is computed annually by the State Controller on July 1, by multiplying $7 by the preceding school year's' public and private elementary school enrollment (ADA). The formula is adjusted annually for changes indicated by the Consumer Price Index. The amount derived by this formula is $24 million in 1973-74 and $25.3 million in 1974-75. Table 39 shows the total support' for textbook selection, production, and acquisition in recent years.
The curriculum frameworks and instructional mat~rials selection unit and the textbook distribution unit are composed of the following elements: framework development, textbook selection, textbook adoption
28-85645
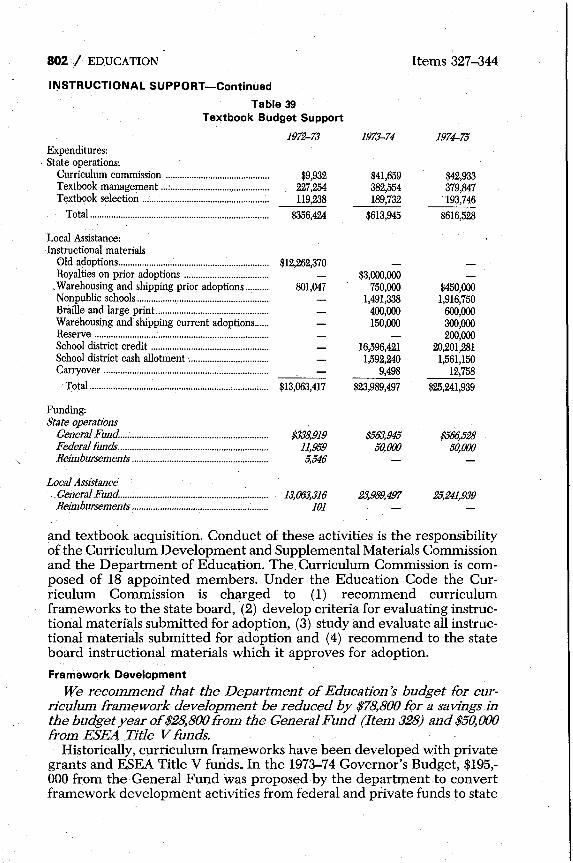
802 / EDUCATION
Il\iSTRUCTIONAL SUPPORT-Continued
Table 39 Textbook Budget Support
197~73 1973-74 Expenditures: State operations:
Curriculum commission ........................................... . Textbook management ... : ......................................... . Textbook selection .................................................... ..
Total ........................................................................... .
Local Assistance: Instructional materials
Old adoptions ............................................................... . Royalties on prior adoptions .................................. ..
, Warehousing and shipping prior adoptions ........ .. Nonpublic schools ....................................................... . Braille and large print.. ............................................ .. Warehousing and shipping current adoptions .... .. Reserve ........................................................................ .. School district credit ................................................ .. School district cash allotment ................................ .. Carryover ..................................................................... ..
, Total ....................................................................... : ... .
Funding: State operations
General Fund .............................................................. . Federal funds .............................................................. .. Reimbursements ......................................................... .
Local Assistance General Fund ..................................................... : ........ . Reimbursements ......................................................... .
$9,932 227,254 119,238
$356,424
$12,262,370
801,047
$13,063,417
$338,919 11,959 5,546
13,063,316 101
$41,659 382,554 189,732
$613,945
$3,000,000 750,000
1,491,338 400,000 150,000
16,596,421 1,592,240
9,498 $23,989,497
$563,945 50,000
23,989,497
Items 327-344
1974-75
$42,933 379,847 193,746
$616,528
$450,000 1,916,750
600,000 300,000 200,000
20,201,281 1,561,150
12,758 $25,241,939
$566,528 50,000
25,241,939
and textbook acquisition. Conduct of these activities is the responsibility of the Curriculum Development and Supplemental Materials Commission and the Department of Education. The Curriculum Commission is composed of 18 appointed members. Under the Education Code the Curriculum Commission is charged to (1) recommend curriculum frameworks to the state board, (2) develop criteria for evaluating instructional materials submitted for adoption, (3) study and evaluate all instructional materials submitted for adoption and (4) recommend to the state board instructional materials which it approves for adoption.
Framework Development
We recommend that the Department of Education s budget for curriculum framework development be reduced by $78,800 for a savingsin the budget year of $28,800 from the General Fund (Item 328) and $50,000 from ESE A Title V funds. .
Historically, curriculum frameworks have been developed with private grants and ESEA Title V funds. In the 1973-74 Governor's Budget, $195,-000 from the· General Fund was proposed by the department to convert framework development activities from federal and private funds to state

Items 327-344 EDUCATION / 803
funds. The Legislature rejected the total General Fund request. In the current year the department has continued to fund the framework activi- . ties by the use of ESEA Title V funds ($50,000) and by the redirection of General Funds ($30,000) from the Bilingual-Crosscultural Task Force and the Mathematics Task Force.
Violation of Legislative Intent
We believe that the redirection and use of General Funds for framework activities in the current year is a violation of legislative intent and we further question the continued use of ESEA Title V funds. The 1974-75 budget proposes to expend $78,800 ($28,000 General Fund and· $50,000 ESEA Title V) for framework development activities.
Need for Frameworks
The department contends that frameworks are needed by the state to develop criteria for use in the selection of instructional materials and are needed by local districts in "establishing or improving their planning, evaluation and program development capabilities." We remain unconvinced that frameworks are necessary for either of the suggested purposes and question whether the state should support the development and dissemination of frameworks. This funding request was rejected last year by the Legislature after hearing sImilar arguments and we recommend deletion of the request in the budget year.
If frameworks are needed by local education agencies perhaps framework development and dissemination could be established on a reimbursement basis with charges to local districts for development costs. There is precedent for charging for curriculum materials developed and produced by the State Department of Education, and the fiscal apparatus necessary for .charging districts is already established. The trtle need and value of frameworks to local districts could be more accurately reflectesl by charges to districts.
California Editions
We recommend that the State Printer print only those instructional materials adopted by the State Board of Education that will be economical to reprint throughout the period of adoption.
Chapter 929, Statutes of 1972, broadened textbook adoptions to make many more titles available for the local school district selection. For example, in 1972-.;73 there were 803 titles in adoption in all curricula subject areas. In the 1973 adoption for three subject areas, science, health and music, 625 titles were adopted which brings the total number of textbooks now in adoption to 1,349 titles. In the reading and literature adoption now under way, over 5,000 titles were submitted for consideration. It is apparent that the Legislature's desire for a larger local selection is being achieved. The larger selection, however, tends to reduce the size oftextbook orders. The smaller orders are generally uneconomical for the State Printer to print especially after the first year because annual replacements average only 10 percent. For example, in the science, health and music adoption, the largest order was for 39,000 copies compared with orders under the old adoption system of 450,000-500,000 copies. If the State Board

804 / EDUCATION Items 327-344
INSTRUCTIONAL SUPPORT-Continued
edits a textbook and the State Printer prints the book as a California edition there may be insufficient orders in subsequent years to justify reprinting the material. In such a situation districts would be forced to purchase unedited replacement copies direct from publishers, which would create curriculum difficulties for teachers.
While the State Printer has demonstrated substantial cost savings for the state, the benefits resulting from California editions may no longer be economical or practical if the textbooks cannot be reprinted each year of
. the adoption. We believe the State Printer should be limited to printing those instructional materials that will have sufficient reprint orders to justify manufacture at the State Printing Plant throughout the six-year adoption.
Textbook Warehouse
Werecommend that; (a) the Department of Education and the Office of State Printing (OSP) cooperate in developing supportable estimates of the total volume and cost of textbooks to be produced by the OSP during the 1974-75 fiscal year for distribution to local school districts and (b) the estimates be presented when the Department of Education and Department of General Services budgets are considered by the legislative fiscal committees. (See our Analysis of the Department of General Services, Office of State Printer discussed under Item 166.) . As mentioned above, the recent changes in the textbook law have made
a greater variety of textbooks available for local district selection. However, the dollar amounts available were not significantly increased, resulting in smaller textbook orders per title. The smaller textbook orders per title has caused a sharp decline in both the volume and total cost of textbooks produced by the State Printer. Because the Education Code limits the State Textbook Warehouse budget to 10 percent of the textbook production cost at the State Printing Plant we believe the volume and total cost declines for textbook production will have a serious impact on the operation of the State Textbook Warehouse.
,The Textbook Warehouse has a staff of 13 warehouse and clerk positions plus 6.3 positions in temporary help, with a proposed budget of $750,000 in 1974-75. Currently, estimates of textbook volume and production cost by the Department of Education and the Office of State Printer vary greatly. For example, the Governor's Budget estimates 23 million textbooks will be produced by the OSP in the current year and the budget year, while the Department of Education estimates 3.6 million in the current year and 8 million in the budget year. We believe the Department of Education and the Office of State Printer should cooperatively develop firm estimates of the total volume and cost of textbooks to be produced by the Office of State Printer in 1974-75 and present the estimates at the time their respective budgets are heard before the legislative fiscal committees.

Items 327-344 EDUCATION / 805
B. PUPIL SERVICES
Pupil services include funding and state level administration for food services and guidance services. Expenditures and funding of these ele-ments are shown in Table ~O. .
Table 40 Expenditures and Funding of Pupil Services,
Expenditure' 1. Food services ....................................................... . 2. Guidance services ............................................... .
Actual 1972-73
$83,147,735 199,256
Total................................................................ $83,346,991
Funding, State operations:
General FUnd.................................................... .... $517,206 Federal funds ........................................................ 292,922 Reimbursements ................................................. .
Subtotal .......................................................... $810,128
Local assistance: General FUnd ....................................................... . Federal funds ........................................................ $82,536,863
Subtotal .......................................................... $82,536,863
FOOD SERVICES
Estimated 1973-74
$89,670,804 615,726
$90,286,530
$90,785 564,424 21,600
$676,809
$82,137 89,609,721
$89,609,721
Proposed 1974-75
$89,667,624 460,660
$90,128,284
$458,126 475,777 21,600
$955,503
$38,976 89,133,805
$89,172, 781
The Department of Education's Food Services office is responsible for administering several programs of food supplementation for pupils while they are attending school. These programs are federally subsidized UIider the National School Lunch Act and Child Nutrition Act. Table 41 summarizes estimated federal allocations for these programs in 1973-74, and 1974-75.
Table 41 ESTIMATED 1973-74 AND 1974-75 FEDERAL LOCAL ASSISTANCE
FOOD SERVICES EXPENDITURES BY PROGRAM
Federal program: School lunch
General assistance ......................................................................... . Special assistance to needy children ......................................... .
School breakfast ................................................................................. . Special milk ......................................................................................... . Special food services
Year round ....................................................................................... . Summer ...................... " ................................................................... .
Nonfood assistance (equipment) ............................................ 1 ...... .
Estimated 1973-74
$23,354,983 50,502,286 6,018,617· 7,208,917
1,690,765 5,300,000 1,858,334
$95,933,902
Estimated 1974-75
$24,467,125 53,160,301 6,620,478 7,208,917
1,859,841 7,380,000 4,500,000
$105,196,662
The Governor's Budget estimates federal subsidies of only $89,094,829 in both 1973-74 and 1974-75. However, the Department of Education now projects the larger federal subsidies reflected in Table 41.
The purpose of the School Lunch Program is to provide a nourishing·

806 / EDUCATION Items· 327-344
INSTRUCTIONAL SUPPORT-Continued
lunch to a maximum number of pupils of highschool grade or under. A revision in federal regulations in November 1973 retroactive to July 1, 1973, increased federal participation in the School Lunch Program from 8 cents to 10 cents per lunch. In conjunction with this general program the Special Assistance to Needy Children Program provides free or reduced price lunches for needy pupils of high school grade or under. Federal regulations were revised in November 1973, retroactive to July 1, 1973, to increase from 40 cents to 45 cents the federal allowance per school lunch for this program. This subsidy is in addition to the lO-cent subsidy provided under the School Lunch Program.
The revised federal regulations of November 1973 also provide for semiannual adjustments to the federal subsidies based on changes in the "food away from home" series of the Consumer Price Index.
There are also federal subsidies for school breakfasts for needy pupils, a special milk program, and a nonfood assistance program to assist local agencies in acquiring equipment for food services.
Increased Local Cost
. School districts have experienced increased costs of providing school lunches and breakfasts due to inflation. The Department of Education advises that the average cost of a school lunch has substantially increased from the estimated statewide average of 65 cents in 1972-73. As mentioned above, the federal government has increased the basic subsidy for a type A lunch from 8 cents to 10 cents per lunch. It has also increased the subsidy for a free lunch to a needy child from 40 cents to 45 cents per lunch. Following is a comparative breakdown of the estimated average cost per lunch in 1972-73 and 1974-75 showing a substantial increase in net local cost of 8 cents per school lunch.
Table 42 School Lunch Cost Breakdown
1972-73 Estimated average cost per lunch...................................................... $0.65' Basic type A subsidy.............................................................................. $0.08 Free lunch or pupil charge.................................................................. 0.40 USDA commodities ................................................................................ 0.07
Total subsidy ........................................................................................ $0.55 Net local cost ...................................................................................... $0.10
1974-75 $0.80 •
$0.10 0.45 0.07
$0.62 $0.18
• Department of Education estimates this average cost at 75 cents-85 cents by June 30, 1974.
The Legislature passed SB 1264 in the 1973 legislative session which would have appropriated $27,874,000 to provide a state subsidy of 5 cents to 10 cents for each type A lunch or breakfast served to any school pupil. This measure was vetoed by the Governor who indicated that local districts should establish their own funding priorities in accordance with their needs and concerns. Presumably, these funding priorities would be associated with the use of state foundation program allocations and locally generated funds. We believe that, due to the inflationary spiral which food products are undergoing, the fiscal committees should be aware of this issue.

Items 327-344 EDUCATION I 807
Matching Requirements
We recommend that the Department of Education submit a report to the fiscal committees by March 1, 1974, comparing the state matching fund requirements of the National School Lunch Program with estimated state funds utJ1ized by local agencies in the School Lunch Program -in 1973-74 and projected for 1974-75. / _
Federal law requires state and local education agencies to provide matching funds, including fees paid by pupils, of $3 for every federal dollar allocated for the School Lunch Program. Table 43 reflects state and local matching requirements for each federal dollar allocated to the School Lunch Program. '
Table 43 School Lunch Program
State and Local Matching Requirements
Federal State and local matching Period subsidy State Local Total
1971-72 and 1972-73.................................. $1.00 $0.12 $2.88 $3.00 1973-74 and 1974-75.................................. 1.00 0.18 2.82 3.00 1975-76 and 1976-77.................................. 1.00 0.24 2.76 3.00 1977-78 and after ...................................... 1.00 0.30 2.70 3.00
The table indicates that the state matching share per federal dollar is 18 cents in 1973-74 and 1974-75 and should increase to 30 cents by 1977-78.
The Department of Education estimates that the federal school lunch subsidy will amount to $23.4 millionin 1973-74 and $24.5 million in 1974-75. This would require state matching funds of $4.2 million in 1973-74 and $4.4 million in 1974-75. By letter dated December 12, 1973, the United States Department of Agriculture's Western Region Program Director, Child Nutrition Programs, requested the Department of Education to reassess its state matching fund allocations in 1973-74 and 1974-75 in view of (1) the increase in federal subsidy to 10 cents and (2) the increase in the state's matching rate to 18 cents in 197;3-74 and 1974-75.
There are two ways by which the state matching fund requirement can be met: (1) by a General Fund local assistance appropriation to subsidize school districts food services programs, such as the Duffy-Moscone Family Nutritional Education and Services Act of 1970, or (2) by establishing that a pro rata portion of the state foundation program allocation to. school districts is utilized in their food services programs.
The United States Department of Agriculture has agreed that the state's matching fund requirement can bernet by state foundation program allocations to school districts to the extent that such allocations can be demonstrated to provide a pro rata share of the local agencies' expenditures for food service programs.
Possible Deficiencies
A preliminary assessment by the Department of 36 large school districts participating in the school lunch program indicates that state matching funds may be deficient in both 1973-74 and 1974-75.
If the portion of state foundation program allocations to school districts

808 I EDUCATION Items 327-344
INSTRUCTIONAL SUPPORT-Continued
utilized in the districts' food services programs is not sufficient to meet the state's matching fund requirement and since no state funds are provided specifically in either the current or budget year for local assistance in the School Lunch Program, there is a potential violation of federal regulations which could result in· the withdrawal of federal funds.
PROGRAM III SCHOOL ADMINISTRATION SUPPORT
The School Administration Support Program assists school districts to comply with regulations and reporting requirements established by the Legislature. The program consists of (1) the school district-management assistance team, (2) school facilities planning assistance, (3) management services, and (4) administrative services. Table 44 presents expenditures and funding sources for this program.
Table 44 School Administration Support
Expenditures and Funding Sources
Expenditures A. Management assistance team ................. . B. School facilities planning ........................ .. C. Management services .............................. ..
Actual Estimated Proposed 1972-73 1973-74 1974-75 $248,964 $362,959 $347,932 503,498 558,580 531,579 322,583 321,487.
Change Amount Percent $-15,027 -4.1 %
-27,001 -4.8
D. Schoolbus driver training ... ; ................... . 202,157 178,433 32,991 -145,442 -81.5 E. Administrative. services ............................ .. 54,235 Local assistance: year-round schools .......... .. 800,000 800,000
Totals .......................................................... .. $1,331,437 $2,221,459 $1,712,502 $-508,957 -22.9 Funding
State operations: General Fund .......................................... .. 573,754 502,610 179,678 -322,932 -64.2 Federal funds ........................................... , 248,964 362,959 347,932 -15,027 4.1 School Building Aid Fund .................... .. 256,801 300,010 291,579 -8,431 2.8 Reimbursements ...................................... .. 251,918 255,880 93,313 -162,567 -63.5
Local Assistance: General Fund .......................................... .. 800,000 800,000
• Moved to Program II.
BUREAU OF SCHOOL PLANNING
We recommend elimination of four professional positions and related clerical staff from the Bureau of School Planning for a savings of $160,000. (Item 328, -$146,687 and Item 329, -$13,313)
The Bureau of School Planning provides planning assistance to school districts in all phases of school construction. The bureau consists of one bureau chief and 13 school planning professionals who (1) assist school districts to prepare master plans for school construction, (2) review and approve site acquisition and school construction plans, and (3) develop guidelines, publications and research information regarding new educational planning and design techniques. Table 45 presents funding sources for the bureau.

Items 327-344 / EDUCATION /809
Table 45 Bureau of School Planning
Funding Sources
Actual Estimated
General Fund .......................................................... .. School Aid Building Fund .................................... .. Fee reimbursements ............................................... .
Total .................................................................. ..
197~73 1973-74 $198,872 256,801 47,825
$503,498
$181,123 300,010 77,447
$558,580
Proposed 1974-,75 $146,687 291,579 93,313
$531,579
The Bureau of School Planning provides school plaiming assistance to three types of school districts: (1) small rural school districts which lack local planning staffs, (2) school districts which apply for state school building aid loans, and (3) school districts which apply for earthquake safety loans to repair unsafe school facilities. Table 46 presents the projected workload of the bureau in terms of the number of district applications to be received for state school building and earthquake safety aid.
Table 46 Bureau of School Planning Workload
Number of Applications
Actual Estilnated Program 197~73 1973-74
State School Building Aid ................. :.................... 94 70 Earthquake Safety .................................................... 153 130
Total.................................................................... 247 200
Declining Workload
Proposed 1974-,75
70 60
130
This table indicates a significant decline in the actual and projected number of applications for state loans. This decline is caused by the leveling off of school enrollments throughout the state and the anticipated phaseout of earthquake aid programs as districts complete the renovation of unsafe facilities. The table indicates that applications for state loans declined by 19 percent from 1972-73 to 1973-74 and are estimated to decline by 35 percent from 1973-74 to 1974-75 for an average decrease of 27 percent. This decline is expected to continue at a less precipitous rate in future y~ars. We believe that the number of applications for state loans is an appropriate workload indicator for the Bureau of School Planning. The primary responsibility of the bureau is to assist loan applicants to develop district master plans and to design effective school facilities. It is clear that this workload depends directly on the number of district applications. Therefore, we believe that the staff of the bureau should be reduced by four professional positions (28 percent of the existing staff) and related clerical staff to reflect the decline in workload from 1972-73 to 1974-75 for a savings of approximately $160,000. This staff reduction would leave a professional staff of 10 school planners to continue to provide assistance to a diminishing number of state school building aid applicants and to serve as a clearinghouse for school facility planning information. .

810 / EDUCATION Items 327-344
SCHOOL ADMINISTRATION SUPPORT-Continued
PROGRAM IV SCHOOL FINANCE AND STATE AID TO SCHOOL DISTRICTS·
Administration and Apportionments of State Aid
The school finance and state aid to school districts program includes the two elements of (1) administration and apportionment of state aid and (2) administrative research. Table 47 summarizes funding and expenditures for these program elements.
The administrative research function is involved with preparation of various reports which are required by law. The administration and apportionment of state aid function is involved with transfers from the State School Fund for apportionment to local school districts and the adminis-tration of the County School Service Fund. \
Table 47 shows that approximately $2.1 billion will be expended from the General Fund' for apportionments in the budget year. These apportionments are for grades K-12 inclusive. Community college apportionments for 1974-75 were separated into a special fund by Chapter 940, Statutes of 1973, and are discussed under Item 366 Of this Analysis. The current year apportionment of $2.2 billion consists of $1.9 billion for grades K-12 and $.3 billion for community colleges.
School Apportionments System Public School State Aid
The system of public school apportionments is controlled by constitutional and statutory provisions. This system is generally considered to have three component parts: ,
1. Derivation. The amount of money authorized for annual transfer from the General Fund to the State School Fund for support of the public
. schools is referred to as the derivation of the fund. The derivation formulas are based on certain statutory and constitutional amounts per pupil in average daily attendance (ADA) in the preceding year. The statutory rate bears no relationship to the current level of school district expenditures; rather it is simply an automatic device to facilitate the annual transfer of funds.' .
Under current law the maximum amount authorized for transfer is $385.72 per ADA. .
2. Distribution. After the State School Fund is derived, it is distributed into various categories for educational programs and activities specified by statute. Programs supported include basic and equalization aid which make up the state's share of the foundation program, the County School Service Fund and allowances for special education programs for exceptional children.
3. Apportionment. The total amount authorized for transfer from the General Fund to the State School Fund is allocated to local school districts on the basis of apportionment formulas. The major component of state support is allocated to the foundation program which is designed to guarantee to public school pupils a prescribed level of financial support.The

Table 47 School Finance and State Aid to School Districts Program
Funding and Expenditures
Actual Estimated Proposed 197~73 1973-74 1974-75
A. Administration and apportionment of state aid 1. State operations .................................................................... $612,733 2. Local assistance .................................................................... 1,582,657,657
B. . Administrative research )State operations ...................................................... ;............... 162,612
Totals ........................................................................................ $1,583,433,002 Funding State operations
General Fund .............................................................................. . Local assistance
General Fund ........................... , ............................................... . General Fund (loan recoveries) ......................................... . State School Fund ................................................ , .................. . California Water Fund ......................................................... ...
Motor Vehicle Transportation Fund .................................... . Driver Training Penalty Assessment Fund State Transportation Fund ..................................................... . General Fund Federal Impact aid ....................................... .
$775,345
1,579,262,193 291,670
2,576,376 75,611
271,807
$556,813 $593,500 2,201,870,186 . 2,071,385,216
259,629 276,735
$2,202,686,628 $2,072,255,451
$816,442 $870,235
2,198,298,336 2,068,656,612 -343,150 -271,396 2,950,000 2,700,000
37,(J()() 300,000 300,000
628,000
-..... (l)
S CIl
c.J ~
~ "'-"'-
Change Amount Percent
$36,687 6.6% -130,484,970 5.9
'17,106 6.6
- $130,431,177 5:9%
$53,793 6.7%
-129,641,724 5.9 71,754 20.9
~250,000 8.4 -37,000
ttl
-628,000 0 c:: &? I-.,j -0 Z ....... 01) .. ..

812 / EDUCATION Items 327-344
SCHOOL. FINANCE-Continued
total program amounts in 1974-75 will be $825 per ADA for elementary districts, $900 per ADA for unified districts, and $1,OlO per ADA for high school districts. The state's share of the above amount consists of $125 per ADA for basic aid to all districts and additional support to certain districts, depending on their assessed valuation per ADA, in the form of equalization aid which enables them to reach the total guaranteed amount.
The 1974-75 foundation program levels shown previously have been increased $60 over the 1973-74 level in accordance with the statutory provision that such adjustments would be made if the change from the preceding year compared to the second preceding year in the statewide ratio of assessed valuation per ADA is 7 percent or more.
School District Revenue Control
In addition to the above features, the state's system of providing aid to local districts includes a local revenue control mechanism designed to limit the future growth in school expenditures and related property tax rates based upon revenues received in the 1972-73 fiscal year. The theory of the control mechanism is that after an annual inflation factor is determined, poor districts are allowed to increase their revenue limits by a larger amount than are more wealthy districts so that within a period of years expenditure per ADA in all districts will be nearly equal. The ceilings may be exceeded with local funds if specifically authorized in a district election.
Apportionment Data
State School Fund apportionment data are shown in Table 48
Table 48 APPORTIONMENT ESTIMATES
1972-73--1974-75
Elementary: Basic aid ........................ , ....................................... .. Equalization aid a ................................................. .
Totals ................................................................. . High School:
9-12 basic aid ...................................................... .. 9-12 equalization aid a .................................... 1 .. .
Adults, basic aid .................................................. .. Adults, equalization aid .................................... ..
Totals .......................................................... : ...... . Community College:
13-14 basic aid .................................................... .. 12-:14 equalization aid ...................................... .. Adults, basic aid .................................................. .. Adults, equalization aid ....................... : ............ ..
Totals ................................................................ .. County School Service Fund:
Elementary Foundation Program .................. .. High School Foundation Program ................ ..
Totals ................................................................. .
Totals, Foundation Program ............................ ..
Actual 197~73
$395,162,350 374,826,011
$769,988,361
$178,405,875 . 152,528,680
7,084,125 3,731,174
$341,749,854
$58,109,625 98,758,817 13,205,625 12,576,881
$182,650,948
$4,476,313 6,222,944
$10,699,257 $1,305,088,420
Estimated 1973-74
$391,250,000 658,422,100
$1,049,672,100
$181,500,000 271,483,000
1,375,000 3,964,BOO
$464,322,BOO
$58,875,000 167,441,200 13,662,500 13,308,BOO
$253,287,500
$7,124,000 13,905,000
$21,029,000
$1,788,311,400
Estimated 1974-75
$390,750,000 705,689,200
$1,096,439,200
$184,250,000 318,825,200
7,500,000 4,608,000
$515,183,200
($61,854,000) b
(204,914,500) b
(14,710,000) b
(18,510,500) b
($299,989,000) b
$7,BOO,OOO 15,715,000
$23,515,000
$1,635,137,400

Items 327-344 EDUCATION / 813
County School Service Fund: Direct service ................................... , ................... . $3,643,410 $3,654,700 $3,640,000 Other purpose ................ : .................................... . 15,779,199 15,976,260 15,912,000
Totals ................................................................. . $19,422,609 $19,630,960 $19,552,000 Special Education:
Physically handicapped ..................................... . $66,004,283 $69,829,320 $70,658,640 Mentally retarded ............................................... . 31,641,687 33,537,410 34,418,520 Special transportation ......................................... . 11,698,890 12,701,386 12,987,772 Transition ............................................................... . 3,278,660 5,000,000
Subtotals ............................................................. . $112,623,520 $121,068,116 $118,064,932 Educationally handicapped ................................ . 60,601,698 67,345,490 75,005,280 Mentally gifted ..................................................... . 11,478,089 12,500,000 13,800,000 Regular transportation ....................................... . 32,276,188 36,300,000 . 41,000,000 Adjustments (miscellaneous funds, special
education costs, increase/decrease prior year ADA) ......................................................... . -15,818,583 -15,633,000 -19,633,000
Totals per E.c. 17303.5 ............................... ; ... . $1,525,671,941 $2,029,522,966 $1,882,926,612 Special Apportionments and Programs:
State teachers' retirement system increase: elementary ....................................................... . $25,746,091 $29,200 ,000 $32,350,000
10,626,930 12,840,000 15,300,000 2,939,389 3,550,000 (4,430,000) b
High school ....................................................... . Community college ......................................... .
Totals ............................................................. . $39,312,410 $45,590,000 $47,650,000 Driver training ..................................................... . $16,392,196 $18,000,000 $19,600,000 Project connected ............................................... . 75,611 37,000 Community college handicapped adults ....... . 385,422 1,629,000 (1,361,000) Pilot programs for mentally retarded ........... . 152,600 Severance aid for highway land ..................... . 271,807 300,000 300,000
104;000 326,370 (549,173) b
Master Teacher Program ................................. . Assistance to new community college districts
Totals ................................................................. . $1,582,365,987 $2,095,405,336 $1,950,476,612 Educationally. Disadvantaged Youth Program 81,180,000 81,180,000 Early childhood education ............................... . 25,000,000 40,000,000
Grand Totals ............................................................. . $1,582,365,987 $2,201,585,336 $2,071,656,612 • Includes supplemental support for 1972-73. , b Shown for comparison purposes, figures not included in totals. Pursuant to Chapter 940/73, the commu-
nity college apportionments are displayed in the budget for the Board of Governors ofthe California Community Colleges.
Table 49 reflects the enrollment ADA used in the apportionment computations.
Table 49 Public School Enrollments-ADA
Level Elementary ................................................................ . High School ............................................................... . Community college ................................................. . Adult high schooL ................................................... . Adult community college ..................................... .
Total ....................................................................... .
1972-73 3,167,256 1,430,611
464,926 58,107
108,667
5,229,567
1973-74 3,122,300 1,456,000
482,473 59,000
114,141
5,233,914
1974-75 3,082,350 1,470,000
505,651 60,000 .
121,923
5,239,924

814 / EDUCATION
PROGRAM V LIBRARY SERVICES
Items 327-344
The Library Services program (1) furnishes reference materials and services for state government officials and employees, (2) maintains a library specializing in California history, and (3) provides consultant and resource services to the 192 city arid county public libraries in the state. The State Library also provides leadership to the state-funded cooperative public library system. More than two-thirds of the public libraries in the state have been consolidated in 21 cooperative systems which permits the coordination of book selection and processing, circulation and inventories, and reference service activities. Expenditure and funding sources for the four elerrients of the Library Services Program and local assistance to the cooperative library system are summarized in Table 50.
Table 50 Expenditures and Funding Sources of the Library Services Program
Actual Estimated Proposed Change 1972-73 1973-74 1974-75 Amount Percent
Program Elements: A. Reference and research
for the Legislature and state agencies ...................... $555,986 $589,257 $733,594 $144,337 24.5%
B. Statewide library support and development .............. 3,149,119 7,190,764 7,803,819 613,055 8.5
C. Special clientele services 684,518 1,464,983 1,072,306 -392,677 -26.8 D. State Library support
services .................................. 724,890 874,802 683,535 -191,267 -21.9
$5,114,513 $10,119,806 $10,293,254 $173,448 1.7 Funding:
State Operations: General Fund ...................... $2,023,989 $2,374,449 $2,(j(j(J,346 -285,897 -12.0 Federal funds ...................... 2,265,218 6,252,463 6,099,242 -153,221 -2.4 Reimbursements ................ 25,306 492,894 533,666 40,772 8.3
Local Assistance: General Fund ................ : ..... 800,000 1,000,000 1,000,000
General Fund support for special clientele services (Element C) in 1974-75 includes (1) a $145,300 augmentation for one additional librarian and five clerks in the handicapped loan service unit as provided by Chapter 878, Statutes of 1973, (SB 281) and (2) a $210,072 augmentation to transfer the compressed speech unit for handicapped persons from the Department of Education to the handicapped loan services unit in the State Library.
Table 51 presents General Fund support by budget item.
Item No. State operations
333 Local assistance
343 Total
Table 51 Budget Act Appropria:tion
for Library Service
Title
State Library
Assistance to Public Libraries
Amount
$2,660,346
1;000,000
$3,660,346

Items 327-344 EDUCATION / 815
The State Library receives federal funds under the Library Services and Construction Act (LSCA) for state-level operations and local assistance. Table 52 summarizes federal. support by title.
Table 52 Federal Support
Library Services arid Construction Act (LSCA)
197~73 1973-74 Actual entitlements
Title Received Impounded Total $5,178,550 1,040,735
560,695
Title I, Library services .......................... $2,081,348 $3,097,202 Title II, Library construction ................ 1,040,735 Title III, Library networking.................. 99,034 461,661
$2,180,382 $4,599,598 $6,779,980
Estimated Entitlements
$3,683,133
99,153
$3,782,286
This table indicates that approximately 68 percent of the 1972-73 LSCA entitlement was impounded by the federal government. The State Librarian reports that these funds have now been released and will be used to reinstate projects discontinued or curtailed in 1972-73 as a result of reduced federal support such as reference centers, outreach projects to rural and poverty areas without library services, library projects in state institutions, and service to the handicapped. The table also presents the estimated entitlements for the 1973-74 fiscal year, although to date. the State Library has received only $218,305 for such state-level operations as the development of a union catalog and automated book processing services.
Library Studies
In the 1973-74 Analysis of the Budget Bill, we recommended that the State Librarian be directed to develop a new formula by November 1, 1973, for allocating state support to the cooperative public library systems. In response to this recommendation and the availability of federal funds, the State Librarian decided there was need for a more comprehensive study on all aspects of the cooperative system and requester. a one year extension of the deadline for the development of a new allocation formula. This study will be performed by an independent contractor and is expected to cost approximately $200,000 in federal Library Services and Construction Act funds. The Department of Finance has also embarked on a major study of public library services in the state. Both agencies contend that duplication between the two studies will be avoided by the appointment of a special steering committee to coordinate the direction and scope of both studies. The State Library study will concentrate on the improvement of the cooperative public library system. The Department of Finance study will investigate procedures for coordinating all public, academic, and private libraries in the state.
PROGRAM VI DEPARTMENTAL MANAGEMENT AND SPECIAL SERVICES
This program consists of-two budgeted elements plus indirect cost units and service units which are allocated to all programs. Table 53 summarizes

816 / EDUCATION
LIBRARIES-Continued
expenditures and funding for these elements and units. Table 53
Departmental Management and Special Services Expenditures and Funding
A. Departmental management .......................... .. B. Special services ................................................. .
S\lbtotal .......................... ;.: .................................... . C. Indirect cost units .................................. : .......... . D. Service units ....................................................... .
Subtotal ................................................................. .
Total ....................................................................... . General Fund ........................................................... . Federal funds ............................................. ; ............. . Reimbursements dirC!ct ......................................... . Distributed costs ... : ................................................. .
Actual Estimated 1972-73 1973-74
$2,959,040 $4,410,820 210,516 444,992
$3,169,556 $4,855,812 3,846,892 3,800,584
333,874 712,346
$4,180,766 $4,512,930
$7,350,322 $304,755
2,821,850 42,951
4,180,766
$9,368,742 $2,272,079 2,539,514
44,219 4,512,930
Items 327-344
Proposed 1974-75
$4,402,693 537,493
$4,940,186 4,275,121
730,092
$5,005,213
$9,945,399 $2,172,284 2,469,673
298,229 5,005,213
The Governor's Budget displays a third element, priority programs, the costs of which are included in departmental management.
A. DEPARTMENTAL MANAGEMENT
The departmental management program is subdivided into executive, program administration and management services. Table 54 summarizes estimated expenditures for this activity.
Table 54 Departmental Management Expenditures
Executive ................................................................... . Departmental administration ............................... . Management services ............................................. .
Total ....................................................................... .
General Fund .................................................... : ...... . Federal funds ........................................................... . Reimbursements ..................................................... .
1. EXECUTIVE
Actual Estimated 1972-73 1973-74
$1,388,070 $2,950,826 889,687 716;465 681,283 743,529
$2,959,040 $4,410,820
$240,395 2,675,694
42,951
$2,050,329 2,316,272
44,219
Proposed 1974-75
$2,863,055 732,153 807,485
$4,402,693
$1,884,961 2,219,503
298,229
The executive subelement consists of the: (a.) superintendent's offke, (b.) deputy superintendents for programs and administration, (c.) office of program planning and development, (d.) office of program evaluation and research, (e.) governmental affairs, (f.) Mexican-American liaison office, (g.) liaison with nonpublic schools, (h.) information dissemination office, and (i) legal office.
Office of Program Planning and Development (PPD)
We recommend the deletion of three professional and two clerical positions in the office of program planning for a 1974-75 budget reduction of $111,017.

Items 327-344 EDUCATION / 817
The office of program planning and development is authorized 21 positions in the current year which are concerned with developing a department master plan, assisting in implementing new programs or changes in existing programs and providing staff support to the instruction program matrix. Approximately $500,000 is budgeted for this unit in 1973-74.
The 1974-75 budget proposes that this unit be increased by an additional thFee professional and two clerical positions ($111,017) to provide a total staff of 26 positions (19 professional and 7 clerical) with a budget of $673,-065. The increased staffing represents positions from the organization redirection and development task force which terminates July 1, 1974, since matrix implementation has been accomplished.
The department argues that the staff increase would in effect provide a specific program and policy assistance subunit housed within the office of program planning but operating independently,thereof to aid the superintendent's cabinet and specifically the chief deputy. We believe that this budget decision would result in a poor organizational structure which would hamper the effectiveness of the office of program planning's leadership. Program planning and policy assistance to the chief deputy and the superintendent's cabinet has been adequately provided for within the office's existing 21 authorized positions. Assistance to the cabinet can be accomplished by including the chief of the office at cabinet meetings . instead of augmenting his staff for this purpose. We recommend that the five additional positions be deleted. .
Office of Program Evaluation and Research
The office of program evaluation and research was established in July 1971 to consolidate in one unit all evaluation functions of the State Department of Education.The office reports directly to the Superintendent of Public Instruction through the chief deputy superintendent and thus functions independently from the deputy superintendents for program and administration. We believe it is important that the office have this independence so that an objective assessment can be made of program operations free of influence or bias from program managers.
The office (1) provides technical services to other department units, the State Board of Education, and the Legislature, and (2) conducts an evaluation of all specially funded programs or projects operated through the Department of Education. The activities of the office are carried out in three areas: (1) evaluation services; (2) state assessment; and (3) management information. A fourth subproject, research services, is to be added in 1974-75.
The Governor's Budget proposes that the office will operate in 1974-75 at the current year staffing level with funding increased only for normal cost-of-living allowances except the state assessment unit which administers the statewide testing program.
Unfunded Study of High and Low Performing Scho.ol Districts
Chapter 1094, Statutes of 1973 (SB 1109) provided for a two-year study of the relationship of pupil achievement to educational environment. An analysis will be made of the educational factors in schools where pupils with similar social and demographic characteristics achieve consistently

/ 818 / EDUCATION
MANAG EM ENT -Continued
'higher or lower than expected.
Items 327-344
The Legislature appropriated $lOO,OOO for the two-year study. The Governor vetoed $50,000 of this amount stating that the second year funding should be through the normal budgetary process. The 1974-75 budget does not include such funding. However, we believe the Legislature should provide funding to continue the program through completion based upon Department of Education reestimate of total cost require-ments. '
Statewide Testing Unit
This unit is authorized seven professional and 3.5 elerical positions in the current year with a budget of $753,000." The Governor's Budget proposes $943,000 for this unIt in 1974-75 with six professional and three clerical positions. Funding for 1974-75 is $295,500 (federal Title V ESEA funds) and $647,500 (state General Fund). The budget increase of $190,000 is to cover the increased state cost of development, printing, distribution, royalties,analysis and reporting associated with the new matrix testing system, less the reduction of one professional and one-half clerical positions, plus related operating expenses.
Statewide Testing Costs
We recommend an augmentation of $232,735 for the state assessment unit to provide $32, 735 for one additional education evaluation and research consultant plus related operating expenses, and $200,000 for the estimated cost of sconng the grade 2, 3, 6 and 12 tests.
We recommend a state General Fund augmentation of $32, 735 to support the additional position and the allocation of federal Title V ESEA funds for the sconng costs.
We believe this unit should be continued in 1974-75 with the seven professional positions authorized in the current year. The development and operation of the revised statewide testing program required by Chapter 930, Statutes of 1972, (see Analysis discussion page 798) has resulted in the state assuming a greater role in the management of the program. The Department of Education is responsible for designing and implementing revised matrix tests in grades 2, 3, 6 and 12 in all California schools. This includes supplying all test instruments to each school district and providing for uniform scoring of all tests by an independent agency. The State Department of Education must establish and refine the sam-
, pling procedure as the new program is implemented, provide for equating the new tests with the previous tests and make a much more comprehensive statewide assessment of the performance of California pupils than was done under the previous statewide testing program. We do not believe this unit should be reduced in size during such a critical transition in the statewide testing program.
The augmentation of $200,000 to score grades 2, 3, 6 and 12 tests is necessary because under the revised matrix testing program authorized
. by Chapter 930 all tests will be scored by an independent scoring agency. Since all school districts will be included in this requirement a legislative counsel opinion dated October 18, 1973, declares this to be a state-mandat-

Items 327-344 EDUCATION / 819
ed cost directed by Chapter 930. The Department of Education estimates there will be 1,243,000 tests scored for grades 2, 3, 6 and 12 at 18 cents each. This would amount to $234,000. However, we believe the Department's estimate is high and that the scoring costs should not exceed $200,000.
We are recommending a Title V ESEA funds augmentation of $200,000 for the scoring costs. However, if during the budget hearings it is subsequently determined that additional Title V ESEA funds are not available we will recommend an allocation from the General Fund.
2. PROGRAM ADMINISTRATION
The program administration subelerrient consists of the following divisionmanagers and immediate staffs: (a.) division of financial resources and distribution of aid, (b.) division of administrative services, (c.) general education management, (d.) special education, (e.) compensatoryeducation, (f.) vocational education, (g.) division of libraries, (h.) matrix management:(I) early childhood education management, (2) intermediate education management, (3) secondary/adult education management.
3. MANAGEMENT SERVICES
The management services subelement consists of the: (a.) budget office, (b.) fiscal reports office, (c.) accounting office, (d.) business services office, (e.) contract analysis office, (f.) internal audit office, (g.) EDP management office, (h.) EDP information systems office, (i.) personnel and training office, 0.) bureau of publications, (k.) management analysis office.
Failure to Comply With Legislative Directive
We recommend that the deputy superintendent for administration s office provide a written analysis by April 2, 197", of problems and recommended solutions to their inability to comply with the 1973 Budget Conference Committee directive concerning a preliminary program budget.
The 1973 budget conference committee report directed that "the Department of Education present a preliminary 1974-75 budget to the Department of Finance and Joint Legislative Budget Committee by November 1, 1973. This preliminary budget should clearly show (for the past, current and budget years) the allocation of all resources including personnel and operating expenses by program total and program element."
Voluminous descriptive material was presented to the designated offices in written form in October 1973. Unfortunately, the essence of this material, i.e., "the allocation of all resources including personnel and operating expenses by program total and program element," was missing until December. The absence of such material greatly hampers executive and legislative staff analysis of education issues and programs administered by
,the department. We do not believe that a November 1 due date for this material is
unreasonable. Experience with other major' state education programs such as the CSUC's has demonstrated that such a timeline can be met. We recommend that an explanation ofthe department's position be made. We
- also recommend that the data be presented for all subelements identified

/ 820 / EDUCATION Items 327-344
MANAGEMENT-Continued
in the budget. It is only of limited use to know that $156 million will be spent for compensatory education programs. We must also know the breakdown by components, i.e., Title I, EDY demonstration programs, etc., before an analysis can be complete.
Deficient Budget Presentation
We recommend that the office of Deputy Superintendent for Administration give high priority to improving its budget and reporting system in 1974-75.
Not only was the budget data information submitted by the department late, it was seriously deficient in the accuracy of the information provided. The inability of the department to reconcile its program budget to its line item budget nearly resulted in a deletion of the whole program budget in the Governor's printed document. Last minute changes allowed major totals to reconcile enough to print the budget. However, totals within programs still represent more of an approximation than a technically accurate expenditure plan. '
Examples of this phenomenon include: (a) The Governor's Budget (p. 388) reports a Title I expenditure in
1972-73 of$126.2 million but department worksheets only reflect an expenditure of $122.1 million.
(b) The Governor's Budget (p,385) reports a Title V expenditure in 1972-73 of $2,543,000 but department worksheets only report $2,-286,616.
(c) Proposed Budget Bill expenditures of ,$40 million for the instruction program of Early Childhood Education is no.t shown in Prog:a~ I-Instruction, but in Program IV-School Fmance and AdmlnIstrative Research.
(d) Despite the extensive writeup on the high priority teacher evaluation project, the budget detail reflected no expenditure of funds for this purpose either in the current or budget years. ,
Out-of-State Travel , We recommend that the Department of Education out-oE-state travel
budget be reduced 25percent for a savings of $53,244 ($5,000 from the General Fund and $48,244 from federal funds).
The 1974-75 budget proposes that the Department of Education expend $212,976 for out-of-state travel. This represents a 9.2 percent increase over the current year 1973-74 budget of $196,406 and a 150 percent increase over the actual 1972-73 expenditure of $82,817. At the time of this analysis the Department of Education is unable to supply a breakdown of the proposed expenditure between General Fund and federal funds. However, a review of the past year and current year budgets reflects that the General Fund has provided approximately $20,000 per year for this purpose.

Items 327-344 EDUCATION / 821
Table 55 1973-74 Budgeted Out-of-State Travel
State Department of Education
Man- Man-Purpose days years
Group conferences .................................... 603 2.7 Workshops .................................................. ff7 0.4 Federal meetings ...................................... 283 1.3
Totals .................................................... 983 4.4
A verage days Trips per trip 144 4.2 20 4.8 80 3.5
244 4.0
We concur that there is a need for state personnel to confer with federal officials despite the fact that the department maintains an office in Washington, D.C. However, it appears to us that the use of out-of-state travel, particularly for conferences, is excessive. The Department of Education should implement more restrictive policies in this area and our recommended reduction of 25 percent will aid in such implementation.
ESEA Title V Funding
Of significant aid to the department's operation is the federal ESEA Title V program which is authorized for the purpose of "strengthening state departments." The use of these funds by the California Department of Education is shown in Table 56.
Table 56 ESEA Title V Expenditures by Departmental Function
Function
Program planning and development ................ .. Program evaluation ................................................. . Organization redirection and development.. .. .. Management systems development .................. .. Curriculum planning and development .......... .. Management information system ...................... .. Urban education task force .................................. .. Career education task force ................................ .. Bilingual-crosscultural task force ......................... . Intergroup conflict task force ............................ .. Guidance and counseling task force .................. . Year-round schools task force .............................. .. School district management assistance teams .. Student liaison ......................................................... . Mexican-American advisory ................................ .. Nonpublic school liaison ...................................... ..
B. SPECIAL SERVICES
Actual Estimated 197~73 1973-74 $498,229 $494,023 526,813 499,791 164,676 m,722 112,874 237,362 10,896 81,207
494,735 169,997 38,834 82,774 92,942
25,000
238,843
---$2,286,616
120,619
30,685
80,051 329,408
17,768 53,210 43,785
$2,269,628
The special services element supports the following:
Proposed 1974-75 $562,048 521,506 m,Ol7 243,667 48,950
162,221
125,637
50,000 309,659 32,916 53,162 44,350
$2,265,133
(a) The state board of education, (b) educational com~ission of the states, (c) advisory commissions and committees, (d) advisory council on vocational education.
State Board of Education
We recommend the deletion of the $4,000 augmentation budgeted in 1974-75 for board member secretarial aid
The 1974-75 budget proposes an expenditure level of $84,000 for support of the lO-member state board of education. Included within this amount

822 / EDUCATION Items 327-344
MANAGEMENT-Continued
is a staff of one professional and 2.1 clerical positions and related operating expenses and equipment. Included as an augmentation to operating expenses is $4,000 to provide additional secretarial services, e.g., Kelly Girl, Manpower, etc. to the individual board members at their home residences.
We question the propriety of such an expenditure particularly as it appears to establish a precedent for numerous other state boards and commissions. It is the general state policy to provide clerical assistance to the various boards through staff centrally located at the related state agency office. We recommend the deletion of the $4,000 augmentation as a less than necessary expenditure and we endorse the existing policy which provides adequate assistance.
Educational Commission of the States
We recommend that the office of program planning critically evaluate the educational benefits of California s participation in the Educational Commission of the States and submit a report with recommendations to the Joint Legislative Budget Committee by December 1, 1974.
California is one of 45 states which are members of the Education Commission of the States. The commission is located in Denver, Colo., and is
Table 57 Allocation of Indirect Cost Units
Superintendent's office ........................................ .. State board ............................................................... . Legislation coordination office ............................ .. Legal office ............................................................... . Deputy for administration .................................. .. Grants and funds office ........................................ .. Deputy for program .............................................. .. Management financial resources and distribu-
tion of aid ........................................................ .. Fiscal management services ................................ .. EDP management. .................................................. . Budget office .......................................................... .. Fiscal reports' office ................................................. . Accounting office .................................................... .. Business. service office .......................................... .. Contract analysis office ........................................ .. Internal audit unit.. ................................................. . Management administrative services ................ .. Personnel and training office .............................. .. Management analysis office ................................ .. Managemept-vocational education ................... . Management-special education ........................ .. Management-compensatory education .......... .. Management-State Library .............................. .. Management-general education ...................... .. Statewide cost allocation ...... : ................................ .
Actual 1972-73 $473,765
79,963 110,398 144,629 54,773 49,253 70,729
54,955 42,677 18,390
129,375 91,374
571,185 512,994 31,370 1,418
58,244 203,898 90,391
173,534 132,100 184,615 118,412 448,450
Totals, indirect costs ............................................ $3,846,892' Less distributions to programs ...................... -3,846,892
Estimated 1973-74
$55,355 41,788
250,714 229,892 882,214 257,548
50,338 70,473 53,272
250,935 118,723 167,154 201,940 141,763 160,315 243,104 625,056.
$3;800,584 -3,800,584
Proposed 1974-75
$58,957 50,944
263,497 306,lll 967,525 276,342 56,311 78,110 60,329
263,520 142,734 184,942 211,842 147,454 311,Q68 245,435 650,000
$4,275,121 -4,275,121

Item 345 EDUCATION IS23
designed to facilitate communication and relation between educators and policy matters. California has seven commissioners, the Governor; two legislators and four educators, and pays an annual dues of $24,000. We believe that the value of participation in such an organization should be evaluated periodically. We have been unable to obtain a recent evaltiation of California's benefits from membership and recommend that the office of planning conduct such an activity.
C. INDIRECT COST UNITS
The indirect cost units are administrative departmental activities which support and are distributed to all programs on the basis of direct labor costs incurred by the programs. Table 57 summarizes the allocations of these units.
D. SERVICE UNITS
The service units are departmental activities which provide direct services to all programs but which are centralized to avoid duplication and to permit greater efficiency. The service units charge for services provided at established billing rates which absorb costs of operation. Table 58 summarizes expenditures of these units,
Table 58 Expenditures of Service Units·
Publications office ................................................... . Audiovisual services ............................................... . EDP management ................................................... . Duplicating services ............................................... . Word processing center ......................................... .
Actual Estimated· 197~73 1973-74 $301,615 $429,324
32,259 43,193 95,621 86,118 58,090
Totals, service unit costs .................................... $333,874 $712,346 -712,346 Less user charges .............................................. -333,874
Proposed 1974-75 $426,001
44,862 103,914 93,171 62,144
$730,092 -730,092·
CONTRIBUTION TO TEACHERS' RETIREMENT FUND
Item 345 from the General Fund Budget p. L-61 Program p. II-416
Requested 1974-75 ........................................ ; ...... ~ .......................... $135,000,000 Estimated 1973-74............................................................................ 135,000,000 Actual 1972-73 ......................................................................•........... 135,000,000
Requested increase-None Total recommended reduction .................................................... None
GENERAL PROGRAM STATEMENT
Contributions to the Teachers' Retirement Fund come from three different sources: teachers, school districts, and the state's General Fund.
Prior to Chapter 1305, Statutes of 1971, teachers' contributions were based on a schedule which vahed with the members' sex and age at entry into the system, averaging 7.4 percent of salary. The school districts con-

8241 EDUCATION Item 346
CONTRIBUTION TO TEACHERS' RETIREMENT FUND-Continued
tributed a maximum (limited by a tax base schedule), of 3 percent of teachers' salaries plus $6 semiannually per teacher. The State General Fund contributed the annual difference between benefits due imd payable and the combination of (a) annual school district contributions and (b) teacher contributions plus interest. The system was not actuarially
~funded because the employer (district) contributions were inadequate to . cover the employer obligation for benefit payments. As a result, the un
funded accrued liability of the system exceeded $4 billion in 1971. Chapter 1305, which became operative July 1, 1972, placed the system
on a more nearly funded basis by (1) requiring; beginning iIi fiscal year 1972-73, an employer contribution rate of 3.2 percent of salary for certified employees, increasing by, an additional 0.8 percent annually thereafter to a total or8 percent in 1978-79 (it also increases the Basic Aid Program in the Department of Education in scheduled steps by $8 per ADA in 1972-73 to $20 in 1978-79 to assist low-wealth districts with their employer contribution), (2) establishing an employee contribution rate of 8 percent of salary, and (3) providing an annual General Fund appropriation of$135 million for 30 years to finance the benefits of all members and beneficiaries on the retired roll as ofJuly 1, 1972. Aft~r 30 years, direct General Fund support will no longer be required because the Retirement Fund should have sufficient assets to meet both current benefit payments and commitments to the then active members.
ANALYSIS AND RECOMMENDATIONS
We recommend approval This statutorily required $135 million appropriation is at the same level
as in the current year and is an essential part of the plan to establish actuarial stability in the Teachers' Retirement Fund as directed by Chapter 1305.
COMMISSION FOR TEACHER PREPARATION AND LICENSING
Item 346 from the Teacher Cred~ntials Fu~d Budget p. 201 Program p. 11-424
Requested 1974-75 ......................................................................... . Estimated 1973-74 ................................... · ........................................ . Actual 1972-73 .................................................................. : .............. .
$1,928,819 2,414,219 1,755,855
Requested decrease ~$485,400 (20.1 percent) Total recommended reduction ................................................... .
SUMMARY OF MAJOR ISSUES AND RECOMMENDATIONS
1. Examination Development. Recommend Legislature (1) direct commission to curtail expensive examination development program in favor of program directed towards modifying existing examinations and (2) direct commission to administer such examinations as an alternative system.
None
Analysis page
827

Item 346 EDUCATION / 825
2. Control List Recommend Legislature direct commission 828 to adopt and promulgate written procedures for students to enter on an appeals basis the. Fisher Act control list after the December 1, 1973, cutoff date. .
ANALYSIS AND RECOMMENDATIONS
The Commission for Teacher Preparation and Licensing was established by Chapter 557, Statutes of 1970 (commonly referred to as the Ryan Act). The functions of the commission are to (a) review and approve teacher preparation programs in institutions of higher education, (b) develop and administer subject matter examinations as a method of credentialing teachers, (c) issue teacher and service credentials, (d) enforce morale and medical standards prescribed in the Education Code, and .( e) administer the orderly transition of powers, duties and regulations neces-sary to implement the Ryan Act. '
Table 1 summarizes expenditures and funding sources for the functions of the commission. '
Table 1 Expenditures and Funding of the Commission
for Teacher Preparation and Licensing
Functions a. Approved Programs ........................... . h. Examination Development .............. .. c. Licensing .............................................. .. d. Standards .............................................. .. e. Administration .................................... .. f. Teacher Evaluation Study ........... , ...... .
Totals ........................................................... . Teacher Credentials Fund ..................... . Federal funds ............................................. . General Fund ........................................... .
Ryan Act Reforms
Actual. Estimated Proposed 197~73 1973-74 1974-75 $234,858 $274,957 $281,336 143,012 774,931 237,798
1,102,767 1,080,172 1,080,437 356,184 284,159 329,248
(469,053) (477,699) (495,032)
$1,836,821 $1,755,855
80,966
342,000 1,200,000 $2,756,219 $3,128,819 $2,394,219 $1,928,8/9
342,000 1,200,000 20,000
Change 6,379
-537,133 265
45,089 . 17,333 858,000
$372,600 $465,400 858,000
-20,000
The Ryan Act was enacted by the Legislature to reform California's system of educating and credentialing elementary and secondary school teachers. Under the educational reform aspects of the act, (1) decreased emphasisjs placed on school of education courses (no lllore than 1,2 units of professional preparation courses including reading methodology can be required prior to student teaching), (2) students are required to be exposed to fieldwork in school districts to a greater extent (the act requires one semester of full-time student teaching), (3) prdvision is made for a liberal arts-diversified degree (84 units equally distributed among (a) English, (b) social sciences, (c) humanities and fine arts, and (d) math-ematics and the physical or life sciences), (4) all students of education must be trained to teach read.ing (a minimum of three units), and (5) students are encouraged to Gomplete a partial credential within four years in order to achieve immediate employment and obtain a life credential within the following five years.
The credentialing reforms of the Ryan Act (1) created the Commission 'for Teacher Preparation and Licensing, responsible to the State Board of

826 / EDUCATION Item 346
COMMISSION FOR TEACHER PREPARATION AND LICENSING-Continued
Education, consisting of 15 voting members appointed by the Governor and five ex officio nonvoting members, (2) authorized the credentialing of teachers either through a commission-approved examination to insure course and content knowledge or through a commission-approved academic program in specified areas at an institution of higher education, and (3) established one basic teaching credential and on~ basic services credential with subauthorizations by disciplines as shown in Schedule A. No credential, however; would be required to serve as chief administrative officer of a school district.
SchecfufeA Credentials Authorized by the Ryan Act
I. TEACHING CREDENTIAL: with authorizations in A. Single subject instruction in
a1. English 2. Physical science 3. Mathematics 4. Social science
a5. Industrial arts 6. Physical education
a7. Business aB. Music ag. Art
alO. Home economics all. Languages 12. Government 13. History 14. Life science
aBo Multiple subject instruction C. Specialist instruction in (including but not limited to)
a1. Early childhood education a2. Reading specialist 3. Mathematics 4. Special education
a5. Bilingual-cross-cultural D. Designated subjects (technical, trade, or vocational education)
II. SERVICES CREDENTIAL: A. Pupil personnel services, (including but not limited to)
1. Child welfare and attendance 2. Counseling 3. School psychology 4. School social work
aBo Health services ac. Library science an. Administration service
Concern About Implementation Weare concerned as to whether the transition to the Ryan Act has been
administered by the commission in: a timely and efficient manner so as not 'Guidelines approved by commission.

Item 346 EDUCATION I 827
to delay or unnecessarily hinder current college students in achieving their teaching or service credentials. Areas of specific attention include (1) development of subject matter examinations, (2) related waiver by the commission of academic programs which fulfill the examination requirements, and (3) creation of a control list of all students who can reasonably achieve a partial or complete Fisher Act credential by September 15, 1974.
Modifying Examination Procedures
We recommend that the Legislature (1) direct the commission to curtail its expensive examinaUon development program in favorof a program
. directed towards modifying exisUng examinaUons and (2) direct the commission to administer such examinaUons as a secondary alternaUve rather than as the primary system for credentialing teachers. '.
Perhaps the most unusual aspect of the Ryan Act is the requirement that "the adequacy of subject matter preparation and the basis for assignment of certified personnel shall be determined by the successful passage of a subject matter examination as certified by the commission, except as specifically waived ... " It is currently estimated that full implementation, of the Ryan Act will require the certification of 22 examinations to cover the single subject, multiple subject, reading, administrative and services areas.
The act required the commission to create subject matter advisory panels consisting of recognized leaders in the subject matter fields. VaribUS panels of approximately five members each were designated between October 1971 and June 1972. (Due to 1973 legislation, panels in government, history and life sciences are still to be designated.) Their duties were to establish the scope and content of knowledge in each subject matter area i.e. English, mathematics, etc., and to determine if there were existing national examinations which were adequate to test such knowledge.
Except for the multiple subject and reading examinations the panels determined that existing examinations were inadequate to meet their scope and content determinations and that the commission should proceed to develop new examinations which contained adequate· subject matter scope and content as recommended by the panels and adopted by the commission. Time Table Problems
The commission's original planning timetable called for all of the examinations to be available to students in the fall of 1974. To aid in this purpose the Budget Act of 1973 provided, in Item 313.1, a $350,000 GeneralFund loan to the commission.
As of January 1974 only two examinations are available, seven single subject scope and content documents have been cleared for examination development, and seven adoptions are outstanding (see schedule A). The seven adopted statements were offered to private examination ~evelopment companies for bid. Two companies made bids to the commission. However, the bids were so high that the commission rejected them and directed the staff to negotiate with the companies for lower bids. These. negotiations are currently underway, and none of the $350,000 which the commission in May of 1973 maintained was' needed "immediately" has

828 / EDUCATION Item 346
COMMISSION FOR TEACHER PREPARATION AND LICENSING-Continued
been encumbered. Unanticipated surpluses have allowed the $350,000 to be available from the Credential Fund instead of the General Fund. The commission has requested an additional $600,000, for 1974-75 which is not included in the budget.
We believe the $350,000 provided in 1973-74 is adequate to accomplish the examination development responsibilities, particularly if the funds are utilized to adapt existing examinations. Additional augmentations would be excessive, in light of (1) legislative concern expressed at a special hearing of the Assembly Education Committee on November 13, 1973, that the examinations were merely a secondary alternative, rather than the primary, means to a credential and (2) the commission's estimate that their planned $1 million development program will result in a $50-$60 application fee.
Examination Waivers
As the alternative to the examination process, the Ryan Act specifies that "the commission shall waive the subject matter examination requirements for graduates of accredited public and private institutions of higher education who hold subject matter degrees specified by the commission. ElIgibility for an examination waiver can only be achieved when the subject matter degree is one which is listed by the commission ... "
The commission has interpreted this requirement to mean that the instttutions' academic programs will be approved under the waiver provisions when they comply with the extensive examination scope and content requirements specified by the various subject matter panels. This policy will require a detailed analysis of each English, government, etc., degree program in all the state's institutions of higher education.
Many institutions of higher education are concerned that the commission's interpretation of the Ryan Act is overprescriptive. The act makes no mention of academic degree· scope and content analysis. As stated previ'ously, it merely says "eligibility for an examination waiver can only be achieved when .the subject matter degree is one which is listed by the commission ... " Thus, an accredited English degree would satisfy the English category and consequently simplify the credentialing process in accordance with the intent of the Ryan Act. We recommend this approach.
Control List
We recommend that the Legislature direct the commission to adopt and promulgate written procedures for students who desire to enter on an appeals basis the Fisher Act control list after the December 1, 1973, cutoff date.
Those students who can reasonably complete a partial or full credential under the Fisher Act by September 15, 1974 are not covered by the Ryan Act. In an attempt to avoid hardships, the commission adopted the concept of a control list of Fisher Act students (commonly referred to as the "Lock List") in April 1973. While there was some discussion of the list procedure, a definitive directive was not issued to the institutions of higher education until September 28, 1973. This document requires the institutions to analyze their students' status and no later than December 1, 1973,

General Summary HIGHER EDUCATION / 829
submit a list of persons who are in credential programs for which the institution is approved and who can reasonably be expected to complete at least a partial Fisher Act credential by September 15, 1974, in the program in which they are enrolled. The directive is a brief 1 ~ page statement which allows each institution a broad range of discretion particularly as it decides which part-time students will be on the list. Since there were some 70 institutions administering the lists within a two-month period, the criteria for inclusion varied. Students with similar characteristicscould enter the list at one institution, but not at another. Students who dropped out for a semester in fall 1973 did not enter the list. There is no clear written statement from the commission explaining (1) whether there will be an appeals process to add names to the December 1, 1973, list, (2) by whom it will be administered, or (3) how it will be administered. We suggest a need for administrative clarification of these matters.
Student Confusion
These issues create a large element of apprehension and confusion among education students. Ryan Act students who are three-fourths through their B.A. degree program are counseled that subject area examinations have not been developed nor have any college academic programs which would serve to waive the examinations been approved by the commission. These students are advised (1) to trust that their current college programs will be approved by the commission and (2) that if they must eventually take examinations, the examinations will be developed on time and the student's knowledge in the various subject areas will be sufficient for successful completion of the examination whose scope and content in many popular areas such as mathematics and social sciences is yet to be defined by the commission. We view this to be a disturbing situation at best. Hopefully the budget review process will aid in clarifying and relieving current problems associated with implementing the Ryan Act.
HIGHER EDUCATION
_ Page General statement ............................................................................................. 829 California Postsecondary Education Commission (Item 347) ............ 841 Western Interstate Commission for Higher Education (Item 348) .... 843 . University of California (Items 349-357) .................................................. 845 Hastings College of Law (Item 358) .......................... ' ................................. 894 California State University and Colleges (Items 359-364) .................... 9(n California Maritime Academy (Item 365) ...... ;......................................... 945 Board of Governors of the Community Colleges (Items 366-367) .... 951 State Scholarship and Loan Commission (Items 368-371) .................... 961
HIGHER EDUCATION GENERAL STATEMENT
This general statement section sets forth data which relat~s to all higher education in California. Its purposes llre to provide historical information and comparative statistics to augment individual agency and segment budget analyses which follow. Information on higher education organiza-