Embed Size (px)
Citation preview

7-40
7.4 Application of Multi-purpose Utilization of Geothermal Energy to Indonesia
7.4.1 Multi-purpose Utilization of Geothermal Energy
The geothermal resource is versatile for not only power generation but also multipurpose utilization for agriculture and the fishing industry, etc. The geothermal energy are used by receiving the supply of heat from the geothermal power plant, or securing geothermal energy by geothermal well drilling in general. A plantation agriculture, horticulture, cultivation, air-conditioning, and dry processing, etc. in the low cost can be done using geothermal energy as by-product of geothermal power business. Only the power application seems to be noted in the geothermal development in Indonesia. It is hardly thought to grant favors of the geothermal development, such as the heat supply etc. to local people in the surrounding area of the geothermal field of power development. It is necessary to introduce the industry by the multipurpose utilization of geothermal energy using a waste heat from the geothermal power plant in the future for social development. Furthermore, geothermal energy of relatively low temperature from hot springs will be used as alternative energy source of fossil fuel. The multipurpose utilization will contribute to global environmental preservation as well as geothermal power generation.
This study was conducted to investigate the possibility of application of the multipurpose utilization of geothermal energy to geothermal fields in Indonesia. According to the geothermal law, not only geothermal power development but also direct (multipurpose) use of geothermal energy should be promoted and the business of the direct use of geothermal energy by local governments is encouraged. However, a specific method of multipurpose utilization is still opaque, and does not have an appropriate business model either. It is necessary to discuss the overall plan of geothermal development including the multipurpose utilization. Examples of the effort of various promotions of multipurpose utilizations of geothermal energy in Indonesia and other countries, and useful information for future introduction of the multipurpose utilization into the Indonesian geothermal fields are introduced in this section.
Utilizations at various fluid temperatures on the basis of the geothermal direct use in many countries of the world are shown in Fig.7.4.1-1. Various direct uses of geothermal energy are conducted in the geothermal countries. For example, the heat supplied from the power plant is used for a dry processing of farm products in the southern Negros in the Philippines and the floriculture cultivation is done using air-conditioned green houses with geothermal energy around the Olkaria geothermal power station in Kenya. However, detailed data and condition of these multipurpose utilization businesses cannot be available. Therefore, the direct use businesses in Japan are introduced in this section.
The cases of the direct use businesses in Oita prefecture, Japan, where geothermal

7-41
generation businesses are active, are introduced (ECFA 2003). Farm and fishery products and processed goods by the multipurpose utilization of geothermal energy are known as results One Village One Product Movement in Oita prefecture in Japan. One Village One Product Movement is cooperation activity between citizen and local government for social development in Oita.
Utilization of geothermal energy in Oita, Japan, such as Onsen and swimming pool in tourist industry is well known from of old. Recently, the geothermal heat is noted as a clean energy source and is being used for horticulture of the vegetable and floriculture, soft-shelled turtle's culture fishery, heating of facilities, and the forestry use, etc. in Oita as shown in Table 7.4.1-1. In particular, horticultures of floriculture in Amagase town and Kokonoe town are regarded as successful business. An eminent floriculture apartment of a housing complex was constructed, and the hot water from a few geothermal wells has been supplied for the greenhouse.
Roses are cultivated in the greenhouse, and are shipped to major cities in Japan everyday. This must be successful business with a high profitability. People in these towns are establishing the floriculture union. Construction and management of the greenhouse are being executed by the union. The local government takes charge of securing the geothermal energy using geothermal wells in Amagase town because there was a resources development risk. The geothermal wells were drilled by the local government of Amagase town and the hot water from the wells is supplied to the green house by the government. The local government is applying the fee from the union for to maintenance of the geothermal wells and pipelines.
In Kokonoe town, hot water is supplied from the geothermal wells in the geothermal power station to the green houses. The green house complex has been managed by the floriculture productive union and floriculture cultivation in the green houses is conducted by union members.
Local people are able to participate in the business of the multipurpose utilization of geothermal energy without risk, if hot water is supplied from the geothermal power plants in Indonesia. It is necessary to organize the union etc. when the supply of heat is received from the geothermal power plants. It is necessary to discuss best operation procedure that is appropriate for the region. Neither design nor operation of the facility for the multipurpose utilization of geothermal energy is technically arduous. However, scale are deposited in the hot water pipelines and the heat exchanger, when the hot water is supplied from the power plant. Since the scale hinders smooth operation of the facilities, the countermeasure is necessary. There are excellent technologies in Japan and these technologies can be applied to prevent the scale trouble.
Present projects and possibility of the multipurpose utilization of geothermal energy in

7-42
Indonesia were introduced below on the basis of information provided from BPPT (Taufan Surana 2007) (Figs. 7.4.1-2 to 7.4.1-6).
7.4.2 General Information in the Whole Country
As a country with vast potential of high enthalpy geothermal resources, Indonesia has been focusing the development of geothermal energy for electricity generation. On the other hand, Indonesia is also blessed with a huge low-to-medium geothermal resources as well as hot springs, natural geothermal wells, etc., which can be applied for multi-purpose utilization or as so called direct use applications. Besides the above geothermal resources, direct use applications also utilize energy from un-exploited brine and small capacity production wells.
In general, the geothermal resources in Indonesia are located in mountainous areas with agricultural lands (including plantations), forestry, bathing and spa resorts, etc. which need heat for their processes or activities. This is a perfect situation for the geothermal energy direct use to be developed. However, unfortunately the multi-purpose utilization of geothermal energy in Indonesia is very low. Table 7.4.2-1 shows the summary of direct use data from individual countries (Taufan Surana 2007).
Many local governments have been starting the identification of the direct use potential in their administrative territories. For example, West Java, a province with the largest geothermal resources, completed the study and reported it on the development plan of direct use in the West Java Province in 2003, and started the implementation in 2006 by adopting the existing mushroom growing direct use for the community development program.
Indonesian government is interested in the expansion of the multipurpose utilization of geothermal energy and BPPT (Agency for the Assessment and Application of Technology) advances the investigation of the multipurpose utilization of geothermal energy in this country. Many of information on the multipurpose utilization of geothermal energy in this country were provided by BPPT (Taufan Surana 2007). The university in this country etc. shows interest in the multipurpose utilization of geothermal energy as study object. At present, BPPT is only research institute, which is studying about the multipurpose utilization of geothermal energy systematically in Indonesia. It is thought that BPPT plays an important role to the expansion of the multipurpose utilization of geothermal energy in Indonesia.
(1) Bathing and Swimming
The most common and traditional usage is for balneology, bathing and heated swimming pools. Some of them, for example in Cipanas and Ciater of West Java Province, are being commercially exploited as hot spring and spa resorts. At present, there are no accurate data

7-43
on the total countrywide utilization and capacity because they are very difficult to collect and quantify. According to the estimation by Lund and Freeston (2001), the use for bathing and swimming in Indonesia is 2.3MWt in capacity with an annual energy use of 42.6TJ/yr.
Since about 10 years ago, Pertamina has been utilizing the geothermal steam to heat up freshwater for the domestic and office use in Kamojang Geothermal Field, and there is no measurement for the capacity as well as the annual energy use.
When the multipurpose utilization of geothermal energy is proposed for the tourism industry and the medical use, it is necessary to investigate the condition and needs in the region where the geothermal power plants are constructed.
(2) Agriculture
The utilization of geothermal energy for agriculture in Indonesia was initiated by a geothermal research group of BPPT (Agency for the Assessment and Application of Technology) in 1999. BPPT, with the cooperation of Pertamina, implemented a pilot plant of the geothermal energy direct use for mushroom growing in Kamojang Geothermal Field (West Jawa). BPPT also implemented a pilot plant of the utilization of natural geothermal well for coconut meat drying (copra) in Way Ratai Geothermal Field (Lampung). Starting from last year, BPPT and Magma Nusantara Limited (MNL) are studying the utilization of geothermal energy for silk thread process and tea drying in Wayang Windu Geothermal Field (West Java).
In Lahendong Geothermal Field (North Sulawesi), a non-governmental organization built a full-scale facility for palm wine processing by utilizing geothermal steam. In the same field, Pertamina built a pilot plant for coconut meat drying (copra) by utilizing geothermal steam.
Any project of the multipurpose utilization of geothermal energy in Indonesia is an investigation or a pilot phase excluding the palm wine processing business in the Lahendong geothermal power plant. It is thought that there are a lot of regions where the multipurpose utilization of geothermal energy can be used for agriculture and forestry, because the geothermal fields are often located in the mountain range. If distribution structure and the market of the products are surveyed and the proper procedure of introduction of the multipurpose utilization of geothermal energy can be discussed, the useful business using geothermal energy for social development can be proposed.
(3) Aquaculture
At present, there is only one place identified as an aquacultural facility that utilizes geothermal fluid in Indonesia. It is a traditional freshwater fishery in Lampung, mixing natural geothermal hot water (outflow) with freshwater from a river to grow large catfishes.

7-44
The farmer reported that the fishes grow better in the geothermal fluid and freshwater mixture.
(4) Space Heating
As a tropical country, the need of space heating in Indonesia is extremely limited. A small space heating facility is applied in Patuha Geothermal Field, but the information about the exact size and capacity is unavailable. The humidity adjustment by air-conditioning using geothermal energy is effective for the cultivation of the high additional value floriculture (orchid, rose etc.), but this application has not been done in Indonesia.
7.4.3 Specific Projects
(1) Kamojang
BPPT (Agency for the Assessment and Application of Technology) with the cooperation of Pertamina started a research on the geothermal energy direct use for mushroom growing in Kamojang Geothermal Field in 1999. The facility consists of a steam generator heat exchanger, an autoclave, a freshwater tank, an inoculation room, incubation rooms and production rooms. The schematic diagram of the facility is as shown in Fig. 7.4.3-1 below. Steam from a small capacity well with the temperature of 110-120ºC is directed to a steam generator to heat up freshwater. The heated fresh-steam is used to sterilize the mushroom growing media, or as so called “baglogs”, and also for space heating to keep the incubation room warm. The geothermal steam is to substitute the use of fossil fuel (kerosene), which is getting very expensive year by year(Fig. 7.4.3-2).
Starting from 2006, the local government of the West Java Province has been adopting this facility as a model for an ‘income generating’ community development program, and expanding the capacity of the facility to 25,000 baglogs per month. The provincial government provides production houses for the local community, and they are involved in the production process. They can buy the sterilized baglogs at a lower price, and are allowed to deliver the mushroom directly to the market.
(2) Lahendong
Lahendong Geothermal Field is surrounded with a palm wine plantation, which is managed by 3,500 farmers. A non-governmental organization called Yayasan Masarang with the cooperation of Pertamina implemented a geothermal energy direct use facility for palm wine production with the capacity of 2 – 5 tons/day. At present, the facility is running with capacity 1 ton/day. The schematic diagram of the facility is as shown in Fig. 7.4.3-3 below. Steam in the 2-phase fluid from the wells is separated in a separator, and then directed to a condensing turbin to generate 20 MW electricity. The excess steam of 4 tons/hour is utilized

7-45
for the palm wine production. Some of the products are exported to the Netherland (Fig. 7.4.3-4).
(3) Way Ratai
Way Ratai is an undeveloped geothermal field in Lampung Province, located in a coconut plantation area. There are many natural shallow wells in it with temperature range between 80 – 98ºC. BPPT (Agency for the Assessment and Application of Technology) implemented a pilot plant of the utilization of natural geothermal well for coconut meat drying (copra) in this field in 2003 – 2004, with the capacity of 200 kg coconut meat per batch. The facility consists of a downhole heat exchanger, a drying room, a pump, and a freshwater tank. The schematic diagram of the facility is as shown in Fig. 7.4.3-5. The downhole heat exchanger is put in a natural geothermal well with the temperature of 92 - 98ºC, and the freshwater is flowed into it. The freshwater is heated up and directed to the drying room to dry up the coconut meat by natural drag conduction heat exchange. The quality of the copra produced in this facility is much better compared to the conventional one because there is no smoke contamination in it.
7.4.4 Future Possibility
The development of geothermal direct use in Indonesia is stipulated in the Geothermal Law (Law No. 27 / 2003). Consequently, the Government of Indonesia cq. the Department of Energy and Mineral Resources cq. the Directorate General of Mineral, Coal and Geothermal (DGMCG) has been starting the identification of the direct use potential in Indonesia to prepare its regulation. At present, the multipurpose utilization of geothermal for the application of community development programs in Indonesia is mostly in the research stage, but in the near future the commercial base direct use business is predicted to grow rapidly, provided that the regulations on it is settled and come into effect.
(1) Kamojang
Learning from the experience of the existing direct use application for mushroom growing in Kamojang, the calculation result by BPPT showed that a commercial base business is economically feasible for a certain large scale. A detailed study for the market demand analysis is necessary before the implementation.
(2) Lahendong
The North Sulawesi, where Lahendong Geothermal Field is located, is a province with a large potential of coconut plantation and corn farming. Pertamina has a plan to utilize the geothermal steam in Lahendong for coconut meat and corn drying business commercially. A pilot plant for coconut meat drying (copra) has been built by Pertamina, and its operational

7-46
experiment gave a good result. The commercial implementation is expected to be commenced in the near future (Fig. 7.4.4-1).
Besides the above products, the local municipal government of Tomohon City plans to adopt the Kamojang’s mushroom growing direct use in Lahendong Geothermal Field as a pilot plan for the community development program.
(3) Wayang Windu
Wayang Windu Geothermal Field, which is being developed by Magma Nusantara Limited (MNL), is located in a tea plantation area owned by the State Own Company called PTPN8, and surrounded by a national forest. The geothermal fluid produced in Wayang Windu is of two-phase, so that a separator is installed to separate the steam from the hot water. The steam is directed to a turbine to generate electricity with the capacity of 110 MWe, while the separated hot water (or so called brine) which still has a high energy content with the temperature of 175 – 180ºC, is reinjected into the earth through a brine pipeline and wells. This pipeline is about 4 kms long, laid down near the PTPN8’s tea drying plant. BPPT with the cooperation of MNL and PTPN8 is studying the feasibility of utilizing the brine for tea withering and drying processes in commercial base business, to substitute the use of the Industrial Diesel Oil (IDO). PTPN8 spends more than 1 million liters of IDO or equivalent to more than Rp. 4 billions yearly. The application of the geothermal direct use is expected to reduce not only a huge fuel cost, but also the CO2 gas emission of more than 3,000 tons per year. Before the implementation, it is very important to assess the possibility of silica scaling occurrence due to lowering the brine temperature (Fig. 7.4.4-2).
(4) Ulubelu
Ulubelu geothermal field is located in Lampung Province. At present, exploration well drilling activities by Pertamina is in progress to develop 220 MW power generation in total. Ulubelu geothermal field is surrounded by a coffee plantation. The direct utilization for coffee processing is a very prospective in this field. BPPT is planning to make a study on it in 2008.
(5) Sarulla
Sarulla Geothermal Field is located in the North Sumatra Province. This field is owned by PLN and being developed by the joint venture cooperation of Medco Energy, Itochu and ORMAT. There are many agricultural and plantation products such as coffee, etc. in this field that can be processed by utilizing geothermal fluids.

7-47
(6) Sibayak
Sibayak Geothermal Field is also located in the North Sumatra Province, and being developed by Pertamina for 2 MW monoblock power generation. This field is surrounded by a coffee plantation. At present, a 10MW power plant is being constructed, and since fluids in this field is a water-dominated fluid, there is a great possibility to utilize the brine for coffee processing.
(7) Ulumbu and Mataloko
Ulumbu and Mataloko Geothermal Fields are located in the East Nusa Tenggara (NTT) Province, being developed by PLN. There are many agricultural products yielded from these areas, for example, maize, cassava, onion, etc. These products need heat for their processing treatment, and geothermal fluids (steam or brine) can be utilized to do it.
7.4.5 Advisable Promotion Methods
As described previously, the multi-purpose geothermal utilization in Indonesia is decelerated. In order to accelerate its development, it necessary to implement actions such as the following:
Prepare and issue regulations on multi-purpose geothermal utilization or direct use, including the brine pricing policy.
Identify the direct use potential in Indonesia and prepare an action plan to develop it.
Study on defining and characterizing the direct use applications for geothermal energy, with emphasis on defining barriers to widespread application.
Study and research to remove barriers, to enhance technology and economics, and to test and standardize equipment.
Implement direct use facilities (pilot project or commercial project) in the most potential fields.
Develop engineering standard for the direct use application facility.
The geothermal power development must be promoted positively in the whole country in the future as shown in the master plan of this report. If the multi-purpose geothermal utilization in the objected field is promoted in accordance with the geothermal power development plan, even the local people can be received the favor of the geothermal development. It is possible that the local people positively accept the geothermal power development and plant

7-48
construction in their field. Considering shortage of technical capability and lack of funding for projects of the multi-purpose geothermal utilization, technical and financial supports for the projects by developed countries are necessary. Most of all multi-purpose geothermal utilization projects are believed to contribute to social development for local people. If the pilot project of the multipurpose geothermal utilization, in which the local people take part, is executed and the reasonable profitability of the project can be demonstrated, these probably have the large positive effect for the dissemination and the expansion of the multipurpose utilization.
7.4.6 Summary
Considerations affecting the introduction of a project for multi-purpose geothermal utilization in Indonesia are as follows.
Since multipurpose geothermal utilization contributes to a reduction in the consumption of fossil fuel and to global environmental protection, it is positively advanced in developed countries.
Industry driven by multipurpose geothermal utilization can be introduced for the development of rural areas in Indonesia.
It is suitable to plan for multipurpose geothermal utilization in combination with the geothermal power development, because geothermal energy securing accompanies the resource development risk.
Studies of multipurpose geothermal utilization have been carried out in Indonesia, and multipurpose geothermal utilization projects are functioning in Kamojang and Lahendong.
Legislation concerning geothermal applications and multipurpose geothermal utilization is insufficient at present. Legislation that better suits the current state of the country is necessary.
The study of multipurpose geothermal utilization is mainly advanced by BPPT. It is expected that BPPT will play the key role in the promotion of multipurpose geothermal utilization in the future.
It is necessary to solve technical problems and to study the economics of projects and distribution and markets to encourage the dissemination and expansion of multipurpose geothermal utilization, and to establish a business model.
It is advisable that technical assistance concerning multipurpose geothermal utilization be

7-49
obtained from developed countries that have the requisite experience and know-how in geothermal development. In addition, the business model should be established through a pilot project in cooperation with a developed country. Incorporating the project for multipurpose geothermal utilization into the geothermal power development plans would appear to be effective for promoting the expansion of multipurpose geothermal utilization.

0. Prioritization-1: Expansion and Existing Development Plan
1. Priorotization-2 and Capacity: Geothermal Resource
Possibility Prioritization based on possibility of existence of exploitable geothermal reservoir, which isevaluated from geoscientific data collected so far
PotentialMW Resource potential estimation by adopting stored heat method
2. Capasity Restriction-1: Environment
National Park Exploitable resource potential is restricted due to existence of the national park (Geothermaldevelopment in national park is prohibited by law).
3. Capacity Restriction-2: Demand
Base LoadMW
Developd power output capacity is restricted by the demand in the area where the prospect islocated.
4. Prioritization-3A: Economy of Power Development
FIRR%
Higher FIRR (Financial Internal Rate of Return) of the power project is high-priority. FIRRs arecalculated on the assumption that full resource potential of each field would be developed.
4'. Prioritization-3B: Transmission Line
T/L Lengthkm
Short distance of additional transmission line is high-priority. Transmission line development isresponsible to PLN not to power producer. But short additional transmission line iseconomically under the national point of view.
Expansion and Existing Development Plan (mainly by PERTAMINA) = First Priority
Fig. 7.1.1-1 Methodological Flow for Formation of Master Plan for Geothermal Development
Sorting out the priority
Sorting out the priority
Sorting out the priority
Restriction of development capacity
Development Priority of Prospects and Proposed Power Output Capacity
Development Plan for Each Prospects
Restriction of development capacity
Master Plan for Geothermal Development (Development Scenario)
- Reservoir Existing Possibility
- Necessary Transmission Line Length
- Internal Rate of Return (IRR) of the Power Project
- Maximum Geothermal Power Demand (in 2025)
- Restriction of Steamfield Development by Existence of National Park
- Power Plant Capacity/System- Development Schedule- Development Cost
Review and Recommendation
- Timing of development start- Timing of P/P commissioning
Exploitable Resource Capacity
priority
Road Map9,500 MW in 2025

Reserves Resources 2007 2008 2009 2010 2011 2012 2013 2014 2015 2016 Total
1 Sibayak-Sinabung 2 170 220 8 - - - - - - - - - 8 new 10MW unit, 2MW retirePT Priamanaya
2 Sibual-Buali (Sarula) - 880 250 - - - - - 300 - - - - 300 PLN-Medco,Ormat,Itochu
3 Sungai Penuh - 160 110 - - - * - - - 55 - - 55
4 Hululais-Tambang Sawah - 500 150 - - - * - - - 110 - - 110
5 Lumut Balai - 600 230 - - - ** 110 - - 110 - - 220
6 Waypanas (Ulubelu) - 400 160 - - - ** 110 - - 110 - - 220
7 Cibeureum-Parabakti (Salak) 380 590 - - - - - - - - - - - 0 Unocal
8 Pangalengan 800 140
G. Patuha - - - - - - - - 60 - - - 60 120 GeoDipa
Wayang Windu 110 - - - 110 - - - - - - - - 110 Magma Nusantara, Star Energy
9 Kmojang-Darajat 660 -
Kamojang 140 - - - 60 - - 60 - - - - - 120
Darajat 145 - - - 110 - - - - - - - - 110 Amoseas
10 Karaha, Cakrabuana - 400 120 - - - - - - - - - - 30 tentative plan
11 DTT. Dieng 60 580 200 - - - - - 60 - - - 60 120 GeoDipa
12 Iyang, Argopuro - - - - - - - - - - - - - 0
13 Tabanan (Bedugul) - 270 80 - - - - - - - - - - 175 Bali Energy
14 Lahendong (inc. Tompaso) 20 300 230 20 20 - 20 40 - - - - - 100
15 Kotamobagu - 180 100 - - - * - - - 40 - - 40
1 Ulumbu (Flores) - 200 - - - 6 - - - - - - - 6 near Ruteng
2 Mataloko (Flores) - 65 10 2.5 - - - - - - - - - 2.5 near Bajawa
857 6,755 2,000 31 300 6 20 320 420 0 425 0 120 1,847
* : modular plants tailored to available steam at the wellheads** : modular plants tailored, or one unit (55MW) will be proceeded earlier by PLN
InstalledCapacity
(MW)
EstimatedResource Potential
by PERTAMINA or MEMR(MW)
Total
Table 7.1.2-1 Existing Geothermal Development Plan in Indonesia (as of June 2007)
PERTAMINA's Working Area
Others
Development Plan (MW)NoteNo. Field (Working Area)

Spec. Hypo. Possible Probable Proven
SUMATRAJICA - - 10-20 - -
MEMR 25 73 50 - -Aceh 2 LHO PRIA LAOT S1 101 170-220 - MEMR 50 - - - - NE 0 0 - -
JICA - - 560-1,380 - -MEMR - - 282 - -
Aceh 4 G. GEUREUDONG RE 69 - - MEMR - 120 - - - NE 0 0 - -Aceh 5 G. KEMBAR S1 89 >190 - MEMR - 92 - - - NE 0 0 - -
N.Sumatra 6 G. SINABUNG RE 65 - - MEMR 225 - - - - NE 0 0 - -MEMR - 34 35 - 30
PERTAMINA - 220 130 - 40MEMR - 100 200 - 80
PERTAMINA - (250) (750) - (130)JICA - - - - 60-115
MEMR - - 556 - -PERTAMINA - (250) (750) - (130)
JICA - - 500-1,120 - -MEMR - - 420 - -
N.Sumatra 11 PUSUK BUKIT - DANAU TOBA S1 90 <290 - MEMR 225 - - - - NE 0 0 - -N.Sumatra 12 SIMBOLON - SAMOSIR S1 91 >170 - MEMR 225 - - - - NE 0 0 - -
JICA - - 55-135 - -MEMR 100 - 190 - -JICA - 160-400 160-420 - -
MEMR - - 194 - -JICA - - 15-40 - -
MEMR - - 94 - -JICA - - 15-30 - 10-25
MEMR - - 150 15 40Jambi 16 SUNGAI TENANG S1 96 - - MEMR 74 - - - NE 0 0 - -
JICA - - 420-900 - -MEMR - - 208 - -
PERTAMINA - 110 160 - -Jambi 18 SUNGAI BETUNG S1 30 - - MEMR 100 - - - - NE 0 0 - -Jambi 19 AIR DIKIT S1 98 - - MEMR 225 - - - - NE 0 0 - -Jambi 20 G. KACA S1 41 - - MEMR 25 - - - - NE 0 0 - -
JICA - - 640-1,580 - -MEMR - 150 500 - -
PERTAMINA - (150) (500) - -JICA - - 300-560 - -
MEMR - 73 100 - -PERTAMINA - (150) (500) - -
Bengkulu 23 BUKIT DAUN S1 95 - - MEMR 225 - - - - NE 0 0 - -JICA - - 80-200 - -
MEMR - 145 194 - -JICA - - 600-1,140 - -
MEMR - 235 600 - -PERTAMINA - 230 600 - -
S.Sumatra 26 RANTAU DADAP - SEGAMIT S1 96 - - MEMR 225 - - - - NE 0 0 - -JICA - - 380-860 - -
MEMR - 156 380 - 20PERTAMINA - 160 400 - -
JICA - - 680-1,280 - -MEMR - 163 300 - -JICA - - 280-540 - -
MEMR - 100 130 - -JICA - - 120-250 - -
MEMR - 40 40 - -JICA - - 135-260 - -
MEMR - 194 - - -
Subtotal 2 913 5,040 5,955
* Development Status: RE: Unexplored or regional reconnaissace only S1: Local surface exploration done S2: Detailed surface exploration doneF1: Pre-feasibility studies done F2: Feasibility studies done (complete) OP: Power plant in operation
** Reservoir Existing Possibility: 1 : Confirmed by well(s) 2 : Infered mainly by geothermometer 3 : Infered by some geoscientific data
Low : Low possibility or low temp. NE : Not enough data for evaluation
Note
within one Working Area
Table 7.1.3-1 Exploitable Resource Potential of Promising Fields (Sumatra)
120 120
300 300
620
0 120 120
220 220 440
0 600 600
220
0
0
2
99 230-300 -
99
65 >170
170
Low
180-290 - 2
3000
0
800 within one Working Area
G. SEKINCAU S2 260-300
RAJABASA S2
92 220-290Lampung 31 WAI RATAI S2
S.Sumatra 24 MARGA BAYUR S2 98 180-250 -
110>230 -
0
2
3 0
Bengkulu 22 TAMBANG SAWAH S2
21 B. GEDUNG HULU LAIS S2 95
Jambi 17 SUNGAI PENUH S2
S2
Jambi 15 LEMPUR / KERINCI F1
source
Estimated Resource Potential (MW)
Region No Field Name(underline: Existing W/A)
Develop.Status*
Unidentified Identified
Aceh 1 IBOIH - JABOI S2 100 - -
Temperature(oC)
SurfaceMax.
Geot./Reserv.
Measured@well
60
300 355
2
3
0
30
1
2 55
Aceh 3 SEULAWAH AGAM S2 180-300 -
60
106 180-270 -
98 <290 -
3
ReservoirExistencePossibility
**
N.Sumatra 7 LAU DEBUK-DEBUK / SIBAYAK OP 116 - 302 1
100 600
8 150 160
0 600
N.Sumatra 9 SIBUAL BUALI F1
50
240 240
660
500 500
360
50
LUMUT BALAI S2 98 -
0
0
0S2
S2
2119 <290 -
-
Bengkulu
N.Sumatra 10 S. MERAPI - SAMPURAGA
13W.Sumatra MUARALABUH
W.Sumatra 14 G. TALANG
N.Sumatra 71 SIPAHOLON-TARUTUNG S1
-
0
97 210-290 -
102 200-250 -
0
99
S.Sumatra 25
Lampung 27 - 210
Lampung 28 SUOH ANTATAI S2
ULUBELU F1
-
2
2
100 200-280 -
98Lampung 29
Lampung 30
- 3
910
170
4000
0
0
N.Sumatra 8 SARULA F2
30072 - 267 1
1
3
101 - 310
1
3
0
0
0
0
InstalledCapacity
(MW)
0
0
0
0
0
2
PossibleAdditional
/New Capa.(MW)
TotalPotential
(MW)
0 20 20
ExistingDevelop.
Plan(MW)

Spec. Hypo. Possible Probable Proven
JAVA-BALIW.Java 32 KAMOJANG OP 96 - 252 PERTAMINA - - - (70) (590) 1 140 120 60 320W.Java 33 G. SALAK OP - - 312 PERTAMINA - - 110 - 480 1 380 0 120 500W.Java 34 DARAJAT OP 103 235-240 247 PERTAMINA - - - (70) (590) 1 145 110 75 330
JICA - - 240-580 - -MEMR - 50+0 50+83 - -
W.Java 36 G. PATUHA F2 89 220 242 PERTAMINA - (140) (250) (130) (420) 1 0 120 380 500W.Java 37 G. WAYANG - WINDU OP 50 - 270 PERTAMINA - (140) (250) (130) (420) 1 110 110 180 400W.Java 38 G. KARAHA F2 95 203-300 350 PERTAMINA - (120) (190) (180) (30) 1W.Java 39 G. TELAGABODAS S2 92 217-258 350 PERTAMINA - (120) (190) (180) (30) 1
JICA - - 10-30 - -MEMR - 100 90 - -
Banten 41 BATUKUWUNG S2 52 - - MEMR - - 115 - - NE 0 0 - -JICA - - 15-35 - -
MEMR - - 170 - -Banten 43 G. ENDUT RE 84 - - MEMR 225 - - - - NE 0 0 - -C.Java 44 DIENG OP 94 - 330 PERTAMINA - 200 190 110 280 1 60 120 220 400C.Java 45 MANGUNAN S2 46 - - MEMR - - 92 - - NE 0 0 - -
JICA - - 60-125 - -MEMR - 92 - - -JICA - - 140-355 - -
MEMR - 50 52 - -C.Java 48 G. SLAMET S2 51 - - MEMR - - 185 - - NE 0 0 - -E.Java 49 G. ARJUNO - WELIRANG S1 70 - - MEMR - 38 92 - - NE 0 0 - -
JICA - - 120-280 - -MEMR - - 120 - -JICA - - 80-200 - -
MEMR - 92 185 - -MEMR - 110 185 - -
PERTAMINA - - - - -JICA - - 460-820 - -
MEMR - - 226 - -PERTAMINA - 80 240 - 30
Subtotal 835 785 2,250 3,870
* Development Status: RE: Unexplored or regional reconnaissace only S1: Local surface exploration done S2: Detailed surface exploration doneF1: Pre-feasibility studies done F2: Feasibility studies done (complete) OP: Power plant in operation
** Reservoir Existing Possibility: 1 : Confirmed by well(s) 2 : Infered mainly by geothermometer 3 : Infered by some geoscientific data
Low : Low possibility or low temp. NE : Not enough data for evaluation
0
0
0
0
0
0
0
0
Table 7.1.3-1 Exploitable Resource Potential of Promising Fields (Java-Bali)
30
0190-250 137 2
-
175
0
155 330
120 120
0
0
PossibleAdditional
/New Capa.(MW)
TotalPotential
(MW)
0
0
0
0
0
0
-
370
>180
50 50
20 20
S1 NE- -
50
E.Java 72 IYANG ARGOPURO
WILIS / NGEBEL
IJEN
- -
120 120
180 180
20 20
180 180
400
Estimated Resource Potential (MW) ReservoirExistencePossibility
**source
Unidentified Identified
ExistingDevelop.
Plan(MW)
Temperature(oC)
SurfaceMax.
Geot./Reserv.
Measured@well
Note
- 3
65
280-300
S2 57 -
W.Java 35 CISOLOK - CISUKARAME F1
Region No Field Name(underline: Existing W/A)
Develop.Status*
100
96 >170 -
2
3
94
132
W.Java 40 TANGKUBANPERAHU S2
C.Java 46 TELOMOYO S2
Banten 42 CITAMAN - G. KARANG F1
C.Java 47 UNGARAN S2
S2
Bali 52 BEDUGUL F2
E.Java 51
E.Java
310
93
-
86 180-320
37 >190
2
Low
Low
99 >250
InstalledCapacity
(MW)

Spec. Hypo. Possible Probable Proven
NUSA TENGGARAJICA - - 115-290 - -
MEMR - - 69 - -JICA - - 50-105 - -
MEMR - 90 33 - -JICA - - - - 125-250
MEMR - - 187.5 - 12.5JICA - - - - 15-35
MEMR - 10 63.5 - 1.5JICA - - 90-235 - -
MEMR - 145 25 - -JICA - - 90-230 - -
MEMR - - 40 - -E.Nusa Tenggara 59 ILI LABALEKEN RE MEMR - - 36 - - NE 0 0 - -
JICA - - 55-140 - -MEMR - - 40 - -
Subtotal 0 9 562 570SULAWESI
N.Sulawesi 61 LAHENDONG OP 99 - 356 PERTAMINA - (230) (130) (90) (80) 1 20 100 260 380 including Tompaso capasity
JICA - - 155-390 - -MEMR - - 185 - -
PERTAMINA - 100 180 - -JICA - - 260-600 - -
MEMR - - 130 - -JICA - - 130-325 - -
MEMR 50 - 110 - -C.Sulawesi 64 BORA RE 81 MEMR - - 8 - - NE 0 0 - -
JICA - - 240-600 - -MEMR - - 40 - -
S.Sulawes 66 BITUANG RE 98 MEMR - - 17 - - NE 0 0 - -SE.Sulawes 67 LAINEA RE 85 MEMR - - 36 - - NE 0 0 - -
Subtotal 20 140 770 930MALUKU
N.Maluku 68 TONGA WAYANA S1 60 MEMR - 110 - - - NE 0 0 - -JICA - - 15-40 - -
MEMR - - 100 - -JICA - 220-500 - - -
MEMR - - 42 - -
Subtotal 0 0 80 80
Total 857 1,847 8,702 11,405
* Development Status: RE: Unexplored or regional reconnaissace only S1: Local surface exploration done S2: Detailed surface exploration doneF1: Pre-feasibility studies done F2: Feasibility studies done (complete) OP: Power plant in operation
** Reservoir Existing Possibility: 1 : Confirmed by well(s) 2 : Infered mainly by geothermometer 3 : Infered by some geoscientific data
Low : Low possibility or low temp. NE : Not enough data for evaluation
Subtotals for each reservoir possibilities
1 857 1,422 2,782 5,060
2 0 425 3,890 4,315
3 0 0 1,910 1,910
Low 0 0 120 120
NE 0 0 ? ?
Total 857 1,847 8,702 11,405
aroundG. Ambang only
same Working Area with Lahendong
0 0
0 40
0 0
0 0
0 6
0 2.5
0 0
0 0
ExistingDevelop.
Plan(MW)
TotalPotential
(MW)sourceUnidentified Identified
Estimated Resource Potential (MW) PossibleAdditional
/New Capa.(MW)
InstalledCapacity
(MW)
included in Lahendong
180 220
40 40
40 400 0
0
50
90
90
30
150
50
110
90
90
50
110
50
144
27.5
Golontaro 73 SUWAWA-GORONTALO S2 94 >130 -
3 0 0
3
N.Maluku 70 JAILOLO S2 97 >130 -
92 >230 -Maluku 69 TULEHU S2
3 200 200
3 130 1300
0 090 >130 -C.Sulawesi 65 MERANA S1
Note
Table 7.1.3-1 Exploitable Resource Potential of Promising Fields (Nusa Tenggara, Sulawesi and Maluku)
1
E.Nusa Tenggara
63N.Sulawesi
2
TOMPASO S2 98 >250 - 2
98 <320 -N.Sulawesi 62 KOTAMOBAGU S2
3
E.Nusa Tenggara 60 ATADEI F1 97 - - 3
90 - -E.Nusa Tenggara 58 OKA - LARANTUKA S1
57 SOKORIA - MUTUBUSA S1 97 180-320 - 2
95 270-300 197E.Nusa Tenggara 56 BENA - MATALOKO F2
3
E.Nusa Tenggara 55 ULUMBU F2 96 260-300 240 1
92 >250 -E.Nusa Tenggara 54 WAI SANO S2
86 - - 3W.Nusa Tenggara 53 HU'U DAHA S2
ReservoirExistencePossibility
**
Temperature(oC)
Region No Field Name(underline: Existing W/A)
Develop.Status* Surface
Max.Geot./
Reserv.Measured
@well

IIbbooii--JJaabbooii 2200MMWW SSeeuullaawwaahh AAggaamm 660000MMWW
LLaauu DDeebbuukk--DDeebbuukk // SSiibbaayyaakk 116600MMWW
SSaarruullaa –– SSiibbuuaall BBuuaallii 666600MMWW
SS.. MMeerraappii –– SSaammppuurraaggaa 550000MMWW
SSiippaahhoolloonn –– TTaarruuttuunngg 5500MMWW
MMuuaarraallaabbuuhh 224400MMWW
GG.. TTaallaanngg 3300MMWW
SSuunnggaaii PPeennuuhh 335555MMWW LLeemmppuurr // KKeerriinnccii 6600MMWW
BB.. GGeedduunngg HHuulluu LLaaiiss // TTaammbbaanngg SSaawwaahh 991100MMWW
MMaarrggaa BBaayyuurr 117700MMWW
LLuummuutt BBaallaaii 662200MMWW
SSuuoohh AAnnttaattaaii –– GG.. SSeekkiinnccaauu 990000MMWW
RRaajjaabbaassaa 112200MMWW
WWaaii RRaattaaii 112200MMWW
UUlluubbeelluu 444400MMWW
KKaammoojjaanngg 332200MMWW
CCoossoollookk –– CCiissuukkaarraammee 118800MMWW
CCiittaammaann –– GG.. KKaarraanngg 2200MMWW
GG.. SSaallaakk 550000MMWW
DDaarraajjaatt 333300MMWW
GG.. WWaayyaanngg -- WWiinndduu 440000MMWW GG.. PPaattuuhhaa 550000MMWW
GG.. KKaarraahhaa –– GG.. TTeellaaggaabbooddaass 440000MMWW
TTaannggkkuubbaannppeerraahhuu 2200MMWW
DDiieenngg 440000MMWW TTeelloommooyyoo 5500MMWW
UUnnggaarraann 118800MMWW WWiilliiss // NNggeebbeell 112200MMWW
IIjjeenn 112200MMWW
BBeedduugguull 333300MMWW
HHuu’’uu DDaahhaa 111100MMWW
UUlluummbbuu 115500MMWW WWaaii SSaannoo 5500MMWW BBeennaa –– MMaattaallookkoo 3300MMWW
SSookkoorriiaa –– MMuuttuubbuussaa 9900MMWW
OOkkaa –– LLaarraannttuukkaa 9900MMWW AAttaaddeeii 5500MMWW
LLaahheennddoonngg -- TToommppaassoo 338800MMWW KKoottaammoobbaagguu 222200MMWW
SSuuwwaawwaa –– GGoorroonnttaalloo 113300MMWW
MMeerraannaa 220000MMWW
TTuulleehhuu 4400MMWW
JJaaiilloolloo 4400MMWW
Fig. 7.1.3-1 Map Showing the Resource Potential in Promising Geothermal Fields
: Presence of concrete plan for development or expansion : Possible additional or new power capacity for development
LLuummuutt BBaallaaii ((ggrreeeenn)) :: PPEERRTTAAMMIINNAA WWoorrkkiinngg AArreeaa MMuuaarraallaabbuuhh ((wwhhiittee)) :: OOppeenn FFiieelldd
SUMATRA 5,955 MW
JAVA-BALI 3,870 MW
NUSA TENGGARA 570 MW
SULAWESI 930 MW
MALUKU 80 MW
IINNDDOONNEESSIIAA 5500 FFiieellddss
1111,,440055 MMWW

Spec. Hypo. Possible Probable Proven
SUMATRA
Aceh 2 LHO PRIA LAOT 101 50 - - - - NE 5
Aceh 4 G. GEUREUDONG 69 - 120 - - - NE 24
Aceh 5 G. KEMBAR 89 - 92 - - - NE 18.4
N.Sumatra 6 G. SINABUNG 65 225 - - - - NE 22.5
N.Sumatra 11 PUSUK BUKIT - DANAU TOBA 90 225 - - - - NE 22.5
N.Sumatra 12 SIMBOLON - SAMOSIR 91 225 - - - - NE 22.5
Jambi 16 SUNGAI TENANG 96 74 - - - NE 14.8
Jambi 18 SUNGAI BETUNG 30 100 - - - - NE 10
Jambi 19 AIR DIKIT 98 225 - - - - NE 22.5
Jambi 20 G. KACA 41 25 - - - - NE 2.5
Bengkulu 23 BUKIT DAUN 95 225 - - - - NE 22.5
S.Sumatra 26 RANTAU DADAP - SEGAMIT 96 225 - - - - NE 22.5
Number of fields 12 Subtotal 210
JAVA-BALI
Banten 41 BATUKUWUNG 52 - - 115 - - NE 115
Banten 43 G. ENDUT 84 225 - - - - NE 22.5
C.Java 45 MANGUNAN 46 - - 92 - - NE 92
C.Java 48 G. SLAMET 51 - - 185 - - NE 185
E.Java 49 G. ARJUNO - WELIRANG 70 - 38 92 - - NE 99.6
E.Java 72 IYANG ARGOPURO 65 - 110 185 - - NE 207
Number of fields 6 Subtotal 721
NUSA TENGGARA
E.Nusa Tenggara 59 ILI LABALEKEN - - 36 - - NE 36
Number of fields 1 Subtotal 36
SULAWESI
C.Sulawesi 64 BORA 81 - - 8 - - NE 8
S.Sulawesi 66 BITUANG 98 - - 17 - - NE 17
SE.Sulawesi 67 LAINEA 85 - - 36 - - NE 36
Number of fields 3 Subtotal 61
MALUKU
N.Maluku 68 TONGA WAYANA 60 - 110 - - - NE 22
Number of fields 1 Subtotal 22
Total 23 Total 1,050
Note: Minimum Exploitable Resource Potential = 1 x ("Identified" Potential) + 0.2 x ("Hypothetical" Potential) + 0.1 x ("Speculative" Potential)
Table 7.1.3-2 Minimum Exploitable Resource Potential of Geothermal Fields where Geoscientific Data is not enough forEvaluation (within 73 fields)
MinimumExploitableResourcePotential
(MW)
Estimated Resource Potencial by MEMR (MW)ReservoirExistencePossibility
Region No Field Name(underline: Existing W/A)
Surface MaxTemperature
(oC)Unidentified Identified

Spec. Hypo. Possible Probable Proven
3,525 518 692 0 0 1053.5
1,980 524 752 0 0 1054.8
290 114 223 0 0 274.8
900 12 327 0 0 419.4
250 7 15 0 0 41.4
45 0 0 0 0 4.5
50 0 0 0 0 5.0
7,040 1,175 2,009 0 0 2,853
Note: Minimum Exploitable Resource Potential = 1 x ("Identified" Potential) + 0.2 x ("Hypothetical" Potential) + 0.1 x ("Speculative" Potential)
Estimated Resource Potential by MEMR (MW) MinimumExploitableResourcePotential
(MW)
(Unidentified)
8,215 2,00910,224
Table 7.1.3-3 Minimum Exploitable Resource Potential of Geothermal Fields where Geoscientific Datais not enough for Evaluation (whole Indonesia besides 73 fields)
Kalimantan
Papua
Total
48
51
(Identified)AreaNumber of
fieldswithin the area
Sumatra
Java-Bali
Nusa Tenggara
Sulawesi
Maluku
14
43
12
3
2
173

SUMATRA
Aceh 2 LHO PRIA LAOT NE 0 0 - - none 25% - -
Aceh 4 G. GEUREUDONG NE 0 0 - - - - - -Aceh 5 G. KEMBAR NE 0 0 - - - - - -
N.Sumatra 6 G. SINABUNG NE 0 0 - - - - - -
N.Sumatra 11 PUSUK BUKIT - DANAU TOBA NE 0 0 - - none 75% - -N.Sumatra 12 SIMBOLON - SAMOSIR NE 0 0 - - none 10% - -
Jambi 16 SUNGAI TENANG NE 0 0 - - - - - -
Jambi 18 SUNGAI BETUNG NE 0 0 - - - - - -Jambi 19 AIR DIKIT NE 0 0 - - - - - -Jambi 20 G. KACA NE 0 0 - - - - - -
Bengkulu 23 BUKIT DAUN NE 0 0 - - - - - -
S.Sumatra 26 RANTAU DADAP - SEGAMIT NE 0 0 - - - - - -
Subtotal 2 913 5,040 5,955 Subtotal 3,615 4,530
* Reservoir Existing Possibility: 1 : Confirmed by well(s) 2 : Infered mainly by geothermometer 3 : Infered by some geoscientific data
Low : Low possibility or low temp. NE : Not enough data for evaluation
** Percentage of National Park in possible reservoir area : >75% : 25 - 75% : 0 - 25%
InstalledCapacity
(MW)
0
0
2
0
0
0
N.Sumatra 8 SARULA
3001
Lampung 27 ULUBELU
S.Sumatra 25
Lampung 31 WAI RATAI
Lampung 29
Lampung 30
Lampung 28
RAJABASA 3
SUOH ANTATAI 2
2
ReservoirExistencePossibility
*
1
0
8
3
3
0
3
N.Sumatra 7 LAU DEBUK-DEBUK / SIBAYAK 1
2
3
2 0
110
220
0
3 SEULAWAH AGAM
G. SEKINCAU
LUMUT BALAI 2
1
N.Sumatra 10 S. MERAPI - SAMPURAGA
W.Sumatra 13 MUARALABUH 0
Region No Field Name(underline: Existing W/A)
N.Sumatra 9 SIBUAL BUALI
Aceh 1 IBOIH - JABOI
Aceh
W.Sumatra 14 G. TALANG
Jambi 17 SUNGAI PENUH
Jambi 15 LEMPUR / KERINCI
550
1 00
0
Bengkulu 22 TAMBANG SAWAH
0
0
Bengkulu
2
3MARGA BAYURS.Sumatra
0
0
0
60
0
0
620
440
330
none
220
50% northeastern part/TN. Bukit Barisan Selatan 15%
-
120
120
120
volcanic hazard
northern end/THR. Wan Abdul Rachman none
N.Sumatra 71 SIPAHOLON-TARUTUNG
2
21 B. GEDUNG HULU LAIS
15%
24
Low
2
00
0
220
0
0
00
60
none - 70% 120
90% TN. Bukit Barisan Selatan none
330
none - 50%
- 90%
170170
400
- 95%
35%south of
Hulu Lais<30%
northeastern partnear Tambang Sawah/
TN. Kerinci Seblat
-
800 910
none
none
355
100
630
100
50
240
--
20%
---
100% THR. Bukit Barisan
Table 7.1.4-1 Evaluation of Promising Fields (Restriction-1: National Park) (Sumatra)
-60% southern and eastern part/
THR. G. Seulawah 5%
ExistingDevelop.
Plan(MW)
0
Note
-
none - 55%
25% western and southern part/CA. Sibolga, CA. Sibual Bual, etc.
80% southwestern part/SM. Batang Gadis
3%
<25% southern end/TN. Kerinci Seblat
15%
TN. Kerinci Seblat none-
<10%
none
-
300western part/TN. Kerinci Seblat none
-
none 50
240
>80%
-
30 30
20 20
330
275 275
30 40
20
Limited by National Park (MW)PossibleAdd./NewCapacity
TotalPotential
2025%
Percentagein the Area**
none
National Park in Possible Reservoir Area
Note /Name of National Park
-
TotalPotential
(MW)
20
600
Percentage ofProtected Forest inPossible Reservoir
Area
300300
PossibleAdditional
/New Capa.(MW)
50
240
170
620
910
440
600
120
20
600
150 160
660
500
220
600
360
500
50
30
60
355
120
120
120
240
30
60
300
800
170
400

JAVA-BALIW.Java 32 KAMOJANG 1 140 120 60 320 75% none 60 320W.Java 33 G. SALAK 1 380 0 120 500 85% none 120 500W.Java 34 DARAJAT 1 145 110 75 330 50% none 75 330
W.Java 36 G. PATUHA 1 0 120 380 500 25% none 380 500W.Java 37 G. WAYANG - WINDU 1 110 110 180 400 2% 35% 180 400W.Java 38 G. KARAHA 1W.Java 39 G. TELAGABODAS 1
Banten 41 BATUKUWUNG NE 0 0 - - - - - -
Banten 43 G. ENDUT NE 0 0 - - - - - -
C.Java 44 DIENG 1 60 120 220 400 30% none 220 400
C.Java 45 MANGUNAN NE 0 0 - - - - - -
C.Java 48 G. SLAMET NE 0 0 - - - - - -E.Java 49 G. ARJUNO - WELIRANG NE 0 0 - - - - - -
Subtotal 835 785 2,250 3,870 Subtotal 2,015 3,635
* Reservoir Existing Possibility: 1 : Confirmed by well(s) 2 : Infered mainly by geothermometer 3 : Infered by some geoscientific data
Low : Low possibility or low temp. NE : Not enough data for evaluation
** Percentage of National Park in possible reservoir area : >75% : 25 - 75% : 0 - 25%
Low
2
W.Java
C.Java
Banten
C.Java
No
UNGARAN47
42
46
2
3
35
W.Java 40 TANGKUBANPERAHU
CISOLOK - CISUKARAME
BEDUGUL 1
CITAMAN - G. KARANG
TELOMOYO Low
Bali 52
180
50
20
20
400
180
4035%TB. Maelang
CA. Kawah Ijen Ungup-ungupCA. Gunung Raung
120none
20
20
50
0
175
<50%
none
65%
180
IYANG ARGOPURO
E.Java 50 WILIS / NGEBEL 2
E.Java 51 IJEN 3
0 >50% SM. Dataran Tinggi Iyang
80% CA. Batukahu155
CA. G. Picis(SM. G. Wilis)
Note
gold mining areanone
5%
0
0
0
<20%
volcanic hazard
local people movement againstgeothermal development
40
-
0
120
175
-
none
none
none
(CA. Ungaran) none
-
(CA. G. Karang)
-SM. Gunung Perahu
TW. Telogo Warno PangilonCA. Telogo Sumurup
-
-
5% CA. Sepakung
none-
none
Region
180
370
20% TN. Gunung HalimunTW. Cinapas Cisolok
NEE.Java 72
Field Name(underline: Existing W/A)
CA. Gunung Tilu etc.
ReservoirExistencePossibility
**
ExistingDevelop.
Plan(MW)
InstalledCapacity
(MW)
National Park in Possible Reservoir AreaPossibleAdd./NewCapacity
TotalPotential
CA. Kawah KamojangCA. Gunung Papandayan
Percentagein the Area**
Note /Name of National Park
CA. Kawah KamojangTN. GUnung Halimun
<5%
CA. Malabar
<5% southern part/CA. Sepakung
CA. Tangkuban Perahu
0
0
0
0
0
0
0
0
0
30
0
0
0
0
Table 7.1.4-1 Evaluation of Promising Fields (Restriction-1: National Park) (Java-Bali)Percentage of
Protected Forest inPossible Reservoir
Area
Limited by National Park (MW)
180
120
120
-
330
120
-
180
120
20
50
20
50
370
20
400
20
PossibleAdditional
/New Capa.(MW)
180
TotalPotential
(MW)
180

NUSA TENGGARA
E.Nusa Tenggara 59 ILI LABALEKEN NE 0 0 - - - - - -
Subtotal 0 9 562 570 Subtotal 512 520SULAWESI
N.Sulawesi 61 LAHENDONG 1 20 100 260 380 <5% none 260 380
C.Sulawesi 64 BORA NE 0 0 - - - - - -
S.Sulawes 66 BITUANG NE 0 0 - - - - - -SE.Sulawes 67 LAINEA NE 0 0 - - - - - -
Subtotal 20 140 770 930 Subtotal 710 870MALUKU
N.Maluku 68 TONGA WAYANA NE 0 0 - - - - - -
Subtotal 0 0 80 80 Subtotal 80 80
Total 857 1,847 8,702 11,405 Total 6,932 9,635
* Reservoir Existing Possibility: 1 : Confirmed by well(s) 2 : Infered mainly by geothermometer 3 : Infered by some geoscientific data
Low : Low possibility or low temp. NE : Not enough data for evaluation
** Percentage of National Park in possible reservoir area : >75% : 25 - 75% : 0 - 25%
Subtotals for each reservoir possibilities
1 857 1,422 2,782 5,060 1 2,437 4,715
2 0 425 3,890 4,315 2 2,870 3,295
3 0 0 1,910 1,910 3 1,505 1,505
Low 0 0 120 120 Low 120 120
NE 0 0 ? ? NE ? ?
Total 857 1,847 8,702 11,405 Total 6,932 9,635
included in Lahendong
- 35%
included in Lahendong
0 2.5
0 0
0
0 40
Region No Field Name(underline: Existing W/A)
InstalledCapacity
(MW)
3%
none 50 50
160
27.5
120
40
30
40
90 90
150
50
144
40
200
130
40
200
130
-
-
--
none
40%northeastern part/CA. Gn. Ambang
Perluasan CA. Gn. Ambang
sonthwestern part in Tompaso/CA. Gn. Soputan
none
none -
-
none
ReservoirExistencePossibility
**
55%
none -
-
Note /Name of National Park
nonenorthwestern part/TN. Danau Kelimutu
none
5% eastern part/TW. Ruteng none
30%E.Nusa Tenggara 54 WAI SANO
W.Nusa Tenggara
ExistingDevelop.
Plan(MW)
Percentage ofProtected Forest inPossible Reservoir
Area
none
none
3 southern part/TW. Danau Sanau
0
0 0 50
53 HU'U DAHA 25%3 0
2
61
E.Nusa Tenggara 56 BENA - MATALOKO
0E.Nusa Tenggara 55 ULUMBU
National Park in Possible Reservoir Area
Percentagein the Area**
TotalPotential
(MW)
N.Sulawesi 62 KOTAMOBAGU
E.Nusa Tenggara 60 ATADEI
E.Nusa Tenggara 58 3
2
2
90
50
180
50
3
110
Note
Limited by National Park (MW)PossibleAdd./NewCapacity
TotalPotential
110
C.Sulawesi 65 MERANA
-
0 0
63N.Sulawesi TOMPASO
130
3
3 none - 20%
50
N.Maluku 70 JAILOLO
none - 70%
40
Maluku
0 0 none - - 40
200
40
403
3
1
90
50
220
200
40
40
69 TULEHU
OKA - LARANTUKA
E.Nusa Tenggara 57 SOKORIA - MUTUBUSA
Golontaro 73 SUWAWA-GORONTALO 130
Table 7.1.4-1 Evaluation of Promising Fields (Restriction-1: National Park) (Nusa Tenggara, Sulawesi and Maluku)
0
0 0
27.5
90
30
90
PossibleAdditional
/New Capa.(MW)
110
0 0
0 0
150
110
144

SUMATRA
Aceh 2 LHO PRIA LAOT NE 0 0 - - Weh ~10 - -
Aceh 4 G. GEUREUDONG NE 0 0 - - Sumatra-Java ~27,000 - -Aceh 5 G. KEMBAR NE 0 0 - - Sumatra-Java ~27,000 - -
N.Sumatra 6 G. SINABUNG NE 0 0 - - Sumatra-Java ~27,000 - -
N.Sumatra 11 PUSUK BUKIT - DANAU TOBA NE 0 0 - - Sumatra-Java ~27,000 - -N.Sumatra 12 SIMBOLON - SAMOSIR NE 0 0 - - Sumatra-Java ~27,000 - -
Jambi 16 SUNGAI TENANG NE 0 0 - - Sumatra-Java ~27,000 - -
Jambi 18 SUNGAI BETUNG NE 0 0 - - Sumatra-Java ~27,000 - -Jambi 19 AIR DIKIT NE 0 0 - - Sumatra-Java ~27,000 - -Jambi 20 G. KACA NE 0 0 - - Sumatra-Java ~27,000 - -
Bengkulu 23 BUKIT DAUN NE 0 0 - - Sumatra-Java ~27,000 - -
S.Sumatra 26 RANTAU DADAP - SEGAMIT NE 0 0 - - Sumatra-Java ~27,000 - -
Subtotal 2 913 3,615 4,530 Subtotal 3,605 4,520
* Reservoir Existing Possibility: 1 : Confirmed by well(s) 2 : Infered mainly by geothermometer 3 : Infered by some geoscientific data
Low : Low possibility or low temp. NE : Not enough data for evaluation
Table 7.1.5-1 Evaluation of Promising Fields (Restriction-2: Power Demand) (Sumatra)
Remarks on T/L
Distribution Line
Distribution Line
ExistingDevelop.
Plan(MW)
0
0
0
300
0
220
0
0
0
355
0
0
0
~27,000
~27,000
Sumatra-Java
800910 Sumatra-Java
InstalledCapacity
(MW)
0
0
2
0
0
0
0
0
100
50
240
910
170
620
20
~27,000
10
275
4030~27,000
10~10
630planned S/S (Sarula)
30
planned S/S
N.Sumatra 8 SARULA
N.Sumatra 9 SIBUAL BUALI
N.Sumatra
2
0
2
0
220
Sumatra-Java
0
planned S/S
~27,000
110
240
30
20
300planned S/S
planned S/S
planned S/S
800
Lampung 3
RAJABASALampung 30
31 WAI RATAI
2G. SEKINCAU
Sumatra-Java
~27,000
~27,0003
0
120
170
400
220planned T/L
330
1
~27,000Sumatra-Java
Lampung 29
ULUBELU
2Lampung 28 SUOH ANTATAI
Lampung 27
~27,000
30
355
MUARALABUH
Sumatra-Java20 20
00
2
~27,000100 100
0
~27,000
~27,000
50
~27,000
LUMUT BALAI
0
W.Sumatra 2
3
S.Sumatra 25
0
13
50
10010 S. MERAPI - SAMPURAGA
1
1
2
1
0
8
275 275
30 40
ReservoirExistencePossibility
*
275
N.Sumatra 7 LAU DEBUK-DEBUK / SIBAYAK
Minimum Demandin 2025(MW)
Aceh 3 SEULAWAH AGAM
3 Weh
Sumatra-Java
Sumatra-Java
Sumatra-Java
Sumatra-Java
Sumatra-Java
Sumatra-Java
Sumatra-Java
3
Power Grid
Aceh 1 IBOIH - JABOI
Region No Field Name(underline: Existing W/A)
20 20
W.Sumatra 14 G. TALANG
Jambi 15 LEMPUR / KERINCI
Jambi 17 SUNGAI PENUH
21 B. GEDUNG HULU LAISBengkulu
Bengkulu 22 TAMBANG SAWAH 2
3S.Sumatra 24 MARGA BAYUR
Note
120
330
120
1 00
55
N.Sumatra 71 SIPAHOLON-TARUTUNG Low
Sumatra-Java
Sumatra-Java
Sumatra-Java
Sumatra-Java
120
170
400
~27,000
~27,000
~27,000
~27,000
330
6060
Limited by demand (MW)PossibleAdd./NewCapacity
TotalPotential
440
120
60 60
120
330
Limited by National Park (MW)PossibleAdd./NewCapacity
TotalPotential
630
50
240
620
440
330
240
220
330
170
30
300
120 120 planned T/L

JAVA-BALIW.Java 32 KAMOJANG 1 140 120 60 320 Java-Bali ~27,000 60 320W.Java 33 G. SALAK 1 380 0 120 500 Java-Bali ~27,000 120 500W.Java 34 DARAJAT 1 145 110 75 330 Java-Bali ~27,000 75 330
W.Java 36 G. PATUHA 1 0 120 380 500 Java-Bali ~27,000 380 500W.Java 37 G. WAYANG - WINDU 1 110 110 180 400 Java-Bali ~27,000 180 400W.Java 38 G. KARAHA 1W.Java 39 G. TELAGABODAS 1
Banten 41 BATUKUWUNG NE 0 0 - - Java-Bali ~27,000 - -
Banten 43 G. ENDUT NE 0 0 - - Java-Bali ~27,000 - -C.Java 44 DIENG 1 60 120 220 400 Java-Bali ~27,000 220 400C.Java 45 MANGUNAN NE 0 0 - - Java-Bali ~27,000 - -
C.Java 48 G. SLAMET NE 0 0 - - Java-Bali ~27,000 - -E.Java 49 G. ARJUNO - WELIRANG NE 0 0 - - Java-Bali ~27,000 - -
Subtotal 835 785 2,015 3,635 Subtotal 2,015 3,635
* Reservoir Existing Possibility: 1 : Confirmed by well(s) 2 : Infered mainly by geothermometer 3 : Infered by some geoscientific data
Low : Low possibility or low temp. NE : Not enough data for evaluation
Table 7.1.5-1 Evaluation of Promising Fields (Restriction-2: Power Demand) (Java-Bali)
planned T/LExisting P/S
175
40 40
--
120
20
50
180
~27,000
Java-Bali ~27,000
Java-Bali ~27,000
2
20
180
400
Limited by demand (MW)
180
370
C.Java 47 UNGARAN
IJEN
BEDUGULBali 52
Low
Power Grid
2
C.Java 46 TELOMOYO
planned T/L
Banten 42 CITAMAN - G. KARANG planned new 150kVR. BitungS/S
W.Java 40 Java-Bali ~27,000
Existing P/SExisting P/SExisting P/S
planned T/L
planned T/L2
Region
CISOLOK - CISUKARAME
Field Name(underline: Existing W/A)No
35
ReservoirExistencePossibility
*
W.Java
E.Java 51
TANGKUBANPERAHU
1
E.Java 50 WILIS / NGEBEL
E.Java 72 IYANG ARGOPURO
NoteTotalPotential
50
ExistingDevelop.
Plan(MW)
InstalledCapacity
(MW)
3
Low
400
20 20
20
180 180 Java-Bali
~27,000
0 175
-
3
NE
0
0
PossibleAdd./NewCapacity
120
Java-Bali ~27,000
20
20Java-Bali
~27,000
Java-Bali
20
0
50
180
0
0
0
0
0
0
30 370
0
0
MinimumDemandin 2025(MW)
0
0
0
0
0
0
0
180 180
120 120
-
40
0
175
50
Remarks on T/L
Limited by National Park (MW)PossibleAdd./NewCapacity
TotalPotential
~27,000
Java-Bali
Java-Bali40 ~27,000
Java-Bali ~27,000
NUSA TENGGARA
E.Nusa Tenggara 59 ILI LABALEKEN NE 0 0 - - Flores ~40 - -
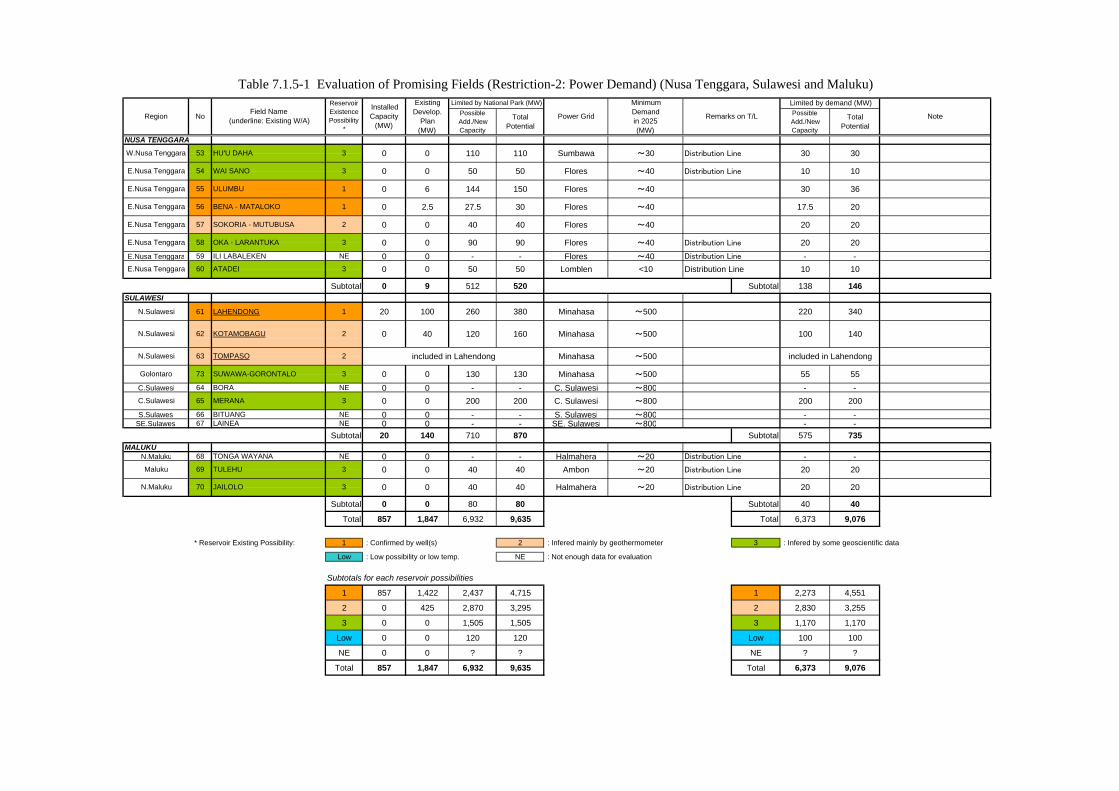
Subtotal 0 9 512 520 Subtotal 138 146SULAWESI
N.Sulawesi 61 LAHENDONG 1 20 100 260 380 Minahasa ~500 220 340
C.Sulawesi 64 BORA NE 0 0 - - C. Sulawesi ~800 - -
S.Sulawes 66 BITUANG NE 0 0 - - S. Sulawesi ~800 - -SE.Sulawes 67 LAINEA NE 0 0 - - SE. Sulawesi ~800 - -
Subtotal 20 140 710 870 Subtotal 575 735MALUKU
N.Maluku 68 TONGA WAYANA NE 0 0 - - Halmahera ~20 - -
Subtotal 0 0 80 80 Subtotal 40 40
Total 857 1,847 6,932 9,635 Total 6,373 9,076
* Reservoir Existing Possibility: 1 : Confirmed by well(s) 2 : Infered mainly by geothermometer 3 : Infered by some geoscientific data
Low : Low possibility or low temp. NE : Not enough data for evaluation
Subtotals for each reservoir possibilities
1 857 1,422 2,437 4,715 1 2,273 4,551
2 0 425 2,870 3,295 2 2,830 3,255
3 0 0 1,505 1,505 3 1,170 1,170
Low 0 0 120 120 Low 100 100
NE 0 0 ? ? NE ? ?
Total 857 1,847 6,932 9,635 Total 6,373 9,076
Distribution Line
Table 7.1.5-1 Evaluation of Promising Fields (Restriction-2: Power Demand) (Nusa Tenggara, Sulawesi and Maluku)
Distribution Line
Distribution Line
Distribution Line
Distribution Line
Distribution Line
20
20
10
20
55
included in Lahendong
10
100
10
140
20
36
30
Limited by demand (MW)PossibleAdd./NewCapacity
TotalPotential
ReservoirExistencePossibility
*
MinimumDemandin 2025(MW)
PossibleAdd./NewCapacity
TotalPotential
Region No Field Name(underline: Existing W/A)
W.Nusa Tenggara 53 HU'U DAHA 3
E.Nusa Tenggara 54 WAI SANO 3
E.Nusa Tenggara 55 ULUMBU 1
E.Nusa Tenggara 56 BENA - MATALOKO 1
E.Nusa Tenggara 57 SOKORIA - MUTUBUSA 2
E.Nusa Tenggara 58 OKA - LARANTUKA 3
E.Nusa Tenggara 60 ATADEI 3
N.Sulawesi 62 KOTAMOBAGU 2
TOMPASO 263N.Sulawesi
Note
C.Sulawesi 65 MERANA 3 200 200 C. Sulawesi ~800 200
130 1303
200
Maluku 69 TULEHU 3
Golontaro 73 SUWAWA-GORONTALO
40
N.Maluku 70 JAILOLO 3 200 0
~20
90
~30
50 Flores ~40
110 Sumbawa110
50
144 Flores
Flores40
Limited by National Park (MW)
27.5
Power Grid
40 Ambon
Minahasa ~500
Minahasaincluded in Lahendong
0 0
0
40 40 Halmahera ~20
0
InstalledCapacity
(MW)
Minahasa ~500
5050
90 Flores ~40
Lomblen
120 160
10
40
~40
30 Flores ~40
150
30
~500
<10
~40
Remarks on T/L
Distribution Line
Distribution Line
20
30
17.5
20
20
55
20
0 6
0 0
ExistingDevelop.
Plan(MW)
0
0 2.5
0 0
0 0
0 0
0 40
0
0 0

IIbbooii--JJaabbooii 1100MMWW SSeeuullaawwaahh AAggaamm 227755MMWW
LLaauu DDeebbuukk--DDeebbuukk // SSiibbaayyaakk 22MMWW,, 3388MMWW
SSaarruullaa –– SSiibbuuaall BBuuaallii 663300MMWW
SS.. MMeerraappii –– SSaammppuurraaggaa 110000MMWW
SSiippaahhoolloonn –– TTaarruuttuunngg 5500MMWW
MMuuaarraallaabbuuhh 224400MMWW
GG.. TTaallaanngg 3300MMWW
SSuunnggaaii PPeennuuhh 335555MMWW LLeemmppuurr // KKeerriinnccii 2200MMWW
BB.. GGeedduunngg HHuulluu LLaaiiss // TTaammbbaanngg SSaawwaahh 991100MMWW
MMaarrggaa BBaayyuurr 117700MMWW
LLuummuutt BBaallaaii 662200MMWW
SSuuoohh AAnnttaattaaii –– GG.. SSeekkiinnccaauu 339900MMWW
RRaajjaabbaassaa 112200MMWW
WWaaii RRaattaaii 112200MMWW
UUlluubbeelluu 444400MMWW
KKaammoojjaanngg 114400MMWW,, 118800MMWW
CCoossoollookk –– CCiissuukkaarraammee 118800MMWW
CCiittaammaann –– GG.. KKaarraanngg 2200MMWW
GG.. SSaallaakk 338800MMWW,, 112200MMWW
DDaarraajjaatt 114455MMWW,, 118855MMWW
GG.. WWaayyaanngg -- WWiinndduu 111100MMWW,, 229900MMWW GG.. PPaattuuhhaa 550000MMWW
GG.. KKaarraahhaa –– GG.. TTeellaaggaabbooddaass 440000MMWW
TTaannggkkuubbaannppeerraahhuu 2200MMWW
DDiieenngg 6600MMWW,, 334400MMWW TTeelloommooyyoo 5500MMWW
UUnnggaarraann 118800MMWW WWiilliiss // NNggeebbeell 112200MMWW
IIjjeenn 4400MMWW
BBeedduugguull 117755MMWW
HHuu’’uu DDaahhaa 3300MMWW
UUlluummbbuu 3366MMWW WWaaii SSaannoo 1100MMWW BBeennaa –– MMaattaallookkoo 2200MMWW
SSookkoorriiaa –– MMuuttuubbuussaa 2200MMWW
OOkkaa –– LLaarraannttuukkaa 2200MMWW AAttaaddeeii 1100MMWW
LLaahheennddoonngg -- TToommppaassoo 2200MMWW,, 332200MMWW KKoottaammoobbaagguu 114400MMWW
SSuuwwaawwaa –– GGoorroonnttaalloo 5555MMWW
MMeerraannaa 220000MMWW
TTuulleehhuu 2200MMWW
JJaaiilloolloo 2200MMWW
Fig. 7.1.5-1 Map Showing the Possible Development/Expansion Capacity in Promising Geothermal Fields
: Expansion field 114400MMWW (orange) = installed, 112200MMWW (White) = expansion : New development field 224400MMWW (yellow) = New development
LLuummuutt BBaallaaii ((ggrreeeenn)) :: PPEERRTTAAMMIINNAA WWoorrkkiinngg AArreeaa MMuuaarraallaabbuuhh ((wwhhiittee)) :: OOppeenn FFiieelldd
SUMATRA 4,520 MW
JAVA-BALI 3,635 MW
NUSA TENGGARA 146 MW
SULAWESI 735 MW
MALUKU 40 MW
IINNDDOONNEESSIIAA 5500 FFiieellddss 99,,007766 MMWW

N.Sumatra 89
SARULASIBUAL BUALI ○ 1 E1 21 660 630 630 0 300 330 A
Lampung 27 ULUBELU ○ 1 E1 19 440 440 440 0 220 220 AW.Java 32 KAMOJANG ○ 1 E1 10 320 320 320 140 120 60 AW.Java 33 G. SALAK ○ 1 E1 1 500 500 500 380 0 120 A
W.Java 34 DARAJAT ○ 1 E1 3 330 330 330 145 110 75 A
W.Java 36 G. PATUHA ○ 1 E1 19 500 500 500 0 120 380 AW.Java 37 G. WAYANG - WINDU ○ 1 E1 15 400 400 400 110 110 180 A
W.Java 3839
G. KARAHAG. TELAGABODAS ○ 1 E1 9 400 400 400 0 30 370 A
C.Java 44 DIENG ○ 1 E1 4 400 400 400 60 120 220 A
N.Sulawesi 6163
LAHENDONGTOMPASO** ○ 1 E1 11 380 380 340 20 100 220 A
Bali 52 BEDUGUL ○ 1 E2 6 330 175 175 0 175 0 A
N.Sumatra 7 LAU DEBUK-DEBUK / SIBAYAK ○ 1 E3 6 160 40 40 2 8 30 A
E.Nusa Tenggara 55 ULUMBU ○ 1 E3 14 150 150 36 0 6 30 A ○
E.Nusa Tenggara 56 BENA - MATALOKO ○ 1 E4 8 30 30 20 0 2.5 18 A ○
Jambi 17 SUNGAI PENUH ○ 2 E1 5 355 355 355 0 55 300 AS.Sumatra 25 LUMUT BALAI ○ 2 E1 50 620 620 620 0 220 400 A
Bengkulu 2122
B. GEDUNG HULU LAISTAMBANG SAWAH ○ 2 E2 44 910 910 910 0 110 800 A
N.Sulawesi 62 KOTAMOBAGU ○ 2 E2 2 220 160 140 0 40 100 AJambi 15 LEMPUR / KERINCI 1 E4 32 60 20 20 0 0 20 B
W.Sumatra 13 MUARALABUH 2 E1 7 240 240 240 0 0 240 BLampung 28 SUOH ANTATAI 2 E1 18 600 330 330 0 0 330 BW.Java 35 CISOLOK - CISUKARAME 2 E1 4 180 180 180 0 0 180 BC.Java 47 UNGARAN 2 E1 2 180 180 180 0 0 180 B
Lampung 29 G. SEKINCAU 2 E2 19 300 60 60 0 0 60 BE.Java 50 WILIS / NGEBEL 2 E2 5 120 120 120 0 0 120 B
N.Sumatra 10 S. MERAPI - SAMPURAGA 2 E3 23 500 100 100 0 0 100 BE.Nusa Tenggara 57 SOKORIA - MUTUBUSA 2 E4 20 90 40 20 0 0 20 B ○
Aceh 3 SEULAWAH AGAM 3 E1 4 600 275 275 0 0 275 CLampung 30 RAJABASA 3 E2 8 120 120 120 0 0 120 CLampung 31 WAI RATAI 3 E2 16 120 120 120 0 0 120 C
S.Sumatra 24 MARGA BAYUR 3 E2 29 170 170 170 0 0 170 CC.Sulawesi 65 MERANA 3 E2 40 200 200 200 0 0 200 CGolontaro 73 SUWAWA-GORONTALO 3 E3 24 130 130 55 0 0 55 C
Aceh 1 IBOIH - JABOI 3 E4 5 20 20 10 0 0 10 C ○
W.Sumatra 14 G. TALANG 3 E4 7 30 30 30 0 0 30 CW.Java 40 TANGKUBANPERAHU 3 E4 16 20 20 20 0 0 20 CE.Java 51 IJEN 3 E4 5 120 40 40 0 0 40 C
W.Nusa Tenggara 53 HU'U DAHA 3 E4 15 110 110 30 0 0 30 C ○
E.Nusa Tenggara 54 WAI SANO 3 E4 17 50 50 10 0 0 10 C ○
E.Nusa Tenggara 58 OKA - LARANTUKA 3 E4 10 90 90 20 0 0 20 C ○
E.Nusa Tenggara 60 ATADEI 3 E4 12 50 50 10 0 0 10 C ○
Maluku 69 TULEHU 3 E4 12 40 40 20 0 0 20 C ○
N.Maluku 70 JAILOLO 3 14 40 40 20 0 0 20 C ○
C.Java 46 TELOMOYO Low E4 19 50 50 50 0 0 50 LN.Sumatra 71 SIPAHOLON-TARUTUNG Low E4 19 50 50 50 0 0 50 L
Banten 42 CITAMAN - G. KARANG Low E4 8 20 20 20 0 0 20 LAceh 2 LHO PRIA LAOT NE 3 0 NAceh 4 G. GEUREUDONG NE 11 0 NAceh 5 G. KEMBAR NE 59 0 N
N.Sumatra 6 G. SINABUNG NE 38 0 NN.Sumatra 11 PUSUK BUKIT - DANAU TOBA NE 18 0 NN.Sumatra 12 SIMBOLON - SAMOSIR NE 3 0 N
Jambi 16 SUNGAI TENANG NE 83 0 NJambi 18 SUNGAI BETUNG NE 32 0 NJambi 19 AIR DIKIT NE 35 0 NJambi 20 G. KACA NE 29 0 N
Bengkulu 23 BUKIT DAUN NE 14 0 NS.Sumatra 26 RANTAU DADAP - SEGAMIT NE 25 0 N
Banten 41 BATUKUWUNG NE 6 0 NBanten 43 G. ENDUT NE 13 0 NC.Java 45 MANGUNAN NE 19 0 NC.Java 48 G. SLAMET NE 20 0 NE.Java 49 G. ARJUNO - WELIRANG NE 3 0 N
E.Nusa Tenggara 59 ILI LABALEKEN NE 15 0 NC.Sulawesi 64 BORA NE 16 0 NS.Sulawesi 66 BITUANG NE 4 0 N
SE.Sulawesi 67 LAINEA NE 53 0 NN.Maluku 68 TONGA WAYANA NE 37 0 NE.Java 72 IYANG ARGOPURO NE 26 0 N
TOTAL 11,405 9,635 9,076 857 1,847 6,373
* Reservoir Existing Possibility: 1 : Confirmed by well(s) 2 : Infered mainly by geothermometer
3 : Infered by some geoscientific data
Low : Low possibility or low temp. NE : Not enough data for evaluation
** No.63 TOMPASO: Reservoir possibility in TOMPASO is 2.
*** Economy: Classification of Project IRR E1 E2 E3 E4
****Development Priority A Existing Power Plant or Existing Expansion/Development Plan
B High Possibility of Existing Geothermal Reservoir
C Medium Possibility of Existing Geothermal Reservoir
L Low Possibility of Existing Geothermal Reservoir
N Not Enough Data for Evaluation
Table 7.1.6-1 Exploitable Resource Potential and Development Priority of the Promising Field
ResoucePotential
(MW)
Limited bydemand(MW)
T/L Lengthkm
ReservoirExistencePossibility
*
RegionInstalledCapacity
(MW)
Limited byNational Park
(MW)No
Expansionand ExistingDevelopme
nt Plan
Field Name(underline: Existing W/A)
Development
Priority****
Economy***
Expansionand ExistingDevelopmen
t Plan(MW)
PossibleAdd./NewCapacity
(MW)
Small ScaleDevelop.

Power Plant Capacity: 10MW (5MWx2unit)Plant System: Condencing or Back-PressureExplor.+Production Well: approx. 5 wellsReinjection Well: less than 3 wellsTransmission Line: 20kV, less than 5kmConnection: Distribution Line in Sabang Island
Proposed Geothermal Development Schedule
1 2 3 4 1 2 3 4 1 2 3 4 1 2 3 4 1 2 3 4 1 2 3 4 1 2 3 4 1 2 3 4 1 2 3 4 1 2 3 4 1 2 3 4 1 2 3 4 1 2 3 4 1 2 3 4 1 2 3 4 1 2 3 4 1 2 3 4 1 2 3 4 1 2 3 4 1 2 3 4
Preliminary Survey Stage
Request for WKP from Local Gov.
Preliminary Study (Surface Study by Gevernment)
Tendering
Exploration Stage
Exploratory Well Test Study
Field Development
Exploratory Well Drilling
Well Testing
Reservoir Simulation
Resoure Assessment
Exploitation Stage
Environmental Impact Asssessment
Steam Field Development
Survey, Design, Field Development
Drilling & Testing
Geothermal Fluid Transportation System
Fabrication & Delivery, Construction/Installation
Power Plant
Design, Manufacturing, Delivery, Construction/Installation
Commissioning 10MW
(Transmission Line and Switchyard)
Design, Manufacturing, Delivery, Construction/Installation
Commissioning
Operation Stage 10MW
Table 7.1.9-1 Development Plan Sheet for New Working Area (No.1 IBOIH-JABOI)
19 20
ACTIVITY
15 16 17 1811 12 13 147 8 9 103 4 5 6
10 MW20 MW Restrictedby National Park 10 MWPower Output Potential Resource Potential
C
1
Proposed Geothermal Development PlanOutline for Power DevelopmentThe possible development site in this field is located between G. Semeureuguhand G. Kenaldi. The demand of electricity in Sabang Island is small, so a smallscale with multi-unit power plant development is recommendable. If sufficientsteam is obtained by steamfield development, the power system available forvariable load is disireble for power supply not only for base load but also peak load.
Possibile or Recommended Multi-purpose Geothermal Heat Use Direct heat use for agricultural or marine product industry is recommendable.
2
Potential (Expected) Developer Private Company orCentral/Local Government
Province/Location Aceh, Southeast of Weh IslandNo.1 IBOIH-JABOI Region Sumatra
Field Evaluation
Rank of Development Priority
Scope for Power Development CO2 EmmissionReduction
('000 tone/year)
61
ResourceCharacteristics
The field is situated at SE of Pulau Weh (Sabang) island and iscomposed of Quaternary andesitic volcanics. The geothermalprospect is devided by NNW-SSE trending fault and NE-SW trendingfault. Possible reservoir area is defined based on low resistivity zone(Schlumberger <10 ohm-m (AB/2=500m)), geologic struture andanalysis data of hot spring. The detected possible area is locatedbetween G. Semeureuguh and G. Kenaldi.Reservoir fluid originates essencially in meteoric water but possiblycontains some seawater. Some of the fluid ascents vertically, yieldingfumaroles and thermal springs with mixing of shallow groundwater.Reservoir connection with that in Lho Pria Laot is not clear. Reservoirtemperature is estimated higher than 170oC at least, and possibly upto 290oC according to gas geothermometry.Resource potential estimated by stored heat method applying MonteCarlo analysis is 10-20 MW.
Natural/SocialEnvironmental
Condition
Possible geothermal reservoir area is not within any National Parks.But the area is surrounded by some Protected Forest existing at higherelevation (about 25% of the possible reservoir area).
Power SectorSituation
The whole system in the Sabang Island is D/L. At present,electrification ratio in this area reachs only 56.4%. The demand ofelectricity in Sabang Island with the peak load is about 20MW.
Restricted byPower Demand

Power Plant Capacity: 275MW (55MWx5unit)Plant System: CondencingExplor.+Production Well: approx. 65 wellsReinjection Well: less than 30 wellsTransmission Line: 150kV, approx. 4kmConnection: 2P connection between Sigli S/S and Banda Aceh S/S
Proposed Geothermal Development Schedule
1 2 3 4 1 2 3 4 1 2 3 4 1 2 3 4 1 2 3 4 1 2 3 4 1 2 3 4 1 2 3 4 1 2 3 4 1 2 3 4 1 2 3 4 1 2 3 4 1 2 3 4 1 2 3 4 1 2 3 4 1 2 3 4 1 2 3 4 1 2 3 4 1 2 3 4 1 2 3 4
Preliminary Survey Stage
Request for WKP from Local Gov.
Preliminary Survey (Surface Survey by Gevernment)
Tendering
Exploration Stage
Exploratory Well Test Study
Field Development
Exploratory Well Drilling
Well Testing
Reservoir Simulation
Resoure Assessment
Exploitation Stage
Environmental Impact Asssessment
Steam Field Development
Survey, Design, Field Development
Drilling & Testing
Geothermal Fluid Transportation System
Fabrication & Delivery, Construction/Installation
Power Plant
Design, Manufacturing, Delivery, Construction/Installation
Commissioning 55MW 55MW 55MW 110MW
(Transmission Line and Switchyard)
Design, Manufacturing, Delivery, Construction/Installation
Commissioning
Operation Stage 55MW 110MW 165MW 275MW
Table 7.1.9-1 Development Plan Sheet for New Working Area (No.3 SEULAWAH AGAM)
Restricted byPower Demand
Potential (Expected) Developer Private Company
Natural/SocialEnvironmental
Condition
Southern and eastern part of possible geothermal reservoir area iswithin THR. G. Seulawah National Park at around summit of G.Seulawah Agam (about 60% of the possible reservoir area).
Power SectorSituation
Estimated T/L length from the field to intersection T/L between SigliS/S and Banda Aceh S/S is about 4 km. 2P connection with 150kV isrecommendable.
Province/Location
Aceh,Northwestern side of G. Seulawah Agam
Direct heat use for agricultural or marine product industry is recommendable.
Scope for Power Development CO2 EmmissionReduction
('000 tone/year)
Proposed Geothermal Development PlanOutline for Power DevelopmentThe possible development site in this field is located near Ie Seu Uem on thenorthwestern flank of G. Seulawah Agam. The demand of electricity in northernpart of Sumatra including Aceh province is large, so a large scale power plantdevelopment as far as resource available is recommendable.
Possibile or Recommended Multi-purpose Geothermal Heat Use
1,677
ResourceCharacteristics
No.3 SEULAWAH AGAM Region Sumatra
Field Evaluation
Rank of Development Priority
Power Output Potential Resource Potential
C
275 MW600 MW Restrictedby National Park 275 MW
Major structural features are a large caldera (Lam Teuba) extendingfrom G. Seulawa Agam to the NW and a smaller collapse structurewithin its caldera. Possible reservoir area is defined at theNorthwestern flank of the G. Seulawah Agum based on low resistivityzone detected by the MT survery and on geologic strucutre.There are three areas where hydrothermal manifestations exist.Occurrence of numerous fumarolic activities in all the three areassuggest large extent of high temperature reservoir, but detailed fluidconnection between these areas is not clear. Reservoir temperature isestimated higher than 180oC at least; but considering strong activitiesof surface manifestation, a highest temperature of around 250-300oCwould be expected.Resource potential estimated by stored heat method applying MonteCarlo analysis is 560-1,380 MW.
1 2 3 4 5 6 7 8 9 10 11 12 13 18 19 2014 15 16 17
ACTIVITY

Power Plant Capacity: 100MW (55MW+45MW)Plant System: CondencingExplor.+Production Well: approx. 25 wellsReinjection Well: less than 12 wellsTransmission Line: 150kV, approx. 23kmConnection: 2P connection between Payakumbuh S/S and Padang Sidempuan S/S
Proposed Geothermal Development Schedule
1 2 3 4 1 2 3 4 1 2 3 4 1 2 3 4 1 2 3 4 1 2 3 4 1 2 3 4 1 2 3 4 1 2 3 4 1 2 3 4 1 2 3 4 1 2 3 4 1 2 3 4 1 2 3 4 1 2 3 4 1 2 3 4 1 2 3 4 1 2 3 4 1 2 3 4 1 2 3 4
Preliminary Survey Stage
Request for WKP from Local Gov.
Preliminary Study (Surface Study by Gevernment)
Tendering
Exploration Stage
Exploratory Well Test Study
Field Development
Exploratory Well Drilling
Well Testing
Reservoir Simulation
Resoure Assessment
Exploitation Stage
Environmental Impact Asssessment
Steam Field Development
Survey, Design, Field Development
Drilling & Testing
Geothermal Fluid Transportation System
Fabrication & Delivery, Construction/Installation
Power Plant
Design, Manufacturing, Delivery, Construction/Installation
Commissioning 55MW 45MW
(Transmission Line and Switchyard)
Design, Manufacturing, Delivery, Construction/Installation
Commissioning
Operation Stage 55MW 100MW
Table 7.1.9-1 Development Plan Sheet for New Working Area (No.10 S. MERAPI - SAMPURAGA)
ACTIVITY
17 18 19 2013 14 15 169 10 11 125 6 7 81 2 3 4
Field Evaluation
Rank of Development Priority
Power Output Potential Resource Potential
B
100 MW500 MW Restrictedby National Park 100 MW
The prospect of Sorik Merapi is around 60 km east of the coastal townof Natal. Extensive areas of thermal manifestations are present on theeastern and northern flanks of Sorik Merapi. Possible reservoir area isdefined at the northeastern flank of the S. Merapi, based on lowresistibity zone (schlumberger <5 ohm-m (T=0.3)), the surfacemanifestation, geologic struture, and shallow well data (SMR-1,2,3).The detected area is limited by the NW-SE trending faults.Reservoir fluid originates essencially in meteoric water but somevolcanic fluid may contibute into shallow acid aquifer near the volcaniccenter. Main flow patern of reservoir fluid is from Sorik Merapi to NNWdirection. The highest reservoir temperature is estimated around290oC from gas geothermometry mentioned in a literature.Resource potential estimated by stored heat method applying MonteCarlo analysis is 500-1,120 MW.
Province/Location
North Sumatra,Eeastern and northern side of Sorik MerapiNo.10 S. MERAPI - SAMPURAGA Region Sumatra
Direct heat use for agricultural industry is recommendable.
Scope for Power Development CO2 EmmissionReduction
('000 tone/year)
Proposed Geothermal Development PlanOutline for Power DevelopmentThe possible development site in this field is located in northeastern flank of SorikMerapi. The demand of electricity in northern part of Sumatra is large, so a largescale power plant development as far as resource available is recommendable.For development in this field, the area of National Park should be taken intoconsideration.
Possibile or Recommended Multi-purpose Geothermal Heat Use
610
ResourceCharacteristics
Restricted byPower Demand
Potential (Expected) Developer Private Company
Natural/SocialEnvironmental
Condition
Southwestern part of possible geothermal reservoir area is within SM.Batang Gadis National Park (about 80% of the possible reservoirarea). No Protected Forest exist in the field.
Power SectorSituation
Estimated T/L length from the field to intersection T/L betweenPayakumbuh S/S and Padang Sidempuan S/S is about 23 km. 2Pconnection with 150kV is recommendable. Electrification ratio in this areareachs only 67.5%.

Power Plant Capacity: 50MW (20MW+30MW)Plant System: Condencing or BinaryExplor.+Production Well: approx. 20 wellsReinjection Well: less than 7 wellsTransmission Line: 275kV, approx. 19kmConnection: Direct connection to planned Sarulla S/S
Proposed Geothermal Development Schedule
1 2 3 4 1 2 3 4 1 2 3 4 1 2 3 4 1 2 3 4 1 2 3 4 1 2 3 4 1 2 3 4 1 2 3 4 1 2 3 4 1 2 3 4 1 2 3 4 1 2 3 4 1 2 3 4 1 2 3 4 1 2 3 4 1 2 3 4 1 2 3 4 1 2 3 4 1 2 3 4
Preliminary Survey Stage
Request for WKP from Local Gov.
Preliminary Study (Surface Study by Gevernment)
Tendering
Explolartion Stage
Exploratory Well Test Study
Field Development
Exploratory Well Drilling
Well Testing
Reservoir Simulation
Resoure Assessment
Exploitation Stage
Environmental Impact Asssessment
Steam Field Development
Survey, Design, Field Development
Drilling & Testing
Geothermal Fluid Transportation System
Fabrication & Delivery, Construction/Installation
Power Plant
Design, Manufacturing, Delivery, Construction/Installation
Commissioning 20MW 30MW
(Transmission Line and Switchyard)
Design, Manufacturing, Delivery, Construction/Installation
Commissioning
Operation Stage 20MW 50MW
Table 7.1.9-1 Development Plan Sheet for New Working Area (No.71 SIPAHOLON-TARUTUNG)
Restricted byPower Demand
Potential (Expected) Developer Private Company
Natural/SocialEnvironmental
Condition
Possible geothermal reservoir area is not within any National Parks.
Power SectorSituation
Estimated T/L length from the field to planned Sarulla S/S is about19km. Direct connection with 275kV to the planned Sarulla S/S isrecommendable. Electrification ratio in this area reachs only 67.5%.
Province/Location
North Sumatra,Around Hutabarat Pantai village of Tarutung district
Direct heat use for agricultural industry is recommendable.
Scope for Power Development CO2 EmmissionReduction
('000 tone/year)
Proposed Geothermal Development PlanOutline for Power DevelopmentThe possible development site in this field is located near Sipaholon hot springarea. The reservoir fluid is likely to have only low enthalpy, so that there ispossibility that only binary plant system can be applied for power development andthat the development priority is relatively low. The demand of electricity in northernpart of Sumatra is large, so a large scale power plant development as far asresource available is recommendable.
Possibile or Recommended Multi-purpose Geothermal Heat Use
305
ResourceCharacteristics
No.71 SIPAHOLON-TARUTUNG Region Sumatra
Field Evaluation
Rank of Development Priority
Power Output Potential Resource Potential
L
50 MW50 MW Restrictedby National Park 50 MW
This geothermal field is strongly controlled by faulting, especially alongthe Sumatra Fault System. NW-SE trending faults are dominant inparallel to the regional fault zone. Travertine occurs in the vicinity ofhot springs in and around the Tarutung graven. The source of calcite isprobably Alas Formation limestones beneath the Toba tuff. Possiblereservoir area is defined in the Sipaholon-Tarutung graben based onthe low resistivity zone (Schlumberger <30 ohm-m), surfacemanifestation and geologic struture.All the hot and warm springs are significantly diluted. Detailed fluid flowpattern is not clear. Reservoir temperature is estimated 170oC at least.Resource potential estimated by stored heat method applying MonteCarlo analysis is 55-135 MW.
1 2 3 4 5 6 7 8 9 10 11 12 13 18 19 2014 15 16 17
ACTIVITY

Power Plant Capacity: 240MW (55MWx3unit+75MW)Plant System: CondencingExplor.+Production Well: approx. 55 wellsReinjection Well: less than 25 wellsTransmission Line: 150kV, approx. 7kmConnection: Direct connection to Simangkok S/S
Proposed Geothermal Development Schedule
1 2 3 4 1 2 3 4 1 2 3 4 1 2 3 4 1 2 3 4 1 2 3 4 1 2 3 4 1 2 3 4 1 2 3 4 1 2 3 4 1 2 3 4 1 2 3 4 1 2 3 4 1 2 3 4 1 2 3 4 1 2 3 4 1 2 3 4 1 2 3 4 1 2 3 4 1 2 3 4
Preliminary Survey Stage
Request for WKP from Local Gov.
Preliminary Study (Surface Study by Gevernment)
Tendering
Exploration Stage
Exploratory Well Test Study
Field Development
Exploratory Well Drilling
Well Testing
Reservoir Simulation
Resoure Assessment
Exploitation Stage
Environmental Impact Asssessment
Steam Field Development
Survey, Design, Field Development
Drilling & Testing
Geothermal Fluid Transportation System
Fabrication & Delivery, Construction/Installation
Power Plant
Design, Manufacturing, Delivery, Construction/Installation
Commissioning 55MW 55MW 55MW 75MW
(Transmission Line and Switchyard)
Design, Manufacturing, Delivery, Construction/Installation
Commissioning
Operation Stage 55MW 110MW 165MW 240MW
Table 7.1.9-1 Development Plan Sheet for New Working Area (No.13 MUARALABUH)
ACTIVITY
17 18 19 2013 14 15 169 10 11 125 6 7 81 2 3 4
Field Evaluation
Rank of Development Priority
Power Output Potential Resource Potential
B
240 MW240 MW Restrictedby National Park 240 MW
The Muaralabuh thermal features are situated along the Great SumatranFault Zone, which extends northwestwards down the prominent valleycontaining the Batang Sikin. There are four main clusters (Balun, Ambayan,Pekonina and Belirang Mati, toward the SE) of thermal features spaced atotal of 10 km apart. The most possible reservoir area is estimated basedon the surface manifestation, geologic struture (NNW-SSE trending faultssuch as Sesar Dung Mancung, Sesar Patah Sembilan) and low resistivityzone (<10 ohm-m) detected by the MT survery.Occurrece of typical deep reservoir fluid (neutral chloride type)is highlypromising. Main flow patern of reservoir fluid is from SE to NW, butpossibility of existence of another system (or up-flow) at NW end of thisfield is still remained. Reservoir temperature is estimated higher than 180oCat least, and possibly up to 270oC.Resource potential estimated by stored heat method applying Monte Carloanalysis is 160-420 MW.
Province/Location West Sumatra, Around Muaralabuh TownNo.13 MUARALABUH Region Sumatra
Direct heat use for agricultural industry is recommendable.
Scope for Power Development CO2 EmmissionReduction
('000 tone/year)
Proposed Geothermal Development PlanOutline for Power DevelopmentThe most possible development site in this field is located near Sapan Sentral, butthe southeastern and northwestern parts are also promising. So, setting of WorkingAreas more than two would be possible. The demand of electricity in mid-westernpart of Sumatra including West Sumatra province is large, so a large scale powerplant development as far as resource available is recommendable.
Possibile or Recommended Multi-purpose Geothermal Heat Use
1,464
ResourceCharacteristics
Restricted byPower Demand
Potential (Expected) Developer Private Company
Natural/SocialEnvironmental
Condition
Southern end of possible geothermal reservoir area is within TN.Kerinci Seblat National Park (less than 25% of the possible reservoirarea). Some Protected Forest exists at the northeast (less than 10% ofthe possible reservoir area).
Power SectorSituation
Estimated T/L length from the field to Simangkok S/S is about 7 km.Direct connection with 150kV is recommendable. Electrification ratio inthis area reachs only 61.1%.

Power Plant Capacity: 30MWx1unitPlant System: CondencingExplor.+Production Well: approx. 10 wellsReinjection Well: less than 5 wellsTransmission Line: 150kV, approx. 7kmConnection: Direct connection to Indarung S/S
Proposed Geothermal Development Schedule
1 2 3 4 1 2 3 4 1 2 3 4 1 2 3 4 1 2 3 4 1 2 3 4 1 2 3 4 1 2 3 4 1 2 3 4 1 2 3 4 1 2 3 4 1 2 3 4 1 2 3 4 1 2 3 4 1 2 3 4 1 2 3 4 1 2 3 4 1 2 3 4 1 2 3 4 1 2 3 4
Preliminary Survey Stage
Request for WKP from Local Gov.
Preliminary Study (Surface Study by Gevernment)
Tendering
Exploration Stage
Exploratory Well Test Study
Field Development
Exploratory Well Drilling
Well Testing
Reservoir Simulation
Resoure Assessment
Exploitation Stage
Environmental Impact Asssessment
Steam Field Development
Survey, Design, Field Development
Drilling & Testing
Geothermal Fluid Transportation System
Fabrication & Delivery, Construction/Installation
Power Plant
Design, Manufacturing, Delivery, Construction/Installation
Commissioning 30MW
(Transmission Line and Switchyard)
Design, Manufacturing, Delivery, Construction/Installation
Commissioning
Operation Stage 30MW
Table 7.1.9-1 Development Plan Sheet for New Working Area (No.14 G. TALANG)
20
ACTIVITY
16 17 18 1912 13 14 158 9 10 11
Restricted byPower Demand
Potential (Expected) Developer Private Company
1 2 3 4 5 6 7
Natural/SocialEnvironmental
Condition
Possible geothermal reservoir area is not within any National Parks.But Protected Forest exists at the western part (about 55% of thepossible reservoir area).
Power SectorSituation
Estimated T/L length from the field to Indarung S/S is about 7 km.Direct connection with 150kV is recommendable. Electrification ratio inthis area reachs only 61.1%.
Direct heat use for agricultural industry is recommendable.
Scope for Power Development CO2 EmmissionReduction
('000 tone/year)
Proposed Geothermal Development PlanOutline for Power DevelopmentThe most possible development site in this field is located in northeastern flank ofG. Talang. The demand of electricity in mid-western part of Sumatra includingWest Sumatra province is large, so a large scale power plant development as faras resource available is recommendable.For development in this field, volcanic hazard should be taken into consideration.
Possibile or Recommended Multi-purpose Geothermal Heat Use
183
ResourceCharacteristics
Province/Location
West Sumatra,Northeastern flank of G. TalangNo.14 G. TALANG Region Sumatra
Field Evaluation
Rank of Development Priority
Power Output Potential Resource Potential
C
30 MW30 MW Restrictedby National Park 30 MW
G.Talang lies approximately 20 km SE of Solok. There is a very activefault stretching NW from Danau Dibaru near the summit of G.Talang toDanau Singkarak 40 km distant. Most of the active features areassociated with this fault. Possible area is defined at Batu Berjanjanglocated in the northeastern flank of the G. Talang, based on the lowresistivity zone (schlumberger <50 ohm-m), surface manifestation andgeologic struture. The major geologic strucutre in this field is NNW-SSE trending faults.Manifestations near summit of G. Talang is likely to be belong to avolcanic system. A shallow outflow to NNW yield diluted neutralbicarbonate waters. The highest reservoir temperature is estimated upto around 290oC.Resource potential estimated by stored heat method applying MonteCarlo analysis is 15-40 MW.

Power Plant Capacity: 20MWx1unitPlant System: CondencingExplor.+Production Well: approx. 8 wellsReinjection Well: less than 4 wellsTransmission Line: 150kV, approx. 32kmConnection: Direct connection to Sungai Penuh S/S
Proposed Geothermal Development Schedule
1 2 3 4 1 2 3 4 1 2 3 4 1 2 3 4 1 2 3 4 1 2 3 4 1 2 3 4 1 2 3 4 1 2 3 4 1 2 3 4 1 2 3 4 1 2 3 4 1 2 3 4 1 2 3 4 1 2 3 4 1 2 3 4 1 2 3 4 1 2 3 4 1 2 3 4 1 2 3 4
Preliminary Survey Stage
Request for WKP from Local Gov.
Preliminary Study (Surface Study by Gevernment)
Tendering
Exploration Stage
Exploratory Well Test Study
Field Development
Exploratory Well Drilling
Well Testing
Reservoir Simulation
Resoure Assessment
Exploitation Stage
Environmental Impact Asssessment
Steam Field Development
Survey, Design, Field Development
Drilling & Testing
Geothermal Fluid Transportation System
Fabrication & Delivery, Construction/Installation
Power Plant
Design, Manufacturing, Delivery, Construction/Installation
Commissioning 20MW
(Transmission Line and Switchyard)
Design, Manufacturing, Delivery, Construction/Installation
Commissioning
Operation Stage 20MW
Table 7.1.9-1 Development Plan Sheet for New Working Area (No.15 LEMPUR / KERINCI)
Field Evaluation
Rank of Development Priority
Power Output Potential Resource Potential
B
20 MW60 MW Restrictedby National Park 20 MW
G. Kunyit, which is composed of andesitic volcanics and poured largevolumes of lava into the depression caused by down-faulting along theGreat Sumatra Fault zone. Most of the thermal features (fumarolesand steaming ground) are clustered along or around the DuabelasFault. This fault trends NNE-SSW and is parelleled by the Sikai Fault.Proven reservoir area is identified by two deep exploratory wells (LP-1and LP-2) by JICA study (1989).Reservoir fluid originates essencially in meteoric water. Neutral-pHchloride water does not occur at the surface but is confirmed by welldrillings and flow tests. Reservoir temperature is estimated around210-250oC from silica geothermometry of well discharge water, whilethe highest temperature at deeper level is expected to be around290oC from gas geothermometries.Resource potential estimated by stored heat method applying MonteCarlo analysis is 25-55 MW.
Province/Location
Jambi,Northeastern flank of G. KunyitNo.15 LEMPUR / KERINCI Region Sumatra
Direct heat use for agricultural industry is recommendable.
Scope for Power Development CO2 EmmissionReduction
('000 tone/year)
Proposed Geothermal Development PlanOutline for Power DevelopmentThe most possible development site in this field is located in northeastern flank of G.Kunyit, where two deep well have been already drilled. For development in this field, thePreliminary Survey and Exploration stages could be skipped because of existence ofsufficient surveys and drillings by the JICA's project in 1980's. The demand of electricityin middle part of Sumatra including Jambi province is large, so a large scale power plantdevelopment as far as resource available is recommendable.For development in this field, the area of National Park should be taken intoconsideration.
Possibile or Recommended Multi-purpose Geothermal Heat Use
122
ResourceCharacteristics
Restricted byPower Demand
Potential (Expected) Developer Private Company
Natural/SocialEnvironmental
Condition
Southern and western part of the possible geothermal reservoir area iswithin TN. Kerinci Seblat National Park (more than 80% of the possiblereservoir area).
Power SectorSituation
Estimated T/L length from the field to Sungai Penuh S/S is about 32km. Direct connection with 150kV is recommendable. Electrificationratio in this area reachs only 39.8%.
1 2 3 4 5 6 7 8 9 10 11 12 13 14 15 16 17 18 19 20
ACTIVITY

Power Plant Capacity: 170MW (55MWx2unit+60MW)Plant System: CondencingExplor.+Production Well: approx. 60 wellsReinjection Well: less than 20 wellsTransmission Line: 150kV, approx. 29kmConnection: Direct connection to planned Rantau dadap-Segamit S/S
Proposed Geothermal Development Schedule
1 2 3 4 1 2 3 4 1 2 3 4 1 2 3 4 1 2 3 4 1 2 3 4 1 2 3 4 1 2 3 4 1 2 3 4 1 2 3 4 1 2 3 4 1 2 3 4 1 2 3 4 1 2 3 4 1 2 3 4 1 2 3 4 1 2 3 4 1 2 3 4 1 2 3 4 1 2 3 4
Preliminary Survey Stage
Request for WKP from Local Gov.
Preliminary Survey (Surface Survey by Gevernment)
Tendering
Exploration Stage
Exploratory Well Test Study
Field Development
Exploratory Well Drilling
Well Testing
Reservoir Simulation
Resoure Assessment
Exploitation Stage
Environmental Impact Asssessment
Steam Field Development
Survey, Design, Field Development
Drilling & Testing
Geothermal Fluid Transportation System
Fabrication & Delivery, Construction/Installation
Power Plant
Design, Manufacturing, Delivery, Construction/Installation
Commissioning 55MW 55MW 60MW
(Transmission Line and Switchyard)
Design, Manufacturing, Delivery, Construction/Installation
Commissioning
Operation Stage 55MW 110MW 170MW
Table 7.1.9-1 Development Plan Sheet for New Working Area (No.24 MARGA BAYUR)
Field Evaluation
Rank of Development Priority
Power Output Potential Resource Potential
C
170 MW170 MW Restrictedby National Park 170 MW
Gunung Besar is an 1899m-high volcano with a minor sulfur deposit inits crater. A major solfatara field, Marga Bayur, is located along itsnorth and NW flanks along the Semangko fault system. Possiblereservoir area is defined based on low resistiviy zone (Schlumberger<10 ohm-m (AB/2=1000m)), surface manifestation, and geologicstruture. The detected area is limited by NW-SE trending faults atsouthwest. The Schlumberger data indictes that a possibility of theexistence of more widen area.Only fumaroles and steam-heated springs occurs, but these are likelyto be derived from deep hot reservoir. Reservoir temperature isestimated higher than 180oC at least; but considering strong activitiesof surface manifestation, a highest temperature of around 250oC orhigher would be expected.Resource potential estimated by stored heat method applying MonteCarlo analysis is 80-200 MW.
Province/Location South Sumatra, Nothern flank of G. BesarNo.24 MARGA BAYUR Region Sumatra
Direct heat use for agricultural industry is recommendable.
Scope for Power Development CO2 EmmissionReduction
('000 tone/year)
Proposed Geothermal Development PlanOutline for Power DevelopmentThe most possible development site in this field is located near surfacemanifestations at Marga Bayur. The demand of electricity in southern part ofSumatra is large, so a large scale power plant development as far as resourceavailable is recommendable.For development in this field, the area of Protected Forest should be taken intoconsideration.
Possibile or Recommended Multi-purpose Geothermal Heat Use
1,037
ResourceCharacteristics
Restricted byPower Demand
Potential (Expected) Developer Private Company
Natural/SocialEnvironmental
Condition
Possible geothermal reservoir area is not within any National Parks.But most of the area is within Protected Forest (about 95% of thepossible reservoir area).
Power SectorSituation
Estimated T/L length from the field to planned Rantau dadap-SegamitS/S is about 29 km. Direct connection with 150kV is recommendable.Electrification ratio in this area reachs only 39.8%.
1 2 3 4 5 6 7 8 9 10 11 12 13 14 15 16 17 18 19 20
ACTIVITY

Power Plant Capacity: 330MW (55MWx6unit or 110MWx3unit)Plant System: CondencingExplor.+Production Well: approx. 55 wellsReinjection Well: less than 40 wellsTransmission Line: 150kV, approx. 18kmConnection: Direct connection to planned G. Sekincau S/S
Proposed Geothermal Development Schedule
1 2 3 4 1 2 3 4 1 2 3 4 1 2 3 4 1 2 3 4 1 2 3 4 1 2 3 4 1 2 3 4 1 2 3 4 1 2 3 4 1 2 3 4 1 2 3 4 1 2 3 4 1 2 3 4 1 2 3 4 1 2 3 4 1 2 3 4 1 2 3 4 1 2 3 4 1 2 3 4
Preliminary Survey Stage
Request for WKP from Local Gov.
Preliminary Survey (Surface Survey by Gevernment)
Tendering
Exploration Stage
Exploratory Well Test Study
Field Development
Exploratory Well Drilling
Well Testing
Reservoir Simulation
Resoure Assessment
Exploitation Stage
Environmental Impact Asssessment
Steam Field Development
Survey, Design, Field Development
Drilling & Testing
Geothermal Fluid Transportation System
Fabrication & Delivery, Construction/Installation
Power Plant
Design, Manufacturing, Delivery, Construction/Installation
Commissioning 110MW 110MW 110MW
(Transmission Line and Switchyard)
Design, Manufacturing, Delivery, Construction/Installation
Commissioning
Operation Stage 110MW 220MW 330MW
Table 7.1.9-1 Development Plan Sheet for New Working Area (No.28 SUOH ANTATAI)
Restricted byPower Demand
Potential (Expected) Developer Private Company
Natural/SocialEnvironmental
Condition
Northeastern part of possible geothermal reservoir area is within TN.Bukit Barisan Selatan National Park (about 50% of the possiblereservoir area). Protected Forest exists at the southeast end of thefield (about 15% of the possible reservoir area).
Power SectorSituation
Estimated T/L length from the field to planned G. Sekincau S/S isabout 18 km. Direct connection with 150kV to the G. Sekincau S/S isrecommendable. Electrification ratio in this area reachs only 37.1%.
Province/Location
Lampung,At Suoh Valley on southern foot of G. Sekincau
Direct heat use for agricultural industry is recommendable.
Scope for Power Development CO2 EmmissionReduction
('000 tone/year)
Proposed Geothermal Development PlanOutline for Power DevelopmentThe most possible development site in this field is located around or south of LakeDanau Asam within the Suoh Depression. The demand of electricity in southernpart of Sumatra is large, so a large scale power plant development as far asresource available is recommendable.For development in this field, the area of National Park should be taken intoconsideration.
Possibile or Recommended Multi-purpose Geothermal Heat Use
2,012
ResourceCharacteristics
No.28 SUOH ANTATAI Region Sumatra
Field Evaluation
Rank of Development Priority
Power Output Potential Resource Potential
B
330 MW600 MW Restrictedby National Park 330 MW
Suoh-Antatai is situated at the southern end of the Sumatera Fault Zone, 45km NW of the port of Kota Agung. Thermal features cover an area of about70 km2 and are found within and immediately surrounding the SuohDepression with fumaroles, springs and mud pools. Possible reservoir areais defined by PERTAMINA as area III. This area is defined based onsurface manifestation, geologic struture, geochemistry and schlumberger.The area is limited by the N-S trending faults at the east and the west andNNW-SSE trending fault at the north.A large number of surface manifestations occur mainly within a NW-SEtrending valley, suggesting large extent of high temperature reservoir.Reservoir temperature is estimated higher than 230oC; considering strongactivities of surface manifestation, a highest temperature of around 270-300oC would be expected.Resource potential estimated by stored heat method applying Monte Carloanalysis is 680-1,280 MW.
1 2 3 4 5 6 7 8 9 10 11 12 13 18 19 2014 15 16 17
ACTIVITY

Power Plant Capacity: 60MW (30MWx2unit)Plant System: CondencingExplor.+Production Well: approx. 12 wellsReinjection Well: less than 9 wellsTransmission Line: 150kV, approx. 19kmConnection: Direct connection to Besai S/S
Proposed Geothermal Development Schedule
1 2 3 4 1 2 3 4 1 2 3 4 1 2 3 4 1 2 3 4 1 2 3 4 1 2 3 4 1 2 3 4 1 2 3 4 1 2 3 4 1 2 3 4 1 2 3 4 1 2 3 4 1 2 3 4 1 2 3 4 1 2 3 4 1 2 3 4 1 2 3 4 1 2 3 4 1 2 3 4
Preliminary Survey Stage
Request for WKP from Local Gov.
Preliminary Survey (Surface Survey by Gevernment)
Tendering
Exploration Stage
Exploratory Well Test Study
Field Development
Exploratory Well Drilling
Well Testing
Reservoir Simulation
Resoure Assessment
Exploitation Stage
Environmental Impact Asssessment
Steam Field Development
Survey, Design, Field Development
Drilling & Testing
Geothermal Fluid Transportation System
Fabrication & Delivery, Construction/Installation
Power Plant
Design, Manufacturing, Delivery, Construction/Installation
Commissioning 30MW 30MW
(Transmission Line and Switchyard)
Design, Manufacturing, Delivery, Construction/Installation
Commissioning
Operation Stage 30MW 60MW
Table 7.1.9-1 Development Plan Sheet for New Working Area (No.29 G. SEKINCAU)
Field Evaluation
Rank of Development Priority
Power Output Potential Resource Potential
B
60 MW300 MW Restrictedby National Park 60 MW
The prospect of G. Sekincau has approximately 15 km north of the SouhAntatai prospect. G. Sekincau is a quarternary andesite volcano (1718m inelevation). Many thermal manesfestations, especially the fumarolic featuresand solfataras lie close to the caldera rim. Also, fumaroles and springsoccur on the flanks of G. Sekincau. Possible reservoir area defined byPERTAMINA as area I. This area is defined based on surfacemanifestation, geologic struture, geochemistry and schlumberger. The areais limited by the NE-SW trending faults and NW-SE trending faults at thesouth.Only fumaroles and steam-heated springs occurs, but these are likely to bederived from deep hot reservoir. This field is next to Suoh-Antatai at thenorth and there is a possibility of reservoir connection between both fields,but details are not clear yet. Reservoir temperature is estimated to bearound 260oC, and a highest temperature near 300oC would be expected.Resource potential estimated by stored heat method applying Monte Carloanalysis is 280-540 MW.
Province/Location Lampung, East to south flank of G. SekincauNo.29 G. SEKINCAU Region Sumatra
Direct heat use for agricultural industry is recommendable.
Scope for Power Development CO2 EmmissionReduction
('000 tone/year)
Proposed Geothermal Development PlanOutline for Power DevelopmentFor development in this field, the area of National Park should be taken intoconsideration. The demand of electricity in southern part of Sumatra is large, so alarge scale power plant development as far as resource available isrecommendable.
Possibile or Recommended Multi-purpose Geothermal Heat Use
366
ResourceCharacteristics
Restricted byPower Demand
Potential (Expected) Developer Private Company
Natural/SocialEnvironmental
Condition
Most of possible geothermal reservoir area is within TN. Bukit BarisanSelatan National Park (about 90% of the possible reservoir area).
Power SectorSituation
Estimated T/L length from the field to planned Besai S/S is about 19km. Direct connection with 150kV is recommendable. Electrificationratio in this area reachs only 37.1%.
1 2 3 4 5 6 7 8 9 10 11 12 13 14 15 16 17 18 19 20
ACTIVITY

Power Plant Capacity: 120MW (40MWx3unit)Plant System: CondencingExplor.+Production Well: approx. 30 wellsReinjection Well: less than 15 wellsTransmission Line: 150kV, approx. 8kmConnection: Direct connection to Kalianda S/S
Proposed Geothermal Development Schedule
1 2 3 4 1 2 3 4 1 2 3 4 1 2 3 4 1 2 3 4 1 2 3 4 1 2 3 4 1 2 3 4 1 2 3 4 1 2 3 4 1 2 3 4 1 2 3 4 1 2 3 4 1 2 3 4 1 2 3 4 1 2 3 4 1 2 3 4 1 2 3 4 1 2 3 4 1 2 3 4
Preliminary Survey Stage
Request for WKP from Local Gov.
Preliminary Survey (Surface Survey by Gevernment)
Tendering
Exploration Stage
Exploratory Well Test Study
Field Development
Exploratory Well Drilling
Well Testing
Reservoir Simulation
Resoure Assessment
Exploitation Stage
Environmental Impact Asssessment
Steam Field Development
Survey, Design, Field Development
Drilling & Testing
Geothermal Fluid Transportation System
Fabrication & Delivery, Construction/Installation
Power Plant
Design, Manufacturing, Delivery, Construction/Installation
Commissioning 40MW 40MW 40MW
(Transmission Line and Switchyard)
Design, Manufacturing, Delivery, Construction/Installation
Commissioning
Operation Stage 40MW 80MW 120MW
Table 7.1.9-1 Development Plan Sheet for New Working Area (No.30 RAJABASA)
Restricted byPower Demand
Potential (Expected) Developer Private Company
Natural/SocialEnvironmental
Condition
Possible geothermal reservoir area is not within any National Parks.But Protected Forest exists at northern part around the summit of G.Rajabasa (about 70% of the possible reservoir area).
Power SectorSituation
Estimated T/L length from the field to planned Kalianda S/S is about 8km. Direct connection with 150kV is recommendable. Electrificationratio in this area reachs only 37.1%.
Province/Location Lampung, South flank of G. Rajabasa
Direct heat use for agricultural or marine product industry is recommendable.
Scope for Power Development CO2 EmmissionReduction
('000 tone/year)
Proposed Geothermal Development PlanOutline for Power DevelopmentThe most possible development site in this field is located in south flank of G.Rajabasa. The demand of electricity in southern part of Sumatra is large, so a largescale power plant development as far as resource available is recommendable.
Possibile or Recommended Multi-purpose Geothermal Heat Use
732
ResourceCharacteristics
No.30 RAJABASA Region Sumatra
Field Evaluation
Rank of Development Priority
Power Output Potential Resource Potential
C
120 MW120 MW Restrictedby National Park 120 MW
Rajabasa field spreads over a quaternary andesitic volcanic systemincluding the G. Rajabasa and G. Balerang volcanoes. The main surfacemanifestations, fumarolic activities appear at 500m elevation on south sideon G. Rajabasa. Possible reservoir area is defined at the southern flank ofG. Rajabasa, based on the low resistivity zone (MT resistivity <20 ohm-m),bouguer anomaly, hot spring, hydorothermal alteration zone, and geologicstruture. The major geologic structure in this field is NE-SW trending faultsand NW-SE trending faults. Hot springs of G. Botak and Kugung align onthese fault strucutures.Reservoir fluid originates in meteoric water and seawater. Some of theboiled fluid yields surface fumaroles. Reservoir temperature is estimatedfrom 200oC to 250oC, and possibly up to 280oC according to gasgeothermometry.Resource potential estimated by stored heat method applying Monte Carloanalysis is 120-250 MW.
1 2 3 4 5 6 7 8 9 10 11 12 13 18 19 2014 15 16 17
ACTIVITY

Power Plant Capacity: 120MW (40MWx3unit)Plant System: CondencingExplor.+Production Well: approx. 30 wellsReinjection Well: less than 15 wellsTransmission Line: 150kV, approx. 16kmConnection: P connection between Teluk Betung S/S and Gedung Tataan S/S (planned)
Proposed Geothermal Development Schedule
1 2 3 4 1 2 3 4 1 2 3 4 1 2 3 4 1 2 3 4 1 2 3 4 1 2 3 4 1 2 3 4 1 2 3 4 1 2 3 4 1 2 3 4 1 2 3 4 1 2 3 4 1 2 3 4 1 2 3 4 1 2 3 4 1 2 3 4 1 2 3 4 1 2 3 4 1 2 3 4
Preliminary Survey Stage
Request for WKP from Local Gov.
Preliminary Survey (Surface Survey by Gevernment)
Tendering
Exploration Stage
Exploratory Well Test Study
Field Development
Exploratory Well Drilling
Well Testing
Reservoir Simulation
Resoure Assessment
Exploitation Stage
Environmental Impact Asssessment
Steam Field Development
Survey, Design, Field Development
Drilling & Testing
Geothermal Fluid Transportation System
Fabrication & Delivery, Construction/Installation
Power Plant
Design, Manufacturing, Delivery, Construction/Installation
Commissioning 40MW 40MW 40MW
(Transmission Line and Switchyard)
Design, Manufacturing, Delivery, Construction/Installation
Commissioning
Operation Stage 40MW 80MW 120MW
Table 7.1.9-1 Development Plan Sheet for New Working Area (No.31 WAI RATAI)
Field Evaluation
Rank of Development Priority
Power Output Potential Resource Potential
C
120 MW120 MW Restrictedby National Park 120 MW
Wai Ratai field is about 20 km southwest of the port of Teluk Betungwith the area of 30 km2 covering by many hot springs. The springs aremainly at low altitudes at the head of Teluk Ratai and north of the WaiRatai river valley. Most of the springs occur in Tertiary predominatlyandesitic volcanics. Possible reservoir area is defined based on lowresistivity zone (Schlumberger <15 ohm-m), surface manifestation andgeologic struture. The major geologic strucuture in this field is NW-SEtrending.Reservoir fluid originates in meteoric water and possibly someseawater. Some of the boiled fluid yields surface mudpools. Reservoirtemperature is estimated around 220oC or higher, and possibly up to290oC according to gas geothermometry.Resource potential estimated by stored heat method applying MonteCarlo analysis is 135-260 MW.
Province/Location Lampung, Southeastern foot of G. RataiNo.31 WAI RATAI Region Sumatra
Direct heat use for agricultural or marine product industry is recommendable.A pilot drying plant using hot spring water for producing Copra has beenconstructed by BPPT.
Scope for Power Development CO2 EmmissionReduction
('000 tone/year)
Proposed Geothermal Development PlanOutline for Power DevelopmentThe most possible development site in this field is located in southeastern foot ofG. Ratai. The demand of electricity in southern part of Sumatra is large, so a largescale power plant development as far as resource available is recommendable.
Possibile or Recommended Multi-purpose Geothermal Heat Use
732
ResourceCharacteristics
Restricted byPower Demand
Potential (Expected) Developer Private Company
Natural/SocialEnvironmental
Condition
Northern end of possible geothermal reservoir area is within THR.Wan Abdul Rachman National Park (about 15% of the possiblereservoir area).
Power SectorSituation
Estimated T/L length from the field to intersection T/L between TelukBetung S/S and Gedung Tataan S/S (planned) is about 16 km. PConnection between the two S/S with 150kV is recommendable.
1 2 3 4 5 6 7 8 9 10 11 12 13 14 15 16 17 18 19 20
ACTIVITY
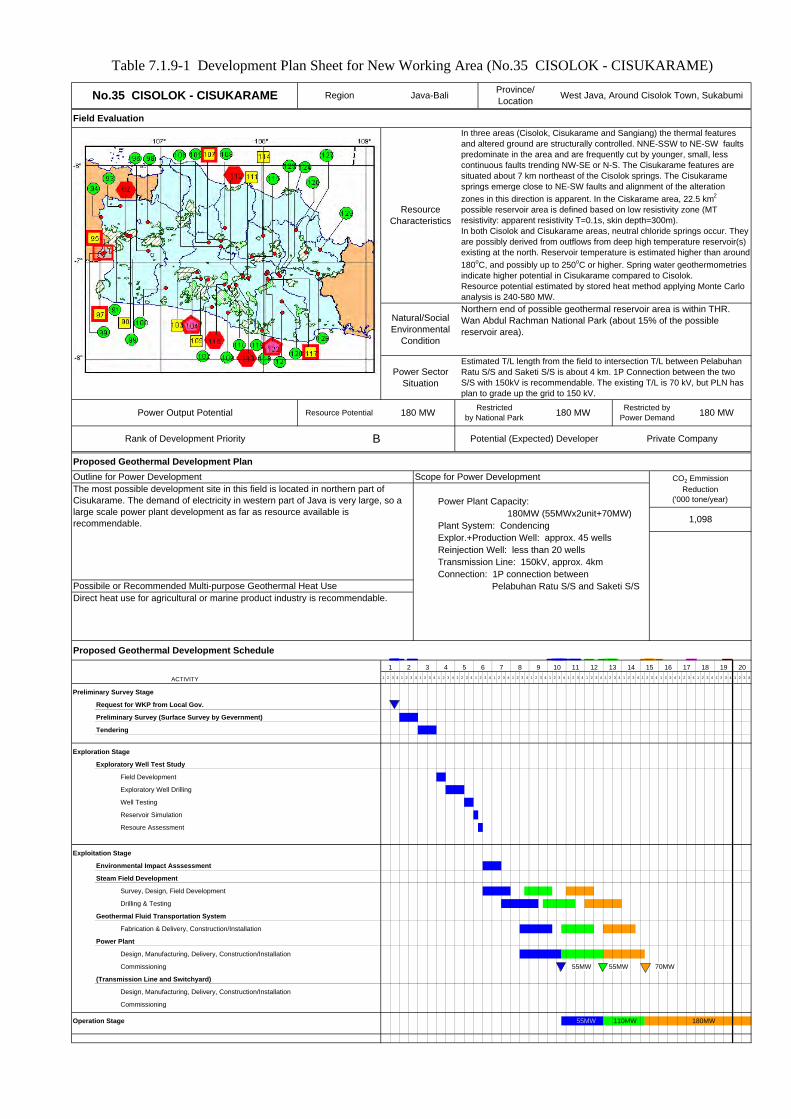
Power Plant Capacity: 180MW (55MWx2unit+70MW)Plant System: CondencingExplor.+Production Well: approx. 45 wellsReinjection Well: less than 20 wellsTransmission Line: 150kV, approx. 4kmConnection: 1P connection between Pelabuhan Ratu S/S and Saketi S/S
Proposed Geothermal Development Schedule
1 2 3 4 1 2 3 4 1 2 3 4 1 2 3 4 1 2 3 4 1 2 3 4 1 2 3 4 1 2 3 4 1 2 3 4 1 2 3 4 1 2 3 4 1 2 3 4 1 2 3 4 1 2 3 4 1 2 3 4 1 2 3 4 1 2 3 4 1 2 3 4 1 2 3 4 1 2 3 4
Preliminary Survey Stage
Request for WKP from Local Gov.
Preliminary Survey (Surface Survey by Gevernment)
Tendering
Exploration Stage
Exploratory Well Test Study
Field Development
Exploratory Well Drilling
Well Testing
Reservoir Simulation
Resoure Assessment
Exploitation Stage
Environmental Impact Asssessment
Steam Field Development
Survey, Design, Field Development
Drilling & Testing
Geothermal Fluid Transportation System
Fabrication & Delivery, Construction/Installation
Power Plant
Design, Manufacturing, Delivery, Construction/Installation
Commissioning 55MW 55MW 70MW
(Transmission Line and Switchyard)
Design, Manufacturing, Delivery, Construction/Installation
Commissioning
Operation Stage 55MW 110MW 180MW
ACTIVITY
17 18 19 2013 14 15 169 10 11 125 6 7 81 2 3 4
Restricted byPower Demand
Potential (Expected) Developer Private Company
Natural/SocialEnvironmental
Condition
Northern end of possible geothermal reservoir area is within THR.Wan Abdul Rachman National Park (about 15% of the possiblereservoir area).
Power SectorSituation
Estimated T/L length from the field to intersection T/L between PelabuhanRatu S/S and Saketi S/S is about 4 km. 1P Connection between the twoS/S with 150kV is recommendable. The existing T/L is 70 kV, but PLN hasplan to grade up the grid to 150 kV.
Direct heat use for agricultural or marine product industry is recommendable.
Scope for Power Development CO2 EmmissionReduction
('000 tone/year)
Proposed Geothermal Development PlanOutline for Power DevelopmentThe most possible development site in this field is located in northern part ofCisukarame. The demand of electricity in western part of Java is very large, so alarge scale power plant development as far as resource available isrecommendable.
Possibile or Recommended Multi-purpose Geothermal Heat Use
1,098
ResourceCharacteristics
In three areas (Cisolok, Cisukarame and Sangiang) the thermal featuresand altered ground are structurally controlled. NNE-SSW to NE-SW faultspredominate in the area and are frequently cut by younger, small, lesscontinuous faults trending NW-SE or N-S. The Cisukarame features aresituated about 7 km northeast of the Cisolok springs. The Cisukaramesprings emerge close to NE-SW faults and alignment of the alterationzones in this direction is apparent. In the Ciskarame area, 22.5 km2
possible reservoir area is defined based on low resistivity zone (MTresistivity: apparent resistivity T=0.1s, skin depth=300m).In both Cisolok and Cisukarame areas, neutral chloride springs occur. Theyare possibly derived from outflows from deep high temperature reservoir(s)existing at the north. Reservoir temperature is estimated higher than around180oC, and possibly up to 250oC or higher. Spring water geothermometriesindicate higher potential in Cisukarame compared to Cisolok.Resource potential estimated by stored heat method applying Monte Carloanalysis is 240-580 MW.
Province/Location West Java, Around Cisolok Town, SukabumiNo.35 CISOLOK - CISUKARAME Region Java-Bali
Table 7.1.9-1 Development Plan Sheet for New Working Area (No.35 CISOLOK - CISUKARAME)
Field Evaluation
Rank of Development Priority
Power Output Potential Resource Potential
B
180 MW180 MW Restrictedby National Park 180 MW
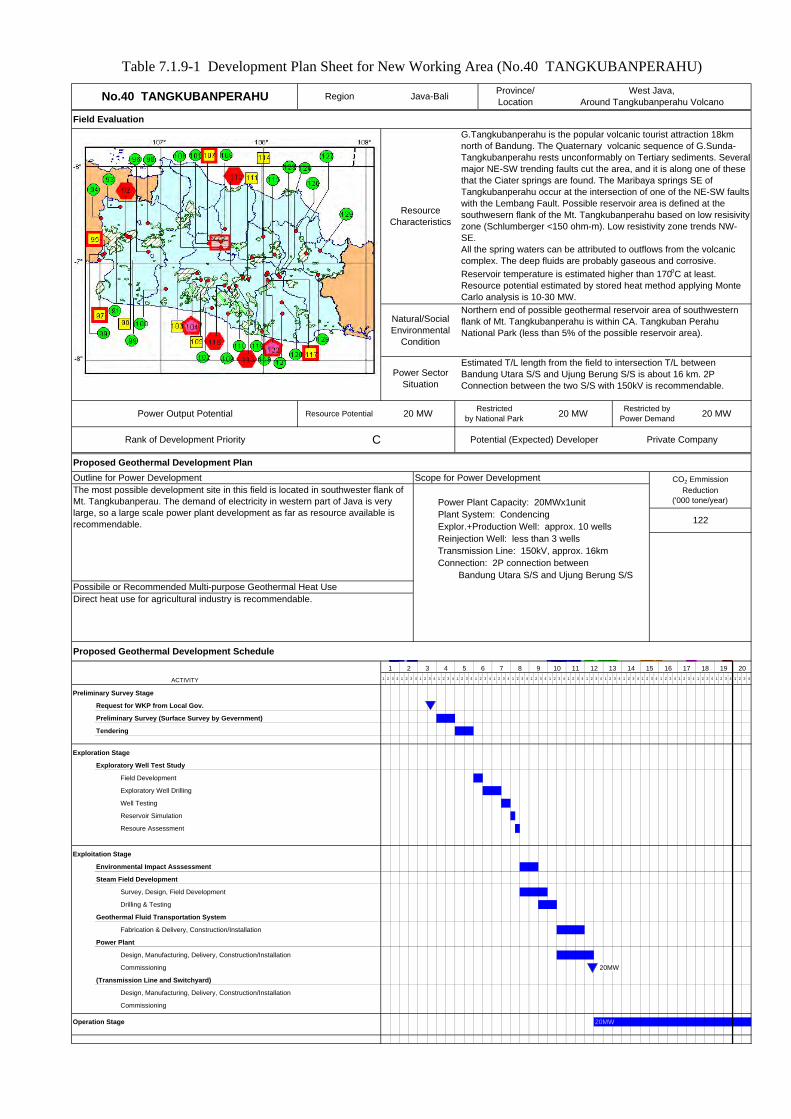
Power Plant Capacity: 20MWx1unitPlant System: CondencingExplor.+Production Well: approx. 10 wellsReinjection Well: less than 3 wellsTransmission Line: 150kV, approx. 16kmConnection: 2P connection between Bandung Utara S/S and Ujung Berung S/S
Proposed Geothermal Development Schedule
1 2 3 4 1 2 3 4 1 2 3 4 1 2 3 4 1 2 3 4 1 2 3 4 1 2 3 4 1 2 3 4 1 2 3 4 1 2 3 4 1 2 3 4 1 2 3 4 1 2 3 4 1 2 3 4 1 2 3 4 1 2 3 4 1 2 3 4 1 2 3 4 1 2 3 4 1 2 3 4
Preliminary Survey Stage
Request for WKP from Local Gov.
Preliminary Survey (Surface Survey by Gevernment)
Tendering
Exploration Stage
Exploratory Well Test Study
Field Development
Exploratory Well Drilling
Well Testing
Reservoir Simulation
Resoure Assessment
Exploitation Stage
Environmental Impact Asssessment
Steam Field Development
Survey, Design, Field Development
Drilling & Testing
Geothermal Fluid Transportation System
Fabrication & Delivery, Construction/Installation
Power Plant
Design, Manufacturing, Delivery, Construction/Installation
Commissioning 20MW
(Transmission Line and Switchyard)
Design, Manufacturing, Delivery, Construction/Installation
Commissioning
Operation Stage 20MW
ACTIVITY
18 19 2014 15 16 1710 11 12 13
G.Tangkubanperahu is the popular volcanic tourist attraction 18kmnorth of Bandung. The Quaternary volcanic sequence of G.Sunda-Tangkubanperahu rests unconformably on Tertiary sediments. Severalmajor NE-SW trending faults cut the area, and it is along one of thesethat the Ciater springs are found. The Maribaya springs SE ofTangkubanperahu occur at the intersection of one of the NE-SW faultswith the Lembang Fault. Possible reservoir area is defined at thesouthwesern flank of the Mt. Tangkubanperahu based on low resisivityzone (Schlumberger <150 ohm-m). Low resistivity zone trends NW-SE.All the spring waters can be attributed to outflows from the volcaniccomplex. The deep fluids are probably gaseous and corrosive.Reservoir temperature is estimated higher than 170oC at least.Resource potential estimated by stored heat method applying MonteCarlo analysis is 10-30 MW.
1 2 3 4 5 6 7 8 9
20 MW20 MW Restrictedby National Park 20 MW
Rank of Development Priority
Power Output Potential Resource Potential
C
No.40 TANGKUBANPERAHU Region Java-Bali
Field Evaluation
Direct heat use for agricultural industry is recommendable.
Scope for Power Development CO2 EmmissionReduction
('000 tone/year)
Proposed Geothermal Development PlanOutline for Power DevelopmentThe most possible development site in this field is located in southwester flank ofMt. Tangkubanperau. The demand of electricity in western part of Java is verylarge, so a large scale power plant development as far as resource available isrecommendable.
Possibile or Recommended Multi-purpose Geothermal Heat Use
122
ResourceCharacteristics
Table 7.1.9-1 Development Plan Sheet for New Working Area (No.40 TANGKUBANPERAHU)
Restricted byPower Demand
Potential (Expected) Developer Private Company
Natural/SocialEnvironmental
Condition
Northern end of possible geothermal reservoir area of southwesternflank of Mt. Tangkubanperahu is within CA. Tangkuban PerahuNational Park (less than 5% of the possible reservoir area).
Power SectorSituation
Estimated T/L length from the field to intersection T/L betweenBandung Utara S/S and Ujung Berung S/S is about 16 km. 2PConnection between the two S/S with 150kV is recommendable.
Province/Location
West Java,Around Tangkubanperahu Volcano

Power Plant Capacity: 20MWx1unitPlant System: Condencing or BinaryExplor.+Production Well: approx. 10 wellsReinjection Well: less than 3 wellsTransmission Line: 70kV, approx. 8kmConnection: P connection between Rangkasbitung S/S and Menes S/S
Proposed Geothermal Development Schedule
1 2 3 4 1 2 3 4 1 2 3 4 1 2 3 4 1 2 3 4 1 2 3 4 1 2 3 4 1 2 3 4 1 2 3 4 1 2 3 4 1 2 3 4 1 2 3 4 1 2 3 4 1 2 3 4 1 2 3 4 1 2 3 4 1 2 3 4 1 2 3 4 1 2 3 4 1 2 3 4
Preliminary Survey Stage
Request for WKP from Local Gov.
Preliminary Survey (Surface Survey by Gevernment)
Tendering
Exploration Stage
Exploratory Well Test Study
Field Development
Exploratory Well Drilling
Well Testing
Reservoir Simulation
Resoure Assessment
Exploitation Stage
Environmental Impact Asssessment
Steam Field Development
Survey, Design, Field Development
Drilling & Testing
Geothermal Fluid Transportation System
Fabrication & Delivery, Construction/Installation
Power Plant
Design, Manufacturing, Delivery, Construction/Installation
Commissioning
(Transmission Line and Switchyard)
Design, Manufacturing, Delivery, Construction/Installation
Commissioning
Operation Stage 20MW
ACTIVITY
17 18 19 2013 14 15 169 10 11 125 6 7 81 2 3 4
Restricted byPower Demand
Potential (Expected) Developer Private Company
Natural/SocialEnvironmental
Condition
Possible geothermal reservoir area is not within any National Parks.CA. Gunung Karang National Park exists around the summit of G.Karang.
Power SectorSituation
Estimated T/L length from the field to intersection T/L betweenRangkasbitung S/S and Menes S/S is about 8 km. P Connectionbetween the two S/S with 70kV is recommendable.
Direct heat use for agricultural industry is recommendable.
Scope for Power Development CO2 EmmissionReduction
('000 tone/year)
Proposed Geothermal Development PlanOutline for Power DevelopmentThe possible development site in this field is located in southeastern flank of G.Karang. The reservoir fluid is likely to have only low enthalpy, so that there ispossibility that only binary plant system can be applied for power development andthat the development priority is relatively low. The demand of electricity in westernpart of Java is very large, so a large scale power plant development as far asresource available is recommendable.
Possibile or Recommended Multi-purpose Geothermal Heat Use
122
ResourceCharacteristics
This field is associated with the Quaternary G. Karang volcano. Asolfatara field is on the southern flank of G. Karang. Several hot, warmor cold springs are present and are aligned along this NW-SE reginalfaults. Deep exploratory well BTN-1 was drilled by PERTAMINA in1986 at the southeastern flank of the G. Karang, but the well didn'tencounter the geothermal reservoir and logging tepmarature was low.Warm and hot bicarbonate springs occur at the SSE foot of G. Karangsummit. These springs may be derived from outflows from reservoir(s)existing at the mountain side. Reservoir temperature is estimatedhigher than 180oC at least according to a literature.Resource potential estimated by stored heat method applying MonteCarlo analysis is 15-35 MW.
Province/Location Banten, Around G. KarangNo.42 CITAMAN - G. KARANG Region Java-Bali
Table 7.1.9-1 Development Plan Sheet for New Working Area (No.42 CITAMAN - G. KARANG)
Field Evaluation
Rank of Development Priority
Power Output Potential Resource Potential
L
20 MW20 MW Restrictedby National Park 20 MW
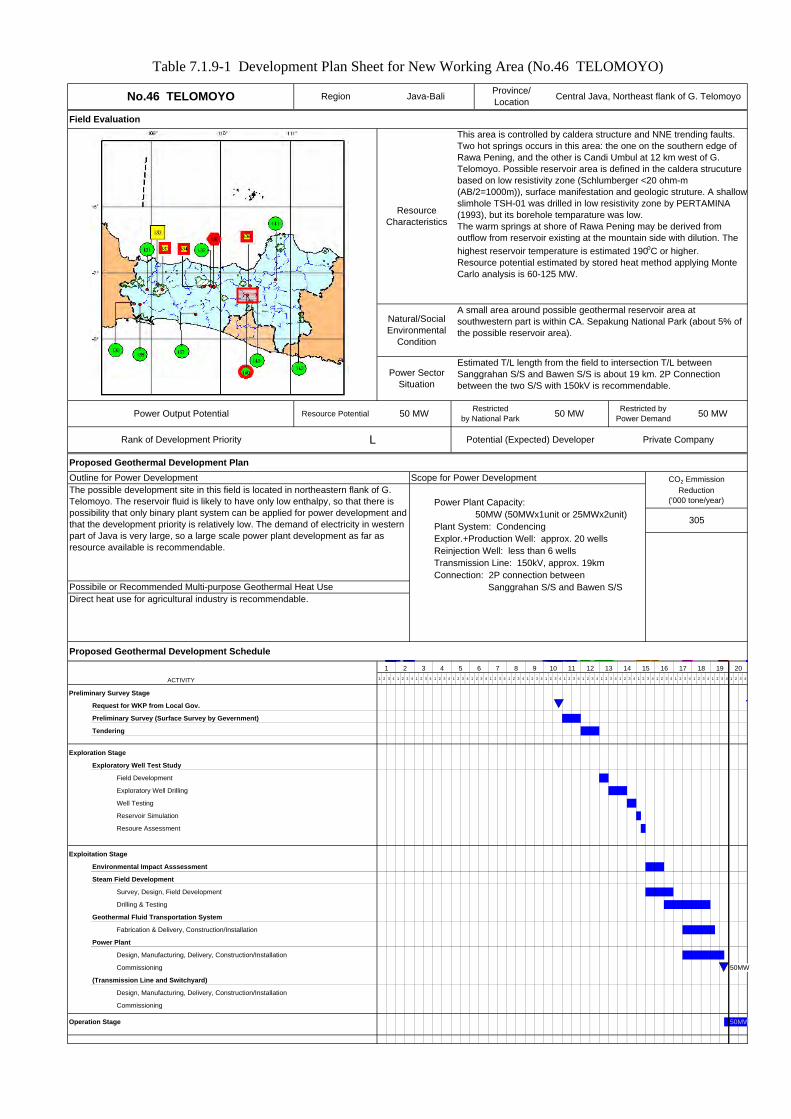
Power Plant Capacity: 50MW (50MWx1unit or 25MWx2unit)Plant System: CondencingExplor.+Production Well: approx. 20 wellsReinjection Well: less than 6 wellsTransmission Line: 150kV, approx. 19kmConnection: 2P connection between Sanggrahan S/S and Bawen S/S
Proposed Geothermal Development Schedule
1 2 3 4 1 2 3 4 1 2 3 4 1 2 3 4 1 2 3 4 1 2 3 4 1 2 3 4 1 2 3 4 1 2 3 4 1 2 3 4 1 2 3 4 1 2 3 4 1 2 3 4 1 2 3 4 1 2 3 4 1 2 3 4 1 2 3 4 1 2 3 4 1 2 3 4 1 2 3 4
Preliminary Survey Stage
Request for WKP from Local Gov.
Preliminary Survey (Surface Survey by Gevernment)
Tendering
Exploration Stage
Exploratory Well Test Study
Field Development
Exploratory Well Drilling
Well Testing
Reservoir Simulation
Resoure Assessment
Exploitation Stage
Environmental Impact Asssessment
Steam Field Development
Survey, Design, Field Development
Drilling & Testing
Geothermal Fluid Transportation System
Fabrication & Delivery, Construction/Installation
Power Plant
Design, Manufacturing, Delivery, Construction/Installation
Commissioning 50MW
(Transmission Line and Switchyard)
Design, Manufacturing, Delivery, Construction/Installation
Commissioning
Operation Stage 50MW
ACTIVITY
18 19 2014 15 16 1710 11 12 13
This area is controlled by caldera structure and NNE trending faults.Two hot springs occurs in this area: the one on the southern edge ofRawa Pening, and the other is Candi Umbul at 12 km west of G.Telomoyo. Possible reservoir area is defined in the caldera strucuturebased on low resistivity zone (Schlumberger <20 ohm-m(AB/2=1000m)), surface manifestation and geologic struture. A shallowslimhole TSH-01 was drilled in low resistivity zone by PERTAMINA(1993), but its borehole temparature was low.The warm springs at shore of Rawa Pening may be derived fromoutflow from reservoir existing at the mountain side with dilution. Thehighest reservoir temperature is estimated 190oC or higher.Resource potential estimated by stored heat method applying MonteCarlo analysis is 60-125 MW.
1 2 3 4 5 6 7 8 9
50 MW50 MW Restrictedby National Park 50 MW
Rank of Development Priority
Power Output Potential Resource Potential
L
No.46 TELOMOYO Region Java-Bali
Field Evaluation
Direct heat use for agricultural industry is recommendable.
Scope for Power Development CO2 EmmissionReduction
('000 tone/year)
Proposed Geothermal Development PlanOutline for Power DevelopmentThe possible development site in this field is located in northeastern flank of G.Telomoyo. The reservoir fluid is likely to have only low enthalpy, so that there ispossibility that only binary plant system can be applied for power development andthat the development priority is relatively low. The demand of electricity in westernpart of Java is very large, so a large scale power plant development as far asresource available is recommendable.
Possibile or Recommended Multi-purpose Geothermal Heat Use
305
ResourceCharacteristics
Table 7.1.9-1 Development Plan Sheet for New Working Area (No.46 TELOMOYO)
Restricted byPower Demand
Potential (Expected) Developer Private Company
Natural/SocialEnvironmental
Condition
A small area around possible geothermal reservoir area atsouthwestern part is within CA. Sepakung National Park (about 5% ofthe possible reservoir area).
Power SectorSituation
Estimated T/L length from the field to intersection T/L betweenSanggrahan S/S and Bawen S/S is about 19 km. 2P Connectionbetween the two S/S with 150kV is recommendable.
Province/Location Central Java, Northeast flank of G. Telomoyo

Power Plant Capacity: 180MW (55MWx2unit+70MW)Plant System: CondencingExplor.+Production Well: approx. 45 wellsReinjection Well: less than 20 wellsTransmission Line: 150kV, approx. 2kmConnection: 1P connection between Ungaran S/S and Bawen S/S
Proposed Geothermal Development Schedule
1 2 3 4 1 2 3 4 1 2 3 4 1 2 3 4 1 2 3 4 1 2 3 4 1 2 3 4 1 2 3 4 1 2 3 4 1 2 3 4 1 2 3 4 1 2 3 4 1 2 3 4 1 2 3 4 1 2 3 4 1 2 3 4 1 2 3 4 1 2 3 4 1 2 3 4 1 2 3 4
Preliminary Survey Stage
Request for WKP from Local Gov.
Preliminary Survey (Surface Survey by Gevernment)
Tendering
Exploration Stage
Exploratory Well Test Study
Field Development
Exploratory Well Drilling
Well Testing
Reservoir Simulation
Resoure Assessment
Exploitation Stage
Environmental Impact Asssessment
Steam Field Development
Survey, Design, Field Development
Drilling & Testing
Geothermal Fluid Transportation System
Fabrication & Delivery, Construction/Installation
Power Plant
Design, Manufacturing, Delivery, Construction/Installation
Commissioning 55MW 55MW 70MW
(Transmission Line and Switchyard)
Design, Manufacturing, Delivery, Construction/Installation
Commissioning
Operation Stage 55MW 110MW 180MW
ACTIVITY
17 18 19 2013 14 15 169 10 11 125 6 7 81 2 3 4
Restricted byPower Demand
Potential (Expected) Developer Private Company
Natural/SocialEnvironmental
Condition
Possible geothermal reservoir area is not within any National Parks.CA. Ungaran National Park exists around the summit of G. Ungaran.
Power SectorSituation
Estimated T/L length from the field to intersection T/L betweenUngaran S/S and Bawen S/S is about 2 km. 1P Connection betweenthe two S/S with 150kV is recommendable.
Direct heat use for agricultural industry is recommendable.
Scope for Power Development CO2 EmmissionReduction
('000 tone/year)
Proposed Geothermal Development PlanOutline for Power DevelopmentThe most possible development site in this field is located in southern flank of G.Ungaran. The demand of electricity in western part of Java is very large, so a largescale power plant development as far as resource available is recommendable.
Possibile or Recommended Multi-purpose Geothermal Heat Use
1,098
ResourceCharacteristics
G. Ungaran is located to the NNW direction from G. Merapi activevolocano. The hydrothermal area at Gedongsongo is associated withthe youngest volcanic activities on G. Ungaran since just to the north isthe crater from which the youngest andesite lavas flowed. Possiblereservoir area is defined at the southern to southeastern flank of G.Ungaran, based on low resistivity zone(MT resistivity <10 ohm-m), surface manifestation and geologicstruture.Fumaroles at Gedong Songo on the southern slope of G. Ungaran arethe only high temperature manifestations in this field. The warmsprings may be basically derived from outflows. Reservoir temperatureis estimated higher than 180oC at least, and possibly up to 320oC fromgas and Na/K geothermometries.Resource potential estimated by stored heat method applying MonteCarlo analysis is 140-355 MW.
Province/Location Central Java, Southern flank of G. UngaranNo.47 UNGARAN Region Java-Bali
Table 7.1.9-1 Development Plan Sheet for New Working Area (No.47 UNGARAN)
Field Evaluation
Rank of Development Priority
Power Output Potential Resource Potential
B
180 MW180 MW Restrictedby National Park 180 MW

Power Plant Capacity: 120MW (55MW+65MW)Plant System: CondencingExplor.+Production Well: approx. 30 wellsReinjection Well: less than 15 wellsTransmission Line: 150kV, approx. 5kmConnection: 1P connection between Kedungbaru S/S and Manisrejo S/S
Proposed Geothermal Development Schedule
1 2 3 4 1 2 3 4 1 2 3 4 1 2 3 4 1 2 3 4 1 2 3 4 1 2 3 4 1 2 3 4 1 2 3 4 1 2 3 4 1 2 3 4 1 2 3 4 1 2 3 4 1 2 3 4 1 2 3 4 1 2 3 4 1 2 3 4 1 2 3 4 1 2 3 4 1 2 3 4
Preliminary Survey Stage
Request for WKP from Local Gov.
Preliminary Survey (Surface Survey by Gevernment)
Tendering
Exploration Stage
Exploratory Well Test Study
Field Development
Exploratory Well Drilling
Well Testing
Reservoir Simulation
Resoure Assessment
Exploitation Stage
Environmental Impact Asssessment
Steam Field Development
Survey, Design, Field Development
Drilling & Testing
Geothermal Fluid Transportation System
Fabrication & Delivery, Construction/Installation
Power Plant
Design, Manufacturing, Delivery, Construction/Installation
Commissioning 55MW 65MW
(Transmission Line and Switchyard)
Design, Manufacturing, Delivery, Construction/Installation
Commissioning
Operation Stage 55MW 120MW
ACTIVITY
18 19 2014 15 16 1710 11 12 13
Thermal features in this field occur at about 1.5 km south of the lakeTelaga Ngebel. The dominant geological structures are some arcuatecaldera structres and normal faults. As small scaled fractures, NW-SEto NNW-SSE trending faults are observed at Telaga Ngebel,accompanied with weakly altered zone and open fracture. Possiblereservoir area is defined arond Telaga Ngebel based on low resistivityzone (MT resistivity <5 ohm-m (T=3s)), surface manifestation andgeologic struture. A shallow slimhole WSH-02 (504m) was drilled inlow resistivity zone by PERTAMINA, maximum measured boreholetemparature was 146.16oC.Hot spring water in Pandusan at the south of Telaga Ngebel andWSH-02 well water is neutral chloride type. Reservoir temperature isestimated around 190-250oC or higher.Resource potential estimated by stored heat method applying MonteCarlo analysis is 120-280 MW.
1 2 3 4 5 6 7 8 9
120 MW120 MW Restrictedby National Park 120 MW
Rank of Development Priority
Power Output Potential Resource Potential
B
No.50 WILIS / NGEBEL Region Java-Bali
Field Evaluation
Direct heat use for agricultural industry is recommendable.
Scope for Power Development CO2 EmmissionReduction
('000 tone/year)
Proposed Geothermal Development PlanOutline for Power DevelopmentThe most possible development site in this field is located in the south of TelagaNgebel. The demand of electricity in eastern part of Java is very large, so a largescale power plant development as far as resource available is recommendable.
Possibile or Recommended Multi-purpose Geothermal Heat Use
732
ResourceCharacteristics
Table 7.1.9-1 Development Plan Sheet for New Working Area (No.50 WILIS / NGEBEL)
Restricted byPower Demand
Potential (Expected) Developer Private Company
Natural/SocialEnvironmental
Condition
Minor National Parks (CA. G. Picis, SM. G. Wilis, etc.) exist aroundpossible geothermal reservoir area (about 5% of the possible reservoirarea).
Power SectorSituation
Estimated T/L length from the field to intersection T/L betweenKedungbaru S/S and Manisrejo S/S is about 5 km. 1P Connectionbetween the two S/S with 150kV is recommendable.
Province/Location Central Java, Western flank of G. Wilis

Power Plant Capacity: 40MW (20MWx2unit)Plant System: CondencingExplor.+Production Well: approx. 15 wellsReinjection Well: less than 5 wellsTransmission Line: 150kV, approx. 5kmConnection: 1P connection between SitubondoS/S and Banyuwangi S/S
Proposed Geothermal Development Schedule
1 2 3 4 1 2 3 4 1 2 3 4 1 2 3 4 1 2 3 4 1 2 3 4 1 2 3 4 1 2 3 4 1 2 3 4 1 2 3 4 1 2 3 4 1 2 3 4 1 2 3 4 1 2 3 4 1 2 3 4 1 2 3 4 1 2 3 4 1 2 3 4 1 2 3 4 1 2 3 4
Preliminary Survey Stage
Request for WKP from Local Gov.
Preliminary Survey (Surface Survey by Gevernment)
Tendering
Exploration Stage
Exploratory Well Test Study
Field Development
Exploratory Well Drilling
Well Testing
Reservoir Simulation
Resoure Assessment
Exploitation Stage
Environmental Impact Asssessment
Steam Field Development
Survey, Design, Field Development
Drilling & Testing
Geothermal Fluid Transportation System
Fabrication & Delivery, Construction/Installation
Power Plant
Design, Manufacturing, Delivery, Construction/Installation
Commissioning 20MW 20MW
(Transmission Line and Switchyard)
Design, Manufacturing, Delivery, Construction/Installation
Commissioning
Operation Stage 20MW 40MW
ACTIVITY
17 18 19 2013 14 15 169 10 11 125 6 7 81 2 3 4
Restricted byPower Demand
Potential (Expected) Developer Private Company
Natural/SocialEnvironmental
Condition
Southern and western part of possible geothermal reservoir area iswithin TB. Maelang, CA. Kawah Ijen Ungup-ungup and CA. GunungRaung National Parks (about 65% of the possible reservoir area). Therest (about 35%) of the area is within Protected Forest.
Power SectorSituation
Estimated T/L length from the field to intersection T/L betweenSitubondoS/S and Banyuwangi S/S is about 5 km. 1P Connectionbetween the two S/S with 150kV is recommendable.
Direct heat use for agricultural industry is recommendable.
Scope for Power Development CO2 EmmissionReduction
('000 tone/year)
Proposed Geothermal Development PlanOutline for Power DevelopmentThe most possible development site in this field is located in northwestern flank ofKawah Ijen. The demand of electricity in eastern part of Java is very large, so alarge scale power plant development as far as resource available isrecommendable.For development in this field, the area of National Park should be taken intoconsideration.
Possibile or Recommended Multi-purpose Geothermal Heat Use
244
ResourceCharacteristics
Ijen is a very large strato-volcano with a 16 km diameter caldera (KendengCaldera) at the summit of the old basalt-andesite sequence. Thermalfeatures are only situated within this caldera. Two distinct areas of thermalactivity are present, at Kawah Ijen, where there is a large warm lake,fumaroles and solfatara, and 10km northwestward at Blawan where thereare hot and warm springs. Possible reservoir area is defined based on lowresistivity zone (MT resistivity <7 ohm-m ). The low resistivity zonedistribute trending N-S and it distribute along circled volcanic crater.The fumarole in Kawah Ijen having a temperature over 200oC. Warmsprings in and around Blawan are peripheral system or strongly dilutedoutflow of Kawah Ijen volcanic fluid system. The deep hot fluids possiblyexistin near Kawah Ijen are probably gaseous and corrosive.Resource potential estimated by stored heat method applying Monte Carloanalysis is 80-200 MW.
Province/Location East Java, North to west of Kawah IjenNo.51 IJEN Region Java-Bali
Table 7.1.9-1 Development Plan Sheet for New Working Area (No.51 IJEN)
Field Evaluation
Rank of Development Priority
Power Output Potential Resource Potential
C
40 MW120 MW Restrictedby National Park 40 MW

Power Plant Capacity: 30MW (10MWx3unit)Plant System: Condencing or Back-pressureExplor.+Production Well: approx. 15 wellsReinjection Well: less than 4 wellsTransmission Line: 20kV, approx. 15kmConnection: Distribution Line in Sumbawa Island
Proposed Geothermal Development Schedule
1 2 3 4 1 2 3 4 1 2 3 4 1 2 3 4 1 2 3 4 1 2 3 4 1 2 3 4 1 2 3 4 1 2 3 4 1 2 3 4 1 2 3 4 1 2 3 4 1 2 3 4 1 2 3 4 1 2 3 4 1 2 3 4 1 2 3 4 1 2 3 4 1 2 3 4 1 2 3 4
Preliminary Survey Stage
Request for WKP from Local Gov.
Preliminary Survey (Surface Survey by Gevernment)
Tendering
Exploration Stage
Exploratory Well Test Study
Field Development
Exploratory Well Drilling
Well Testing
Reservoir Simulation
Resoure Assessment
Exploitation Stage
Environmental Impact Asssessment
Steam Field Development
Survey, Design, Field Development
Drilling & Testing
Geothermal Fluid Transportation System
Fabrication & Delivery, Construction/Installation
Power Plant
Design, Manufacturing, Delivery, Construction/Installation
Commissioning 30MW
(Transmission Line and Switchyard)
Design, Manufacturing, Delivery, Construction/Installation
Commissioning
Operation Stage 30MW
Restricted byPower Demand
Potential (Expected) Developer Private Company orCentral/Local Government
Natural/SocialEnvironmental
Condition
Possible geothermal reservoir area is not within any National Parks.But the eastern part of the area is within Protected Forest (about 25%of the possible reservoir area).
Power SectorSituation
The whole system in the Sumbawa is D/L. At present, electrificationratio in this area reachs only 28.1%. Estimated D/L length from thefield to the nearest existing line is about 15 km.
Direct heat use for agricultural or marine product industry is recommendable.
Scope for Power Development CO2 EmmissionReduction
('000 tone/year)
Proposed Geothermal Development PlanOutline for Power DevelopmentThe possible development site in this field is located around Doro Pure. Thedemand of electricity in Sumbawa Island is not large, so a small scale with multi-unit power plant development is recommendable. If sufficient steam is obtained bysteamfield development, the power system available for variable load is disireblefor power supply not only for base load but also peak load.
Possibile or Recommended Multi-purpose Geothermal Heat Use
183
ResourceCharacteristics
Province/Location
West Nusa Tenggara,Southeast of Sumbawa IslandNo.53 HU'U DAHA Region Nussa Tenggara
Field Evaluation
Rank of Development Priority
Power Output Potential Resource Potential
C
30 MW110 MW Restrictedby National Park 110 MW
The prospect covers the whole promontory - an area in excess of 150km2. There are 4 hot spring areas scattered around a circle of radius10 km, centred on the highest point in prospect (around 1000 m.a.s.l.).The only hot spring area of note is at Limea, on the southern edge ofthe promontory. Here acidic water with a maximum recordedtemperature of 86oC seeps through dacitic tuff breccia on the beach.The prospect appears to have its heat source beneath the Doro Purecone with small outflows to the west and south.Resource potential estimated by stored heat method applying MonteCarlo analysis is 115-290 MW.
1 2 3 4 5 6 7 8 9 10 11 12 19 2013 14 15 16
Table 7.1.9-1 Development Plan Sheet for New Working Area (No.53 HU'U DAHA)
ACTIVITY
17 18

Power Plant Capacity: 10MW (5MWx2unit)Plant System: Condencing or Back-pressureExplor.+Production Well: approx. 5 wellsReinjection Well: less than 3 wellsTransmission Line: 20kV, approx. 18kmConnection: Distribution Line in western Flores
Proposed Geothermal Development Schedule
1 2 3 4 1 2 3 4 1 2 3 4 1 2 3 4 1 2 3 4 1 2 3 4 1 2 3 4 1 2 3 4 1 2 3 4 1 2 3 4 1 2 3 4 1 2 3 4 1 2 3 4 1 2 3 4 1 2 3 4 1 2 3 4 1 2 3 4 1 2 3 4 1 2 3 4 1 2 3 4
Preliminary Survey Stage
Request for WKP from Local Gov.
Preliminary Survey (Surface Survey by Gevernment)
Tendering
Exploration Stage
Exploratory Well Test Study
Field Development
Exploratory Well Drilling
Well Testing
Reservoir Simulation
Resoure Assessment
Exploitation Stage
Environmental Impact Asssessment
Steam Field Development
Survey, Design, Field Development
Drilling & Testing
Geothermal Fluid Transportation System
Fabrication & Delivery, Construction/Installation
Power Plant
Design, Manufacturing, Delivery, Construction/Installation
Commissioning 10MW
(Transmission Line and Switchyard)
Design, Manufacturing, Delivery, Construction/Installation
Commissioning
Operation Stage 10MW
Field Evaluation
Rank of Development Priority
Power Output Potential Resource Potential
C
10 MW50 MW Restrictedby National Park 50 MW
Wai Sano is a 2.5 km diameter crater lake in the center of G. WaiSano. G. Wai Sano is an upper Quaternary andesitic volcano restingon the older Quaternary andesites of Pegunungan Geliran. Thethermal area is situated on the SE corner of the lake where threesprings are noted with temperatures up to 92oC. Silica sinter isreported. Possible reservoir area is defined based on low resistivityzone (Schlumberger <10 ohm-m (AB/2=1000m)). The low resistivityzone coincide with the volcanic crater (D. Sanongoang).Reservoir fluid contain significant magmatic water, possibly arisingfrom previous volcanic activity near G. Wai Sano. Main fluid flowpattern is from Wai Sano to north and northeast. Spring watergeothermometries suggest a reservoir temperature around 200-250oCor higher.Resource potential estimated by stored heat method applying MonteCarlo analysis is 50-105 MW.
Province/Location
East Nusa Tenggara,Western part of Flores IslandNo.54 WAI SANO Region Nussa Tenggara
Direct heat use for agricultural or marine product industry is recommendable.
Scope for Power Development CO2 EmmissionReduction
('000 tone/year)
Proposed Geothermal Development PlanOutline for Power DevelopmentThe possible development site in this field is located northeastern flank of G. WaiSano. The demand of electricity in western part of Flores Island is small, so a smallscale with multi-unit power plant development is recommendable. If sufficientsteam is obtained by steamfield development, the power system available forvariable load is disireble for power supply not only for base load but also peak load.
Possibile or Recommended Multi-purpose Geothermal Heat Use
61
ResourceCharacteristics
Restricted byPower Demand
Potential (Expected) Developer Private Company orCentral/Local Government
Natural/SocialEnvironmental
Condition
Southern part of possible geothermal reservoir area is within TW.Danau Sanau National Park (about 30% of the possible reservoirarea).
Power SectorSituation
Estimated D/L length from the field to the nearest existing line is about18 km. At present, electrification ratio in this area reachs only 22.5%.
1 2 3 4 5 6 7 8 9 10 11 12 19 2013 14 15 16
Table 7.1.9-1 Development Plan Sheet for New Working Area (No.54 WAI SANO)
ACTIVITY
17 18

Power Plant Capacity: 20MW (5MWx4unit)Plant System: Condencing or Back-pressureExplor.+Production Well: approx. 8 wellsReinjection Well: less than 4 wellsTransmission Line: 20kV, approx. 22kmConnection: Distribution Line in around Ende or planned 70kV T/L
Proposed Geothermal Development Schedule
1 2 3 4 1 2 3 4 1 2 3 4 1 2 3 4 1 2 3 4 1 2 3 4 1 2 3 4 1 2 3 4 1 2 3 4 1 2 3 4 1 2 3 4 1 2 3 4 1 2 3 4 1 2 3 4 1 2 3 4 1 2 3 4 1 2 3 4 1 2 3 4 1 2 3 4 1 2 3 4
Preliminary Survey Stage
Request for WKP from Local Gov.
Preliminary Survey (Surface Survey by Gevernment)
Tendering
Exploration Stage
Exploratory Well Test Study
Field Development
Exploratory Well Drilling
Well Testing
Reservoir Simulation
Resoure Assessment
Exploitation Stage
Environmental Impact Asssessment
Steam Field Development
Survey, Design, Field Development
Drilling & Testing
Geothermal Fluid Transportation System
Fabrication & Delivery, Construction/Installation
Power Plant
Design, Manufacturing, Delivery, Construction/Installation
Commissioning 10MW 10MW
(Transmission Line and Switchyard)
Design, Manufacturing, Delivery, Construction/Installation
Commissioning
Operation Stage 10MW 20MW
Restricted byPower Demand
Potential (Expected) Developer Private Company orCentral/Local Government
Natural/SocialEnvironmental
Condition
Northwestern part of possible geothermal reservoir area is within TN.Danau Kelimutu National Park (about 55% of the possible reservoirarea).
Power SectorSituation
Estimated D/L length from the field to the nearest existing line is about22 km. At present, electrification ratio in this area reachs only 22.5%.
Direct heat use for agricultural industry is recommendable.
Scope for Power Development CO2 EmmissionReduction
('000 tone/year)
Proposed Geothermal Development PlanOutline for Power DevelopmentThe possible development site in this field is located around Sokoria village. Thedemand of electricity in central part of Flores Island is small, so a small scale withmulti-unit power plant development is recommendable. If sufficient steam isobtained by steamfield development, the power system available for variable loadis disireble for power supply not only for base load but also peak load.For development in this field, the area of National Park should be taken intoconsideration.
Possibile or Recommended Multi-purpose Geothermal Heat Use
122
ResourceCharacteristics
Province/Location
East Nusa Tenggara,Central part of Flores IslandNo.57 SOKORIA - MUTUBUSA Region Nussa Tenggara
Field Evaluation
Rank of Development Priority
Power Output Potential Resource Potential
B
20 MW90 MW Restrictedby National Park 40 MW
Sokoria-Mutubusa geothermal prospect is located 30km north of Ende.Surface thermal manifestations in Mutubusa, north of Sokoria village,contain fumaroles, mud pools, hot springs and alterd ground. Several warmto hot springs occur around and south of Sokoria village. Possible reservoirarea is definedin by caldera structure, based on low resistivity zone(Schlumberger <5 ohm-m, MT/TDEM), surface manifestation and geologicstruture trending NNW-SSE.Hot springs in Sokoria may be derived from various kind of fluids includingshallow condensate, deep reservoir water and outflow containing magmaticfluid. Occurrence of fumaroles in Mutubasa suggests existence of anotherupflow center of hot fluid there besides the Keli Mutu system. Reservoirtemperature is estimated higher than 180oC at least, and possibly up to320oC from gas and Na/K geothermometries.Resource potential estimated by stored heat method applying Monte Carloanalysis is 90-235 MW.
1 2 3 4 5 6 7 8 9 10 11 12 19 2013 14 15 16
Table 7.1.9-1 Development Plan Sheet for New Working Area (No.57 SOKORIA - MUTUBUSA)
ACTIVITY
17 18

Power Plant Capacity: 20MW (5MWx4unit)Plant System: Condencing or Back-pressureExplor.+Production Well: approx. 10 wellsReinjection Well: less than 3 wellsTransmission Line: 20kV, approx. 11kmConnection: Distribution Line
Proposed Geothermal Development Schedule
1 2 3 4 1 2 3 4 1 2 3 4 1 2 3 4 1 2 3 4 1 2 3 4 1 2 3 4 1 2 3 4 1 2 3 4 1 2 3 4 1 2 3 4 1 2 3 4 1 2 3 4 1 2 3 4 1 2 3 4 1 2 3 4 1 2 3 4 1 2 3 4 1 2 3 4 1 2 3 4
Preliminary Survey Stage
Request for WKP from Local Gov.
Preliminary Survey (Surface Survey by Gevernment)
Tendering
Exploration Stage
Exploratory Well Test Study
Field Development
Exploratory Well Drilling
Well Testing
Reservoir Simulation
Resoure Assessment
Exploitation Stage
Environmental Impact Asssessment
Steam Field Development
Survey, Design, Field Development
Drilling & Testing
Geothermal Fluid Transportation System
Fabrication & Delivery, Construction/Installation
Power Plant
Design, Manufacturing, Delivery, Construction/Installation
Commissioning 10MW 10MW
(Transmission Line and Switchyard)
Design, Manufacturing, Delivery, Construction/Installation
Commissioning
Operation Stage 10MW 20MW
Field Evaluation
Rank of Development Priority
Power Output Potential Resource Potential
C
20 MW90 MW Restrictedby National Park 90 MW
Geothermal system in this field occurs at western foot of Mt. IleMandiri. Surface thermal manifestations include fumaroles, hot springwith silica sinter. Possible reservoir area is defined based on lowresistivity zone (Schlumberger).Reservoir temperature is estimated possibly up to 250oC from Na/Kgeothermometry.Resource potential estimated by stored heat method applying MonteCarlo analysis is 90-230 MW.
Province/Location
East Nusa Tenggara,East end of Flores IslandNo.58 OKA - LARANTUKA Region Nussa Tenggara
Direct heat use for agricultural or marine product industry is recommendable.
Scope for Power Development CO2 EmmissionReduction
('000 tone/year)
Proposed Geothermal Development PlanOutline for Power DevelopmentThe possible development site in this field is located in southwestern foot of Mt. IleMandiri. The demand of electricity in eastern part of Flores Island is small, so asmall scale with multi-unit power plant development is recommendable. If sufficientsteam is obtained by steamfield development, the power system available forvariable load is disireble for power supply not only for base load but also peak load.
Possibile or Recommended Multi-purpose Geothermal Heat Use
122
ResourceCharacteristics
Restricted byPower Demand
Potential (Expected) Developer Private Company orCentral/Local Government
Natural/SocialEnvironmental
Condition
Possible geothermal reservoir area is not within any National Parks.But the central part of the area is within Protected Forest (about 35%of the possible reservoir area).
Power SectorSituation
Estimated D/L length from the field to the nearest existing line is about11 km. At present, electrification ratio in this area reachs only 22.5%.
1 2 3 4 5 6 7 8 9 10 11 12 19 2013 14 15 16
Table 7.1.9-1 Development Plan Sheet for New Working Area (No.58 OKA - LARANTUKA)
ACTIVITY
17 18

Power Plant Capacity: 10MW (5MWx2unit or samller units)Plant System: Condencing or Back-pressureExplor.+Production Well: approx. 6 wellsReinjection Well: less than 2 wellsTransmission Line: 20kV, approx. 13kmConnection: Distribution Line
Proposed Geothermal Development Schedule
1 2 3 4 1 2 3 4 1 2 3 4 1 2 3 4 1 2 3 4 1 2 3 4 1 2 3 4 1 2 3 4 1 2 3 4 1 2 3 4 1 2 3 4 1 2 3 4 1 2 3 4 1 2 3 4 1 2 3 4 1 2 3 4 1 2 3 4 1 2 3 4 1 2 3 4 1 2 3 4
Preliminary Survey Stage
Request for WKP from Local Gov.
Preliminary Survey (Surface Survey by Gevernment)
Tendering
Exploration Stage
Exploratory Well Test Study
Field Development
Exploratory Well Drilling
Well Testing
Reservoir Simulation
Resoure Assessment
Exploitation Stage
Environmental Impact Asssessment
Steam Field Development
Survey, Design, Field Development
Drilling & Testing
Geothermal Fluid Transportation System
Fabrication & Delivery, Construction/Installation
Power Plant
Design, Manufacturing, Delivery, Construction/Installation
Commissioning 10MW
(Transmission Line and Switchyard)
Design, Manufacturing, Delivery, Construction/Installation
Commissioning
Operation Stage 10MW
Restricted byPower Demand
Potential (Expected) Developer Private Company orCentral/Local Government
Natural/SocialEnvironmental
Condition
Possible geothermal reservoir area is not within any National Parksnor Protected Forests.
Power SectorSituation
Estimated D/L length from the field to the nearest existing line is about13 km. At present, electrification ratio in this area reachs only 22.5%.
Direct heat use for agricultural or marine product industry is recommendable.
Scope for Power Development CO2 EmmissionReduction
('000 tone/year)
Proposed Geothermal Development PlanOutline for Power DevelopmentThe possible development site in this field is located in northwest of Werungvolcano. The demand of electricity in Lembata Island is small, so a small scale withmulti-unit power plant development is recommendable. If sufficient steam isobtained by steamfield development, the power system available for variable loadis disireble for power supply not only for base load but also peak load.
Possibile or Recommended Multi-purpose Geothermal Heat Use
61
ResourceCharacteristics
Province/Location
East Nusa Tenggara,South of Lembata IslandNo.60 ATADEI Region Nussa Tenggara
Field Evaluation
Rank of Development Priority
Power Output Potential Resource Potential
C
10 MW50 MW Restrictedby National Park 50 MW
The Atadei field is located in northwest of Werung volcano. Surfacethermal manifestations include steaming ground, hot spring andaltered ground. Major structures contain N-E of volcanic lineament,NE-SW trending normal faults, Watu Kuba caldera and Atalojo dome.Bougeur anomaly shows high anomaly around Watu Wawer caldera. Itis presumably indicates a caldera structure. Possible reservoir area isdefined based on low resistivity zone (Schlumberger and MT), surfacemanifestatios and local structures.Reservoir temperature is estimated higher than 175oC at least fromgas geothermometry.Resource potential estimated by stored heat method applying MonteCarlo analysis is 55-140 MW.
1 2 3 4 5 6 7 8 9 10 11 12 19 2013 14 15 16
Table 7.1.9-1 Development Plan Sheet for New Working Area (No.60 ATADEI)
ACTIVITY
17 18

Power Plant Capacity: 55MW (10MW+20MW+25MW)Plant System: CondencingExplor.+Production Well: approx. 20 wellsReinjection Well: less than 6 wellsTransmission Line: 70kV, approx. 24kmConnection: Direct connection to Gorontalo S/S
Proposed Geothermal Development Schedule
1 2 3 4 1 2 3 4 1 2 3 4 1 2 3 4 1 2 3 4 1 2 3 4 1 2 3 4 1 2 3 4 1 2 3 4 1 2 3 4 1 2 3 4 1 2 3 4 1 2 3 4 1 2 3 4 1 2 3 4 1 2 3 4 1 2 3 4 1 2 3 4 1 2 3 4 1 2 3 4
Preliminary Survey Stage
Request for WKP from Local Gov.
Preliminary Survey (Surface Survey by Gevernment)
Tendering
Exploration Stage
Exploratory Well Test Study
Field Development
Exploratory Well Drilling
Well Testing
Reservoir Simulation
Resoure Assessment
Exploitation Stage
Environmental Impact Asssessment
Steam Field Development
Survey, Design, Field Development
Drilling & Testing
Geothermal Fluid Transportation System
Fabrication & Delivery, Construction/Installation
Power Plant
Design, Manufacturing, Delivery, Construction/Installation
Commissioning 10MW 20MW 25MW
(Transmission Line and Switchyard)
Design, Manufacturing, Delivery, Construction/Installation
Commissioning
Operation Stage 10MW 30MW 55MW
Restricted byPower Demand
Potential (Expected) Developer Private Company
Natural/SocialEnvironmental
Condition
Possible geothermal reservoir area is not within any National Parks.But the eastern and southwestern part of the area is within ProtectedForest (about 20% of the possible reservoir area).
Power SectorSituation
Estimated T/L length from the field to Gorontalo S/S is about 24 km.Direct connection with 70kV is recommendable. Electrification ratio inthis area reachs only 47.1%.
Direct heat use for agricultural or marine product industry is recommendable.
Scope for Power Development CO2 EmmissionReduction
('000 tone/year)
Proposed Geothermal Development PlanOutline for Power DevelopmentThe most possible development site in this field is located in the east of Gorontalocity. The demand of electricity in Minahasa system including Gorontalo province islarge, but in Minahasa system development of Lahendong (including Tompaso)and Kotamobagu may have higher priority considering the resource potential andrisk.
Possibile or Recommended Multi-purpose Geothermal Heat Use
335
ResourceCharacteristics
Province/Location Gorontalo, East of Gorontalo CityNo.73 SUWAWA-GORONTALO Region Sulawesi
Field Evaluation
Rank of Development Priority
Power Output Potential Resource Potential
C
55 MW130 MW Restrictedby National Park 130 MW
This field is situated aroung 10 km ENE of the captial city of GorontaloProvince and is depressed with 3-5 km width between WNW trendingfault to the south and NW trending fault. Several NNW oriented faultsare oblique to the graben.Warm springs are located along the faults forming the depressionstructure. Possible reservoir area is defined at the graben limited NW-SE trending fautlts at the north and E-W trending faults at the southbased on the Schlumberger <50 ohm-m (AB/2=1000m), surfacemanifestation and geologic struture.Reservoir temperature is estimated 130oC at least, but highertemperature would be expected.Resource potential estimated by stored heat method applying MonteCarlo analysis is 130-325 MW.
1 2 3 4 5 6 7 8 9 10 11 12 19 2013 14 15 16
Table 7.1.9-1 Development Plan Sheet for New Working Area (No.73 SUWAWA-GORONTALO)
ACTIVITY
17 18

Power Plant Capacity: 200MW (40MWx2unit+60MWx2unit)Plant System: CondencingExplor.+Production Well: approx. 70 wellsReinjection Well: less than 20 wellsTransmission Line: 70kV, approx. 40kmConnection: Direct connection to Palu S/S
Proposed Geothermal Development Schedule
1 2 3 4 1 2 3 4 1 2 3 4 1 2 3 4 1 2 3 4 1 2 3 4 1 2 3 4 1 2 3 4 1 2 3 4 1 2 3 4 1 2 3 4 1 2 3 4 1 2 3 4 1 2 3 4 1 2 3 4 1 2 3 4 1 2 3 4 1 2 3 4 1 2 3 4 1 2 3 4
Preliminary Survey Stage
Request for WKP from Local Gov.
Preliminary Survey (Surface Survey by Gevernment)
Tendering
Exploration Stage
Exploratory Well Test Study
Field Development
Exploratory Well Drilling
Well Testing
Reservoir Simulation
Resoure Assessment
Exploitation Stage
Environmental Impact Asssessment
Steam Field Development
Survey, Design, Field Development
Drilling & Testing
Geothermal Fluid Transportation System
Fabrication & Delivery, Construction/Installation
Power Plant
Design, Manufacturing, Delivery, Construction/Installation
Commissioning 40MW 40MW 60MW 60MW
(Transmission Line and Switchyard)
Design, Manufacturing, Delivery, Construction/Installation
Commissioning
Operation Stage 40MW 80MW 140MW 200MW
Field Evaluation
Rank of Development Priority
Power Output Potential Resource Potential
C
200 MW200 MW Restrictedby National Park 200 MW
The Merana field is located in coast area near Merana village. Surfacethermal manifestations are several warm to hot springs. Majorstructures are NE-SW trending faults.Reservoir temperature is estimated 220oC or higher from Na/Kgeothermometry.Resource potential estimated by stored heat method applying MonteCarlo analysis is 240-600 MW.
Province/Location Central Sulawesi, Southeastern foot of G. RataiNo.65 MERANA Region Sulawesi
Direct heat use for agricultural or marine product industry is recommendable.
Scope for Power Development CO2 EmmissionReduction
('000 tone/year)
Proposed Geothermal Development PlanOutline for Power DevelopmentThe most possible development site in this field is located near the hot springareas around Merana village. The demand of electricity in central part of Sulawesiis large, so a large scale power plant development as far as resource available isrecommendable.
Possibile or Recommended Multi-purpose Geothermal Heat Use
1,220
ResourceCharacteristics
Restricted byPower Demand
Potential (Expected) Developer Private Company
Natural/SocialEnvironmental
Condition
Possible geothermal reservoir area is not within any National Parksnor Protected Forests.
Power SectorSituation
Estimated T/L length from the field to Palu S/S is about 40 km. Directconnection with 70kV is recommendable. Electrification ratio in thisarea reachs only 47.1%.
1 2 3 4 5 6 7 8 9 10 11 12 19 2013 14 15 16
Table 7.1.9-1 Development Plan Sheet for New Working Area (No.65 MERANA)
ACTIVITY
17 18

Power Plant Capacity: 20MW (5MWx4unit)Plant System: Condencing or Back-pressureExplor.+Production Well: approx. 10 wellsReinjection Well: less than 3 wellsTransmission Line: 20kV, approx. 13kmConnection: Distribution Line
Proposed Geothermal Development Schedule
1 2 3 4 1 2 3 4 1 2 3 4 1 2 3 4 1 2 3 4 1 2 3 4 1 2 3 4 1 2 3 4 1 2 3 4 1 2 3 4 1 2 3 4 1 2 3 4 1 2 3 4 1 2 3 4 1 2 3 4 1 2 3 4 1 2 3 4 1 2 3 4 1 2 3 4 1 2 3 4
Preliminary Survey Stage
Request for WKP from Local Gov.
Preliminary Survey (Surface Survey by Gevernment)
Tendering
Exploration Stage
Exploratory Well Test Study
Field Development
Exploratory Well Drilling
Well Testing
Reservoir Simulation
Resoure Assessment
Exploitation Stage
Environmental Impact Asssessment
Steam Field Development
Survey, Design, Field Development
Drilling & Testing
Geothermal Fluid Transportation System
Fabrication & Delivery, Construction/Installation
Power Plant
Design, Manufacturing, Delivery, Construction/Installation
Commissioning 20MW
(Transmission Line and Switchyard)
Design, Manufacturing, Delivery, Construction/Installation
Commissioning
Operation Stage 20MW
Restricted byPower Demand
Potential (Expected) Developer Private Company orCentral/Local Government
Natural/SocialEnvironmental
Condition
Possible geothermal reservoir area is not within any National Parks.But the western part of the area is within Protected Forest (about 70%of the possible reservoir area).
Power SectorSituation
Estimated D/L length from the field to the nearest existing line is about13 km. At present, electrification ratio in this area reachs only 50.6%.
Direct heat use for agricultural or marine product industry is recommendable.
Scope for Power Development CO2 EmmissionReduction
('000 tone/year)
Proposed Geothermal Development PlanOutline for Power DevelopmentThe possible development site in this field is located in the west of Tulehu village.The demand of electricity in Ambon Island is small, so a small scale with multi-unitpower plant development is recommendable. If sufficient steam is obtained bysteamfield development, the power system available for variable load is disireblefor power supply not only for base load but also peak load.
Possibile or Recommended Multi-purpose Geothermal Heat Use
122
ResourceCharacteristics
Province/Location Maluku, Eastern end of Ambon IslandNo.69 TULEHU Region Maluku
Field Evaluation
Rank of Development Priority
Power Output Potential Resource Potential
C
20 MW40 MW Restrictedby National Park 40 MW
The Tulehu field is located in the west of Tulehu village. Surfacethermal manifestations are several warm to hot springs. Majorstructures are NE-SW trending faults. Possible reservoir area isdefined based on the low resistivity zone, surface manifestation,geologic struture and geochemistry.Reservoir fluid originates in meteoric water and seawater. Reservoirtemperature is estimated around 230oC or higher.Resource potential estimated by stored heat method applying MonteCarlo analysis is 15-40 MW.
1 2 3 4 5 6 7 8 9 10 11 12 19 2013 14 15 16
Table 7.1.9-1 Development Plan Sheet for New Working Area (No.69 TULEHU)
ACTIVITY
17 18

Power Plant Capacity: 20MW (5MWx4unit)Plant System: Condencing or Back-pressureExplor.+Production Well: approx. 10 wellsReinjection Well: less than 3 wellsTransmission Line: 20kV, approx. 16kmConnection: Distribution Line
Proposed Geothermal Development Schedule
1 2 3 4 1 2 3 4 1 2 3 4 1 2 3 4 1 2 3 4 1 2 3 4 1 2 3 4 1 2 3 4 1 2 3 4 1 2 3 4 1 2 3 4 1 2 3 4 1 2 3 4 1 2 3 4 1 2 3 4 1 2 3 4 1 2 3 4 1 2 3 4 1 2 3 4 1 2 3 4
Preliminary Survey Stage
Request for WKP from Local Gov.
Preliminary Survey (Surface Survey by Gevernment)
Tendering
Exploration Stage
Exploratory Well Test Study
Field Development
Exploratory Well Drilling
Well Testing
Reservoir Simulation
Resoure Assessment
Exploitation Stage
Environmental Impact Asssessment
Steam Field Development
Survey, Design, Field Development
Drilling & Testing
Geothermal Fluid Transportation System
Fabrication & Delivery, Construction/Installation
Power Plant
Design, Manufacturing, Delivery, Construction/Installation
Commissioning 20MW
(Transmission Line and Switchyard)
Design, Manufacturing, Delivery, Construction/Installation
Commissioning
Operation Stage 20MW
Field Evaluation
Rank of Development Priority
Power Output Potential Resource Potential
C
20 MW40 MW Restrictedby National Park 40 MW
Thermal features of this field occur mainly around the flanks of G.Jailolo which forms a small peninsula on the west coast of CentralHalmahera Island. Early Quaternary eruptive centres are situated atG.Toada and to the SW of G.Jailolo in the Teluk Bobo-Kailupa area.Major manifestations in this field are steaming ground and warm to hotsprings. It is considered that the eastern part of the field around KawahIdamdehe is the most promising for obtaining a geothermal resource.Reservoir temperature is estimated higher than 190oC from cationgeothermometry.Resource potential estimated by stored heat method applying MonteCarlo analysis is 220-500 MW as Hypothetical resource.
Province/Location
North Maluku,Central part of Halmahera IslandNo.70 JAILOLO Region Maluku
Direct heat use for agricultural or marine product industry is recommendable.
Scope for Power Development CO2 EmmissionReduction
('000 tone/year)
Proposed Geothermal Development PlanOutline for Power DevelopmentThe possible development site in this field is located around Kawah Idamdehe. Thedemand of electricity in Halmahera Island is small, so a small scale with multi-unitpower plant development is recommendable. If sufficient steam is obtained bysteamfield development, the power system available for variable load is disireblefor power supply not only for base load but also peak load.
Possibile or Recommended Multi-purpose Geothermal Heat Use
122
ResourceCharacteristics
Restricted byPower Demand
Potential (Expected) Developer Private Company orCentral/Local Government
Natural/SocialEnvironmental
Condition
Possible geothermal reservoir area is not within any National Parksnor Protected Forests.
Power SectorSituation
Estimated D/L length from the field to the nearest existing line is about16 km. At present, electrification ratio in this area reachs only 50.6%.
1 2 3 4 5 6 7 8 9 10 11 12 19 2013 14 15 16
Table 7.1.9-1 Development Plan Sheet for New Working Area (No.70 JAILOLO)
ACTIVITY
17 18

Planned and Proposed Geothermal Development Schedule
1 2 3 4 1 2 3 4 1 2 3 4 1 2 3 4 1 2 3 4 1 2 3 4 1 2 3 4 1 2 3 4 1 2 3 4 1 2 3 4 1 2 3 4 1 2 3 4 1 2 3 4 1 2 3 4 1 2 3 4 1 2 3 4 1 2 3 4 1 2 3 4 1 2 3 4 1 2 3 4
Exploitation Stage
Environmental Impact Asssessment
Steam Field Development
Survey, Design, Field Development
Drilling & Testing
Geothermal Fluid Transportation System
Fabrication & Delivery, Construction/Installation
Power Plant
Design, Manufacturing, Delivery, Construction/Installation
Commissioning 8MW 30MW
(Transmission Line and Switchyard)
Design, Manufacturing, Delivery, Construction/Installation
Commissioning
Operation Stage 8MW 38MW
Rank of Development Priority
Power Output Potential Resource Potential
A
160 MW Restricted byPower Demand
Province/Location North Sumatra, Around Mt. PratektekanNo.7 LAU DEBUK-DEBUK / SIBAYAK Region Sumatra
Field Information and Evaluation
40 MWRestrictedby National Park 40 MW
Developer PERTAMINA - PT Priamanaya
Installed and planning Capacity Installed Capacity 30 MW2 MW Existing Plan8 MW
(10 MW replace)Possible
Additional Plan
1 2 3 4 5 6 7 8 9 10 11 12 19 2013 14 15 16
Table 7.1.9-2 Development Plan Sheet for Existing Project Field (No.7 LAU DEBUK-DEBUK / SIBAYAK)
ACTIVITY
17 18

Planned and Proposed Geothermal Development Schedule
1 2 3 4 1 2 3 4 1 2 3 4 1 2 3 4 1 2 3 4 1 2 3 4 1 2 3 4 1 2 3 4 1 2 3 4 1 2 3 4 1 2 3 4 1 2 3 4 1 2 3 4 1 2 3 4 1 2 3 4 1 2 3 4 1 2 3 4 1 2 3 4 1 2 3 4 1 2 3 4
Exploitation Stage
Environmental Impact Asssessment
Steam Field Development
Survey, Design, Field Development
Drilling & Testing
Geothermal Fluid Transportation System
Fabrication & Delivery, Construction/Installation
Power Plant
Design, Manufacturing, Delivery, Construction/Installation
Commissioning 110MW 110MW 110MW
(Transmission Line and Switchyard)
Design, Manufacturing, Delivery, Construction/Installation Sarula Sibual Buali
Commissioning 300MW
Operation Stage 300MW 410MW 520MW 630MW
ACTIVITY
17 18 19 2013 14 15 169 10 11 125 6 7 81 2 3 4
Developer (PLN) Medco-Ormat-Itochu- PERTAMINA
Installed and planning Capacity Installed Capacity 330 MW0 MW Existing Plan 300 MW PossibleAdditional Plan
Restricted byPower Demand
Province/Location North SumatraNo.8 SARULA, No.9 SIBUAL BUALI Region Sumatra
Table 7.1.9-2 Development Plan Sheet for Existing Project Field (No.8 SARULA, No.9 SIBUAL BUALI)
Field Information and Evaluation
Rank of Development Priority
Power Output Potential Resource Potential
A
630 MW660 MW Restrictedby National Park 630 MW

Planned and Proposed Geothermal Development Schedule
1 2 3 4 1 2 3 4 1 2 3 4 1 2 3 4 1 2 3 4 1 2 3 4 1 2 3 4 1 2 3 4 1 2 3 4 1 2 3 4 1 2 3 4 1 2 3 4 1 2 3 4 1 2 3 4 1 2 3 4 1 2 3 4 1 2 3 4 1 2 3 4 1 2 3 4 1 2 3 4
Exploitation Stage
Environmental Impact Asssessment
Steam Field Development
Survey, Design, Field Development
Drilling & Testing
Geothermal Fluid Transportation System
Fabrication & Delivery, Construction/Installation
Power Plant
Design, Manufacturing, Delivery, Construction/Installation
Commissioning 110MW 110MW 80MW
(Transmission Line and Switchyard)
Design, Manufacturing, Delivery, Construction/Installation
Commissioning 55MW
Operation Stage 55MW 165MW 275MW 355MW
Field Information and Evaluation
Rank of Development Priority
Power Output Potential Resource Potential
A
355 MW355 MW Restrictedby National Park 355 MW Restricted by
Power Demand
Province/Location Jambi, Around Sumurup villageNo.17 SUNGAI PENUH Region Sumatra
Developer PERTAMINA
Installed and planning Capacity Installed Capacity 300 MW0 MW Existing Plan 55 MW PossibleAdditional Plan
1 2 3 4 5 6 7 8 9 10 11 12 19 2013 14 15 16
Table 7.1.9-2 Development Plan Sheet for Existing Project Field (No.17 SUNGAI PENUH)
ACTIVITY
17 18

Planned and Proposed Geothermal Development Schedule
No.21 B. GEDUNG HULU LAIS1 2 3 4 1 2 3 4 1 2 3 4 1 2 3 4 1 2 3 4 1 2 3 4 1 2 3 4 1 2 3 4 1 2 3 4 1 2 3 4 1 2 3 4 1 2 3 4 1 2 3 4 1 2 3 4 1 2 3 4 1 2 3 4 1 2 3 4 1 2 3 4 1 2 3 4 1 2 3 4
Exploitation Stage
Environmental Impact Asssessment
Steam Field Development
Survey, Design, Field Development
Drilling & Testing for 2 units for 2 units
Geothermal Fluid Transportation System
Fabrication & Delivery, Construction/Installation for 2 units for 2 units
Power Plant
Design, Manufacturing, Delivery, Construction/Installation for 2 units for 2 units
Commissioning 110MW×2 110MW×2 60MW
(Transmission Line and Switchyard)
Design, Manufacturing, Delivery, Construction/Installation
Commissioning 110MW
Operation Stage 110MW 330MW 610MW
No.22 TAMBANG SAWAH1 2 3 4 1 2 3 4 1 2 3 4 1 2 3 4 1 2 3 4 1 2 3 4 1 2 3 4 1 2 3 4 1 2 3 4 1 2 3 4 1 2 3 4 1 2 3 4 1 2 3 4 1 2 3 4 1 2 3 4 1 2 3 4 1 2 3 4 1 2 3 4 1 2 3 4 1 2 3 4
Exploitation Stage
Environmental Impact Asssessment
Steam Field Development
Survey, Design, Field Development
Drilling & Testing for 2 units
Geothermal Fluid Transportation System
Fabrication & Delivery, Construction/Installation for 2 units
Power Plant
Design, Manufacturing, Delivery, Construction/Installation for 2 units
Commissioning 110MW×2 80MW
(Transmission Line and Switchyard)
Design, Manufacturing, Delivery, Construction/Installation
Commissioning
Operation Stage 220MW 300MW
Developer PERTAMINA
Installed and planning Capacity Installed Capacity 800 MW0 MW Existing Plan110 MW
(in Hululais)Possible
Additional Plan
Province/Location
Bengkulu,Northern flank and foot of G. Hululais
No.21 B. GEDUNG HULU LAIS,No.22 TAMBANG SAWAH Region Sumatra
Field Information and Evaluation
Rank of Development Priority
Power Output Potential Resource Potential
A
910 MW910 MW Restrictedby National Park 910 MW Restricted by
Power Demand
1 2 3 4 5 6 7 8 9 10 11 12 13 14 15 16 17 18 19 20
ACTIVITY
3 4 51 1410 11 12 136 7
ACTIVITY
Table 7.1.9-2 Development Plan Sheet for Existing Project Field (No.21 B. GEDUNG HULU LAIS, No.22 TAMBANG SAWAH)
18 19 2015 16 178 92

Planned and Proposed Geothermal Development Schedule
1 2 3 4 1 2 3 4 1 2 3 4 1 2 3 4 1 2 3 4 1 2 3 4 1 2 3 4 1 2 3 4 1 2 3 4 1 2 3 4 1 2 3 4 1 2 3 4 1 2 3 4 1 2 3 4 1 2 3 4 1 2 3 4 1 2 3 4 1 2 3 4 1 2 3 4 1 2 3 4
Exploitation Stage
Environmental Impact Asssessment
Steam Field Development
Survey, Design, Field Development
Drilling & Testing for 2 units
Geothermal Fluid Transportation System
Fabrication & Delivery, Construction/Installation for 2 units
Power Plant
Design, Manufacturing, Delivery, Construction/Installation for 2 units
Commissioning 110MW 110MW 110MW×1
(Transmission Line and Switchyard) 70 MW×1
Design, Manufacturing, Delivery, Construction/Installation
Commissioning 110MW 110MW
Operation Stage 110MW 220MW 330MW 440MW 550MW
ACTIVITY
17 18 19 2013 14 15 169 10 11 125 6 7 81 2 3 4
Developer PERTAMINA
Installed and planning Capacity Installed Capacity 400 MW0 MW Existing Plan 220 MW PossibleAdditional Plan
Restricted byPower Demand
Province/Location
South Sumatra,Around G. Lumut and G. BalaiNo.25 LUMUT BALAI Region Sumatra
Table 7.1.9-2 Development Plan Sheet for Existing Project Field (No.25 LUMUT BALAI)
Field Information and Evaluation
Rank of Development Priority
Power Output Potential Resource Potential
A
620 MW620 MW Restrictedby National Park 620 MW

Planned and Proposed Geothermal Development Schedule
1 2 3 4 1 2 3 4 1 2 3 4 1 2 3 4 1 2 3 4 1 2 3 4 1 2 3 4 1 2 3 4 1 2 3 4 1 2 3 4 1 2 3 4 1 2 3 4 1 2 3 4 1 2 3 4 1 2 3 4 1 2 3 4 1 2 3 4 1 2 3 4 1 2 3 4 1 2 3 4
Exploitation Stage
Environmental Impact Asssessment
Steam Field Development
Survey, Design, Field Development
Drilling & Testing
Geothermal Fluid Transportation System
Fabrication & Delivery, Construction/Installation
Power Plant
Design, Manufacturing, Delivery, Construction/Installation
Commissioning 110MW 110MW
(Transmission Line and Switchyard)
Design, Manufacturing, Delivery, Construction/Installation
Commissioning 110MW 110MW
Operation Stage 110MW 220MW 330MW 440MW
Field Information and Evaluation
Rank of Development Priority
Power Output Potential Resource Potential
A
440 MW440 MW Restrictedby National Park 440 MW Restricted by
Power Demand
Province/Location
Lampung,Around Mt. Duduk and Mt. KukusanNo.27 ULUBELU Region Sumatra
Developer PERTAMINA
Installed and planning Capacity Installed Capacity 220 MW0 MW Existing Plan 220 MW PossibleAdditional Plan
1 2 3 4 5 6 7 8 9 10 11 12 19 2013 14 15 16
Table 7.1.9-2 Development Plan Sheet for Existing Project Field (No.27 ULUBELU)
ACTIVITY
17 18

Planned and Proposed Geothermal Development Schedule
1 2 3 4 1 2 3 4 1 2 3 4 1 2 3 4 1 2 3 4 1 2 3 4 1 2 3 4 1 2 3 4 1 2 3 4 1 2 3 4 1 2 3 4 1 2 3 4 1 2 3 4 1 2 3 4 1 2 3 4 1 2 3 4 1 2 3 4 1 2 3 4 1 2 3 4 1 2 3 4
Exploitation Stage
Environmental Impact Asssessment
Steam Field Development
Survey, Design, Field Development
Drilling & Testing
Geothermal Fluid Transportation System
Fabrication & Delivery, Construction/Installation
Power Plant
Design, Manufacturing, Delivery, Construction/Installation
Commissioning 60MW
(Transmission Line and Switchyard)
Design, Manufacturing, Delivery, Construction/Installation
Commissioning 60MW 60MW
Operation Stage 60MW 120MW 180MW
ACTIVITY
17 18 19 2013 14 15 169 10 11 125 6 7 81 2 3 4
Developer PERTAMINA
Installed and planning Capacity Installed Capacity 60 MW140 MW Existing Plan 120 MW PossibleAdditional Plan
Restricted byPower Demand
Province/Location West Java, Around Kawah KamojangNo.32 KAMOJANG Region Java-Bali
Table 7.1.9-2 Development Plan Sheet for Existing Project Field (No.32 KAMOJANG)
Field Information and Evaluation
Rank of Development Priority
Power Output Potential Resource Potential
A
320 MW320 MW Restrictedby National Park 320 MW

Planned and Proposed Geothermal Development Schedule
1 2 3 4 1 2 3 4 1 2 3 4 1 2 3 4 1 2 3 4 1 2 3 4 1 2 3 4 1 2 3 4 1 2 3 4 1 2 3 4 1 2 3 4 1 2 3 4 1 2 3 4 1 2 3 4 1 2 3 4 1 2 3 4 1 2 3 4 1 2 3 4 1 2 3 4 1 2 3 4
Exploitation Stage
Environmental Impact Asssessment
Steam Field Development
Survey, Design, Field Development
Drilling & Testing
Geothermal Fluid Transportation System
Fabrication & Delivery, Construction/Installation
Power Plant
Design, Manufacturing, Delivery, Construction/Installation
Commissioning 60MW 60MW
(Transmission Line and Switchyard)
Design, Manufacturing, Delivery, Construction/Installation
Commissioning
Operation Stage 60MW 120MW
Field Information and Evaluation
Rank of Development Priority
Power Output Potential Resource Potential
A
500 MW500 MW Restrictedby National Park 500 MW Restricted by
Power Demand
Province/Location West Java, Around AwibengkokNo.33 G. SALAK Region Java-Bali
Developer Unocal - PERTAMINA
Installed and planning Capacity Installed Capacity 120 MW380 MW Existing Plan 0 MW PossibleAdditional Plan
1 2 3 4 5 6 7 8 9 10 11 12 19 2013 14 15 16
Table 7.1.9-2 Development Plan Sheet for Existing Project Field (No.33 G. SALAK)
ACTIVITY
17 18

Planned and Proposed Geothermal Development Schedule
1 2 3 4 1 2 3 4 1 2 3 4 1 2 3 4 1 2 3 4 1 2 3 4 1 2 3 4 1 2 3 4 1 2 3 4 1 2 3 4 1 2 3 4 1 2 3 4 1 2 3 4 1 2 3 4 1 2 3 4 1 2 3 4 1 2 3 4 1 2 3 4 1 2 3 4 1 2 3 4
Exploitation Stage
Environmental Impact Asssessment
Steam Field Development
Survey, Design, Field Development
Drilling & Testing
Geothermal Fluid Transportation System
Fabrication & Delivery, Construction/Installation
Power Plant
Design, Manufacturing, Delivery, Construction/Installation
Commissioning 75MW
(Transmission Line and Switchyard)
Design, Manufacturing, Delivery, Construction/Installation
Commissioning 110MW
Operation Stage 110MW 185MW
ACTIVITY
17 18 19 2013 14 15 169 10 11 125 6 7 81 2 3 4
Developer Amoseas - PERTAMINA
Installed and planning Capacity Installed Capacity 75 MW145 MW Existing Plan 110 MW PossibleAdditional Plan
Restricted byPower Demand
Province/Location West Java, Around G. GagakNo.34 DARAJAT Region Java-Bali
Table 7.1.9-2 Development Plan Sheet for Existing Project Field (No.34 DARAJAT)
Field Information and Evaluation
Rank of Development Priority
Power Output Potential Resource Potential
A
330 MW330 MW Restrictedby National Park 330 MW

Planned and Proposed Geothermal Development Schedule
1 2 3 4 1 2 3 4 1 2 3 4 1 2 3 4 1 2 3 4 1 2 3 4 1 2 3 4 1 2 3 4 1 2 3 4 1 2 3 4 1 2 3 4 1 2 3 4 1 2 3 4 1 2 3 4 1 2 3 4 1 2 3 4 1 2 3 4 1 2 3 4 1 2 3 4 1 2 3 4
Exploitation Stage
Environmental Impact Asssessment
Steam Field Development
Survey, Design, Field Development for 2 units
Drilling & Testing for 2 units
Geothermal Fluid Transportation System
Fabrication & Delivery, Construction/Installation for 2 units
Power Plant
Design, Manufacturing, Delivery, Construction/Installation for 2 unuts
Commissioning 110MW 110MW
(Transmission Line and Switchyard) 110MWx1
Design, Manufacturing, Delivery, Construction/Installation 50MWx1
Commissioning 60MW 60MW
Operation Stage 60MW 120MW 170MW 280MW 500MW
Field Information and Evaluation
Rank of Development Priority
Power Output Potential Resource Potential
A
500 MW500 MW Restrictedby National Park 500 MW Restricted by
Power Demand
Province/Location West Java, Around G. PatuhaNo.36 G. PATUHA Region Java-Bali
Developer Geo Dipa Energy
Installed and planning Capacity Installed Capacity 380 MW0 MW Existing Plan 120 MW PossibleAdditional Plan
1 2 3 4 5 6 7 8 9 10 11 12 19 2013 14 15 16
Table 7.1.9-2 Development Plan Sheet for Existing Project Field (No.36 G. PATUHA)
ACTIVITY
17 18

Planned and Proposed Geothermal Development Schedule
1 2 3 4 1 2 3 4 1 2 3 4 1 2 3 4 1 2 3 4 1 2 3 4 1 2 3 4 1 2 3 4 1 2 3 4 1 2 3 4 1 2 3 4 1 2 3 4 1 2 3 4 1 2 3 4 1 2 3 4 1 2 3 4 1 2 3 4 1 2 3 4 1 2 3 4 1 2 3 4
Exploitation Stage
Environmental Impact Asssessment
Steam Field Development
Survey, Design, Field Development
Drilling & Testing
Geothermal Fluid Transportation System
Fabrication & Delivery, Construction/Installation
Power Plant
Design, Manufacturing, Delivery, Construction/Installation
Commissioning 110MW 70MW
(Transmission Line and Switchyard)
Design, Manufacturing, Delivery, Construction/Installation
Commissioning 110MW
Operation Stage 110MW 220MW 290MW
ACTIVITY
17 18 19 2013 14 15 169 10 11 125 6 7 81 2 3 4
Developer Magma Nusantara-Star EnergyPERTAMINA
Installed and planning Capacity Installed Capacity 180 MW110 MW Existing Plan 110 MW PossibleAdditional Plan
Restricted byPower Demand
Province/Location West JavaNo.37 G. WAYANG - WINDU Region Java-Bali
Table 7.1.9-2 Development Plan Sheet for Existing Project Field (No.37 G. WAYANG - WINDU)
Field Information and Evaluation
Rank of Development Priority
Power Output Potential Resource Potential
A
400 MW400 MW Restrictedby National Park 400 MW

Planned and Proposed Geothermal Development Schedule
No.38 G. KARAHA1 2 3 4 1 2 3 4 1 2 3 4 1 2 3 4 1 2 3 4 1 2 3 4 1 2 3 4 1 2 3 4 1 2 3 4 1 2 3 4 1 2 3 4 1 2 3 4 1 2 3 4 1 2 3 4 1 2 3 4 1 2 3 4 1 2 3 4 1 2 3 4 1 2 3 4 1 2 3 4
Exploitation Stage
Environmental Impact Asssessment
Steam Field Development
Survey, Design, Field Development
Drilling & Testing
Geothermal Fluid Transportation System
Fabrication & Delivery, Construction/Installation
Power Plant
Design, Manufacturing, Delivery, Construction/Installation
Commissioning 55MW 110MW 110MW
(Transmission Line and Switchyard)
Design, Manufacturing, Delivery, Construction/Installation
Commissioning
Operation Stage 30MW 85MW 195MW 305MW
No.39 G. TELAGABODAS1 2 3 4 1 2 3 4 1 2 3 4 1 2 3 4 1 2 3 4 1 2 3 4 1 2 3 4 1 2 3 4 1 2 3 4 1 2 3 4 1 2 3 4 1 2 3 4 1 2 3 4 1 2 3 4 1 2 3 4 1 2 3 4 1 2 3 4 1 2 3 4 1 2 3 4 1 2 3 4
Exploitation Stage
Environmental Impact Asssessment
Steam Field Development
Survey, Design, Field Development
Drilling & Testing
Geothermal Fluid Transportation System
Fabrication & Delivery, Construction/Installation
Power Plant
Design, Manufacturing, Delivery, Construction/Installation
Commissioning 55MW 40MW
(Transmission Line and Switchyard)
Design, Manufacturing, Delivery, Construction/Installation
Commissioning
Operation Stage 55MW 95MW
ACTIVITY
17 18 19 2013 14 15 169 10 11 125 6 7 81 2 3 4
Field Information and Evaluation
Rank of Development Priority
Power Output Potential Resource Potential
A
400 MW400 MW Restrictedby National Park 400 MW Restricted by
Power Demand
Province/Location
West Java,Around G. Karaha and G. Telagabodas
No.38 G. KARAHA,No.39 G. TELAGABODAS Region Java-Bali
Developer PERTAMINA
Installed and planning Capacity Installed Capacity 370 MW0 MW Existing Plan 30 MW PossibleAdditional Plan
1 2 3 4 5 6 7 8 9 10 11 12 19 2013 14 15 16
Table 7.1.9-2 Development Plan Sheet for Existing Project Field (No.38 G. KARAHA, No.39 G. TELAGABODAS)
ACTIVITY
17 18

Planned and Proposed Geothermal Development Schedule
1 2 3 4 1 2 3 4 1 2 3 4 1 2 3 4 1 2 3 4 1 2 3 4 1 2 3 4 1 2 3 4 1 2 3 4 1 2 3 4 1 2 3 4 1 2 3 4 1 2 3 4 1 2 3 4 1 2 3 4 1 2 3 4 1 2 3 4 1 2 3 4 1 2 3 4 1 2 3 4
Exploitation Stage
Environmental Impact Asssessment
Steam Field Development
Survey, Design, Field Development
Drilling & Testing
Geothermal Fluid Transportation System
Fabrication & Delivery, Construction/Installation
Power Plant
Design, Manufacturing, Delivery, Construction/Installation
Commissioning 110MW 110MW
(Transmission Line and Switchyard)
Design, Manufacturing, Delivery, Construction/Installation
Commissioning 60MW 60MW
Operation Stage 60MW 120MW 230MW 340MW
Field Information and Evaluation
Rank of Development Priority
Power Output Potential Resource Potential
A
400 MW400 MW Restrictedby National Park 400 MW Restricted by
Power Demand
Province/Location Central Java, Around G. PangomanNo.44 DIENG Region Java-Bali
Developer Geo Dipa Energy
Installed and planning Capacity Installed Capacity 220 MW60 MW Existing Plan 120 MW PossibleAdditional Plan
1 2 3 4 5 6 7 8 9 10 11 12 19 2013 14 15 16
Table 7.1.9-2 Development Plan Sheet for Existing Project Field (No.44 DIENG)
ACTIVITY
17 18

Planned and Proposed Geothermal Development Schedule
1 2 3 4 1 2 3 4 1 2 3 4 1 2 3 4 1 2 3 4 1 2 3 4 1 2 3 4 1 2 3 4 1 2 3 4 1 2 3 4 1 2 3 4 1 2 3 4 1 2 3 4 1 2 3 4 1 2 3 4 1 2 3 4 1 2 3 4 1 2 3 4 1 2 3 4 1 2 3 4
Exploitation Stage
Environmental Impact Asssessment
Steam Field Development
Survey, Design, Field Development
Drilling & Testing
Geothermal Fluid Transportation System
Fabrication & Delivery, Construction/Installation
Power Plant
Design, Manufacturing, Delivery, Construction/Installation
Commissioning 10MW 55MW 55MW 55MW
(Transmission Line and Switchyard)
Design, Manufacturing, Delivery, Construction/Installation
Commissioning
Operation Stage 10MW 65MW 120MW 175MW
ACTIVITY
17 18 19 2013 14 15 169 10 11 125 6 7 81 2 3 4
Developer Bali Energy - PERTAMINA
Installed and planning Capacity Installed Capacity 0 MW0 MW Existing Plan 175 MW PossibleAdditional Plan
Restricted byPower Demand
Province/Location Bali, Around G. Patak and G. PohenNo.52 BEDUGUL Region Java-Bali
Table 7.1.9-2 Development Plan Sheet for Existing Project Field (No.52 BEDUGUL)
Field Information and Evaluation
Rank of Development Priority
Power Output Potential Resource Potential
A
175 MW330 MW Restrictedby National Park 175 MW

Planned and Proposed Geothermal Development Schedule
1 2 3 4 1 2 3 4 1 2 3 4 1 2 3 4 1 2 3 4 1 2 3 4 1 2 3 4 1 2 3 4 1 2 3 4 1 2 3 4 1 2 3 4 1 2 3 4 1 2 3 4 1 2 3 4 1 2 3 4 1 2 3 4 1 2 3 4 1 2 3 4 1 2 3 4 1 2 3 4
Exploitation Stage
Environmental Impact Asssessment
Steam Field Development
Survey, Design, Field Development
Drilling & Testing
Geothermal Fluid Transportation System
Fabrication & Delivery, Construction/Installation
Power Plant
Design, Manufacturing, Delivery, Construction/Installation
Commissioning 10MW 10MW 10MW
(Transmission Line and Switchyard)
Design, Manufacturing, Delivery, Construction/Installation
Commissioning 6MW
Operation Stage 6MW 16MW 10MW 36MW
Field Information and Evaluation
Rank of Development Priority
Power Output Potential Resource Potential
A
36 MW150 MW Restrictedby National Park 150 MW Restricted by
Power Demand
Province/Location East Nusa Tenggara, South of Ruteng townNo.55 ULUMBU Region Nusa Tenggara
Developer PLN
Installed and planning Capacity Installed Capacity 30 MW0 MW Existing Plan 6 MW PossibleAdditional Plan
1 2 3 4 5 6 7 8 9 10 11 12 19 2013 14 15 16
Table 7.1.9-2 Development Plan Sheet for Existing Project Field (No.55 ULUMBU)
ACTIVITY
17 18

Planned and Proposed Geothermal Development Schedule
1 2 3 4 1 2 3 4 1 2 3 4 1 2 3 4 1 2 3 4 1 2 3 4 1 2 3 4 1 2 3 4 1 2 3 4 1 2 3 4 1 2 3 4 1 2 3 4 1 2 3 4 1 2 3 4 1 2 3 4 1 2 3 4 1 2 3 4 1 2 3 4 1 2 3 4 1 2 3 4
Exploitation Stage
Environmental Impact Asssessment
Steam Field Development
Survey, Design, Field Development
Drilling & Testing
Geothermal Fluid Transportation System
Fabrication & Delivery, Construction/Installation
Power Plant
Design, Manufacturing, Delivery, Construction/Installation
Commissioning 7.5MW 10MW
(Transmission Line and Switchyard)
Design, Manufacturing, Delivery, Construction/Installation
Commissioning 2.5MW
Operation Stage 2.5MW 10MW 20MW
ACTIVITY
17 18 19 2013 14 15 169 10 11 125 6 7 81 2 3 4
Developer PLN
Installed and planning Capacity Installed Capacity 17.5 MW0 MW Existing Plan 2.5 MW PossibleAdditional Plan
Restricted byPower Demand
Province/Location East Nusa Tenggara, East of Bajawa townNo.56 BENA - MATALOKO Region Nusa Tenggara
Table 7.1.9-2 Development Plan Sheet for Existing Project Field (No.56 BENA - MATALOKO)
Field Information and Evaluation
Rank of Development Priority
Power Output Potential Resource Potential
A
20 MW30 MW Restrictedby National Park 30 MW

Planned and Proposed Geothermal Development Schedule
1 2 3 4 1 2 3 4 1 2 3 4 1 2 3 4 1 2 3 4 1 2 3 4 1 2 3 4 1 2 3 4 1 2 3 4 1 2 3 4 1 2 3 4 1 2 3 4 1 2 3 4 1 2 3 4 1 2 3 4 1 2 3 4 1 2 3 4 1 2 3 4 1 2 3 4 1 2 3 4
Exploitation Stage
Environmental Impact Asssessment
Steam Field Development
Survey, Design, Field Development
Drilling & Testing
Geothermal Fluid Transportation System
Fabrication & Delivery, Construction/Installation
Power Plant
Design, Manufacturing, Delivery, Construction/Installation
Commissioning 25MW 30MW 55MW
(Transmission Line and Switchyard) Lahendong Tompaso Tompaso 110MW
Design, Manufacturing, Delivery, Construction/Installation 20MW 20MW 20MW 40MW
Commissioning
Operation Stage 20MW 40MW 60MW 100MW 125MW 155MW 210MW 320MW
Field Information and Evaluation
Rank of Development Priority
Power Output Potential Resource Potential
A
340 MW380 MW Restrictedby National Park 380 MW Restricted by
Power Demand
Province/Location
North Sulawesi,Around Tomohon and Tompaso tomnsNo.61 LAHENDONG, No.63 TOMPASO Region Sulawesi
Developer PERTAMINA
Installed and planning Capacity Installed Capacity 220 MW20 MW Existing Plan 100 MW PossibleAdditional Plan
1 2 3 4 5 6 7 8 9 10 11 12 19 2013 14 15 16
Table 7.1.9-2 Development Plan Sheet for Existing Project Field (No.61 LAHENDONG, No.63 TOMPASO)
ACTIVITY
17 18

Planned and Proposed Geothermal Development Schedule
1 2 3 4 1 2 3 4 1 2 3 4 1 2 3 4 1 2 3 4 1 2 3 4 1 2 3 4 1 2 3 4 1 2 3 4 1 2 3 4 1 2 3 4 1 2 3 4 1 2 3 4 1 2 3 4 1 2 3 4 1 2 3 4 1 2 3 4 1 2 3 4 1 2 3 4 1 2 3 4
Exploitation Stage
Environmental Impact Asssessment
Steam Field Development
Survey, Design, Field Development
Drilling & Testing
Geothermal Fluid Transportation System
Fabrication & Delivery, Construction/Installation
Power Plant
Design, Manufacturing, Delivery, Construction/Installation
Commissioning 55MW 45MW
(Transmission Line and Switchyard)
Design, Manufacturing, Delivery, Construction/Installation
Commissioning 40MW
Operation Stage 40MW 85MW 140MW
ACTIVITY
17 18 19 2013 14 15 169 10 11 125 6 7 81 2 3 4
Developer PERTAMINA
Installed and planning Capacity Installed Capacity 100 MW0 MW Existing Plan 40 MW PossibleAdditional Plan
Restricted byPower Demand
Province/Location North Sulawesi, South of G. AmbangNo.62 KOTAMOBAGU Region Sulawesi
Table 7.1.9-2 Development Plan Sheet for Existing Project Field (No.62 KOTAMOBAGU)
Field Information and Evaluation
Rank of Development Priority
Power Output Potential Resource Potential
A
140 MW220 MW Restrictedby National Park 160 MW

Table 7.1.9-3 Basic Duration for Implementation in Geothermal Power Development Schedule
Specification Duration
Preliminary Survey Stage
Request for WKP from Local Gov. -
Preliminary Study Surface Study 12months
Geological Study geology, Hydroaltaration
Geochemical Study water, gas chemical analysis
Geophysical Study MT,TDEM
Integrated Analysis Geothermal Structure Model
Tendering - 12months
Exploration Stage
Exploratory Well Test Study
Field Development access roads, civil works, 3pads 2months/pad
Exploratory Well Drilling 3 wells (standard size, 2500m) 4months/well
Well Testing logging, production test 6months
Reservoir Simulation 3D numerical model simulation 3months/field
Resource Assessment 3months/field
Exploitation Stage
Environmental Impact Assessment ANDAL, RKL, RPL 12months/field
Steam Field Development
Survey, Design 6months/field
Field Development access roads, civil works 6months advanced drilling
Drilling & Testing 1000m well (standard size) 1.5months/well1500m well (standard size) 1.5months/well2000m well (standard size) 2months/well2500m well (standard size) 2.5months/welllogging, production test 3months/well
Geothermal Fluid Transportation System
Fabrication & Delivery, 10MW 18months/unitConstruction/Installation 20MW 18months/unit
30MW 18months/unit40MW 20months/unit45MW 20months/unit55MW 20months/unit60MW 20months/unit70MW 20months/unit75MW 22months/unit80MW 22months/unit110MW 24months/unit
Power Plant
Design, Manufacturing, Delivery, 10MW 24months/unitConstruction/Installation 20MW 24months/unit
30MW 24months/unit40MW 24months/unit45MW 24months/unit55MW 26months/unit60MW 26months/unit70MW 26months/unit75MW 28months/unit80MW 28months/unit110MW 30months/unit
(Transmission Line and Switchyard)
Design, Manufacturing, Delivery,Construction/Installation
ACTIVITY
(basically, start in 1 month later of thebeginning of Survey, Design FieldDevelopment)
(basically, start in 1 month later of thebeginning of Drilling)
(basically, start in 1 month later of thebeginning of Drilling)

Fig. 7.1.10-1 Histogram for Geothermal Development Master Plan
Fastest Case
2,000
3,442
4,600
6,000
9,500
0
1,000
2,000
3,000
4,000
5,000
6,000
7,000
8,000
9,000
10,000
2007 2008 2009 2010 2011 2012 2013 2014 2015 2016 2017 2018 2019 2020 2021 2022 2023 2024 2025
Year
Pow
er O
utpu
t Cap
acity
(MW
)Rank-NRank-LRank-CRank-BRank-A excluding Existing PlanExisting PlanInstalledMilestone of the Road Map
Practical Case
2,000
3,442
4,600
6,000
9,500
0
1,000
2,000
3,000
4,000
5,000
6,000
7,000
8,000
9,000
10,000
2007 2008 2009 2010 2011 2012 2013 2014 2015 2016 2017 2018 2019 2020 2021 2022 2023 2024 2025
Year
Pow
er O
utpu
t Cap
acity
(MW
)
Rank-NRank-LRank-CRank-BRank-A excluding Existing PlanExisting PlanInstalledMilestone of the Road Map

Fig. 7.1.10-2 Histogram for Development Capacity in Each Region
Practical Case
2,000
3,442
4,600
6,000
9,500
0
1,000
2,000
3,000
4,000
5,000
6,000
7,000
8,000
9,000
10,000
2007 2008 2009 2010 2011 2012 2013 2014 2015 2016 2017 2018 2019 2020 2021 2022 2023 2024 2025
Year
Pow
er O
utpu
t Cap
acity
(MW
)
Maluku and North MalukuCentaral, South and Southeast SulawesiNorth SulawesiEast Nusa TenggaraWest Nusa TenggaraJava-BaliSumatraMilestone of the Road Map

(Practical Case: Sumatra and Java-Bali)Fig. 7.1.10-3 Histogram for Development Capacity in Each Region
Sumatra
0
500
1,000
1,500
2,000
2,500
3,000
3,500
4,000
4,500
5,000
2007
2008
2009
2010
2011
2012
2013
2014
2015
2016
2017
2018
2019
2020
2021
2022
2023
2024
2025
Year
Pow
er O
utpu
t Cap
acity
(MW
)Rank-NRank-LRank-CRank-BRank-A excluding Existing PlanExisting PlanInstalled
Java-Bali
0
500
1,000
1,500
2,000
2,500
3,000
3,500
4,000
4,500
5,000
2007
2008
2009
2010
2011
2012
2013
2014
2015
2016
2017
2018
2019
2020
2021
2022
2023
2024
2025
Year
Pow
er O
utpu
t Cap
acity
(MW
)
Rank-NRank-LRank-CRank-BRank-A excluding Existing PlanExisting PlanInstalled

(Practical Case: Nusa Tenggara, Sulawesi and Maluku)Fig. 7.1.10-3 Histogram for Development Capacity in Each Region
Nusa Tenggara
0
500
1,000
1,500
2,000
2007
2008
2009
2010
2011
2012
2013
2014
2015
2016
2017
2018
2019
2020
2021
2022
2023
2024
2025
Year
Pow
er O
utpu
t Cap
acity
(MW
)
Rank-NRank-LRank-CRank-BRank-A excluding Existing PlanExisting PlanInstalled
Sulawesi
0
500
1,000
1,500
2,000
2007
2008
2009
2010
2011
2012
2013
2014
2015
2016
2017
2018
2019
2020
2021
2022
2023
2024
2025
Year
Pow
er O
utpu
t Cap
acity
(MW
)
Rank-NRank-LRank-CRank-BRank-A excluding Existing PlanExisting PlanInstalled
Maluku
0
500
1,000
1,500
2,000
2007
2008
2009
2010
2011
2012
2013
2014
2015
2016
2017
2018
2019
2020
2021
2022
2023
2024
2025
Year
Pow
er O
utpu
t Cap
acity
(MW
)
Rank-NRank-LRank-CRank-BRank-A excluding Existing PlanExisting PlanInstalled

TotalExisting 2007 2008 2009 2010 2011 2012 2013 2014 2015 2016 2017 2018 2019 2020 2021 2022 2023 2024 2025 (MW)
N.Sumatra 8 SARULA A 300 110 110 110 630N.Sumatra 9 SIBUAL BUALI ALampung 27 ULUBELU A 110 110 110 110 440W.Java 32 KAMOJANG A 140 60 60 60 320W.Java 33 G. SALAK A 380 60 60 500W.Java 34 DARAJAT A 145 110 75 330W.Java 36 G. PATUHA A 60 60 110 110 160 500W.Java 37 G. WAYANG - WINDU A 110 110 110 70 400W.Java 38 G. KARAHA A 30 55 110 110 305W.Java 39 G. TELAGABODAS A 55 40 95C.Java 44 DIENG A 60 60 60 110 110 400
N.Sulawesi 61 LAHENDONG A 20 20 20 20 40 25 30 55 110 340N.Sulawesi 63 TOMPASO A
Bali 52 BEDUGUL A 10 55 55 55 175N.Sumatra 7 LAU DEBUK-DEBUK / SIBAYAK A 2 8 30 40
E.Nusa Tenggara 55 ULUMBU A 6 10 10 10 36E.Nusa Tenggara 56 BENA - MATALOKO A 2.5 8 10 20
Jambi 17 SUNGAI PENUH A 55 110 110 80 355S.Sumatra 25 LUMUT BALAI A 110 110 110 110 180 620Bengkulu 21 B. GEDUNG HULU LAIS A 110 220 220 60 610Bengkulu 22 TAMBANG SAWAH A 220 80 300
N.Sulawesi 62 KOTAMOBAGU A 40 55 45 140Jambi 15 LEMPUR / KERINCI B T 20 20
W.Sumatra 13 MUARALABUH B T 55 55 55 75 240Lampung 28 SUOH ANTATAI B T 110 110 110 330W.Java 35 CISOLOK - CISUKARAME B T 55 55 70 180C.Java 47 UNGARAN B T 55 55 70 180
Lampung 29 G. SEKINCAU B T 30 30 60E.Java 50 WILIS / NGEBEL B T 55 65 120
N.Sumatra 10 S. MERAPI - SAMPURAGA B T 55 45 100E.Nusa Tenggara 57 SOKORIA - MUTUBUSA B T 10 10 20
Aceh 3 SEULAWAH AGAM C T 55 55 55 110 275Lampung 30 RAJABASA C T 40 40 40 120Lampung 31 WAI RATAI C T 40 40 40 120S.Sumatra 24 MARGA BAYUR C T 55 55 60 170C.Sulawesi 65 MERANA C T 40 40 60 60 200Golontaro 73 SUWAWA-GORONTALO C T 10 20 25 55
Aceh 1 IBOIH - JABOI C T 10 10W.Sumatra 14 G. TALANG C T 30 30
W.Java 40 TANGKUBANPERAHU C T 20 20E.Java 51 IJEN C T 20 20 40
W.Nusa Tenggara 53 HU'U DAHA C T 30 30E.Nusa Tenggara 54 WAI SANO C T 10 10E.Nusa Tenggara 58 OKA - LARANTUKA C T 10 10 20E.Nusa Tenggara 60 ATADEI C T 10 10
Maluku 69 TULEHU C T 20 20N.Maluku 70 JAILOLO C T 20 20C.Java 46 TELOMOYO L T 50 50
N.Sumatra 71 SIPAHOLON-TARUTUNG L T 20 30 50Banten 42 CITAMAN - G. KARANG L T 20 20Aceh 2 LHO PRIA LAOT NAceh 4 G. GEUREUDONG NAceh 5 G. KEMBAR N
N.Sumatra 6 G. SINABUNG NN.Sumatra 11 PUSUK BUKIT - DANAU TOBA NN.Sumatra 12 SIMBOLON - SAMOSIR N
Jambi 16 SUNGAI TENANG NJambi 18 SUNGAI BETUNG NJambi 19 AIR DIKIT NJambi 20 G. KACA N
Bengkulu 23 BUKIT DAUN N T 424 424S.Sumatra 26 RANTAU DADAP - SEGAMIT N
Banten 41 BATUKUWUNG NBanten 43 G. ENDUT NC.Java 45 MANGUNAN NC.Java 48 G. SLAMET NE.Java 49 G. ARJUNO - WELIRANG NE.Java 72 IYANG ARGOPURO N
E.Nusa Tenggara 59 ILI LABALEKEN NC.Sulawesi 64 BORA NS.Sulawesi 66 BITUANG NS.Sulawesi 67 LAINEA NN.Maluku 68 TONGA WAYANA N
857 31 300 6 20 320 440 0 425 10 935 508 250 1,085 805 650 620 890 180 1,169 9,500 857 888 1,188 1,194 1,214 1,534 1,974 1,974 2,399 2,409 3,344 3,851 4,101 5,186 5,991 6,641 7,261 8,151 8,331 9,500 9,500
8,433 8,974 9,691 10,478 11,194 12,095 13,040 13,996 15,135 16,140 17,358 18,631 19,975 21,335 22,568 24,135 25,803 27,584 29,4862,000 3,442 4,600 6,000 9,500
813 1,469 1,257 9 0
Red Font : exisiting geothermal development plan Preliminary Study (Surface Survey by Government) T Tendering Exploration Stage Exploitation Stage Blue Font: Existing Working Area of PERTAMINA
Table 7.1.10-1 Geothermal Development Master Plan (Fastest Case)
Total of Minimum Demand (MW)
Development Rank
TOTAL (MW)Cumulative Capacity (MW)
Milestone of the Road Map (MW)Shortage (MW)
Region No Field name

TotalExisting 2007 2008 2009 2010 2011 2012 2013 2014 2015 2016 2017 2018 2019 2020 2021 2022 2023 2024 2025 (MW)
N.Sumatra 8 SARULA A 300 110 110 110 630N.Sumatra 9 SIBUAL BUALI ALampung 27 ULUBELU A 110 110 110 110 440W.Java 32 KAMOJANG A 140 60 60 60 320W.Java 33 G. SALAK A 380 60 60 500W.Java 34 DARAJAT A 145 110 75 330W.Java 36 G. PATUHA A 60 60 110 110 160 500W.Java 37 G. WAYANG - WINDU A 110 110 110 70 400W.Java 38 G. KARAHA A 30 55 110 110 305W.Java 39 G. TELAGABODAS A 55 40 95C.Java 44 DIENG A 60 60 60 110 110 400
N.Sulawesi 61 LAHENDONG A 20 20 20 20 40 25 30 55 110 340N.Sulawesi 63 TOMPASO A
Bali 52 BEDUGUL A 10 55 55 55 175N.Sumatra 7 LAU DEBUK-DEBUK / SIBAYAK A 2 8 30 40
E.Nusa Tenggara 55 ULUMBU A 6 10 10 10 36E.Nusa Tenggara 56 BENA - MATALOKO A 2.5 8 10 20
Jambi 17 SUNGAI PENUH A 55 110 110 80 355S.Sumatra 25 LUMUT BALAI A 110 110 110 110 180 620Bengkulu 21 B. GEDUNG HULU LAIS A 110 220 220 60 610Bengkulu 22 TAMBANG SAWAH A 220 80 300
N.Sulawesi 62 KOTAMOBAGU A 40 55 45 140Jambi 15 LEMPUR / KERINCI B T 20 20
W.Sumatra 13 MUARALABUH B T 55 55 55 75 240Lampung 28 SUOH ANTATAI B T 110 110 110 330W.Java 35 CISOLOK - CISUKARAME B T 55 55 70 180C.Java 47 UNGARAN B T 55 55 70 180
Lampung 29 G. SEKINCAU B T 30 30 60E.Java 50 WILIS / NGEBEL B T 55 65 120
N.Sumatra 10 S. MERAPI - SAMPURAGA B T 55 45 100E.Nusa Tenggara 57 SOKORIA - MUTUBUSA B T 10 10 20
Aceh 3 SEULAWAH AGAM C T 55 55 55 110 275Lampung 30 RAJABASA C T 40 40 40 120Lampung 31 WAI RATAI C T 40 40 40 120S.Sumatra 24 MARGA BAYUR C T 55 55 60 170C.Sulawesi 65 MERANA C T 40 40 60 60 200Golontaro 73 SUWAWA-GORONTALO C T 10 20 25 55
Aceh 1 IBOIH - JABOI C T 10 10W.Sumatra 14 G. TALANG C T 30 30
W.Java 40 TANGKUBANPERAHU C T 20 20E.Java 51 IJEN C T 20 20 40
W.Nusa Tenggara 53 HU'U DAHA C T 30 30E.Nusa Tenggara 54 WAI SANO C T 10 10E.Nusa Tenggara 58 OKA - LARANTUKA C T 10 10 20E.Nusa Tenggara 60 ATADEI C T 10 10
Maluku 69 TULEHU C T 20 20N.Maluku 70 JAILOLO C T 20 20C.Java 46 TELOMOYO L T 50 50
N.Sumatra 71 SIPAHOLON-TARUTUNG L T 20 30 50Banten 42 CITAMAN - G. KARANG L T 20 20Aceh 2 LHO PRIA LAOT NAceh 4 G. GEUREUDONG NAceh 5 G. KEMBAR N
N.Sumatra 6 G. SINABUNG NN.Sumatra 11 PUSUK BUKIT - DANAU TOBA NN.Sumatra 12 SIMBOLON - SAMOSIR N
Jambi 16 SUNGAI TENANG NJambi 18 SUNGAI BETUNG NJambi 19 AIR DIKIT NJambi 20 G. KACA N
Bengkulu 23 BUKIT DAUN N T 424 424S.Sumatra 26 RANTAU DADAP - SEGAMIT N
Banten 41 BATUKUWUNG NBanten 43 G. ENDUT NC.Java 45 MANGUNAN NC.Java 48 G. SLAMET NE.Java 49 G. ARJUNO - WELIRANG NE.Java 72 IYANG ARGOPURO N
E.Nusa Tenggara 59 ILI LABALEKEN NC.Sulawesi 64 BORA NS.Sulawesi 66 BITUANG NS.Sulawesi 67 LAINEA NN.Maluku 68 TONGA WAYANA N
857 31 300 6 20 320 440 0 425 10 525 778 250 1,095 795 735 605 780 360 1,169 9,500 857 888 1,188 1,194 1,214 1,534 1,974 1,974 2,399 2,409 2,934 3,711 3,961 5,056 5,851 6,586 7,191 7,971 8,331 9,500 9,500
8,433 8,974 9,691 10,478 11,194 12,095 13,040 13,996 15,135 16,140 17,358 18,631 19,975 21,335 22,568 24,135 25,803 27,584 29,4862,000 3,442 4,600 6,000 9,500
813 1,469 1,667 149 0
Red Font : exisiting geothermal development plan Preliminary Study (Surface Survey by Government) T Tendering Exploration Stage Exploitation Stage Blue Font Existing Working Area of PERTAMINA
Milestone of the Road Map (MW)Shortage (MW)
Region No Field name
Table 7.1.10-2 Geothermal Development Master Plan (Practical Case)
Total of Minimum Demand (MW)
Development Rank
TOTAL (MW)Cumulative Capacity (MW)

SumatraExisting 2007 2008 2009 2010 2011 2012 2013 2014 2015 2016 2017 2018 2019 2020 2021 2022 2023 2024 2025 Total(MW)
N.Sumatra 8 SARULA A 300 110 110 110 630N.Sumatra 9 SIBUAL BUALI ALampung 27 ULUBELU A 110 110 110 110 440
N.Sumatra 7 LAU DEBUK-DEBUK / SIBAYAK A 2 8 30 40Jambi 17 SUNGAI PENUH A 55 110 110 80 355
S.Sumatra 25 LUMUT BALAI A 110 110 110 110 180 620Bengkulu 21 B. GEDUNG HULU LAIS A 110 220 220 60 610Bengkulu 22 TAMBANG SAWAH A 220 80 300
Jambi 15 LEMPUR / KERINCI B T 20 20W.Sumatra 13 MUARALABUH B T 55 55 55 75 240Lampung 28 SUOH ANTATAI B T 110 110 110 330Lampung 29 G. SEKINCAU B T 30 30 60
N.Sumatra 10 S. MERAPI - SAMPURAGA B T 55 45 100Aceh 3 SEULAWAH AGAM C T 55 55 55 110 275
Lampung 30 RAJABASA C T 40 40 40 120Lampung 31 WAI RATAI C T 40 40 40 120
S.Sumatra 24 MARGA BAYUR C T 55 55 60 170Aceh 1 IBOIH - JABOI C T 10 10
W.Sumatra 14 G. TALANG C T 30 30N.Sumatra 71 SIPAHOLON-TARUTUNG L T 20 30 50
Aceh 2 LHO PRIA LAOT NAceh 4 G. GEUREUDONG NAceh 5 G. KEMBAR N
N.Sumatra 6 G. SINABUNG NN.Sumatra 11 PUSUK BUKIT - DANAU TOBA NN.Sumatra 12 SIMBOLON - SAMOSIR N T 200 200
Jambi 16 SUNGAI TENANG NJambi 18 SUNGAI BETUNG NJambi 19 AIR DIKIT NJambi 20 G. KACA N
Bengkulu 23 BUKIT DAUN NS.Sumatra 26 RANTAU DADAP - SEGAMIT N
2 8 220 320 385 140 480 30 510 550 355 385 595 290 450 2 10 10 10 10 230 550 550 935 935 1075 1555 1585 2095 2645 3000 3385 3980 4270 4720 4720
1159.6 1234.4 1336 1425.6 3634.8 3754.8 3859.6 4002 4158.8 4318 4488.4 4662.4 4848 5005.2 5198.4 5418.8 5653.2 5903.6 6170.4
Java-BaliW.Java 32 KAMOJANG A 140 60 60 60 320W.Java 33 G. SALAK A 380 60 60 500W.Java 34 DARAJAT A 145 110 75 330W.Java 36 G. PATUHA A 60 60 110 110 160 500W.Java 37 G. WAYANG - WINDU A 110 110 110 70 400W.Java 38 G. KARAHA A 30 55 110 110 305W.Java 39 G. TELAGABODAS A 55 40 95C.Java 44 DIENG A 60 60 60 110 110 400
Bali 52 BEDUGUL A 10 55 55 55 175W.Java 35 CISOLOK - CISUKARAME B T 55 55 70 180C.Java 47 UNGARAN B T 55 55 70 180E.Java 50 WILIS / NGEBEL B T 55 65 120W.Java 40 TANGKUBANPERAHU C T 20 20E.Java 51 IJEN C T 20 20 40C.Java 46 TELOMOYO L T 50 50Banten 42 CITAMAN - G. KARANG L T 20 20Banten 41 BATUKUWUNG NBanten 43 G. ENDUT NC.Java 45 MANGUNAN N T 200 200C.Java 48 G. SLAMET NE.Java 49 G. ARJUNO - WELIRANG NE.Java 72 IYANG ARGOPURO N
835 280 60 120 10 375 240 100 465 245 235 220 110 540 835 835 1115 1115 1115 1175 1295 1295 1295 1305 1680 1920 2020 2485 2730 2965 3185 3295 3295 3835 3835
6803.2 7236 7810 8460.8 6925.2 7657.2 8444.8 9204.8 10130 10903.6 11882.8 12907.6 13986 15107.2 16054.4 17300.8 18626 20037.2 21542.8Red Font : exisiting geothermal development plan
Preliminary Study (Surface Survey by Government) T Tendering Exploration Stage Exploitation Stage Blue Font Existing Working Area of PERTAMINA
Table 7.1.10-3 Geothermal Development Master Plan in Each Region (Practical Case; Sumatra and Java-Bali)
Cumulative Capacity (MW)Minimum Demand (MW)
TOTAL (MW)Cumulative Capacity (MW)Minimum Demand (MW)
TOTAL (MW)
Region No Field name DevelopmentRank

West Nusa TenggaraW.Nusa Tenggara 53 HU'U DAHA C T 30 30
0 30 0 30 30 30 30 30 30 30 30 30
58.4 64.8 71.6 79.2 87.2 95.6 104.8 114 124 132.4 141.2 150.4 160.8 170.4 180.4 190.8 202 214 227.2
East Nusa TenggaraE.Nusa Tenggara 55 ULUMBU A 6 10 10 10 36E.Nusa Tenggara 56 BENA - MATALOKO A 2.5 8 10 20E.Nusa Tenggara 57 SOKORIA - MUTUBUSA B T 10 10 20E.Nusa Tenggara 54 WAI SANO C T 10 10E.Nusa Tenggara 58 OKA - LARANTUKA C T 10 10 20E.Nusa Tenggara 60 ATADEI C T 10 10E.Nusa Tenggara 59 ILI LABALEKEN N
0 3 6 10 18 40 10 10 20 0 3 3 9 9 9 9 9 9 9 19 36 76 76 76 86 86 86 96 116 116
32.6 35.92 39.64 43.72 47.8 52.32 57.28 62.16 67.52 70.68 74.08 77.72 81.6 85.76 92.36 99.56 107.4 115.96 125.36
North SulawesiN.Sulawesi 61 LAHENDONG A 20 20 20 20 40 25 30 55 110 340N.Sulawesi 63 TOMPASO AN.Sulawesi 62 KOTAMOBAGU A 40 55 45 140Golontaro 73 SUWAWA-GORONTALO C T 10 20 25 55
20 20 20 20 40 40 10 80 75 75 135 20 40 60 60 80 120 120 120 160 160 160 160 170 250 250 325 325 400 400 535 535
101.2 107.2 116 126 134.8 147.2 161.2 174 188 208 230.8 256 284 314.8 349.2 388 431.2 480 534.4
Centaral, South and Southeast SulawesiC.Sulawesi 65 MERANA C T 40 40 60 60 200C.Sulawesi 64 BORA NS.Sulawesi 66 BITUANG N T 24 24
SE.Sulawesi 67 LAINEA N 0 40 40 60 60 24 0 40 40 80 80 140 140 140 200 224 224
252 268.8 289.6 312 332.8 354.8 378 402.4 428.4 466.4 497.2 530.4 565.2 599.2 636.8 676.8 719.2 764.4 812.4
Maluku and North MalukuMaluku 69 TULEHU C T 20 20
N.Maluku 70 JAILOLO C T 20 20N.Maluku 68 TONGA WAYANA N
0 40 0 0 0 0 0 0 0 0 0 0 0 40 40 40 40 40 40 40 40 40
25.6 26.8 28.4 30.4 31.6 33.2 34.8 36.4 38 40.8 43.6 46.4 49.6 52.8 56.4 60.4 64.4 68.8 73.6Red Font : exisiting geothermal development plan
TOTAL (MW) 857 31 300 6 20 320 440 0 425 10 525 778 250 1,095 795 735 605 780 360 1,169 9,500 857 888 1,188 1,194 1,214 1,534 1,974 1,974 2,399 2,409 2,934 3,711 3,961 5,056 5,851 6,586 7,191 7,971 8,331 9,500 9,500
8,433 8,974 9,691 10,478 11,194 12,095 13,040 13,996 15,135 16,140 17,358 18,631 19,975 21,335 22,568 24,135 25,803 27,584 29,486
2,000 3,442 4,600 6,000 9,500
813 1,469 1,667 149 0
Preliminary Study (Surface Survey by Government) T Tendering Exploration Stage Exploitation Stage Blue Font Existing Working Area of PERTAMINA
Shortage (MW)
Table 7.1.10-3 Geothermal Development Master Plan in Each Region (Practical Case; Nusa Tenggara, Sulawesi and Maluku)
Milestone of the Road Map (MW)
TOTAL (MW)Cumulative Capacity (MW)Minimum Demand (MW)
TOTAL (MW)Cumulative Capacity (MW)Minimum Demand (MW)
TOTAL (MW)Cumulative Capacity (MW)
TOTAL (MW)Cumulative Capacity (MW)
Total of Minimum Demand (MW)
Minimum Demand (MW)
TOTAL (MW)Cumulative Capacity (MW)Minimum Demand (MW)
Minimum Demand (MW)
TOTAL (MW)Cumulative Capacity (MW)

Region DevelopmentRank
Numberof
Field
InstalledCapacity
(MW)
DevelopmentPlan by 2008
(MW)
DevelopmentPlan by 2012
(MW)
DevelopmentPlan by 2016
(MW)
DevelopmentPlan by 2020
(MW)
DevelopmentPlan by 2025
(MW)
A 8 2 10 530 915 1,715 2,995B 5 - 0 20 160 510 750C 6 - 0 0 0 420 725L 1 - 0 0 0 0 50N 12 - 0 0 0 0 200
Total 32 2 10 550 1,075 2,645 4,720A 9 835 1,115 1,295 1,515 2,330 3,025B 3 - 0 0 165 340 480C 2 - 0 0 0 60 60L 2 - 0 0 0 0 70N 6 - 0 0 0 0 200
Total 22 835 1,115 1,295 1,680 2,730 3,835A 2 - 3 9 9 26 56B 1 - 0 0 10 20 20C 4 - 0 0 0 60 70N 1 - 0 0 0 0 0
Total 8 0 3 9 19 106 146A 3 20 60 120 160 240 480C 2 - 0 0 0 90 255N 3 - 0 0 0 0 24
Total 8 20 60 120 160 330 759C 2 - 0 0 0 40 40N 1 - 0 0 0 0 0
Total 3 0 0 0 0 40 40
73 857 1,188 1,974 2,934 5,851 9,500
- 857 2,000 3,442 4,600 6,000 9,500
(Practical Case)
Table 7.1.10-4 Sammary of Geothermal Development Master Plan
Sumatra
Java-Bali
Nusa Tenggara
Sulawesi
Total
The Road Map
Maluku

7-122
MW
Hydro Power MW 3,199 (14.6%) 2,666 (3.5%) 5,865 (6.3%)Gas Turbine MW 1,494 (6.8%) 6,235 (8.2%) 7,285 (7.8%)Combined cycle MW 6,561 (30.0%) 16,665 (21.9%) 21,756 (23.3%)Steam MW 6,900 (31.5%) 36,637 (48.1%) 41,982 (45.0%)Geothermal MW 807 (3.7%) 1,429 (1.9%) 2,286 (2.5%)Diesel MW 2,921 (13.4%) 583 (0.8%) 2,089 (2.2%)Nuclear MW 0 (0.0%) 12,000 (15.7%) 12,000 (12.9%)Total MW 21,882 (100.0%) 76,214 (100.0%) 93,263 (100.0%)(Source) *1 from PLN Statistics 2004, Pertamina Geothermal Energy Boucher
*2 from RUKN (2005)(Note) *3 (C) is not equall to (a)+(b) due to decommission of power plants.
Existing (2004) (a)(*1)
New Plant (2005-2025)(b) (*2)
Power Plant Total (as of 2025) (c)(*3)
Table 7.1.11-1 Power Plant Mix in 2025 by RUKN
Table 7.1.11-2 Energy Mix in Electricity Production in 2004 and 2025 by RUKN
Energy Production by Type of Power Plant (present and forcast)
Energy SourceHydro GWh 7,845 (6.4%) 20,556 (3.8%)Gas GWh 35,427 (29.1%) 146,978 (27.1%)Coal GWh 45,472 (37.3%) 278,383 (51.3%)Geothemral GWh 6,560 (5.4%) 20,323 (3.7%)Oil GWh 26,442 (21.7%) 37,606 (6.9%)Nuclear GWh 0 (0.0%) 38,752 (7.1%)Total GWh 121,746 (100.0%) 542,598 (100.0%)
(Source) RUKN (2005), Pertamina Geothermal Energy Broucher
Current (2005) Plan (2025)

7-123
RUKN2005 base
0
10,000
20,000
30,000
40,000
50,000
60,000
70,000
80,000
90,000
100,000
2005 2006 2007 2008 2009 2010 2011 2012 2013 2014 2015 2016 2017 2018 2019 2020 2021 2022 2023 2024 2025
YEAR
DE
MA
ND
& P
LAN
T C
AP
AC
ITY
(MW
)
DieselSteamCombined cycleGas TurbineHydro PowerNuclearGeothermalAdditional Peak Power Demand
Fig. 7.1.11-1 Power Plant Development Plan by RUKN

7-124
Fig. 7.1.11-2 Energy Mix in Electricity Production in 2004
Fig. 7.1.11-3 Energy Mix in Electricity Production in 2025 by RUKN
Energy Mix in Electricity Production (2005)
37.3%
5.4%
29.1%
6.4%
21.7%
0.0%
Hydro Gas Coal Geothermal Oil Nuclear
121,746 GWh
Energy Mix in Electricity Production (2025) <RUKN Base>
27.1%
51.3%
7.1%
6.9%
3.7% 3.8% 0.0%
Hydro Power Gas Turbine Combined cycle Steam
Diesel Nuclear Geothermal
542,600 GWh

7-125
PlantCapacity
InitialInvestment Unit Cost Construction
Years Plant Factor Fuel Price Heat rate Remarks
(MW) (m$) ($/kW) (Yrs.) (%) ($/MMBTU) (%)
Geothermal 55 136 2,500 5 85 - -
600 510 850
50 79 1,580
600 300 500
50 60 1,200
Diesel 10 16 1,550 2 85 12.9(50$/B) 38
Hydropower 20 44 2,200 4 60 - -
(Note) Initial investment does not include Interest during Construction (IDC).
Natural Gas CC
1.8(35$/t) 38 include port, coal yard, ash
disposal pond etc.
3 85 8.6(50$/B) 50 not include gas pipeline
Power Source
3 85Coal
(¢/kWh)
Power Plant (MW) FixedCost
VariableCost Total
Geothermal 55 7.0 0.0 7.0600 3.0 1.8 4.850 5.1 1.8 6.9
600 1.2 5.9 7.150 3.6 5.9 9.5
Diesel 10 4.4 11.6 16.0Hydro 20 9.1 0.0 9.11. Expected IRR is 15%.2. VAT is 0% for geothermal case.3. Plant factor is 85%. (60% for Hydro plant) 4. Fixed cost includes investment cost, interest, O&M cost and return on investment5. Variable cost is fuel cost.
Coal
Gas CC
Table 7.1.11-3 Model Power Plant Specification of various Energy Sources
Table 7.1.11-4 Selling Price of Model Power Plant of various Energy Sources

7-126
Selling Price of Power Plant
0
2
4
6
8
10
12
14
16
18
Geothe
rmal
(55M
W)
Coal
(60
0MW)
Coal
(50
MW)
Gas C
C
(600M
W)
Gas C
C
(50MW)
Diesel
(10M
W)
Hydro
(20M
W)
Sellin
g Pr
ice
(¢/k
Wh)
Variable Cost
Fixed Cost
Fig. 7.1.11-4 Selling Price of Model Power Plant of various Energy Sources

7-127
0.0
2.0
4.0
6.0
8.0
10.0
12.0
14.0
16.0
0.00
0.10
0.20
0.30
0.40
0.50
0.60
0.70
0.80
0.90
1.00
Plant Factor
Sel
ling
Pric
e (¢
/kW
h)
Geothermal (55MW)Coal (600MW)Gas CC (600MW)Diesel (10MW)Hydro (20MW)
0.0
0.1
0.2
0.3
0.4
0.5
0.6
0.7
0.8
0.9
1.0
0.0 0.1 0.2 0.3 0.4 0.5 0.6 0.7 0.8 0.9 1.0
Hours (%)
Dem
and
(%)
Geothermal, Nuclear, Hydro, Coal(Base Load Supplier)
40%
Gas Combined Cycle, GasTurbine
(Peak Load Supplier)30%
Coal(Middle Load Supplier)
30%
Gas CC Coal
Fig. 7.1.11-5 The Role of Power Plant and Composition in Java-Bali System

7-128
0.0
2.0
4.0
6.0
8.0
10.0
12.0
14.0
16.0
0.00
0.10
0.20
0.30
0.40
0.50
0.60
0.70
0.80
0.90
1.00
Plant Factor
Sel
ling
Pric
e (¢
/kW
h)
Geothermal (55MW)Coal (50MW)Gas CC (50MW)Diesel (10MW)Hydro (20MW)
Normal Duration Curve (Minahasa System (2004))
0.00
0.10
0.20
0.30
0.40
0.50
0.60
0.70
0.80
0.90
1.00
0.0 0.1 0.2 0.3 0.4 0.5 0.6 0.7 0.8 0.9 1.0
Hour (%)
Dem
and
(%)
Gas CC, Gas Turbine,Diesel etc.
(Peak Load Supplier)40%
Coal(Middle Load Supplier)
20%
Geothermal, Hydro(Base Load Supplier)
40%
GeothermalGas CC Coal
Fig. 7.1.11-6 The Role of Power Plant and Composition in Small-Scale System (Minahasa System Example)

7-129
(MW)Difference
(c)-(d)Sumetra
Peak Demand 2,531 - 10,176 10,176 -Minimum Demand 1,012 - 6,170 6,170 -Power Plant 3,352 (100%) 10,357 (100%) 12,530 (100%) 12,530 (100%) 0
Hydro Power 566 (17%) 1,062 (10%) 1,628 (13%) 1,628 (13%) 0Gas Turbine 377 (11%) 1,080 (10%) 1,297 (10%) 1,297 (10%) 0Combined cycle 818 (24%) 900 (9%) 1,372 (11%) 1,372 (11%) 0Steam 745 (22%) 2,597 (25%) 3,027 (24%) 7,195 (57%) -4,168Geothermal 2 (0%) 4,718 (46%) 4,720 (38%) 552 (4%) 4,168Diesel 844 (25%) 0 (0%) 486 (4%) 486 (4%) 0Nuclear 0 (0%) 0 (0%) 0 (0%) 0 (0%) 0
Java-BaliPeak Demand 14,310 - 59,107 59,107 -Minimum Demand 5,724 - 21,543 21,543 -Power Plant 15,908 (100%) 54,555 (100%) 68,092 (100%) 68,092 (100%) 0
Hydro Power 2,409 (15%) 1,000 (2%) 3,409 (5%) 3,409 (5%) 0Gas Turbine 927 (6%) 2,800 (5%) 3,550 (5%) 3,550 (5%) 0Combined cycle 5,683 (36%) 14,015 (26%) 18,616 (27%) 18,616 (27%) 0Steam 6,000 (38%) 23,740 (44%) 28,598 (42%) 28,938 (42%) -340Geothermal 785 (5%) 3,000 (5%) 3,835 (6%) 1,495 (2%) 2,340Diesel 103 (1%) 0 (0%) 84 (0%) 84 (0%) 0Nuclear 0 (0%) 10,000 (18%) 10000 (15%) 12000 (18%) -2,000
Surawesi & GorontaloPeak Demand 242 - 1,336 1,336 -Minimum Demand 97 - 534 534 -Power Plant 344 (100%) 1,540 (100%) 1,661 (100%) 1,661 (100%) 0
Hydro Power 61 (18%) 50 (3%) 111 (7%) 111 (7%) 0Gas Turbine 0 (0%) 290 (19%) 290 (17%) 290 (17%) 0Combined cycle 0 (0%) 0 (0%) 0 (0%) 0 (0%) 0Steam 0 (0%) 645 (42%) 645 (39%) 950 (57%) -305Geothermal 20 (6%) 515 (33%) 535 (32%) 230 (14%) 305Diesel 263 (77%) 40 (3%) 80 (5%) 80 (5%) 0Nuclear 0 (0%) 0 (0%) 0 (0%) 0 (0%) 0
S_SulawesiPeak Demand 490 - 2,031 2,031 -Minimum Demand 196 - 812 812 -Power Plant 464 (100%) 2,181 (100%) 2,399 (100%) 2,399 (100%) 0
Hydro Power 129 (28%) 370 (17%) 499 (21%) 499 (21%) 0Gas Turbine 123 (26%) 465 (21%) 498 (21%) 498 (21%) 0Combined cycle 0 (0%) 240 (11%) 240 (10%) 240 (10%) 0Steam 25 (5%) 826 (38%) 833 (35%) 1,057 (44%) -224Geothermal 0 (0%) 224 (10%) 224 (9%) 0 (0%) 224Diesel 187 (40%) 56 (3%) 106 (4%) 106 (4%) 0Nuclear 0 (0%) 0 (0%) 0 (0%) 0 (0%) 0
NTBPeak Demand 105 - 568 568 -Minimum Demand 42 - 227 227 -Power Plant 148 (100%) 585 (100%) 679 (100%) 679 (100%) 0
Hydro Power 0 (0%) 1 (0%) 1 (0%) 1 (0%) 0Gas Turbine 0 (0%) 140 (24%) 140 (21%) 155 (23%) -15Combined cycle 0 (0%) 0 (0%) 0 (0%) 0 (0%) 0Steam 0 (0%) 367 (63%) 367 (54%) 367 (54%) 0Geothermal 0 (0%) 30 (5%) 30 (4%) 0 (0%) 30Diesel 147 (100%) 47 (8%) 140 (21%) 155 (23%) -15Nuclear 0 (0%) 0 (0%) 0 (0%) 0 (0%) 0
NTTPeak Demand 62 - 313 313 -Minimum Demand 25 - 125 125 -Power Plant 128 (100%) 329 (100%) 374 (100%) 374 (100%) 0
Hydro Power 0 (0%) 12 (4%) 12 (3%) 12 (3%) 0Gas Turbine 0 (0%) 0 (0%) 0 (0%) 0 (0%) 0Combined cycle 0 (0%) 0 (0%) 0 (0%) 0 (0%) 0Steam 0 (0%) 114 (35%) 114 (30%) 221 (59%) -107Geothermal 0 (0%) 116 (35%) 116 (31%) 9 (2%) 107Diesel 128 (100%) 87 (26%) 132 (35%) 132 (35%) 0Nuclear 0 (0%) 0 (0%) 0 (0%) 0 (0%) 0
MalukuPeak Demand 78 - 184 184 -Minimum Demand 31 - 74 74 -Power Plant 170 (100%) 202 (100%) 258 (100%) 258 (100%) 0
Hydro Power 0 (0%) 0 (0%) 0 (0%) 0 (0%) 0Gas Turbine 0 (0%) 20 (10%) 20 (8%) 40 (16%) -20Combined cycle 0 (0%) 0 (0%) 0 (0%) 0 (0%) 0Steam 0 (0%) 92 (46%) 92 (36%) 92 (36%) 0Geothermal 0 (0%) 40 (20%) 40 (16%) 0 (0%) 40Diesel 170 (100%) 50 (25%) 106 (41%) 126 (49%) -20Nuclear 0 (0%) 0 (0%) 0 (0%) 0 (0%) 0
TotalPeak Demand 17,818 - 73,715 73,715 -Minimum Demand 7,127 - 29,486 29,486 -Power Plant 20,512 (100%) 69,749 (100%) 85,993 (100%) 85,993 (100%) 0
Hydro Power 3,166 (15%) 2,495 (4%) 5,661 (7%) 5,661 (7%) 0Gas Turbine 1,427 (7%) 4,795 (7%) 5,796 (7%) 5,830 (7%) -35Combined cycle 6,501 (32%) 15,155 (22%) 20,228 (24%) 20,228 (24%) 0Steam 6,770 (33%) 28,381 (41%) 33,675 (39%) 38,819 (45%) -5,144Geothermal 807 (4%) 8,643 (12%) 9,500 (11%) 2,286 (3%) 7,214Diesel 1,841 (9%) 279 (0%) 1,133 (1%) 1,169 (1%) -35Nuclear 0 (0%) 10,000 (14%) 10,000 (12%) 12,000 (14%) -2,000
(Note) *1 from PLN Statistics 2004, Pertamina Geothermal Energy Boucher *2 Geothermal capacity is increased according to development plan. Other power plant capacities are adjusted considering the role of plant type. *3 (C) is not equall to (a)+(b) due to decommission of power plants.
RUKN (2025) (d)Existing (2004) (a)(*1)
System New Plant (2005-2025)(b) (*2)
Total (as of 2025) (C)(*3)
Table 7.1.11-5 Power Plant Mix in Geothermal Development Scenario in Master Plan

7-130
Power Plant MW Difference
Hydro Power MW 3,199 (14.6%) 2,666 (3.5%) 5,865 (6.3%) 5,865 (6.3%) 0Gas Turbine MW 1,494 (6.8%) 6,200 (8.1%) 7,251 (7.8%) 7,285 (7.8%) -35Combined cycle MW 6,561 (30.0%) 16,665 (21.9%) 21,756 (23.3%) 21,756 (23.3%) 0Steam MW 6,900 (31.5%) 31,493 (41.3%) 36,838 (39.5%) 41,982 (45.0%) -5,144Geothermal MW 807 (3.7%) 8,643 (11.3%) 9,500 (10.2%) 2,286 (2.5%) 7,214Diesel MW 2,921 (13.4%) 547 (0.7%) 2,054 (2.2%) 2,089 (2.2%) -35Nuclear MW 0 (0.0%) 10,000 (13.1%) 10,000 (10.7%) 12,000 (12.9%) -2,000Total MW 21,882 (100.0%) 76,214 (100.0%) 93,263 (100.0%) 93,263 (100.0%) 0(Note) *1 from PLN Statistics 2004, Pertamina Geothermal Energy Boucher
*2 Geothermal capacity is increased according to development plan. Other power plant capacities are adjusted considering the role of plant type. *3 (C) is not equal to (a)+(b) due to decommission of power plants.
RUKN (2025)Existing (2004) (a)(*1)
New Plant (2005-2025)(b) (*2)
Total (as of 2025) (c)(*3)
Table 7.1.11-6 Power Plant Mix in Geothermal Development Scenario in Master Plan (2025)

7-131
Revised Plan (All Indonesia)
0
10,000
20,000
30,000
40,000
50,000
60,000
70,000
80,000
90,000
100,000
2005 2006 2007 2008 2009 2010 2011 2012 2013 2014 2015 2016 2017 2018 2019 2020 2021 2022 2023 2024 2025
YEAR
DE
MA
ND
& P
LAN
T C
AP
AC
ITY
(MW
)
DieselSteamCombined cycleGas TurbineHydro PowerNuclearGeothermalAdditional Peak Power Demand
RUKN2005 base
0
10,000
20,000
30,000
40,000
50,000
60,000
70,000
80,000
90,000
100,000
2005 2006 2007 2008 2009 2010 2011 2012 2013 2014 2015 2016 2017 2018 2019 2020 2021 2022 2023 2024 2025
YEAR
DE
MA
ND
& P
LAN
T C
AP
AC
ITY
(MW
)
DieselSteamCombined cycleGas TurbineHydro PowerNuclearGeothermalAdditional Peak Power Demand
Fig. 7.1.11-7 Power Plant Development Plan by Geothermal Development Scenario
Fig. 7.1.11-8 Power Plant Development Plan by RUKN (Fig 7.a re-posted)

7-132
Energy Mix in Electricity Production (2025) <Revised Plan>
24.6%
39.3%
12.9%
14.6%
3.8%
1.3%
3.5%
Hydro Power Gas Turbine Combined cycle SteamDiesel Nuclear Geothermal
542,600 GWh
Energy Mix in Electricity Production (2025) <RUKN Base>
27.1%
51.3%
7.1%
6.9%
3.7% 3.8% 0.0%
Hydro Power Gas Turbine Combined cycle Steam
Diesel Nuclear Geothermal
542,600 GWh
Fig. 7.1.11-9 Energy Mix in Electricity Production in 2025 by Geothermal Development Scenario
Fig. 7.1.11-10 Energy Mix in Electricity Production in 2025 by RUKN (Fig. 7.1.11-3 re-posted)

7-133
Table 7.1.11-7 Electric Power Development Plan in Geothermal Power Development Master Plan (Sumatra)
Sumatra System Demand & Supply Balance Table
項目 Item Unit 2007 2008 2009 2010 2011 2012 2013 2014 2015 2016 2017 2018 2019 2020 2021 2022 2023 2024 2025 New Plant Total電力需要 Energy Demand GWh 14,260 15,421 16,692 18,088 19,474 20,997 22,667 24,502 26,521 28,827 31,045 33,306 35,718 38,333 41,070 43,989 47,099 50415 53950増加率 Growth 8.1% 8.1% 8.2% 8.4% 7.7% 7.8% 8.0% 8.1% 8.2% 8.7% 7.7% 7.3% 7.2% 7.3% 7.1% 7.1% 7.1% 7.0% 7.0%負荷率 Annual Road Factor % 63% 64% 64% 65% 65% 65% 66% 66% 66% 66% 66% 66% 66% 67% 67% 67% 67% 67% 67%発電電力量 Energy Generation GWh 16,000 17,303 18,728 20,294 21,849 23,559 25,432 27,492 29,756 32,056 34,522 37,036 39,718 42,627 45,464 48,695 52,138 55,809 59,722最大電力 Peak Power Demand MW 2,899 3,086 3,340 3,564 3,837 4,137 4,399 4,755 5,147 5,545 5,971 6,406 6,870 7,263 7,746 8,297 8,883 9,509 10,176増加率 Growth 8.1% 6.5% 8.2% 6.7% 7.7% 7.8% 6.3% 8.1% 8.2% 7.7% 7.7% 7.3% 7.2% 5.7% 6.7% 7.1% 7.1% 7.0% 7.0%設備容量(既設) Installed Generation Capacity (Exist.) MW 3,229 3,229 3,229 3,229 3,229 3,229 3,132 3,038 2,947 2,859 2,773 2,690 2,609 2,531 2,455 2,381 2,310 2,240 2,173RUKN (2005)電源開発計画 Power Dev't Plan by RUKN (2005)
発電所増設計画(Committed) Power Plant Const. Plan (Committed) MW 480 135 260 200 180 154 136 0 0 0 0 0 0 0 0 0 0 0 0PLN分 PLN MW 410 100 200 0 0 154 136 0 0 0 0 0 0 0 0 0 0 0 0
水力 Hydro Power MW 210 154 86ガスタービン Gas Turbine MW 100 50コンバインドサイクル Combined cycle MW汽力 Steam MW 100 100 200地熱 Geothermal MWディーゼル Diesel MW
IPP IPP MW 70 35 60 200 180 0 0 0 0 0 0 0 0 0 0 0 0 0 0水力 Hydro Power MW 180ガスタービン Gas Turbine MW 60コンバインドサイクル Combined cycle MW汽力 Steam MW 70 35 200地熱 Geothermal MWディーゼル Diesel MW
新規増設計画 New Power Plant Plan MW 100 100 100 310 155 200 310 350 550 555 400 1,060 660 400 660 310 1,060 760 670 10,357 (100.0%)水力 Hydro Power MW 350 1,062 (10.3%)ガスタービン Gas Turbine MW 100 50 200 200 200 100 1,080 (10.4%)コンバインドサイクル Combined cycle MW 100 100 100 200 400 900 (8.7%)汽力 Steam MW 100 100 100 200 200 400 300 400 660 660 400 660 660 660 560 6,765 (65.3%)地熱 Geothermal MW 110 55 110 55 110 110 550 (5.3%)ディーゼル Diesel MW 0 (0.0%)原子力 Nuclear MW 0 (0.0%)
増設設備量累計 New Power Plant Capacity (cum.) MW 682 917 1,277 1,787 2,122 2,476 2,922 3,272 3,822 4,377 4,777 5,837 6,497 6,897 7,557 7,867 8,927 9,687 10,357系統設備量合計 Total Installed Generation Capacity MW 3,911 4,146 4,506 5,016 5,351 5,705 6,054 6,310 6,769 7,236 7,550 8,527 9,106 9,428 10,012 10,248 11,237 11,927 12,530予備率 Reserve Margin % 35% 34% 35% 41% 39% 38% 38% 33% 32% 30% 26% 33% 33% 30% 29% 24% 27% 25% 23%
地熱発電所(既設) Geothermal Power Plant (Exist.) MW 2 2 2 2 2 2 2 2 2 2 2 2 2 2 2 2 2 2 2修正発電所開発計画 Revised Power Plant Development Plan
発電所増設計画(Committed) Power Plant Const. Plan (Committed) MW新規増設計画 New Power Plant Plan MW 588 235 360 400 500 534 196 735 260 420 590 610 690 660 535 585 1,175 570 612 10,357 (100.0%)
水力 Hydro Power MW 210 180 154 86 350 1,062 (10.3%)ガスタービン Gas Turbine MW 200 60 50 50 200 200 200 100 1,080 (10.4%)コンバインドサイクル Combined cycle MW 100 100 100 200 400 900 (8.7%)汽力 Steam MW 170 235 300 300 60 60 110 80 110 180 180 110 180 180 180 162 2,597 (25.1%)地熱 Geothermal MW 8 220 320 385 140 480 30 510 550 355 385 595 290 450 4,718 (45.6%)ディーゼル Diesel MW 0 (0.0%)原子力 Nuclear MW 0 (0.0%)
増設設備量累計 New Power Plant Capacity (cum.) MW 690 925 1,285 1,685 2,185 2,719 2,915 3,650 3,910 4,330 4,920 5,530 6,220 6,880 7,415 8,000 9,175 9,745 10,357 系統設備量合計 Total Installed Generation Capacity MW 3,919 4,154 4,514 4,914 5,414 5,948 6,047 6,688 6,857 7,189 7,693 8,220 8,829 9,411 9,870 10,381 11,485 11,985 12,530予備率 Reserve Margin % 35% 35% 35% 38% 41% 44% 37% 41% 33% 30% 29% 28% 29% 30% 27% 25% 29% 26% 23%

7-134
Table 7.1.11-8 Electric Power Development Plan in Geothermal Power Development Master Plan (Java-Bali)
Java-Madura-Bali System Demand & Supply Balance Table
項目 Item Unit 2007 2008 2009 2010 2011 2012 2013 2014 2015 2016 2017 2018 2019 2020 2021 2022 2023 2024 2025 New Plant Total電力需要 Energy Demand GWh 93,779 101,166 109,269 118,418 128,131 138,576 149,861 162,085 175,350 189,013 203,243 218,143 233,814 250,114 267,400 285,756 305,275 326065 348239増加率 Growth 7.7% 7.9% 8.0% 8.4% 8.2% 8.2% 8.1% 8.2% 8.2% 7.8% 7.5% 7.3% 7.2% 7.0% 6.9% 6.9% 6.8% 6.8% 6.8%負荷率 Annual Road Factor % 72% 73% 73% 73% 74% 74% 74% 74% 74% 75% 75% 75% 75% 75% 76% 76% 76% 76% 76%発電電力量 Energy Generation GWh 107,274 115,680 124,861 135,264 146,262 158,125 170,889 183,208 198,201 213,585 229,665 246,501 264,210 282,628 302,162 322,904 344,961 368,453 393,511最大電力 Peak Power Demand MW 17,008 18,090 19,525 21,152 22,563 24,393 26,362 28,262 30,575 32,509 34,957 37,519 40,215 43,018 45,386 48,502 51,815 55,343 59,107増加率 Growth 7.1% 6.4% 7.9% 8.3% 6.7% 8.1% 8.1% 7.2% 8.2% 6.3% 7.5% 7.3% 7.2% 7.0% 5.5% 6.9% 6.8% 6.8% 6.8%設備容量(既設) Installed Generation Capacity (Exist.) MW 18,658 18,658 18,658 18,658 18,658 18,471 18,287 18,288 18,289 17,740 17,208 16,692 16,191 15,705 15,234 14,777 14,334 13,904 13,487RUKN (2005)電源開発計画 Power Dev't Plan by RUKN (2005)
発電所増設計画(Committed) Power Plant Const. Plan (Committed) MW 350 1,525 720 0 0 0 0 0 0 0 0 0 0 0 0 0 0 0 0PLN分 PLN MW 60 945 720 0 0 0 0 0 0 0 0 0 0 0 0 0 0 0 0
水力 Hydro Power MWガスタービン Gas Turbine MWコンバインドサイクル Combined cycle MW 50 945 720汽力 Steam MW地熱 Geothermal MW 10ディーゼル Diesel MW
IPP IPP MW 290 580 0 0 0 0 0 0 0 0 0 0 0 0 0 0 0 0 0水力 Hydro Power MWガスタービン Gas Turbine MWコンバインドサイクル Combined cycle MW 400汽力 Steam MW地熱 Geothermal MW 290 180ディーゼル Diesel MW
新規増設計画 New Power Plant Plan MW 375 0 1,230 2,380 2,330 1,890 2,360 2,320 2,720 1,320 2,720 4,640 4,640 4,320 0 2,640 3,920 4,320 4,920 54,555 (100.0%)水力 Hydro Power MW 500 500 1,000 (1.8%)ガスタービン Gas Turbine MW 200 400 200 400 400 600 600 2,800 (5.1%)コンバインドサイクル Combined cycle MW 375 730 1,460 730 730 1,000 1,000 1,000 1,000 1,000 1,000 1,000 14,015 (25.7%)汽力 Steam MW 500 660 1,200 660 660 1,320 1,320 1,320 1,320 2,640 2,640 1,320 2,640 1,320 1,320 1,320 24,080 (44.1%)地熱 Geothermal MW 60 660 (1.2%)ディーゼル Diesel MW 0 (0.0%)原子力 Nuclear MW 1,000 1,000 2,000 2,000 2,000 2,000 2,000 12,000 (22.0%)
増設設備量累計 New Power Plant Capacity (cum.) MW 3,640 5,165 7,115 9,495 11,825 13,715 16,075 18,395 21,115 22,435 25,155 29,795 34,435 38,755 38,755 41,395 45,315 49,635 54,555系統設備量合計 Total Installed Generation Capacity MW 22,298 23,823 25,773 28,153 30,483 32,186 34,362 36,683 39,404 40,175 42,363 46,487 50,626 54,460 53,989 56,172 59,649 63,539 68,042予備率 Reserve Margin % 31% 32% 32% 33% 35% 32% 30% 30% 29% 24% 21% 24% 26% 27% 19% 16% 15% 15% 15%
地熱発電所(既設) Geothermal Power Plant (Exist.) MW 835 835 835 835 835 835 835 835 835 835 835 835 835 835 835 835 835 835 835修正発電所開発計画 Revised Power Plant Development Plan
発電所増設計画(Committed) Power Plant Const. Plan (Committed) MW新規増設計画 New Power Plant Plan MW 425 1,625 1,940 2,310 2,370 2,000 2,350 2,300 2,710 1,675 2,940 4,700 4,065 4,545 235 2,820 4,010 4,300 4,467 54,555 (100.0%)
水力 Hydro Power MW 500 500 1,000 (1.8%)ガスタービン Gas Turbine MW 200 400 200 400 400 600 600 2,800 (5.1%)コンバインドサイクル Combined cycle MW 425 1,345 1,450 1,460 730 730 1,000 1,000 1,000 1,000 1,000 1,000 1,000 14,015 (25.7%)汽力 Steam MW 490 650 1,180 650 650 1,300 1,300 1,300 1,300 2,600 2,600 1,300 2,600 1,300 1,300 1,327 23,740 (43.5%)地熱 Geothermal MW 280 60 120 10 375 240 100 465 245 235 220 110 540 3,000 (5.5%)ディーゼル Diesel MW 0 (0.0%)原子力 Nuclear MW 1,000 1,000 1,000 2,000 2,000 2,000 1,000 10,000 (18.3%)
増設設備量累計 New Power Plant Capacity (cum.) MW 3,193 4,818 6,758 9,068 11,438 13,438 15,788 18,088 20,798 22,473 25,413 30,113 34,178 38,723 38,958 41,778 45,788 50,088 54,555 系統設備量合計 Total Installed Generation Capacity MW 21,851 23,476 25,416 27,726 30,096 31,909 34,075 36,376 39,087 40,213 42,621 46,805 50,369 54,428 54,192 56,555 60,122 63,992 68,042予備率 Reserve Margin % 28% 30% 30% 31% 33% 31% 29% 29% 28% 24% 22% 25% 25% 27% 19% 17% 16% 16% 15%

7-135
Table 7.1.11-9 Electric Power Development Plan in Geothermal Power Development Master Plan (North and Central Sulawesi and Gorontalo)
North / Central Sulawesi & Gorontalo System Demand & Supply Balance Table
項目 Item Unit 2007 2008 2009 2010 2011 2012 2013 2014 2015 2016 2017 2018 2019 2020 2021 2022 2023 2024 2025 New Plant Total電力需要 Energy Demand GWh 1,035 1,114 1,206 1,313 1,429 1,562 1,711 1,880 2,069 2,271 2,495 2,742 3,017 3,314 3,646 4,015 4,426 4883 5393増加率 Growth 6.9% 7.6% 8.3% 8.9% 8.8% 9.3% 9.5% 9.9% 10.1% 9.8% 9.9% 9.9% 10.0% 9.8% 10.0% 10.1% 10.2% 10.3% 10.4%負荷率 Annual Road Factor % 51% 52% 52% 52% 53% 53% 53% 54% 55% 55% 55% 55% 55% 55% 55% 55% 55% 55% 55%発電電力量 Energy Generation GWh 1,132 1,219 1,319 1,436 1,564 1,708 1,872 2,056 2,264 2,507 2,779 3,083 3,421 3,791 4,207 4,673 5,196 5,782 6,439最大電力 Peak Power Demand MW 253 268 290 315 337 368 403 435 470 520 577 640 710 787 873 970 1,078 1,200 1,336増加率 Growth 6.3% 5.9% 8.2% 8.6% 7.0% 9.2% 9.5% 7.9% 8.0% 10.6% 11.0% 10.9% 10.9% 10.8% 10.9% 11.1% 11.1% 11.3% 11.3%設備容量(既設) Installed Generation Capacity (Exist.) MW 214 164 164 164 164 164 164 164 164 159 154 150 145 141 137 133 129 125 121RUKN (2005)電源開発計画 Power Dev't Plan by RUKN (2005)
発電所増設計画(Committed) Power Plant Const. Plan (Committed) MW 6 0 23 120 0 0 55 0 55 0 0 0 0 0 0 0 0 0 0PLN分 PLN MW 6 0 23 20 0 0 0 0 0 0 0 0 0 0 0 0 0 0 0
水力 Hydro Power MW 1ガスタービン Gas Turbine MWコンバインドサイクル Combined cycle MW汽力 Steam MW地熱 Geothermal MW 20 20ディーゼル Diesel MW 5 3
IPP IPP MW 0 0 0 100 0 0 55 0 55 0 0 0 0 0 0 0 0 0 0水力 Hydro Power MWガスタービン Gas Turbine MWコンバインドサイクル Combined cycle MW汽力 Steam MW 100 55 55地熱 Geothermal MWディーゼル Diesel MW
新規増設計画 New Power Plant Plan MW 27 40 10 0 20 30 0 40 10 30 50 120 70 100 100 105 255 100 100 1,540 (100.0%)水力 Hydro Power MW 17 50 (3.2%)ガスタービン Gas Turbine MW 20 10 20 30 50 50 100 290 (18.8%)コンバインドサイクル Combined cycle MW 0 (0.0%)汽力 Steam MW 20 10 30 20 50 100 100 100 200 100 950 (61.7%)地熱 Geothermal MW 10 10 20 20 55 55 210 (13.6%)ディーゼル Diesel MW 10 40 (2.6%)原子力 Nuclear MW 0 (0.0%)
増設設備量累計 New Power Plant Capacity (cum.) MW 108 148 180 300 320 350 405 445 510 540 590 710 780 880 980 1,085 1,340 1,440 1,540系統設備量合計 Total Installed Generation Capacity MW 322 312 344 464 484 514 569 609 674 699 744 860 925 1,021 1,117 1,218 1,469 1,565 1,661予備率 Reserve Margin % 27% 16% 19% 47% 44% 40% 41% 40% 43% 34% 29% 34% 30% 30% 28% 26% 36% 30% 24%
地熱発電所(既設) Geothermal Power Plant (Exist.) MW 20 20 20 20 20 20 20 20 20 20 20 20 20 20 20 20 20 20 20修正発電所開発計画 Revised Power Plant Development Plan
発電所増設計画(Committed) Power Plant Const. Plan (Committed) MW新規増設計画 New Power Plant Plan MW 53 60 13 120 50 20 30 60 40 30 30 110 130 60 135 80 205 100 143 1,540 (100.0%)
水力 Hydro Power MW 18 50 (3.2%)ガスタービン Gas Turbine MW 20 10 20 30 50 50 100 290 (18.8%)コンバインドサイクル Combined cycle MW 0 (0.0%)汽力 Steam MW 20 10 100 20 30 40 30 100 60 60 30 130 8 645 (41.9%)地熱 Geothermal MW 20 20 20 40 40 10 80 75 75 135 515 (33.4%)ディーゼル Diesel MW 15 3 40 (2.6%)原子力 Nuclear MW 0 (0.0%)
増設設備量累計 New Power Plant Capacity (cum.) MW 124 184 197 317 367 387 417 477 517 547 577 687 817 877 1,012 1,092 1,297 1,397 1,540 系統設備量合計 Total Installed Generation Capacity MW 338 348 361 481 531 551 581 641 681 706 731 837 962 1,018 1,149 1,225 1,426 1,522 1,661予備率 Reserve Margin % 34% 30% 24% 53% 58% 50% 44% 47% 45% 36% 27% 31% 35% 29% 32% 26% 32% 27% 24%
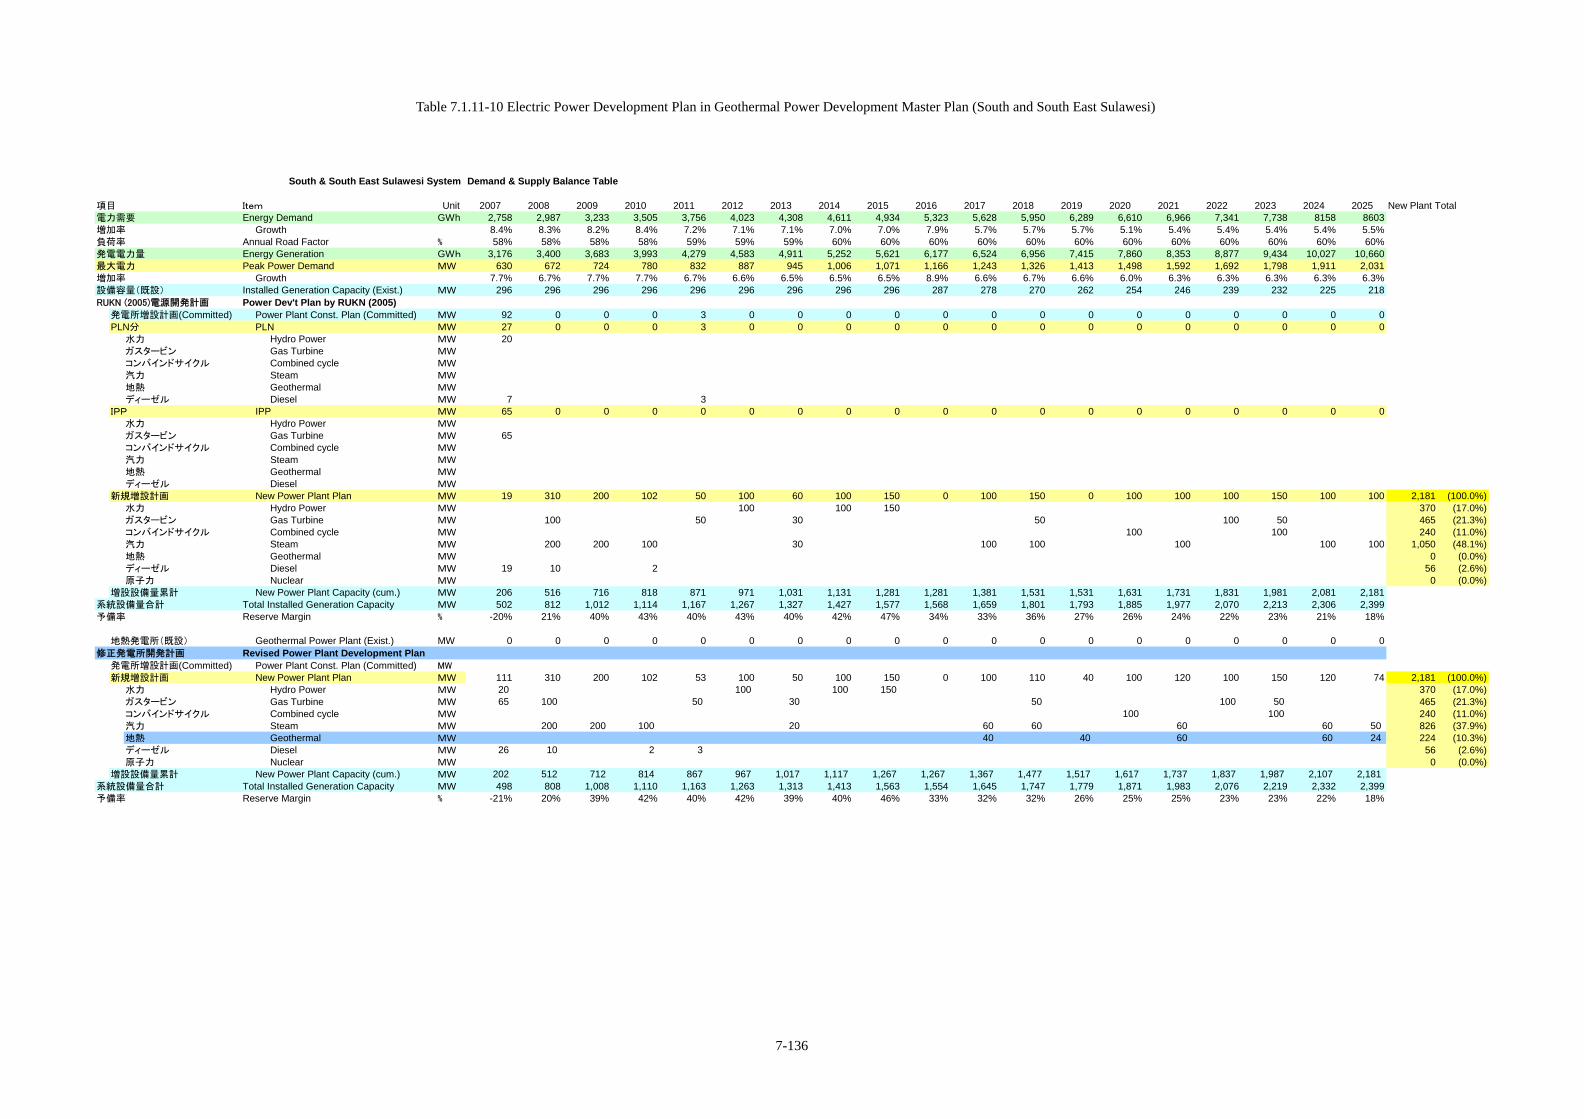
7-136
Table 7.1.11-10 Electric Power Development Plan in Geothermal Power Development Master Plan (South and South East Sulawesi)
South & South East Sulawesi System Demand & Supply Balance Table
項目 Item Unit 2007 2008 2009 2010 2011 2012 2013 2014 2015 2016 2017 2018 2019 2020 2021 2022 2023 2024 2025 New Plant Total電力需要 Energy Demand GWh 2,758 2,987 3,233 3,505 3,756 4,023 4,308 4,611 4,934 5,323 5,628 5,950 6,289 6,610 6,966 7,341 7,738 8158 8603増加率 Growth 8.4% 8.3% 8.2% 8.4% 7.2% 7.1% 7.1% 7.0% 7.0% 7.9% 5.7% 5.7% 5.7% 5.1% 5.4% 5.4% 5.4% 5.4% 5.5%負荷率 Annual Road Factor % 58% 58% 58% 58% 59% 59% 59% 60% 60% 60% 60% 60% 60% 60% 60% 60% 60% 60% 60%発電電力量 Energy Generation GWh 3,176 3,400 3,683 3,993 4,279 4,583 4,911 5,252 5,621 6,177 6,524 6,956 7,415 7,860 8,353 8,877 9,434 10,027 10,660最大電力 Peak Power Demand MW 630 672 724 780 832 887 945 1,006 1,071 1,166 1,243 1,326 1,413 1,498 1,592 1,692 1,798 1,911 2,031増加率 Growth 7.7% 6.7% 7.7% 7.7% 6.7% 6.6% 6.5% 6.5% 6.5% 8.9% 6.6% 6.7% 6.6% 6.0% 6.3% 6.3% 6.3% 6.3% 6.3%設備容量(既設) Installed Generation Capacity (Exist.) MW 296 296 296 296 296 296 296 296 296 287 278 270 262 254 246 239 232 225 218RUKN (2005)電源開発計画 Power Dev't Plan by RUKN (2005)
発電所増設計画(Committed) Power Plant Const. Plan (Committed) MW 92 0 0 0 3 0 0 0 0 0 0 0 0 0 0 0 0 0 0PLN分 PLN MW 27 0 0 0 3 0 0 0 0 0 0 0 0 0 0 0 0 0 0
水力 Hydro Power MW 20ガスタービン Gas Turbine MWコンバインドサイクル Combined cycle MW汽力 Steam MW
地熱 Geothermal MWディーゼル Diesel MW 7 3
IPP IPP MW 65 0 0 0 0 0 0 0 0 0 0 0 0 0 0 0 0 0 0水力 Hydro Power MW
ガスタービン Gas Turbine MW 65コンバインドサイクル Combined cycle MW汽力 Steam MW地熱 Geothermal MW
ディーゼル Diesel MW新規増設計画 New Power Plant Plan MW 19 310 200 102 50 100 60 100 150 0 100 150 0 100 100 100 150 100 100 2,181 (100.0%)
水力 Hydro Power MW 100 100 150 370 (17.0%)ガスタービン Gas Turbine MW 100 50 30 50 100 50 465 (21.3%)コンバインドサイクル Combined cycle MW 100 100 240 (11.0%)汽力 Steam MW 200 200 100 30 100 100 100 100 100 1,050 (48.1%)地熱 Geothermal MW 0 (0.0%)ディーゼル Diesel MW 19 10 2 56 (2.6%)原子力 Nuclear MW 0 (0.0%)
増設設備量累計 New Power Plant Capacity (cum.) MW 206 516 716 818 871 971 1,031 1,131 1,281 1,281 1,381 1,531 1,531 1,631 1,731 1,831 1,981 2,081 2,181系統設備量合計 Total Installed Generation Capacity MW 502 812 1,012 1,114 1,167 1,267 1,327 1,427 1,577 1,568 1,659 1,801 1,793 1,885 1,977 2,070 2,213 2,306 2,399予備率 Reserve Margin % -20% 21% 40% 43% 40% 43% 40% 42% 47% 34% 33% 36% 27% 26% 24% 22% 23% 21% 18%
地熱発電所(既設) Geothermal Power Plant (Exist.) MW 0 0 0 0 0 0 0 0 0 0 0 0 0 0 0 0 0 0 0修正発電所開発計画 Revised Power Plant Development Plan
発電所増設計画(Committed) Power Plant Const. Plan (Committed) MW新規増設計画 New Power Plant Plan MW 111 310 200 102 53 100 50 100 150 0 100 110 40 100 120 100 150 120 74 2,181 (100.0%)
水力 Hydro Power MW 20 100 100 150 370 (17.0%)ガスタービン Gas Turbine MW 65 100 50 30 50 100 50 465 (21.3%)コンバインドサイクル Combined cycle MW 100 100 240 (11.0%)汽力 Steam MW 200 200 100 20 60 60 60 60 50 826 (37.9%)地熱 Geothermal MW 40 40 60 60 24 224 (10.3%)ディーゼル Diesel MW 26 10 2 3 56 (2.6%)原子力 Nuclear MW 0 (0.0%)
増設設備量累計 New Power Plant Capacity (cum.) MW 202 512 712 814 867 967 1,017 1,117 1,267 1,267 1,367 1,477 1,517 1,617 1,737 1,837 1,987 2,107 2,181 系統設備量合計 Total Installed Generation Capacity MW 498 808 1,008 1,110 1,163 1,263 1,313 1,413 1,563 1,554 1,645 1,747 1,779 1,871 1,983 2,076 2,219 2,332 2,399予備率 Reserve Margin % -21% 20% 39% 42% 40% 42% 39% 40% 46% 33% 32% 32% 26% 25% 25% 23% 23% 22% 18%

7-137
Table 7.1.11-11 Electric Power Development Plan in Geothermal Power Development Master Plan (West Nusa Tenggara)
NTB System Demand & Supply Balance Table
項目 Item Unit 2007 2008 2009 2010 2011 2012 2013 2014 2015 2016 2017 2018 2019 2020 2021 2022 2023 2024 2025 New Plant Total電力需要 Energy Demand GWh 533 590 652 721 791 868 953 1,036 1,126 1,215 1,312 1,416 1,529 1,639 1,753 1,876 2,008 2149 2300増加率 Growth 10.6% 10.7% 10.5% 10.6% 9.7% 9.7% 9.8% 8.7% 8.7% 7.9% 8.0% 7.9% 8.0% 7.2% 7.0% 7.0% 7.0% 7.0% 7.0%負荷率 Annual Road Factor % 46% 46% 46% 46% 46% 46% 46% 46% 46% 47% 48% 49% 50% 51% 52% 53% 54% 55% 56%発電電力量 Energy Generation GWh 591 654 724 800 878 964 1,058 1,150 1,250 1,361 1,482 1,615 1,758 1,901 2,051 2,214 2,389 2,579 2,783最大電力 Peak Power Demand MW 146 162 179 198 218 239 262 285 310 331 353 376 402 426 451 477 505 535 568増加率 Growth 10.6% 11.0% 10.5% 10.6% 10.1% 9.6% 9.6% 8.8% 8.8% 6.8% 6.6% 6.5% 6.9% 6.0% 5.9% 5.8% 5.9% 5.9% 6.2%設備容量(既設) Installed Generation Capacity (Exist.) MW 162 158 153 148 144 139 135 131 127 124 120 117 113 110 106 103 100 97 94RUKN (2005)電源開発計画 Power Dev't Plan by RUKN (2005)
発電所増設計画(Committed) Power Plant Const. Plan (Committed) MW 26 0 30 0 0 0 0 0 0 0 0 0 0 0 0 0 0 0 0PLN分 PLN MW 26 0 30 0 0 0 0 0 0 0 0 0 0 0 0 0 0 0 0
水力 Hydro Power MW 1ガスタービン Gas Turbine MW 20コンバインドサイクル Combined cycle MW汽力 Steam MW
地熱 Geothermal MWディーゼル Diesel MW 25 10
IPP IPP MW 0 0 0 0 0 0 0 0 0 0 0 0 0 0 0 0 0 0 0水力 Hydro Power MW
ガスタービン Gas Turbine MWコンバインドサイクル Combined cycle MW汽力 Steam MW地熱 Geothermal MW
ディーゼル Diesel MW新規増設計画 New Power Plant Plan MW 2 25 0 37 25 40 40 30 40 0 20 65 0 60 10 20 20 60 20 585 (100.0%)
水力 Hydro Power MW 1 (0.2%)ガスタービン Gas Turbine MW 20 20 10 20 20 20 20 155 (26.5%)コンバインドサイクル Combined cycle MW 0 (0.0%)汽力 Steam MW 25 37 25 20 20 20 20 20 40 60 20 60 367 (62.8%)地熱 Geothermal MW 0 (0.0%)ディーゼル Diesel MW 2 5 10 62 (10.5%)原子力 Nuclear MW 0 (0.0%)
増設設備量累計 New Power Plant Capacity (cum.) MW 43 68 98 135 160 200 240 270 310 310 330 395 395 455 465 485 505 565 585系統設備量合計 Total Installed Generation Capacity MW 205 226 251 283 304 339 375 401 437 434 450 512 508 565 571 588 605 662 679予備率 Reserve Margin % 40% 39% 40% 43% 39% 42% 43% 41% 41% 31% 27% 36% 26% 33% 27% 23% 20% 24% 19%
地熱発電所(既設) Geothermal Power Plant (Exist.) MW 0 0 0 0 0 0 0 0 0 0 0 0 0 0 0 0 0 0 0修正発電所開発計画 Revised Power Plant Development Plan
発電所増設計画(Committed) Power Plant Const. Plan (Committed) MW新規増設計画 New Power Plant Plan MW 28 25 28 37 25 40 40 30 40 0 20 94 0 60 1 20 20 60 5 585 (100.0%)
水力 Hydro Power MW 1 1 (0.2%)ガスタービン Gas Turbine MW 20 20 20 10 20 20 20 5 140 (23.9%)コンバインドサイクル Combined cycle MW 0 (0.0%)汽力 Steam MW 25 37 25 20 20 20 20 20 40 60 20 60 367 (62.8%)地熱 Geothermal MW 30 30 (5.1%)ディーゼル Diesel MW 27 8 4 1 47 (8.0%)原子力 Nuclear MW 0 (0.0%)
増設設備量累計 New Power Plant Capacity (cum.) MW 40 65 93 130 155 195 235 265 305 305 325 419 419 479 479 500 520 580 585 系統設備量合計 Total Installed Generation Capacity MW 202 223 246 278 299 334 370 396 432 429 445 536 532 589 585 603 620 677 679予備率 Reserve Margin % 38% 38% 37% 40% 37% 40% 41% 39% 39% 30% 26% 43% 32% 38% 30% 26% 23% 26% 19%

7-138
Table 7.1.11-12 Electric Power Development Plan in Geothermal Power Development Master Plan (East Nusa Tenggara)
NTT System Demand & Supply Balance Table
項目 Item Unit 2007 2008 2009 2010 2011 2012 2013 2014 2015 2016 2017 2018 2019 2020 2021 2022 2023 2024 2025 New Plant Total電力需要 Energy Demand GWh 309 340 375 414 453 496 543 589 640 678 718 762 808 859 934 1,016 1,107 1207 1316増加率 Growth 10.4% 10.0% 10.3% 10.4% 9.4% 9.5% 9.5% 8.5% 8.7% 5.9% 5.9% 6.1% 6.0% 6.3% 8.7% 8.8% 9.0% 9.0% 9.0%負荷率 Annual Road Factor % 48% 48% 48% 48% 48% 48% 48% 48% 48% 49% 50% 51% 52% 53% 54% 55% 56% 57% 58%発電電力量 Energy Generation GWh 343 378 417 460 503 550 602 654 710 759 811 868 929 996 1,092 1,199 1,317 1,448 1,592最大電力 Peak Power Demand MW 82 90 99 109 120 131 143 155 169 177 185 194 204 214 231 249 269 290 313増加率 Growth 10.3% 10.2% 10.4% 10.3% 9.3% 9.5% 9.5% 8.5% 8.6% 4.7% 4.8% 4.9% 5.0% 5.1% 7.7% 7.8% 7.9% 8.0% 8.1%設備容量(既設) Installed Generation Capacity (Exist.) MW 79 76 74 72 70 68 66 64 62 60 58 56 55 53 51 50 48 47 45RUKN (2005)電源開発計画 Power Dev't Plan by RUKN (2005)
発電所増設計画(Committed) Power Plant Const. Plan (Committed) MW 22 0 0 0 0 0 0 0 0 0 0 0 0 0 0 0 0 0 0PLN分 PLN MW 22 0 0 0 0 0 0 0 0 0 0 0 0 0 0 0 0 0 0
水力 Hydro Power MW 2ガスタービン Gas Turbine MWコンバインドサイクル Combined cycle MW汽力 Steam MW
地熱 Geothermal MW 6ディーゼル Diesel MW 14
IPP IPP MW 0 0 0 0 0 0 0 0 0 0 0 0 0 0 0 0 0 0 0水力 Hydro Power MW
ガスタービン Gas Turbine MWコンバインドサイクル Combined cycle MW汽力 Steam MW地熱 Geothermal MW
ディーゼル Diesel MW新規増設計画 New Power Plant Plan MW 35 10 6 13 0 20 30 0 40 30 0 0 20 0 30 0 30 40 0 329 (100.0%)
水力 Hydro Power MW 10 12 (3.6%)ガスタービン Gas Turbine MW 0 (0.0%)コンバインドサイクル Combined cycle MW 0 (0.0%)汽力 Steam MW 5 6 10 10 40 30 20 30 30 40 221 (67.2%)地熱 Geothermal MW 9 (2.7%)ディーゼル Diesel MW 35 5 3 10 20 87 (26.5%)原子力 Nuclear MW 0 (0.0%)
増設設備量累計 New Power Plant Capacity (cum.) MW 61 71 77 89 89 109 139 139 179 209 209 209 229 229 259 259 289 329 329系統設備量合計 Total Installed Generation Capacity MW 139 147 151 161 159 177 205 203 241 269 267 265 284 282 310 309 337 376 374予備率 Reserve Margin % 71% 64% 52% 47% 33% 35% 43% 30% 43% 52% 44% 36% 39% 32% 34% 24% 26% 30% 19%
地熱発電所(既設) Geothermal Power Plant (Exist.) MW 0 0 0 0 0 0 0 0 0 0 0 0 0 0 0 0 0 0 0修正発電所開発計画 Revised Power Plant Development Plan
発電所増設計画(Committed) Power Plant Const. Plan (Committed) MW新規増設計画 New Power Plant Plan MW 53 15 16 13 0 10 30 0 20 20 18 40 10 0 20 0 20 24 20 329 (100.0%)
水力 Hydro Power MW 2 10 12 (3.6%)ガスタービン Gas Turbine MW 0 (0.0%)コンバインドサイクル Combined cycle MW 0 (0.0%)汽力 Steam MW 10 10 10 20 10 10 10 20 14 114 (34.6%)地熱 Geothermal MW 3 6 10 18 40 10 10 20 116 (35.2%)ディーゼル Diesel MW 49 5 3 10 20 87 (26.5%)原子力 Nuclear MW (0.0%)
増設設備量累計 New Power Plant Capacity (cum.) MW 54 69 85 98 98 108 138 138 158 178 195 235 245 245 265 265 285 309 329 系統設備量合計 Total Installed Generation Capacity MW 133 145 159 169 167 175 203 201 219 238 253 291 300 298 316 315 333 356 374予備率 Reserve Margin % 63% 62% 61% 55% 40% 34% 42% 29% 30% 34% 37% 50% 47% 39% 37% 27% 24% 23% 19%

7-139
Table 7.1.11-13 Electric Power Development Plan in Geothermal Power Development Master Plan (Maluku and North Maluku)
Maluku & N. Muluku System Demand & Supply Balance Table
項目 Item Unit 2007 2008 2009 2010 2011 2012 2013 2014 2015 2016 2017 2018 2019 2020 2021 2022 2023 2024 2025 New Plant Total電力需要 Energy Demand GWh 267 283 300 318 335 353 372 392 413 441 470 502 536 571 610 652 697 745 796増加率 Growth 6.0% 6.0% 6.0% 6.0% 5.3% 5.4% 5.4% 5.4% 5.4% 6.8% 6.6% 6.8% 6.8% 6.5% 6.8% 6.9% 6.9% 6.9% 6.8%負荷率 Annual Road Factor % 54% 54% 54% 54% 54% 54% 54% 55% 55% 55% 54% 55% 55% 55% 55% 55% 55% 55% 55%発電電力量 Energy Generation GWh 302 319 337 357 375 394 414 435 457 488 520 555 593 633 676 722 771 824 881最大電力 Peak Power Demand MW 64 67 71 76 79 83 87 91 95 102 109 116 124 132 141 151 161 172 184増加率 Growth 6.7% 4.7% 6.0% 7.0% 3.9% 5.1% 4.8% 4.6% 4.4% 7.4% 6.9% 6.4% 6.9% 6.5% 6.8% 7.1% 6.6% 6.8% 7.0%設備容量(既設) Installed Generation Capacity (Exist.) MW 76 76 76 76 76 76 76 76 76 74 72 69 67 65 63 61 60 58 56RUKN (2005)電源開発計画 Power Dev't Plan by RUKN (2005)
発電所増設計画(Committed) Power Plant Const. Plan (Committed) MW 17 0 0 0 0 0 0 0 0 0 0 0 0 0 0 0 0 0 0PLN分 PLN MW 17 0 0 0 0 0 0 0 0 0 0 0 0 0 0 0 0 0 0
水力 Hydro Power MWガスタービン Gas Turbine MWコンバインドサイクル Combined cycle MW汽力 Steam MW
地熱 Geothermal MWディーゼル Diesel MW 17
IPP IPP MW 0 0 0 0 0 0 0 0 0 0 0 0 0 0 0 0 0 0 0水力 Hydro Power MW
ガスタービン Gas Turbine MWコンバインドサイクル Combined cycle MW汽力 Steam MW地熱 Geothermal MW
ディーゼル Diesel MW新規増設計画 New Power Plant Plan MW 12 5 5 5 5 2 5 5 10 5 5 15 20 15 0 15 20 15 15 202 (100.0%)
水力 Hydro Power MW 0 (0.0%)ガスタービン Gas Turbine MW 20 20 40 (19.8%)コンバインドサイクル Combined cycle MW 0 (0.0%)汽力 Steam MW 5 5 5 2 5 5 5 10 10 10 15 15 92 (45.5%)地熱 Geothermal MW 0 (0.0%)ディーゼル Diesel MW 12 5 5 5 5 5 5 5 70 (34.7%)原子力 Nuclear MW 0 (0.0%)
増設設備量累計 New Power Plant Capacity (cum.) MW 35 40 45 50 55 57 62 67 77 82 87 102 122 137 137 152 172 187 202系統設備量合計 Total Installed Generation Capacity MW 111 116 121 126 131 133 138 143 153 156 159 171 189 202 200 213 232 245 258予備率 Reserve Margin % 73% 73% 70% 66% 66% 60% 59% 57% 61% 53% 46% 47% 52% 53% 42% 41% 44% 42% 40%
地熱発電所(既設) Geothermal Power Plant (Exist.) MW 0 0 0 0 0 0 0 0 0 0 0 0 0 0 0 0 0 0 0修正発電所開発計画 Revised Power Plant Development Plan
発電所増設計画(Committed) Power Plant Const. Plan (Committed) MW新規増設計画 New Power Plant Plan MW 21 4 5 5 5 2 4 5 9 5 9 49 10 14 0 14 10 15 15 202 (100.0%)
水力 Hydro Power MW 0 (0.0%)ガスタービン Gas Turbine MW 10 10 20 (10.1%)コンバインドサイクル Combined cycle MW 0 (0.0%)汽力 Steam MW 5 5 5 2 5 5 5 5 5 10 10 15 15 92 (45.5%)地熱 Geothermal MW 40 40 (19.8%)ディーゼル Diesel MW 21 4 4 4 4 4 4 4 50 (24.5%)原子力 Nuclear MW
増設設備量累計 New Power Plant Capacity (cum.) MW 25 28 33 38 43 45 49 54 62 67 76 124 135 148 148 162 172 187 202 系統設備量合計 Total Installed Generation Capacity MW 101 104 109 114 119 121 125 130 138 141 148 193 202 213 211 223 232 245 258予備率 Reserve Margin % 57% 56% 54% 50% 51% 46% 43% 43% 46% 39% 36% 67% 63% 62% 50% 48% 44% 42% 40%

7-140
Fig.7.2.2-1 Log-in View of Indonesia Geothermal Development Database
Fig.7.2.2-2 Main menu of Indonesia Geothermal Development Database

7-141
Fig.7.2.2-3 General Information of Geothermal Power Development in Indonesia
Fig.7.2.2-4 General Information of Geothermal Resources in Indonesia
7-142
Fig.7.2.2-5 General Information of Social/Environment in Indonesia
Fig.7.2.2-6 General Information of Transmission Line in Indonesia
7-143
Fig.7.2.2-7 Prospective Geothermal Fields in Sumatera Inland
Fig.7.2.2-8 General Information of Individual Field in Sumatera Island
7-144
Fig.7.2.2-9 Geothermal Resources Information of Individual Field
Fig. 7.2.2-10 Geothermal Structure, Geochemistry, Well and Geothermal Resources Information of
Individual Field

7-145
Fig.7.2.2-11 Social/Environmental Information of Individual Field
Fig. 7.2.2-12 Transmission Line Information of Individual Field

7-146
Table 7.2.2-1 Information Items of Geothermal development Database
General
Information
Geothermal
Resources
Policy, Social and
Environment
Utility and
Transmission Line
Whole
Indonesia
How to use the
Database
a. Resource
Potentials
b. Geothermal Power
Plant
c. Prospective Area
d. Development
Process
e. Business Scheme
f. Investigation
Status
g. Load Map and
Action Plan
a. Geothermal Law
b. Environmental
Assessment
c. National park and
Protected Forest
d. Registration,
Standards, and
Regulations
a. Power Demand
b. Power System
c. Existing Power
voltage
d. Future Grid
program
Individual
Field
a. Area Code
b. Latitude,
Longitude
c. Working
Area
d. Concession
a. Reservoir
Conceptual Model
b. Chemical
Condition
c. Well Productivity
d. Resource Potential
a. Social and
Economic
Condition
b. Residence
Precipitations
c. Flora and Fauna
d. Climate Condition
e. Land use
a. Transmission Line
(T/L) Voltage
b. T/L Length
c. T/L Connection
d. T/L Diagram
e. Others

7-147
Fig. 7.4.1-1 Various Multipurpose Utilization of Geothermal Energy
GeothermalResources
Steam
HotWater
Electric power generation
Industry
Agriculture and foresty
Live stock
Therapeutics
Public welfare
Hotel and sightseeing
Production of H2 for fuel cell
Dyeing
Extraction of chemicalmaterials
Na, K (Mexico) →fertilizerZinc (USA)Silica, Li (Japan)Boron (Japan, Turkey)
Temp. ℃
Refrigeration by ammonia absorption
Canning of foodEvaporation in sugar refining
Production of H2SO4
for scale prevention
20
80
60
40
100
120
160
140
180
200
0
Digestion in paper pulpDrying of fish mealAlumina via Bayer's process
EvaporationDrying and curing of cement blocksDrying of agricultural productsDrying of stock fishSpace heating (buildings and greenhouses)Cold storageAir conditioningAnimal husbandrySoil warmingSwimming pools, de-icingFish farming
Satu
rate
d st
eam
Hot
wat
er
ConventionalElectricGeneration
Binary fluidElectricGeneration
Space heatingWith heat pumps

7-148
Table 7.4.1-1 Case examples of geothermal multipurpose utilization in Oita, Japan
Location Product Use facilities
Vegetable and floriculture..
The glass house and plastic
greenhouse
Floriculture, facilities heating,
distribution hot water, and soil
disinfection
Greenhouse and facilities
Beppu
bamboo shoots Hot spring tube
Oita Vegetable (Ohba)
Shonai
Vegetable (Ohba)
Vegetable (lion tow, mini
Lycopersicon esculentum, and
Ohba)
Plastic greenhouse and plastic
house
Floriculture (Western orchid etc.) Plastic greenhouse and plastic
house
Zngiber mioga Roscoe. Plastic greenhouse and plastic
house
Yufuin
Boiling log Hot water tank
Naoiri
Vegetable Greenhouse
Kusu Fish breeding (Tilapia) Hot spring pond
Floriculture (Rosa hybrida hort.
and Cyclamen persicum Mill.,
etc.)
The glass house
Mushroom Plastic greenhouse
Tree Greenhouse
Kokonoe
Kokonoemachi
Fish breeding (Viviparus) Greenhouse and water tank
Floriculture (Rosa hybrida hort.) The glass house and plastic house
Fish breeding (soft-shelled turtle) Greenhouse and water tank
Amagase
Vegetable dryness Greenhouse
Yabakei Fish breeding (soft-shelled turtle) Greenhouse and water tank
Ajimu Fish breeding (soft-shelled turtle) Greenhouse and water tank

7-149
(a) At Cibodas
(b) At Darajat
Fig. 7.4.1-2 Traditional Bathing with Geothermal Hot Water
Fig. 7.4.1-3 Hot Water Swimming Pool in Cipanas

7-150
(a) Mushroom in Kamojang (b) Copra in Way Ratai
Fig. 7.4.1-4 Geothermal Direct Use for Agriculture
Fig. 7.4.1-5 Geothermal Direct Use for Large Catfishes Growing in Lampung

7-151
Fig. 7.4.1-6 Geothermal Direct Use for Space Heating in Patuha Geothermal Field

7-152
Table 7.4.2-1 Summary of Direct Use Data from Individual Countries

7-153

7-154
Fig. 7.4.3-1 Schematic Diagram of Mushroom Growing Direct Use in Kamojang Geothermal Field
(a) Steam Generator (b) Autoclave
(c) Baglogs
(d) Production Houses
Fig. 7.4.3-2 Direct Use Facility for Mushroom Growing in Kamojang

7-155
Fig. 7.4.3-3 Schematic Diagram of Palm Wine Production in Lahendong
Fig. 7.4.3-4 Direct Use for Palm Wine Production in Lahendong

7-156
Fig. 7.4.3-5 Schematic Diagram of Direct Use for Copra Production in
Way Ratai Geothermal Field
(a) Down hole Heat Exchanger in Natural Geothermal Well
(b) Copra Drying Room
Fig. 7.4.4-1 Direct Use Facility for Copra Production

7-157
Fig. 7.4.4-2 Wayang Windu Geothermal Power Plant Located in Tea Plantation