Embed Size (px)
Citation preview

DOCUMENT RESUME
ED 423 276 TM 029 081
AUTHOR Deeter, Thomas; Prine, DonTITLE Assessment Program Results 1996-1997. Focus on Assessing
Outcomes.INSTITUTION Des Moines Public Schools, IA. Dept. for School Improvement
and Employee Relations.PUB DATE 1998-01-00NOTE 73p.
PUB TYPE Numerical/Quantitative Data (110) Reports Descriptive(141)
EDRS PRICE MF01/PC03 Plus Postage.DESCRIPTORS *Academic Achievement; Advanced Placement; *Criterion
Referenced Tests; *Educational Assessment; ElementarySecondary Education; *Norm Referenced Tests; Scores;Standardized Tests; Standards; Tables (Data); *Test Results
IDENTIFIERS ACT Assessment; *Des Moines Public Schools IA; Iowa Tests ofBasic Skills; PLAN Tests
ABSTRACTThe Des Moines (Iowa) Public Schools continually evaluate
the process of teaching for learning in order to provide quality programmingfor its diverse student body. Different methods of student outcome assessmentare used to identify areas for study and analysis. This report providesinformation about the achievement of district students on: (1)
criterion-referenced assessments; (2) advanced placement tests; (3) the
District Composition Assessment; (4) the Iowa Tests of Basic,Skills (ITBS);(5) the PLAN assessment (norm-referenced tests for 10th graders); and (6) theAmerican College Testing Program (ACT) assessment. Results from thecriterion-referenced tests show that at the elementary level, 76% of allscores were above the 70% standard, with 64% and 54% of the middle school andhigh school scores above the standard, respectively. A continuing challengeis to address the achievement gaps that exist between nonminority andminority students. The district was represented very well on AdvancedPlacement tests, with a number of students recognized for their achievement.In composition assessment, the percent of students in grades 3 and 5achieving the "competent" standard was less than the target for the schoolyear, but at grades 8 and 11, the percent achieving the competent standardwas slightly above the target. District students scored well on the ITBS. Inaddition, 10th graders scored well on the PLAN assessment. The mean districtscore on the ACT was a 20.9 while the national mean was 21.0 and the Iowamean was 22.1. For those few Iowa students who took the Scholastic AssessmentTest, scores were well above the national means for verbal and mathematicsscores. Six appendixes present definitions and tables of test results.(Contains 30 tables.) (SLD)
********************************************************************************
Reproductions supplied by EDRS are the best that can be madefrom the original document.
********************************************************************************

98-024
ASSESSMENTPROGRAM RESULTS
1996-1997
Des Moines Independent Community School D1800 Grand Avenue
Des Moines, Iowa 50309
U.S. DEPARTMENT OF EDUCATIONOffice of Educational Research and ImprovemeM
EDU ATIONAL RESOURCES INFORMATIONCENTER (ERIC)
This document has been reproduced asreceived from the person or organizationoriginating it.
O Minor changes have been made toimprove reproduction quality.
Points of view or opinions stated in thisdocument do not necessarily representofficial OERI position or policy.
January, 1998
Dr. Thomas DeeterProgram Evaluator, Testing & Research
Dr. Don PrineDirector, School Improvement
& Employee Relations
2
istrict
PERMISSION TOREPRODUCE AND
DISSEMINATE THIS MATERIAL HASBEEN GRANTED BY
71ôiia 424,2-(
TO THEEDUCATIONAL RESOURCES
INFORMATION CENTER (ERIC)
Focus onMsessingOutcomes

Executive Summary
The goal of the district assessment program is to provide information to improveteaching and to increase learning. Toward that end, students participate in a number ofdistrict-level assessment activities, including criterion-referenced, objectives-basedsubject matter tests, Advanced Placement tests, the district's performance-basedcomposition assessment, norm-referenced standardized assessment (ITBS, PLAN), andcollege entrance examinations (ACT, SAT).
Test results are shared throughout the year in many ways. Paper documents andreports are produced, student test results are returned to schools in electronic format(on diskette), and subject-area supervisors and testing personnel make presentations oftest results at various meetings.
Highlights of Results
District Criterion-Referenced Tests
Regarding the District Improvement Plan Target # 1:
At the elementary level, 76 percent of all scores (for all tests and all students) wereabove the 70% standard, two percentage points above the target for 1996-97.At the middle school level, 64 percent of all scores were above the 70% standard,four percentage points below the target for 1996-97.At the high school level, 54 percent of all scores were above the 70% standard,sixteen percentage points below the target for 1996-97.
A continuing challenge for the district is to address the achievement gaps that existbetween non-minority and minority students, and between students receivingsubsidized meals and students who do not receive subsidized meals.
Advanced Placement Tests
The district was represented very well on the Advanced Placement tests. There were sixstudents who were recognized as AP National Scholars. Twenty-eight students wererecognized as AP Scholars with Distinction, 18 students were recognized as AP Scholarswith Honor, and 42 students were recognized as AP Scholars.
Composition Assessment
Regarding the District Improvement Plan Target # 2:
At Grades 3 and 5, the percent of students achieving the competent standard was lessthan the target for 1996-97. At Grades 8 and 11, the percent of students achieving thecompetent standard was slightly above the target for 1996-97.

Iowa Tests of Basic Skills (ITBS)
District students scored very well on the ITBS. The district average for Grade 3 was the55th percentile, for Grade 4 was the 55th percentile, for Grade 6 was the 56th percentile,and for Grade 7 was the 57th percentile. The following information reflects the percentof students who scored as well or better than one and one-half grade levels above them.This is an indicator of exceptional performance.
14 % of the third graders scored as well or better than a beginning fifth grader.24% of the fourth graders scored as well or better than a beginning sixth grader.33% of the sixth graders scored as well or better than a beginning eighth grader.38% of the seventh graders scored as well or better than a beginning ninth grader.
PLAN Assessment
The average 10th grade student scored as well or better than 60 percent of all studentswho took the PLAN assessment. For all students, scores were highest in mathematics(64), followed by science reasoning (63), reading (58), and English (55). These samestudents, on average, scored as well or better than 53 percent of college-bound students.
ACT/SAT
In 1996-97, 842 students participated in the ACT assessment. The mean score was a 20.9(out of 36). The national mean was 21.0 and the Iowa mean was 22.1.
In 1996-97, 146 students participated in the SAT assessment. For all students, the Verbalmean score was 564 out of 800, and the Math mean score was 555 out of 800. Thesescores are well above the national means of 505, and 511, respectively.
Dissemination of Information
Information provided to schools include:Test reports sorted by course, teacher, and class.Test graphs of district-level reports for comparison purposes.Data diskettes containing student test results for district-wide assessments.Reports from test scoring services (ITBS, PLAN).In-service sessions held by curriculum supervisors and testing staff.

TABLE OF CONTENTS
District Mission Statement
Introduction
Program Overview 1
Resources 2Procedures 2
1996-97 Assessment Results 3Nature and Purposes of Assessments 3
Criterion-Referenced Assessments 3Composition Assessment 3Standardized Assessment 3Interpreting Student Achievement Information 4
District Improvement Plan Update 5Target # 1 5
Building Contributions to District Improvement Plan Target # 1 7District Improvement Plan Update 9
Target # 2 9Building Contributions to District Improvement Plan Target # 2 9
Criterion-Referenced Assessment Results 11Special Illustration: Elementary Reading Cohort Growth 14Advanced Placement Scholars 17
District Composition Assessment Results 18Standardized Assessment Results 20
The Iowa Tests of Basic Skills 20Elementary School ITBS 20Elementary School Cohort Growth 21Middle School ITBS 22Middle School Cohort Growth 23Disaggregated ITBS Scores 24Score Distributions for the ITBS 25PLAN Assessment 28ACT Assessment 30Scholastic Achievement Tests (SAT) 31
Dissemination of Assessment Information to Buildings 32Summary and Conclusions 33
Appendix A. Definitions 35Appendix B. District Criterion-Referenced, Objectives-Based Tests:
Historical Disaggregated Data 37Appendix C. Pilot Test Results: Disaggregated Data 57Appendix D. ITBS Tables: Elementary 60Appendix E. ITBS Tables: Middle School 63Appendix F. TIBS Percent of Students on Grade Level by Building and Subtest 65

DISTRICT MISSION STATEMENT:
The Des Moines Independent Community School district will provide aquality educational program to a diverse community of students where allare expected to learn.

Introduction
District-wide objective assessment of student progress is an essential part of anyeducational endeavor. Information relevant to how individual students and groupsof students are progressing provides schools a basis to determine how successfultheir practices have been or how practices should be designed to obtain better resultsin the future.
Assessment results reflect student achievement on identified outcomes, and serveas an indication that a school is indeed achieving its mission. Many measures areused to assess student progress, including nationally standardized measures, districtcriterion-referenced or performance-based measures, or assessments used byindividual teachers within their classrooms.
The value of any indicator system is based on the extent to which it captures thecomplexity of the teaching and learning process. Any single assessment cannot serveas the indicator of educational effectiveness. A multiple method, multiple indexapproach is recommended to paint a more clear and colorful picture of studentachievement, to provide decision-makers with more information to refine theteaching-for-learning process. The use of performance assessments anddemonstrations of student achievement may also serve to support numerical testscores.
Education is both a process and an outcome. The purposes for which assessmentactivities are conducted depend on the formation or summative nature of anevaluation. As long as stakeholders view education as a process and an outcome,assessment information can be used to make appropriate instructional decisions toenhance student learning and performance.

PROGRAM OVERVIEW
The Des Moines Public Schools continue to focus organizational energy on the academicgrowth and development of its diverse urban student body. Purposes of the programare to assess student learning, diagnose instructional need, and provide information forprogram evaluation.
Assessment results are indicators of student achievement on knowledge andperformance outcomes. Any form of assessment used in isolation provides only partialinformation about a child's academic development or a school district's overallcurriculum. Decision-makers who obtain results from multiple methods of assessmenthave more information to refine the teaching-for-learning process.
Continuous monitoring of student progress provides information for planning activitiesthat will address the needs of each learner by allowing instructional decisions to bepersonalized. Evaluation of student achievement information at the classroom,building, and district levels allows identification of strengths as well as academic areasin need of improvement. In order to maintain an appropriate breadth of focus of thedistrict's curriculum, student achievement trends in districts with similar characteristicscan be monitored.
The district continually evaluates the process of teaching for learning in order toprovide quality programming for its diverse student body. Different methods ofstudent outcome assessment are used to identify areas for study and analysis. Thepurpose of this report is to provide information about the achievement of districtstudents on the following:
Criterion-Referenced Assessments, a series of curriculum-aligned,objectives-based tests, given in grades two through twelve and covering coresubject matter areas as well as some electives in the Des Moines curriculum.
Advanced Placement Tests, a series of criterion-referenced tests given to highschool students seeking college credit prior to enrolling in college.
District Composition Assessment, a performance-based assessment in whichthe test is the learning activity itself. It is administered in the fall to students inthird, fifth, eighth, and eleventh grades.
Iowa Tests of Basic Skills (ITBS), a series of norm-referenced tests, given tostudents in third, fourth, sixth, and seventh grades. The ITBS is administeredin February.
The PLAN assessment, a series of norm-referenced tests given to a sample ofstudents in tenth grade. The PLAN is administered in the fall.

The ACT assessment (formerly the American College Test) and the ScholasticAchievement Tests (or SAT), a series of norm-referenced tests, usually givento high school juniors and seniors for the purpose of determining probablesuccess in higher education.
Disaggregation of assessment information is an integral component of planning fordistrict improvement. Disaggregation of data provides an opportunity to examineequity indicators to determine whether all students are learning and to what degree.Groups for disaggregafing data include gender, ethnicity (minority or non-minoritystatus), and a socioeconomic variable (free or reduced-priced meals). It is anticipatedthat data will be disaggregated on other categories (e.g., special education, ESL) as rulesfor legal requirements of including all students in assessment activities are clarified.
Resources
The operational budget for the district assessment program, including salaries andestimated benefits, is approximately 0.12 percent of the district's operating budget. Forevery one hundred dollars that the district spends on operations, the assessmentprogram receives 12 cents.
Procedures
Many processes have been automated for efficiency. Text and graphics for criterion-referenced tests is largely provided "in house." The ability to pre-print answer sheetswith student names and identification numbers from the CIMS system has recentlybeen achieved. Testing staff can now request "pre-slugged" answer sheets throughCIMS, which are printed at the Mid-Iowa Computer Center facility. ITBS answerdocuments have bar-coded labels to save classroom time and improve accuracy.
Since most district assessment activities are aligned with the curriculum, assessmentscan provide additional learning experiences for students to check their understandingof important concepts. Students average approximately 1.5 percent of their time inschool taking district assessments. The increase from past years is due to mathematicstests being given both at mid-year and end-of-year, and modular science tests that aregiven at the end of each unit or module.
In anticipation of the dissolution of Mid-Iowa Computer Center, testing staff arecurrently developing procedures to create district data sets by bringing together testfiles from each school, combining them on a desktop computer, and analyzing themusing microcomputer-based statistical software.
9
2

1996-97 ASSESSMENT RESULTS
Nature and Purposes of Assessments
Criterion-Referenced Assessments
The district's criterion-referenced assessment program covers a wide array of subjectmatter across curriculum areas and grade levels. The primary intent of these tests is todetermine the extent to which the curriculum being taught is learned. District criterion-referenced tests are not timed, allowing students reasonable time to complete all items.Each test contains groups of items measuring similar concepts (strands), and isdesigned to evaluate student mastery of the objectives of a given subject. They are alsodesigned to diagnose student learning or identify deficiencies in a student's reasoningprocess. Because these objectives-based tests are aligned with the adopted districtcurriculum, scores are reflective of a student's achievements in a specific content area.The district's criterion-referenced tests provide a more accurate picture of what istaught and learned than norm-referenced, standardized tests.
The primary purposes of the criterion-referenced assessment program are to evaluatethe curriculum and to assist in instructional planning. At elementary schools, data fromthese assessments supplement the student achievement data gathered throughindividual teacher assessments. It is anticipated that these assessments will be able toalso supplement the information consolidated in the ABACUS instructionalmanagement system. At the middle and high schools, data are also used for individualstudent evaluation (as a part of assigning course grades to students).
Composition Assessment
Performance-based assessments provide information regarding what a student can do,given a specific task. The district's performance-based assessment is a compositionassessment. Students in Grades 3, 5, 8, and 11 select one of three topics and compose anessay on the selected topic. Essays are read by trained readers and scored holistically(the overall impression) and on a number of dimensions that have been determined tobe important components of writing skill. The assessment is aligned with the district'sobjectives for language arts, and student compositions are evaluated against establishedstandards for each objective area. As such, the composition assessment may be viewedas objectives-based.
Standardized Assessment
Norm-referenced, standardized assessments provide general information regardinghow our district as a whole compares with other urban districts with similarcharacteristics. National norms are used as the standard of comparison, since thedistrict's urban demographic characteristics are more reflective of a national referencegroup than a state reference group.
31 0

Standardized assessments help prevent a narrowing of curriculum focus by selectingitems that test a broad range of objectives from each subject area. These tests are notintended to perfectly match any district's curriculum. Keeping in mind that a test suchas the ITBS is an assessment of basic skills, it is a fair measure of student achievement inmost areas. With regard to individual scores, a student scoring at the 50th percentile ison grade level, and should be able to enter most schools across the nation and beginachieving success.
Interpreting Student Achievement Information
Student achievement information can be evaluated in two ways. First, data can beanalyzed to see how similar groups of students perform on a test of the samecurriculum area in subsequent years (i.e., evaluating cohort data). For example, resultsof student assessment in Grade 3 mathematics in one year can be generally compared toresults of student assessment in Grade 4 mathematics the next year, and Grade 5mathematics the next year. Second, data on a particular test can be evaluated over aperiod of time, to examine if gaps (detected by disaggregation) on one administration ofa test tend to close with future administrations of the same test. For example, results ofstudent assessment on a Grade-10 English test can be compared and evaluated forachievement trends for students over a three-year period. The results of this type ofanalysis (i.e., evaluating historical data) should be interpreted with caution, since thegroups of students taking the same test each year are different.
Cohort data are most available at the elementary level, since groups of students tend tomatriculate through the grades together. This type of data is not as available for allstudents at the middle school level (i.e., Grade 8, when students begin to specialize inareas such as mathematics), and is seldom available at the high school level, since thereis little continuity among individual classes. Examination of historical data for long-term trends in student achievement can provide information for program evaluation.
1 1
4

District Improvement Plan Update
Target #1
Target # lof the District Improvement Plan states: "By the opening of the 1999-2000school year, 80% of elementary, middle and high school students will achieve at least70% mastery on district criterion-referenced assessments of mathematics, reading,language arts, social sciences, sciences, foreign languages, and vocational subjects."
For the 1996-97 school year, the targets for student achievement were (Table 1):Elementary: 74% of the students will achieve the 70% standard.Middle: 68% of the students will achieve the 70% standard.High: 70% of the students will achieve the 70% standard.
Table 1. Target and Actual Percent of StudentsAchieving the District Mastery Standard
Year Elementary(70%)
Middle(70%)
High(70%)
Target Actual Target Actual Target Actual1992-93 65 77 47 48 40 341993-94 65 79 50 53 40 461994-95 68 76 56 56 50 521995-96 71 76 62 68 60 531996-97 74 76 68 64 70 541997-98 77 74 75
1998-99 80 80 80
Note: Results are for all students and all areas combined.
This District Improvement Plan target helped staff identify a number of issuesregarding the potential usefulness of student assessment information. A districtstandard of 70% mastery on criterion-referenced tests was established and the percentof students achieving that mastery level is an indicator of program success at the district(or building) level.
Results for all students and all areas combined represent a duplicated count, such that itis possible for all test scores for a single student to be included in the average. While it ispossible that including all scores from a high achieving student may increase anaverage, all scores from a low achieving student may decrease an average. Results forindividual curriculum areas are more interpretable, since it is less likely that a singlestudent would take more than a single course in a given area.
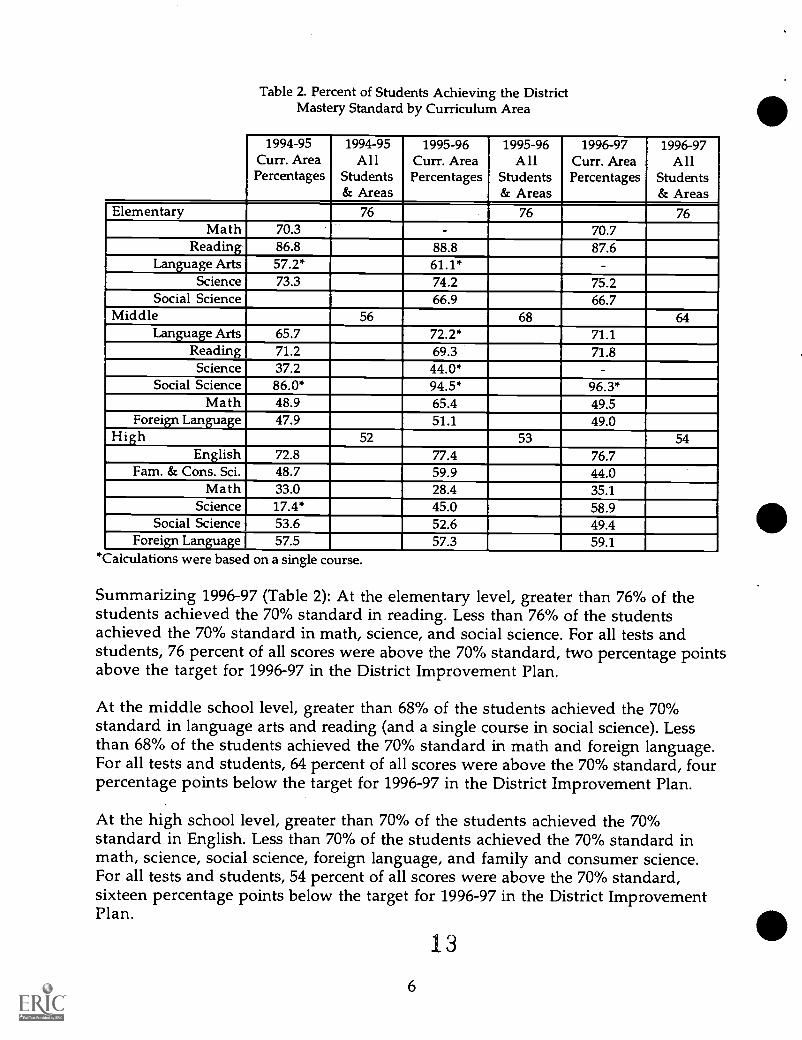
Table 2. Percent of Students Achieving the DistrictMastery Standard by Curriculum Area
1994-95Curr. AreaPercentages
1994-95All
Students& Areas
1995-96Curr. AreaPercentages
1995-96All
Students& Areas
1996-97Curr. AreaPercentages
1996-97All
Students& Areas
Elementary 76-
76 76Math 70.3 - 70.7
Reading 86.8 88.8 87.6Language Arts 57.2* 61.1* -
Science 73.3 74.2 75.2Social Science 66.9 66.7
Middle 56 68 64Language Arts 65.7 72.2* 71.1
Reading 71.2 69.3 71.8Science 37.2 44.0* -
Social Science 86.0* 94.5* 96.3*Ma th 48.9 65.4 49.5
Foreign Language 47.9 51.1 49.0H igh 52 53 54
English 72.8 77.4 76.7Fam. & Cons. Sci. 48.7 59.9 44.0
Math 33.0 28.4 35.1Science 17.4* 45.0 58.9
Social Science 53.6 52.6 49.4Foreign Language 57.5 57.3 59.1
*Cakulations were based on a single course.
Summarizing 1996-97 (Table 2): At the elementary level, greater than 76% of thestudents achieved the 70% standard in reading. Less than 76% of the studentsachieved the 70% standard in math, science, and social science. For all tests andstudents, 76 percent of all scores were above the 70% standard, two percentage pointsabove the target for 1996-97 in the District Improvement Plan.
At the middle school level, greater than 68% of the students achieved the 70%standard in language arts and reading (and a single course in social science). Lessthan 68% of the students achieved the 70% standard in math and foreign language.For all tests and students, 64 percent of all scores were above the 70% standard, fourpercentage points below the target for 1996-97 in the District Improvement Plan.
At the high school level, greater than 70% of the students achieved the 70%standard in English. Less than 70% of the students achieved the 70% standard inmath, science, social science, foreign language, and family and consumer science.For all tests and students, 54 percent of all scores were above the 70% standard,sixteen percentage points below the target for 1996-97 in the District ImprovementPlan.
6
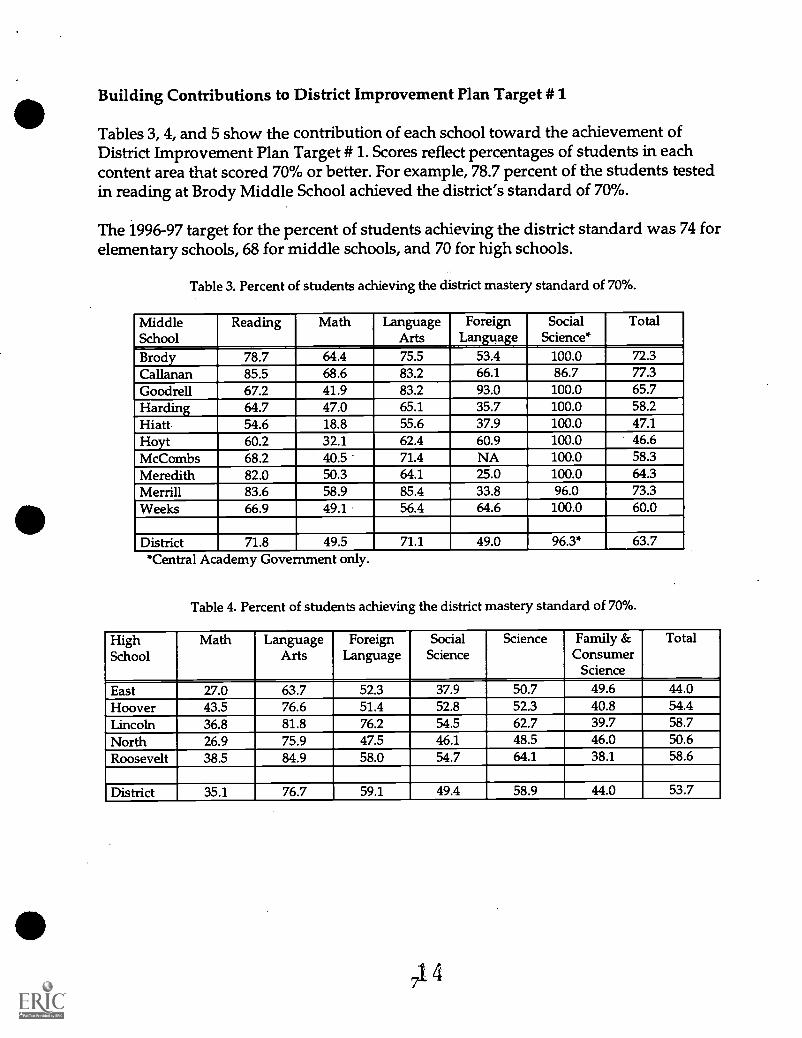
Building Contributions to District Improvement Plan Target # 1
Tables 3, 4, and 5 show the contribution of each school toward the achievement ofDistrict Improvement Plan Target # 1. Scores reflect percentages of students in eachcontent area that scored 70% or better. For example, 78.7 percent of the students testedin reading at Brody Middle School achieved the district's standard of 70%.
The 1996-97 target for the percent of students achieving the district standard was 74 forelementary schools, 68 for middle schools, and 70 for high schools.
Table 3. Percent of students achieving the district mastery standard of 70%.
MiddleSchool
Reading Math LanguageArts
ForeignLanpage
SocialScience*
Total
Brody 78.7 64.4 75.5 53.4 100.0 72.3
Callanan 85.5 68.6 83.2 66.1 86.7 77.3
Goodrell 67.2 41.9 83.2 93.0 100.0 65.7Harding 64.7 47.0 65.1 35.7 100.0 58.2Hiatt 54.6 18.8 55.6 37.9 100.0 47.1
Hoyt 60.2 32.1 62.4 60.9 100.0 46.6McCombs 68.2 40.5 71.4 NA 100.0 58.3
Meredith 82.0 50.3 64.1 25.0 100.0 64.3Merrill 83.6 58.9 85.4 33.8 96.0 73.3Weeks 66.9 49.1 56.4 64.6 100.0 60.0
District 71.8 49.5 71.1 49.0 96.3* 63.7*Central Academy Government only.
Table 4. Percent of students achieving the district mastery standard of 70%.
HighSchool
Math LanguageArts
ForeignLanguage
SocialScience
Science Family &Consumer
Science
Total
East 27.0 63.7 52.3 37.9 50.7 49.6 44.0
Hoover 43.5 76.6 51.4 52.8 52.3 40.8 54.4
Lincoln 36.8 81.8 76.2 54.5 62.7 39.7 58.7
North 26.9 75.9 47.5 46.1 48.5 46.0 50.6
Roosevelt 38.5 84.9 58.0 54.7 64.1 38.1 58.6
District 35.1 76.7 59.1 49.4 58.9 44.0 53.7

Table 5. Percent of students achieving the district mastery standard of 70%.
ElementarySchool
Reading Math Science SocialScience
Total
Adams 93.0 77.9 76.7 87.0 84.9Brooks 76.9 57.8 57.9 39.1 58.9Cattell 83.6 58.7 66.9 61.8 68.5Douglas 83.0 72.5 72.1 63.1 73.7Edmunds 80.9 47.1 69.3 47.8 62.0Findley NA 78.3 90.3 77.7 81.7Garton 90.1 67.1 70.9 67.6 75.8Granger 74.3 62.3 51.9 46.0 60.3Greenwood 90.7 85.5 85.4 73.4 83.8Hanawalt NA 85.4 80.2 81.6 82.4Hillis 87.4 81.8 79.9 82.7 83.3Howe 88.7 74.6 84.1 72.9 80.9Hubbell 88.6 71.0 78.8 73.7 79.0Jackson 88.0 71.2 72.4 71.0 76.8Jefferson 94.9 92.4 85.7 85.3 90.5Longfellow 50.6 53.6 66.2 63.7 57.0Lovejoy 89.4 82.4 83.3 86.9 86.1Lucas NA 77.3 57.7 40.2 59.0Madison 93.7 70.0 81.0 65.2 79.7Mann 89.4 68.2 49.3 69.7 73.6McKee 80.7 68.7 66.6 49.2 67.4McKinley 86.1 71.9 67.0 45.7 69.5Mitchell 86.1 66.7 93.2 82.1 82.4Monore (&Rice) 90.6 67.2 97.3 58.6 77.7Moore 87.2 71.8 71.4 59.4 68.9Moulton 75.5 49.8 62.2 47.1 59.9Oak Park 82.8 60.5 63.9 42.0 64.7Park Avenue 97.0 87.7 83.7 80.4 88.3Perkins (& King) NA 64.2 75.6 56.6 65.7Phillips 87.0 74.7 78.0 80.7 80.7Pleasant Hill 88.7 65.7 89.7 84.8 82.6Stowe 95.6 61.4 88.5 84.1 82.7Studebaker 88.2 78.6 75.5 78.6 81.3Wallace NA 58.9 58.3 29.4 48.8Watrous 92.1 78.2 83.4 69.7 81.9Willard 86.1 59.4 61.8 56.0 67.4Windsor 97.4 86.1 82.3 77.3 86.5Wood lawn 86.8 64.3 82.3 65.8 74.8Wright 89.7 66.8 73.2 55.8 73.3
District 87.6 70.7 75.2 66.9 75.7Note: Some schools had waivers from administering the district readingtests. Other schools elected to pilot the new Scholastic Literacy Placeassessments during 1996-97.
15
8

District Improvement Plan Update
Target #2
Target # 2 of the District Improvement Plan states: "By the opening of the 1999-2000school year, 55%, 60%, 65%, and 70% of the students in Grades 3, 5, 8, and 11,respectively, will achieve the competent standard on the district compositionassessment." In order to be classified as competent on this assessment, a student mustscore at least a 6 (out of 10) on the holistic score (the overall impression of the essay),and average at least a 5 (out of 8) on all of the dimensions of writing that are scored. Assuch, students are required to score better than the mathematical average score to beclassified as competent.
For the 1996-97 school year, the targets for student achievement were (Table 6):Grade 3: 53% of the students will achieve the competent standard.Grade 5: 40% of the students will achieve the competent standard.Grade 8: 45% of the students will achieve the competent standard.Grade 11: 60% of the students will achieve the competent standard.
Table 6. Target and Actual Percent of StudentsAchieving the District Competency Standard
District Composition Assessment
Year Grade 3 Grade 5 Grade 8 Grade 11
Target Actual Target Actual Target Actual Target Actual1991-92 36.4 34.7 35.3 51.9
1992-93 30.9 37.2 40.2 57.3
1993-94 46.8 34.6 44.2 61.9
1994-95 50.6 37.8 43.0 58.3
1995-96 51.3, 31.5 48.9 60.5
1996-97 53 45.4 40 33.5 45 45.1 60 60.9
1997-98 54 50 55 65
1998-99 55 60 65 70
Summarizing 1996-97 (Table 6): At Grades 3 and 5, the percent of students achieving thecompetent standard was less than the target. At Grades 8 and 11, the percent ofstudents achieving the competent standard was slightly above the district targets.
Building Contributions to District Improvement Plan Target # 2
Table 7 shows the contribution of each s-chool toward the achievement of DistrictImprovement Plan Target # 2. The scores are the percentages of students in each schoolthat achieved the competent standard on the composition assessment.

Table 7. Percent of students achieving the competent standard on the composition assessment.
ElementarySchool
Grade 3 Grade 5
Adams 60.0 35.3Brooks 15.4 24.1Cattell 50.7 33.3Douglas 55.6 49.1Downtown 71.4 40.0Edmunds 44.9 30.9Findley 34.7 28.3Garton 20.0 24.5Granger 27.4 22.8Greenwood 65.6 61.3Hanawalt 76.9 46.6Hillis 69.8 46.3Howe 50.0 32.0Hubbell 50.9 42.4Jackson 39.7 25.8Jefferson 53.2 68.8Longfellow 20.0 21.4Lovejoy 37.2 30.0Lucas 23.3 6.8Madison 53.5 33.3Mann 43.6 34.3McKee 52.4 21.2McKinley 11.1 25.0Mitchell 57.1 23.5Monroe 71.0 30.9Moore 65.0 34.8Moulton 14.5 10.0Oak Park 33.8 33.3Park Avenue 49.2 41.7Perkins 40.7 39.2Phillips 42.6 40.0Pleasant Hill 78.1 26.8Stowe 40.3 32.0Studebaker 26.3 26.9Wallace 42.5 20.0Watrous 31.3 28.3Willard 20.4 23.5Windsor 61.4 36.0Wood lawn 50.0 33.7Wright 46.5 21.6
10
Middle School Grade 8
Brody 51.5Callanan 54.2Goodrell 43.2Harding 28.1Hiatt 38.8Hoyt 47.8McCombs 33.1Meredith 47.9Merrill 64.4Weeks 39.0
gh ool Grade 11a st 51.7oover 54.4i 74.5or th 57.1
63.3a sady 22.2avo 48.4
17

Criterion-Referenced Assessment Results
Cohort analysis is used to examine the growth of similar groups of students over time.Figures 1 through 3 are examples of the results of cohort growth analyses for selectedsubject areas. The table accompanying each figure shows the percent of students in aparticular group scoring at or above the 70% standard, as well as the number ofstudents assessed in each group.
Appendix B contains the results of the historical data analyses for all criterion-referenced, objectives-based tests administered during 1996-97. Appendix C containsthe results for all pilot tests administered during 1996-97.
100-
90-
80-
70-
60-
50-
40-
30-
20-
10-
Figure 1. Elementary Social Science:Cohort of Grade 4 Students in 1996-97
F/7
All Females Males Non Min. MM.
Dis aggregated Category
Fr/Red Non Fr/Red
1==i 3rd grade 1995-1996 4th grade 1996-1997
Test Name AllStudents
Females Males Non-MinorityStudents
MinorityStudents
Free &Reduced
Non Free&
Reduced
Social Science 71.8 71.5 72.2 75.7 58.2 61.9 78.4 % > 70%
Grade 31995-1996 2012 1002 1010 1569 443 727 1234 N Tested
Social Science 77.7 77.5 77.9 81.7 63.1 66.1 86.2 % > 70%
Grade 41996-1997 1959 992 967 1533 426 828 1131 N Tested
831

100-
90-
80-
70-
60-
50-
40-
30-
20-
10-
Figure 2. Middle School Reading:Cohort of Grade 7 Students in 1996-97
V
All Females Males Non Min. MM.
Disaggregated Categoty
Fr/Red Non Fr/Red
o 6th grade 1995-1996 r4 7th grade 1996-1997
Test Name AllStudents
Females Males Non-MinorityStudents
MinorityStudents
Free &Reduced
Non Free&
ReducedWind by the Sea 77.0 78.0 75.9 80.7 63.0 65.5 83.2 % > 70%Gr. 6, Level 121995-1996 1902 990 912 1502 400 595 1247 N TestedStar Walk 75.8 77.6 73.7 80.5 61.1 63.1 83.0 % > 70%Gr. 7, Level 131996-1997 1506 802 704 1136 370 540 963 N Tested
19
12

Figure 3. High School English:Cohort of Grade 10 Students in 1996-97
100-
90-
80-
70- 71.
60-
50-
40-
30-
20-
10-
0All Females Males Non MM. MM. Fr/Red Non Fr/Red
Dis aggregated Category
n 9th grade 1995-1996 V4. 10th grade 1996-199
Test Name AllStudents
Females Males Non-MinorityStudents
MinorityStudents
Free SrReduced
Non Free&
Reduced'English 9 79.9 83.0 76.7 83.4 65.9 68.9 83.4 % > 70%1995-1996
1634 827 807 1306 328 341 1244 N TestedEnglish 10 73.1 74.8 71.4 77.2 55.2 57.0 77.3 % > 70%1996-1997
1290 658 632 1049 241 256 1026 N Tested
2013

Special Illustration: Elementary Reading Cohort Growth
The Silver-Burdett-Ginn developmental reading curriculum adopted by the districtconsists of three levels of basal texts at Grade 1, two levels at Grades 2 and 3, and onelevel each for Grades 4 through 8. Because students in each grade tend to progress atvery different rates, they may be reading at a developmental level that is below theiractual grade level text. Because of the potential inclusion of upper grade students inlower-level reading groups, the analysis of both historical and cohort data becomes moredifficult.
To appropriately evaluate student growth, two issues must be addressed. First, thenumber of students who are reading (and assessed) at the appropriate end-of-level textfor their grade must be examined. Second, the percent of students mastering the end-of-level assessment for their grade must be examined.
The table accompanying Figure 4 shows the number and percent of students at eachelementary grade assessed with the appropriate end-of-level test for that grade. Ingeneral, more students were reading (and completing, since they were being assessed)at their appropriate end-of-level text in 1997 than in previous years. The figure is a chartof the 1997 Grade 5 Cohort for this information.
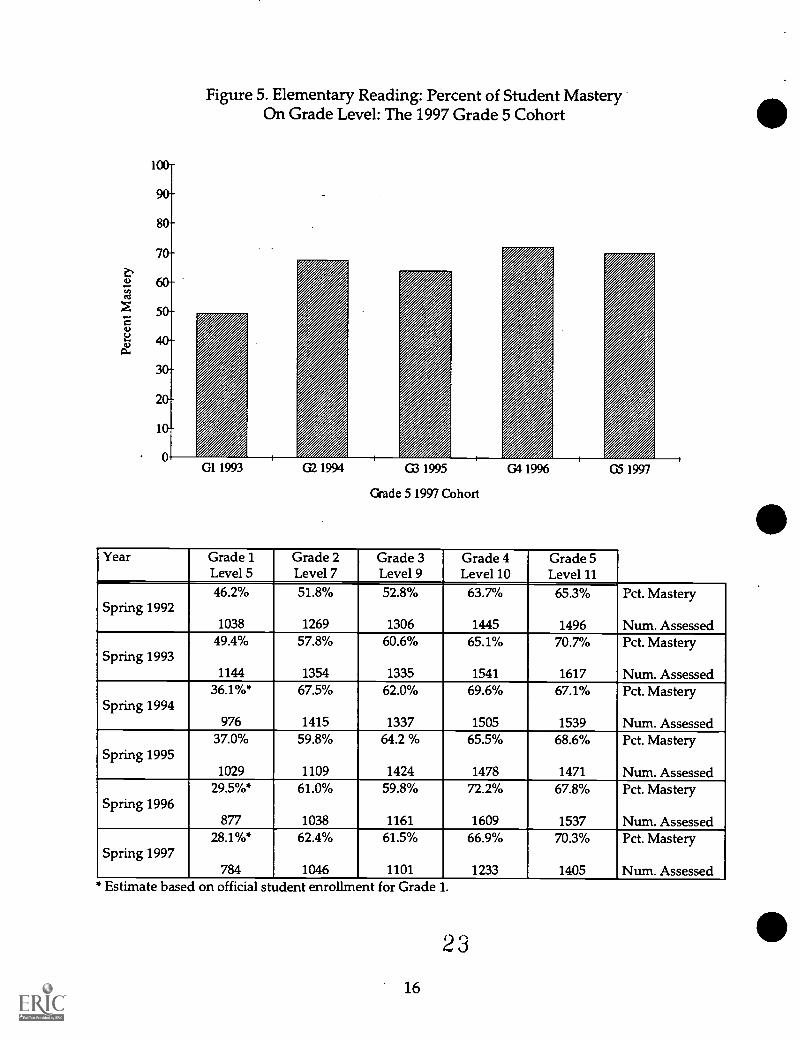
The table accompanying Figure 5 shows the percent of students at each elementarygrade that achieved the 70% mastery standard on the appropriate end-of-level test forthat grade. In general, a greater percentage of students are demonstrating mastery onthe appropriate end-of-level tests. The figure is a chart of the 1997 Grade 5 Cohort forthis information.
For most groups over time, evidence for effectiveness of the developmental readingprogram at the elementary level is indicated by: 1) the increasing percent of studentscompleting the appropriate end-of-level text, and 2) the increasing percent of studentsmastering the appropriate end-of-level test.
21
14

Figure 4. Elementary Reading: Percent of Students AssessedOn Grade Level: The 1997 Grade 5 Cohort.
G1 1993 G2 1994 G3 1995
Crade 5 1997 Cohort
G4 1996 G5 1997
Year Grade 1Level 5
Grade 2Level 7
Grade 3Level 9
Grade 4Level 10
Grade 5Level 11
49% 53% 56% 71% 76% Pd. of StudentsSpring 1992
1038 1269 1306 1445 1496 Num. Students51% 58% 62% 72% 79% Pct. of Students
Spring 19931144 1354 1335 1541 1617 Num. Students38%* 70% 66% 75% 78% Pct. of Students
Spring 1994976 1415 1337 1505 1539 Num. Students
40% 62% 69% 74% 79% Pct. of StudentsSpring 1995
1029 1109 1424 1478 1471 Num. Students32% 62% 63% 79% 77% Pct. of Students
Spring 1996877 1038 1161 1609 1537 Num. Students30% 64% 66% 76% 81% Pct. of Students
Spring 1997784 1046 1101 1233 1405 Num. Students
* Estimate based on official student enrollment for Grade 1.
100-
90-
80-
Figure 5. Elementary Reading: Percent of Student MasteryOn Grade Level: The 1997 Grade 5 Cohort
Grade 5 1997 Cohort
Year Grade 1Level 5
Grade 2Level 7
Grade 3Level 9
Grade 4Level 10
Grade 5Level 11
Spring 199246.2% 51.8% 52.8% 63.7% 65.3% Pct. Mastery
1038 1269 1306 1445 1496 Num. Assessed49.4% 57.8% 60.6% 65.1% 70.7% Pct. Mastery
Spring 19931144 1354 1335 1541 1617 Num. Assessed
36.1%* 67.5% 62.0% 69.6% 67.1% Pct. MasterySpring 1994
976 1415 1337 1505 1539 Num. Assessed37.0% 59.8% 64.2 % 65.5% 68.6% Pct. Mastery
Spring 19951029 1109 1424 1478 1471 Num. Assessed
29.5%* 61.0% 59.8% 72.2% 67.8% Pct. MasterySpring 1996
877 1038 1161 1609 1537 Num. Assessed28.1%* 62.4% 61.5% 66.9% 70.3% Pct. Mastery
Spring 1997784 1046 1101 1233 1405 Num. Assessed
* Estimate based on official student enrollment for Grade 1.
2 3
16

Advanced Placement Scholars
Advanced Placement (AP) tests are criterion-referenced, multiple-choice and free-response (essay or problem solving) tests given to high school students for collegecredit. The College Board recommends that a score of three or higher (out of five) beachieved in order to receive college credit for a specific course.
For 1996-97, 88 students representing all district high schools (including eleven studentsfrom Johnston, North Polk, West Des Moines Valley, Des Moines Christian School, andVan Meter) who attend Central Academy were recognized by The College Board asAdvanced Placement Scholars. For the seventh consecutive year, the Governor of Iowarecognized two district students as the Top Male and Top Female Scholars in the Stateof Iowa.
A.P. Scholars, with a minimum of three AP courses with test scores of 3 orhigher, included 42 students.
A.P. Scholars with Honor, with a minimum of four AP courses with testscores of 3 or higher and an average of 3.25, included 18 students.
A.P. Scholars with Distinction, with a minimum of five AP courses with testscores of 3 or higher and an average of 3.5, included 28 students.
A.P. National Scholars, with a minimum of eight AP courses with test scoresof 3 or higher and an average of 4 or higher, included 6 students.
Table 8. 1997 Central Academy AP assessments.
Test Number ofStudents
PercentScoring 3 or
Higher
Mean Score
European History 75 73 3.09
U.S. History 43 60 3.05
Comparative Government 37 75 3.59
Macro Economics 39 91 3.82
Chemistry 20 80 3.45
Biology 40 94 3.82
Physics (B) 14 78 4.00
Calculus (AB) 54 85 3.07
Calculus (BC) 19 95 3.79
Computer Science 6 66 3.16
Statistics 12 100 4.42
English Literature 50 95 3.72
English Language 95 75 3.42
9 4

District Composition Assessment Results
Because of the way in which the district composition assessment is scored, using anational model for scoring performance assessments, an average paper (on a percentscale) will receive a raw score equivalent to a 50%, similar to a 50th percentile rankingon a standardized assessment. Scores from year to year are not expected to significantlychange, since readers are retrained each year in the scoring process. Table 9 shows thefall composite score mean percentages for all grades.
Table 9. District Composition AssessmentComposite Score Mean Percentages
Grade 1989 1990 1991 1992 1993 1994 1995 19963 60.7 61.9 62.3 60.3 64.9 64.9 65.9 66.35 69.6 69.1 68.9 67.3 66.8 68.8 67.7 68.78 64.5 64.2 65.1 66.2 66.8 65.5 66.5 65.9
11 68.3 68.8 69.0 70.4 70.7 69.9 69.1 68.0
Based on a Holistic score maximum of 10 points and a score of 8 points for eachdimension, to be considered competent, a student must have a Holistic score of 6 orbetter, and an average of 5 or better for all of the dimensions. Therefore, students mustwrite a "better-than-mathematically-average" paper to be considered competent.
Disaggregated results of the 1996-97 composition assessment, along with results since1991-92, are shown in Table 10. In general, the percentage of students achieving the"Competent" standard or higher increases over time. A greater percentage of femalesthan males achieved the standard. A greater percentage of nonminorities than minoritystudents, and a greater percentage of students not participating in the subsidized mealprogram than participants in the subsidized meal program achieved the standard.
The gap between males and females decreased for all cohorts. The gap betweennonminority and minority students decreased for the Grade 5 and Grade 8 cohorts, butincreased for the Grade 11 cohort. The gap between students based on participation insubsidized meal programs decreased for all cohorts. It is important to note that whilethe gaps may be closing, a substantial difference continues to exist between groupsbased on ethnicity and socioeconomic status.
2 5
18

Table 10. District Composition Assessment Trends:Percent of Students Achieving the "Competent" Standard or Higher
Grade & Year AllStudents
Females Males Non-minorityStudents
MinorityStudents
Free &Reduced
Non Free&
ReducedGrade 3 507* 57.5 44.0 54.6 36.2 36.1 61.91994-95
2348** 1166 1182 1851 497 1017 1331
Grade 5 33.5 39.5 27.6 35.7 25.6 23.1 40.81996-97
2167 1070 1097 1690 477 895 1271
Grade 5 34.9 41.4 28.6 39.5 16.0 18.3 46.61993-94
2143 1059 1084 1724 419 886 1257Grade 8 45.1 50.9 38.6 49.3 29.0 28.1 53.61996-97
1817 957 860 1441 376 604 1209
Grade 8 44.4 51.6 36.6 47.6 31.8 27.6 51.91993-94
1935 1004 931 1542 393 601 1334
Grade 11 60.9 67.2 53.6 65.3 43.3 44.3 64.91996-97
1529 820 709 1224 305 300 1229* Percent of students achieving the competency standard or higher** Number of students in the assessment group
2619

Standardized Assessment Results
The Iowa Tests of Basic Skills (ITBS)
The Iowa Tests of Basic Skills is a norm-referenced, standardized test battery developedby the Iowa Testing Programs in Iowa City, Iowa. It is administered in February todistrict students in Grades 3, 4, 6, and 7. Scores are reported in percentiles, gradeequivalents, and normal curve equivalents. Individual building results can be found inAppendix D and Appendix E.
The ITBS tests are designed so that each successive level of the test contains items fromthe upper half (approximately) of the previous level material. Considering the basicdesign of the ITBS (or any norm-referenced test), students performing at the 50thpercentile are at the expected test and grade level average. For example, fourth gradestudents scoring at the 50th percentile in February also have a grade equivalent of 4.5.
On tests administered at the same time of year in subsequent years, a student scoring atthe 50th percentile in both years has experienced a year's growth. A student scoring atthe 50th percentile in 6th grade and at the 60th percentile in 7th grade might be said tohave experienced accelerated achievement growth, over and above that which might benormally expected during that period of time.
For the 1997 administration, district students took the reading, language, mathematics,and sources of information subtests. The reading, language, and mathematics subtestscomprise the Core Total score.
Elementary School ITBS
Grade 3. The district's national Core Total score on the 3rd grade ITBS was the 55thpercentile. Of the district's 39 elementary centers, students at 19 (49%) schools scored ator above the 50th percentile. Students at one of these elementary centers scored abovethe 80th perentile, and students at ten others equaled or surpassed the 60th percentilepoint. Students at twenty (51%) of the elementary centers scored below the 50thpercentile, with students at five schools scoring below the 40th percentile.
Grade 4. The district's national Core Total score on the 4th grade ITBS was the 55thpercentile. Of the district's 39 elementary centers, students 25 (64%) school scored abovethe 50th percentile. Students at two of these elementary centers scored above the 80thpercentile, and students at nine others equaled or surpassed the 60thpercentile point.Students at fourteen (36%) of the elementary centers scored below the 50th percentile,with students at six schools scoring below the 50th percentile (Appendix D).
2720

Elementary School Cohort Growth
Grade 3 (1995-96) to Grade 4 (1996-97). For the similar group of students, tested in thethird grade in 1996 and in the fourth grade in 1997, the district's national compositescore on the ITBS remained stable at the 55th percentile. It should be noted that thegroup of fourth grade students in 1996-97 are different from the group of third gradestudents in 1995-96 to the extent that students move into or out of the district.
Of the district's 39 elementary centers, 20 (51%) recorded an increase in Core Totalscores varying from 1 to 9 percentile points. Students at eleven of these elementarycenters improved by at least 5 percentile points. Scores for two elementary centers'students remained unchanged, with one above and one below the 50th percentile.Scores for students at seventeen elementary centers (44%) dropped between 1 and 10percentile points (Appendix D).
An analysis of the ITBS subtests for the 1996-97 fourth graders compared to their 1995-96 third grade scores (Table 11) indicates improvement on Reading Total, LanguageTotal scores, and Math Total scores, and no change in Sources of Information Totalscores.
Table 11. Elementary School ITBS Subtest Score Comparisons:Cohort Trend Percentile Ranks
National Student Norms
Grade 31995-96
Grade 41996-97
Vocabulary 51 47Reading Comprehension 55 58Reading Total 53 54Spelling 46 50Capitalization 53 63
Punctuation 58 63
Usage 62 56
Language Total 55 57
Math Concepts 58 54
Math Problem Solving 58 63
Math Total 58 60Core Total 55 55
Maps & Diagrams 61 65
Reference Materials 56 58Sources of Information Total 60 60
The Iowa Testing Programs recommends that a more appropriate way (than usingpercentile ranks) to estimate a student's developmental level, or to gauge year-to-yeargrowth, is to examine grade equivalent scores. The grade equivalent is a (decimal)number that describes a student's location on an achievement continuum. It is relativelyeasy to understand since it is anchored to the year and month of each grade level inschool. For example, a student who takes the ITBS at midyear of seventh grade wouldbe expected to achieve a grade level of 7.5 (seventh year, fifth month).
21
2 8

One common misunderstanding about grade equivalent scores is that they should beused for placement decisions. A third grade student who achieves a grade level of 5.4 inmathematics does not mean that the student should be accelerated in mathematics. Infact, the score provides no information about how that student would normallyperform on fifth grade mathematics work. What it does mean, is that the student scoredas well as an average fifth grade student in the fourth month of school who took thesame test as the third grade student. Grade equivalent scores much higher than astudent's actual grade level simply indicate exceptional performance.
Appendix D contains the Grade 3 to Grade 4 group trends using grade equivalentscores. The expected grade equivalents for the third and fourth grade are 3.5 and 4.5,respectively. Any change score that is equal to 1.0 reflects normal (expected) studentachievement growth. Any change score that is greater than 1.0 reflects acceleratedgrowth, and any change score less than 1.0 reflects student achievement growth that isless than that which would normally be expected.
As we examine grade equivalent scores, it is particularly interesting to note schools thathave students performing at a high level in the first year, and continue to achievebeyond the expected one-year's growth. It is also interesting to note the schools withstudents achieving below expectations in the first year who are closing the gap in thesecond year.
Of the district's 39 elementary centers, the average student at 21 (54%) achieved a levelof growth that is greater than would normally be expected. Students at seven schoolsprogressed as expected. Students at eleven schools achieved at a rate that is less thanwould normally be expected. However, students at three of those eleven schoolsaveraged a grade equivalent level that is at or above the expected level of 4.5. Therefore,students at eight schools did not experience achievement growth at the expected level,and achieved a lower than expected level (less than 4.5 for Grade 4).
Middle School ITBS
Grade 6. The district's national Core Total score on the 6th grade ITBS was the 56thpercentile. Of the district's 10 middle schools, students at six (60%) schools scored at orabove the 50th percentile, and students at four schools surpassed the 60th percentilepoint. Students at four (40%) of the middle schools scored below the 50th percentile,with students at one school scoring below the 40th percentile.
Grade 7. The district's national Core Total score on the 7th grade ITBS was the 57thpercentile. Of the district's 10 middle schools, students at eight (80%) schools scored ator above the 50th percentile, with students at four schools surpassing the 60th percentilepoint. Students at two (20%) of the middle schools scored below the 50th percentile; oneschool's average student score fell below the 40th percentile (Appendix E).
2 922

Middle School Cohort Growth
Grade 6 (1995-96) to Grade 7 (1996-97). For the similar group of students, tested in thesixth grade in 1996 and in the seventh grade in 1997, the district's national compositescore on the ITBS increased from the 56th to the 57th percentile.
Students at four middle schools (40%) recorded increases in Core Total scores varyingfrom 1 to 6 percentile points. Students at three of these middle schools improved by atleast 5 percentile points. Students at four middle schools decreased in Core Total scoresfrom 1 to 5 percentile points. Scores of students at two schools remained stable(Appendix E).
An analysis of the ITBS subtests for the 1996-97 seventh graders compared to their 1995-96 sixth grade scores (Table 12) indicates improvement in all areas (Total scores), withthe exception of a decrease in Reading Total scores.
Table 12. Middle School ITBS Subtest Score Comparisons:Cohort Trend Percentile Ranks
National Student Norms
Grade 61995-96
Grade 71996-97
Vocabulary 51 49Reading Comprehension 54 53Reading Total 54 52Spelling 54 55Capitalization 60 59Punctuation 57 59
Usage 56 57Language Total 56 58Math Concepts 58 58Math Problem Solving 59 59Math Total 58 59Core Total 56 57Maps & Diagrams 60 62Reference Materials 56 56Sources of Information Total 57 59
Appendix E contains the Grade 6 to Grade 7 groups trends using grade equivalentscores. The expected grade equivalents for sixth and seventh grade are 6.5 and 7.5,respectively. Of the district's ten middle schools, the average students at six (60%)achieved a level of growth that is greater than would normally be expected. Students attwo schools progressed as expected. Students at two schools achieved at a rate that isless than would normally be expected. However, students at one of these two schoolsaveraged a grade equivalent level that exceeds the expected level of 7.5 Therefore,students at one school did not experience achievement growth at the expected level,and achieved at a lower than expected level (less than 7.5 for Grade 7).
3 e

Disaggregated ITBS Scores
Disaggregated ITBS information allows an examination of the percent of students in aparticular grade and group scoring at or above a grade level standard. Table 13 showsthe percent of students scoring on grade level (50th percentile) or higher on the ITBS(Core Total).
Table 13. Percent of Students Scoring On Grade Level(50th Percentile) or Higher
ITBS Core Total ScoresNational Student Norms
Trend Results
Grade AllStudents
Males Females Non-minorityStudents
MinorityStudents
Free &Reduced
Non Free& Reduced
Grade 31995-96
51.9 54.5 49.2 57.3 32.7 36.6 60.9
Grade 41996-97
51.7 53.3 50.1 57.0 34.0 35.1 63.6
Grade 6 55.6 55.8 55.5 60.8 37.1 38.1 64.81995-96Grade 7 57.5 57.6 57.4 63.2 37.7 38.0 68.21996-97
Overall, more than half of the students scored at or above grade level on the ITBS.Gender differences in achievement are small at elementary and are minimal at middleschool. There are substantial differences between non-minority and minority students,and between students receiving subsidized meals and those not receiving subsidizedmeals. The gap between minority and non-minority students seems to decrease slightlyfrom Grade 3 to Grade 4, but widens again from Grade 6 to Grade 7. The gap betweenstudents receiving subsidized means and those not receiving subsidized meals widensat both elementary and middle school levels. The achievement gap for both of thesegroups was slightly greater when the data were disaggregated by socioeconomic ratherthan ethnic status.
Appendix F shows the percent of students scoring at or above grade level on eachstrand of the ITBS (Core, Reading, Language, Math, and Sources of Information) bybuilding for all students combined.
3124

Score Distributions for the ITBS
The convenience of ITBS percentile scores makes it very easy to set a standard ofexpectation that students will achieve on grade level. As this is done, it is important tounderstand some of the characteristics about bell-shaped curves (i.e., normaldistributions).
For example, by eliminating the students who actually score at the 50th percentile onthe ITBS, all remaining students are either scoring above or below grade level. Thatdistance from the 50th percentile point is indicative of how far above or below gradelevel a student is actually achieving. The acceptability of a student's percentile score inreference to the 50th percentile point becomes largely subjective.
Statisticiaris have examined many properties of these bell-shaped or "normal" curves.Instead of establishing cutoff points for acceptability, they establish ranges ofacceptability. As such, part of the interpretation of any normal curve is that there is adistance from the midpoint that is generally accepted as being within the range ofnormalcy. In the case of the ITBS, then, there is likely a range within which a studentwould be considered "normally developing."
Such a generally acceptable range would include approximately 68% of the students. Assuch, since the ITBS is a norm-referenced test, that is, the students scores tend to form abell-shaped curve, then "normalcy" would be defined as being within the 34 percentilepoints below and 34 percentile points above the midpoint of 50. This translates to astudent's score falling between the 16th percentile and 83rd percentile.
Table 14 shows the percent of district students over the past two years who fell below,within, and above this range of "normal" achievement. The percentages in this tableindicate that there are fewer students in the "below" category and more students in the"above" category than would normally be expected. The percent of students tested alsois an indication that we have included some students from groups for which the normswere not developed, and who may be disadvantaged by such an assessment. These mayinclude, but may not be limited to, students in special education resource rooms or non-native English speaking students.
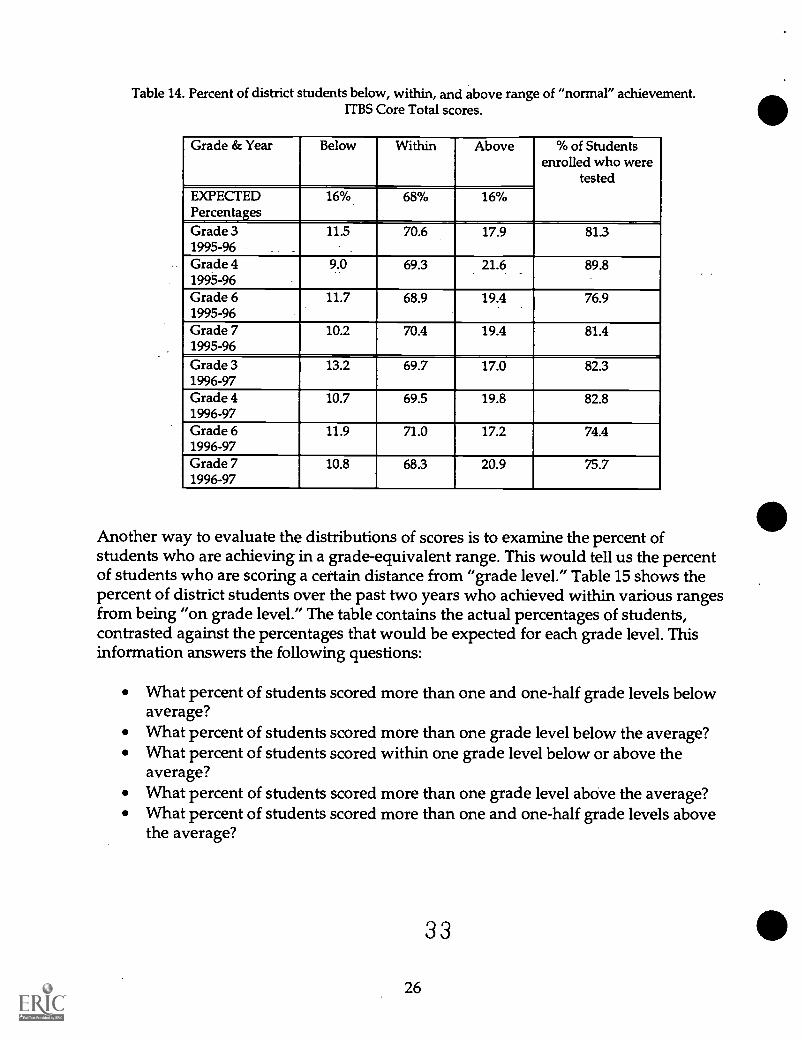
Table 14. Percent of district students below, within, and above range of "normal" achievement.ITBS Core Total scores.
Grade & Year Below Within Above % of Studentsenrolled who were
testedEXPECTEDPercentages
16% 68% 16%
Grade 31995-96
11.5 70.6 17.9 81.3
Grade 41995-96
9.0 69.3 21.6 89.8
Grade 61995-96
11.7 68.9 19.4 76.9
Grade 71995-96
10.2 70.4 19.4 81.4
Grade 31996-97
13.2 69.7 17.0 82.3
Grade 41996-97
10.7 69.5 19.8 82.8
Grade 61996-97
11.9 71.0 17.2 74.4
Grade 71996-97
10.8 68.3 20.9 75.7
Another way to evaluate the distributions of scores is to examine the percent ofstudents who are achieving in a grade-equivalent range. This would tell us the percentof students who are scoring a certain distance from "grade level." Table 15 shows thepercent of district students over the past two years who achieved within various rangesfrom being "on grade level." The table contains the actual percentages of students,contrasted against the percentages that would be expected for each grade level. Thisinformation answers the following questions:
What percent of students scored more than one and one-half grade levels belowaverage?What percent of students scored more than one grade level below the average?What percent of students scored within one grade level below or above theaverage?What percent of students scored more than one grade level above the average?What percent of students scored more than one and one-half grade levels abovethe average?
3 3
26

Table 15. Percent of students scoring within specified ranges.ITBS Core Total Scores.
Grade & Year 1.5 GradeLevels or
More Below
1 GradeLevel or
More Below
Within 1GradeLevel
Below orAbove
1 GradeLevel or
MoreAbove
1.5 GradeLevels or
MoreAbove
EXPECTEDPercentage
8 18 60 22 13
Grade 31995-96
5.3 % 13.6 % 61.7 % 24.7 % 14.0 %
Grade 31996-97
5.6 % 15.7 % 62.0 % 22.3 % 13.9 %
EXPECTEDPercentage
13 26 44 30 20
Grade 41995-96
7.5 % 17.6 % 44.6 % 37.8 % 26.8 %
Grade 41996-97
8.6 % 19.7 % 47.5 % 32.8 % 23.9 %
EXPECTEDPercentage
27 34 29 37 31
Grade 61995-96
21.9 % 28.4 % 29.6 % 42.1 % 35.8 %
Grade 61996-97
22.0 % 29.1 % 31.5 % 39.5 % 32.8 %
EXPECTEDPercentage
30 37 25 38 33
Grade 71995-96
23.2 % 29.0 % 26.3 % 44.6 % 39.1 %
Grade 71996-97
22.9 % 30.5 % 25.9 % 43.6 % 38.3 %
These results indicate that while the percent of students scoring below grade level isincreasing, the percentages are lower than that which would be expected in a normalpopulation of students, and for a specific grade level. Also, the percent of studentsscoring above grade level increases across the grades, and remains higher than thatwhich would be expected in a normal population of students.

PLAN Assessment
The PLAN is an assessment tool developed by the American College Testing (ACT)Program. It measures basic academic development in English, mathematics, reading,and science reasoning. PLAN helps identify career interests and relates these toeducational and training requirements. It measures knowledge of effective study skillsand gives students the opportunity to indicate areas of concern in which they feel theyneed assistance. PLAN can also assist students in preparing for the ACT.
Tables 16, 17, and 18 show district scores for the PLAN tests, study skills analysis, andstudent needs analysis. When reporting PLAN results, ACT reports the percent ofstudents scoring at or below a certain point. This is different from a percentile score,which is the score point below which a certain percent of scores lie. For example, theaverage 10th grade student scored as well or better than 60 percent of all students whotook the PLAN assessment. These same students, on average, scored as well or betterthan 53 percent of college-bound students.
Table 16. PLAN Subtest Scores
National Percent at or Below10th grade Students :
Tests All Students College-Bound # StudentsEnglish 55 48 911
Usage/Mechanics 59 53 911Rhetorical Skills 56 49 911
Mathematics 64 58 910Pre-Algebra/Algebra 62 55 910
Geometry 67 63 910
Reading 58 52 906
Science Reasoning 63 57 900Composite (Average) 60 53 897
Table 17. PLAN Study Skills Analysis
Skill Areas National Percent at or Below(10th grade Students):
# Students
Managing Time 8E Environment 56 907Reading Textbooks 47 907Taking Class Notes 46 906Using Resources 45 898Preparing for Tests 43 890Taking Tests 46 884Total 39 907
Note: Scores of "0" were eliminated from the analysis.
28 3 5

Table 18. PLAN Student Needs Analysis
Amount of Help NeededPercent Res ondin
Area of Need A Lot Some A Little/None
# Students
Expressing my ideas in writing 6.3 38.0 55.7 892Developing my public speaking skills 25.0 48.1 26.9 892Increasing my reading speed 18.5 36.4 45.1 891Increasing my understanding of what I read 14.0 42.1 43.9 891Developing my math skills 24.5 40.7 34.8 891Developing my study skills and study habits 24.4 49.7 26.0 890Developing my test-taking skills 23.0 47.9 29.1 891Understanding and using computers 18.5 40.7 40.8 890Choosing a college or technical school to attendafter high school
29.7 44.0 26.3 890
Selecting a career/job that is right for me 24.3 42.9 32.7 883Note: Scores of "0" were eliminated from the analysis.
Table 19 shows the academic results for the 1996-97 PLAN assessment by building.Results received from ACT for the PLAN include estimated ACT scores, if the studentwould be continuing with a constant growth pattern until the ACT were taken.Estimated ACT scores are in the form of a range from low estimated ACT score to highestimated ACT score. These are also listed in Table 19 as averages for those studentstested.
Table 19. PLAN Subtest Scores by BuildingNational Percent at or Below: All Students
East Hoover Lincoln North RooseveltNumber of Students 62 226 406 156 62
English 60 54 57 46 61
Usage/Mechanics 60 57 62 48 63Rhetorical Skills 67 55 58 49 64
Mathematics 60 62 67 52 70
Pre-Algebra/Algebra 57 61 68 51 70
Geometry 65 67 70 61 71
Reading 64 60 58 52 68
Science Reasoning 66 61 64 62 77
Composite (Average) 64 60 62 52 70
Low Estimated ACT Score 17.5 17.4 17.5 16.5 18.4
High Estimated ACT Score 21.2 21.0 21.0 20.0 22.1
236

ACT Assessment
The district's college-bound students maintained comparable scores in their meanperformance on the ACT. Eight hundred forty-two students (52%) from the Class of1997 took the ACT. The mean score for this group was 20.9 (out of 36), compared to 21.0in 1995 and 1996. The national mean for this class was 21.0 and the Iowa mean was 22.1.Table 20 shows disaggregated ACT scores.
Table 20. ACT Composite Score Comparisons (Means)Disaggregated by Ethnic Group
Year Number ofStudents
Des Moines Iowa National
All Students 1992 769 21.1 21.6 20.61993 815 20.8 21.8 20.71994 779 21.1 21.9 20.81995 859 21.0 21.8 20.81996 853 21.0 21.9 20.91997 842 20.9 22.1 21.0
AfricanAmerican
1992 69 17.6 17.9 17.01993 59 17.2 18.4 17.11994 71 19.1 19.1 17.01995 68 18.3 18.7 17.11996 73 17.7 17.8 17.01997 49 16.3 18.1 17.1
AmericanIndian
1992 4 20.3 19.2 18.11993 3 21.0 19.1 18.41994 2 17.5 19.1 18.51995 4 20.8 19.5 18.61996 4 20.0 20.1 18.81997 9 19.9 20.2 19.0
White 1992 592 21.8 21.8 21.31993 629 21.5 21.9 21.41994 569 21.8 22.0 21.41995 611 21.6 21.9 21.51996 598 21.6 22.0 21.61997 592 21.6 22.2 21.7
Hispanic 1992 16 19.6 20.2 18.71993 10 19.0 20.1 18.81994 16 18.8 20.3 18.71995 19 18.9 20.0 18.61996 25 18.8 20.6 18.81997 11 19.8 20.5 18.9
Asian 1992 52 19.3 21.1 21.61993 60 17.1 21.3 21.71994 59 18.1 21.1 21.71995 78 18.7 21.2 21.61996 66 19.0 21.3 21.61997 78 18.1 20.9 21.7
30 3 7

Scholastic Achievement Tests (SAT)
Typically, only those Des Moines students who are seeking entry into the mostprestigious universities and colleges in the country take the SAT. District studentscontinued to score well above the national average in their mean performance on theSAT.
In 1996-97, 146 students took the SAT. For all students, the SAT-Verbal mean score was564 out of 800, and the SAT-Math mean score was 555 out of 800. The Verbal mean scorefor males was 556 and for females was 571; the Math mean score for males was 575 andfor females was 537. Table 21 compares Des Moines students' scores with nationalaverages.
Table 21. SAT Composite Score Comparisons (Means)Disaggregated by Gender
Des Moines NationalYear 1994
(n=124)1995
(n=137)1996
(n=108)1997
(n=146)1994 1995 1996 1997
SAT-VerbalAll students 488 511 601 564 423 428 505 505
Males 500 529 613 556 425 429 507 507Females 474 499 587 571 421 426 503 503
SAT-MathAll students 547 585 609 555 479 482 508 511
Males 581 629 640 575 501 503 527 530
Females 508 553 571 537 460 463 492 494
3 8
31

Dissemination of Assessment Information to Buildings
Assessment results are returned to buildings in various formats throughout the year.Tests that are scanned in the buildings can yield immediate results including percentagecorrect for total scores and individual items. This can be done for district tests as well asteacher-made tests that utilize scanable forms.
During August 1997, the following activities were achieved:
Prior to the beginning of school, principals receive Test AdministrationReport Profiles (TARPs). Reports for each test are sorted by teacher andclassroom, and list student total scores and strand scores. Building principalsreceive two copies of each report: an office copy, and one for distribution toteachers.
Principals received copies of test graphs for all criterion-referenced tests. Thesecan be used for making comparisons of school average scores with the districtaverages.
Each elementary principal received a data disk containing all district-levelassessment results for all students in their school. The data included results forall criterion-referenced tests, the district's composition assessment, and ITBS.The results were in a database format, so principals or teachers could sort onthe student's name, the test name, or a grade, and be able to generate theirown summary information if they chose. Some schools are adding their ownelements to the database, and some are creating reports to distribute toparents. Even as a stand-alone file, school staff can improve efficiency by Usingthis consolidated test information file.
Each middle school principal received a data disk containing all district-levelassessment results for all fifth grade students in the district. To eliminate theneed for middle schools to contact their elementary feeder schools to findinformation on students in their buildings, they need only to look up the dataon their disk. This should facilitate student placement and scheduling intocourses.
Prior to spring conferences, each elementary school received individual student reportsfor the district composition assessment for students in Grades 3 and 5. The intent wasthat teachers could use the reports during conferences. Grade 11 English teachersreceived the same report in an electronic template format, with which they could mergethe data for each of their students and generate a paper copy report.
3239

Each student taking an ITBS test received a Profile Narrative Report of scores, alongwith a narrative of what those scores mean. The reports, generated by the Iowa TestingProgram's scoring service, are purchased from the district's testing budget. The Boardof Directors received a summary of results of the ITBS and PLAN assessment (97-164) inJune 1997.
Each student taking a PLAN assessment received an individualized report from ACT,containing individual and comparative information, along with a planning guide onhow to interpret scores and plan for the future.
Content area supervisors provide assessment information in different forms and indifferent forums for their teachers. Utilizing their copies of reports, along with results ofcustomized analyses, or additional analyses they do themselves, supervisors generateadditional information for teacher use in improving instruction. Sessions are heldduring fall and spring in-service, and at other times throughout the year.
Assessment information specific to each school is provided in the school informationbases, which are distributed annually to each school. Assessment data in the schoolinformation bases are disaggregated by gender, ethnicity, and socioeconomic status.Additional miscellaneous reports regarding student assessment information areprovided to subject-area supervisors and to schools, based on specific needs andrequests.
Plans for the future include adding to the dissemination for schools. It is planned that:
Each middle school will get a database of all of their student assessmentresults on disk.Each middle school will receive electronic or paper copies of their compositionassessment results.Each high school will get a database of all of their student assessment resultson disk.Each high school will get a database of all Grade 8 student assessment resultson disk.
Summary and Conclusions
The aggregate of information from the multiple methods of assessment in the variouscurricular areas, along with standardized assessment information, indicates that districtstudents are indeed achieving. In an urban center, where schools are a microcosm ofsociety, the complexities of life make learning an ongoing challenge. In situations wherestudent mobility rates and socioeconomic indicators create a less than satisfactorylearning environment, the district has implemented programs to provide students theopportunity to achieve at higher levels.
33 4

Groups have convened to address a number of issues related to improving academicsuccess for all students. These include, but are not limited to:
School-to-work committees focusing on essential learnings and workplacereadiness.Eight Curriculum Audit Task Forces addressing issues identified in theCurriculum Management Audit Report, including Assessment andEvaluation.Committees focusing on assessment of special populations (e.g., specialeducation students; ESL).Committees focusing on achievement of minority students.School improvement teams focusing on in depth analyses of their own data.
With the development of each new test, staff consider the possibility of more frequentassessment of students. Not only does this relieve the burden on teachers and studentsof a comprehensive examination at the end of a course, but it also allows students torespond to more items that cover a limited subset of objectives, providing a betteropportunity to demonstrate subject matter mastery. It also provides immediatefeedback for teachers and students, so that additional activities can be provided toaddress learning deficiencies.
Criterion-referenced assessment is only a part of the assessment of students that occursin the district's classrooms each day throughout the year. Improving the existingassessment system is a continuous effort. As the district's tests become focused onidentified critical objectives (as opposed to content coverage), results used for schoolimprovement activities will become more meaningful for school staffs.
One issue related to all of the assessment is the achievement gap between disaggregatedgroups. While gender differences, for the most part, are small, the differences based onethnicity are significant, as are the differences between groups based on asocioeconomic indicator.
Focusing on student achievement gaps at the individual school level might resolvesome issues at a specific site. However, the effect from a district perspective, without afocused effort, will certainly be diffused.
Most of the issues mentioned continue to be addressed on a daily basis. The complexnature of teaching-for-learning requires appropriate information for instructionalplanning and decision-making. While it seems that most of the students in the DesMoines Public Schools are indeed achieving, it is apparent that some are not. Throughcooperative efforts, the school district and the community will continue to provideopportunities for all students to achieve.
41
34

Appendix A
DEFINITIONS
Criterion-Referenced Test - a test that has been assigned a criterion score or percent that is in thedefinition of mastery or success. If a standard of achievement is not specified, these are often referred toas objectives-based tests.
Grade Equivalent - the grade level for which a score is the real or estimated average. For example, 4.2represents the fourth year, second month.
Iowa Tests of Basic Skills (ITBS) - a norm-referenced test published by the Iowa Testing Programs inIowa City, Iowa. It is administered in Grades 3, 4, 6, and 7 in the Des Moines Public Schools. The testconsists of the following parts:
Grades 3, 4, 6, & 7: Vocabulary, reading spelling, capitalization, punctuation,usage, visual material, references, math concepts, math problems,and math computation.
ITBS scores are reported in percentiles, grade equivalents, and normal curve equivalents.
Mastery Metric - a pre-specified standard that students must achieve in order to demonstrate competenceof the subject matter. This mastery standard does not compare students with each other, but with anexternal standard defined by the objectives of a course and the requirements for demonstratingcompetence. Thus, all students have an opportunity to demonstrate mastery of subject matter.
Normal Curve Equivalent - an interval scale equivalent of the bell-shaped curve. The conversion processto arrive at an NCE distribution transforms the shape of the bell-shaped curve into a rectangular shape,such that the scores are distributed equally across each point in the distribution.
Norm-Referenced Test - a test that interprets individual performance by comparing a student's score to apreviously established norm group, not to a performance criterion. The test is designed for one-half of thestudents to be above the 50th percentile and one-half below.
Objectives-Based Test - a test designed to measure one or more instructional objectives, usually thecritical skills being taught by an educational program.
Percent - the proportion of a total. In testing, it is the number of questions answered correctly divided bythe total number of items on the test.
Percentile - a point in the distribution below which a certain percent of the scores fall. For example, the80th percentile is the point below which 80 percent of the scores lie. The shape of the distribution ofpercentiles is a bell-shaped curve.
Performance-based Assessment - an assessment in which the task is the skill that students are asked toperform, such as the demonstration of writing proficiency.
4 235

Appendix A
School Norms - Show where a school building or school system average for each grade group ranksamong other averages of similar grade groups. It indicates specifically where the average score ranksamong the averages of other schools (Iowa Testing Programs).
Significance - an association between two variables or among a group of variables is said to bestatistically significant when [quantitatively] the association fulfills specific predetermined criteria.Statistical significance is largely a function of sample size, and must be weighed against a"meaningfulness" criterion. In addition to or in the absence of statistical significance, results judged ashaving educational or practical meaning may play an important role in the evaluation of outcomes, and insome cases, may be more valid than statistical significance.
Student Norms - Show where the average student ranks among other students in the same grade. Itshould be interpreted as the rank of the average student among the students (Iowa Testing Programs).
Note on Free/Reduced price meals:Results of disaggregation for all assessments were provided by the Department of Food & NutritionManagement. School Improvement staff provided the raw data files to be Matched with the CAFS(Computer Assisted Food Serivice) system files to determine the appropriate percentages. Gaining accessto these data within the limits of the law has taken about two years to accomplish. After a failed attemptto manipulate data files within database programs, the last resort was to enlist the assistance of aprogrammer from CAFS, who created the program template to access the data. While this provides accessto summary data regarding socioeconomic status, it doubles the amount of file manipulation that mustoccur to prepare the files to be read by the CAFS program.
Percent of students on free or reduced price meals was determined by combining the number of studentson free and on reduced, and dividing by the average daily membership for that grade.
4 3
36

Appendix B
District Criterion-Referenced, Objectives-Based Tests:Historical Disaggregated Data
The tables in this appendix (and in Appendix D) show:1) The percent of students in a category that scored at or above the district criterion of 70% on the end-
of-course test, and2) The total number of students in a category that took the test.
Example: Elementary Mathematics: Math 2:
Test Name AllStudents
Females Males Non-minorityStudents
MinorityStudents
Free &
Reduced
Non Free&
ReducedMath 2
1991-1992
83.8
2377
83.5
1179
84.2
1198
87.1
1941
69.5
436
73.4
954
90.9
1422
On this test,83.8% of all 2,377 second grade students tested scored a 70% or better.83.5% of 1,179 second grade females scored a 70% or better.84.2% of 1,198 second grade males scored a 70% or better.87.1% of 1,941 second grade non-minority students scored a 70% or better.69.5% of 436 second grade minority students scored a 70% or better.73.4% of 954 second grade students receiving free or reduced price meals scored a 70% or better.90.9% of 1,422 second grade students not receiving free or reduced price meals scored a 70% or better.
The following tests were given at the end of each semester:All Math tests for Grades 2 through 8; Geometry; Algebra IISocial Science for Grades 3, 4, and 5 is generally given at the end of the instruction.English 10All High School Social Science testsAll Family & Consumer Science tests
All reading tests for elementary students were given at the time that a student completed a particularbook in the series. Results represent each student's final end-of-book test for the year (unduplicatedcount). All reading tests for middle school were administered at the end of the school year. If studentsprogress at an appropriate pace, they should be able to complete Level 5 during Grade 1, Levels 6 and 7during Grade 2, Levels 8 and 9 during Grade 3, and Levels 10 through fourteen in Grades 4 through 8(one level each year).
All Science tests are now modular, such that the test for a module is given at the end of instruction, ratherthan a comprehensive test at the end of the year. This is done for all science courses from Grade 3 throughhigh school.
The remaining tests were administered at the end of the school year:Middle School ReadingAll Language Arts (except Grade 10)All French & Spanish
374 4

Appendix B
Table 81. Reading: Elementary
Test Name AllStudents
Females Males Non-minorityStudents
MinorityStudents
Free &Reduced
Non Free&
ReducedA New Day 89.7 89.9 89.3 90.1 87.4 84.8 92.3Level 51991-1992 1537 805 732 298 239 545 991A New Day 91.9 93.2 90.6 93.1 86.2 87.2 94.9Level 51992-1993 1492 737 755 1231 261 579 913A New Day 90.0 90.5 89.6 90.2 89.4 82.3 94.4Level 51993-1994 1295 681 614 1068 227 469 826A New Day 86.8 88.4 85.3 89.5 77.4 80.7 91.2Level 51994-1995 1409 689 720 1090 319 592 817A New Day 87.1 88.4 85.8 89.7 77.9 81.5 89.8Level 51995-1996 1219 620 599 957 262 383 786A New Day 90.4 91.5 89.3 90.1 91.4 86.9 92.9Level 51996-1997 1073 551 522 852 221 449 620Garden Gates 76.5 78.8 74.4 76.2 77.1 68.9 82.9Level 61991-1992 620 288 332 463 157 286 334Garden Gates 78.7 78.1 79.2 80.2 74.7 76.4 82.1Level 61992-1993 577 270 307 419 158 343 234Garden Gates 77.1 71.8 81.1 81.0 65.1 74.5 80.3Level 61993-1994 528 227 301 399 129 290 238Garden Gates 78.9 79.7 78.3 82.4 69.6 75.7 83.8Level 61994-1995 551 261 290 403 148 329 222Garden Gates 84.0 83.8 84.3 87.6 74.3 75.5 90.5Level 61995-1996 520 240 280 380 140 204 283Garden Gates 83.8 82.6 85.1 85.7 79.3 81.5 87.5Level 61996-1997 402 201 201 286 116 200 192
4 5
38

Appendix B
Test Name AllStudents
Females Males Non-minorityStudents
MinorityStudents
Free &Reduced
Non Free&
ReducedGoing Places 93.4 94.2 92.5 94.7 87.3 89.1 95.8Level 71991-1992 1634 829 805 1350 284 599 1033
Going Places 95.3 95.5 95.2 96.2 91.2 93.2 96.7Level 71992-1993 1651 866 785 1378 273 628 1023
Going Places 95.3 96.1 94.6 96.3 90.9 92.2 97.4Level 71993-1994 1740 890 850 1423 317 689 1051
Going Places 93.7 94.5 92.8 94.8 89.6 89.8 96.5Level 71994-1995 1420 763 657 1122 298 591 829Going Places 96.0 97.1 94.9 96.6 94.0 94.6 96.7Level 71995-1996 1308 658 650 1008 300 445 808Going Places 95.0 96.1 94.1 95.9 91.7 93.3 96.0Level 71996-1997 1250 608 642 986 264 466 781
Castles of Sand 75.1 77.7 72.9 78.3 65.4 70.8 78.7Level 81991-1992 714 327 387 535 179 332 381Castles of Sand 73.4 75.2 72.0 72.6 76.0 71.5 75.8Level 81992-1993 504 218 286 379 125 277 227Castles of Sand 71.4 76.6 67.5 73.9 64.5 68.2 75.9Level 81993-1994 405 171 234 295 110 239 166Castles of Sand 73.9 74.5 73.4 76.5 67.3 69.8 80.5Level 81994-1995 528 231 297 378 150 328 200Castles of Sand 76.4 75.0 77.6 79.0 69.4 74.1 79.6Level 81995-1996 453 212 241 329 124 193 235Castles of Sand 66.4 68.1 64.7 68.5 62.1 65.5 67.5Level 81996-1997 453 232 221 308 145 249 203
4 G
39

Appendix B
Test Name AllStudents
Females Males Non-minorityStudents
MinorityStudents
Free &Reduced
Non Free&
ReducedOn the Horizon 90.3 91.2 89.4 91.7 83.4 85.3 93.2Level 91991-1992 1761 885 876 1466 295 631 1127On the Horizon 89.9 91.6 88.2 91.4 82.7 84.2 93.2Level 91992-1993 1745 867 878 1438 307 652 1093On the Horizon 88.8 90.4 87.0 90.7 79.6 83.2 92.2Level 91993-1994 1701 883 818 1402 299 641 1060On the Horizon 88.9 89.4 88.5 91.3 78.5 83.8 92.2Level 91994-1995 1872 959 913 1523 349 729 1143On the Horizon 91.0 92.1 89.7 92.0 87.0 89.3 92.1Level 91995-1996 1487 785 702 1188 299 477 971On the Horizon 90.2 91.8 88.6 91.5 85.3 87.8 91.8Level 91996-1997 1410 711 699 1111 299 581 822Silver Secrets 84 84.5 83.6 85.1 78.8 75.4 88.9Level 101991-1992 1765 894 871 1468 297 629 1131Silver Secrets 84.1 85.2 83.1 87.0 71.8 73.8 90.5Level 101992-1993 1853 918 935 1502 351 706 1147Silver Secrets 87.2 88.0 86.4 88.9 79.8 80.3 91.5Level 101993-1994 1822 920 902 1475 347 701 1121Silver Secrets 85.1 88.0 82.2 87.2 76.6 78.5 89.3Level 101994-1995 1734 875 859 1397 337 671 1063Silver Secrets 88.3 88.7 87.9 90.4 79.9 84.2 91.3Level 101995-1996 1921 958 963 1537 384 626 1233Silver Secrets 84.9 85.7 84.0 86.9 76.5 78.9 88.6Level 101996-1997 1469 756 713 1180 289 564 903
4 7
40

Appendix B
Test Name AllStudents
Females Males Non-minorityStudents
MinorityStudents
Free &Reduced
Non Free&
ReducedDream Chasers 85.5 87.3 83.5 87.4 75.1 79 88.6Level 111991-1992 1507 774 733 1274 233 482 1023Dream Chasers 88.7 90.5 86.7 90.6 79.5 83.2 91.7Level 111992-1993 1618 853 765 1340 278 570 1048Dream Chasers 86.4 86.0 86.9 88.7 74.7 79.0 90.4Level 111993-1994 1547 794 753 1294 253 544 1003Dream Chasers 87.2 86.8 87.6 89.0 79.0 77.3 92.1Level 111994-1995 1471 756 715 1199 272 493 978Dream Chasers 87.4 88.2 86.5 90.6 74.0 82.0 89.9Level 111995-1996 1551 789 762 1251 300 449 1059Dream Chasers 87.1 88.8 85.3 88.1 82.0 79.6 91.1Level 111996-1997 1425 724 701 1197 228 485 937
Table B2. Reading: Middle
Test Name AllStudents
Females Males Non-minorityStudents
MinorityStudents
Free &Reduced
Non Free&
ReducedWind by the Sea 66.1 70.1 61.7 71.5 43.3 48.4 74.3Level 121991-1992 1642 850 792 1328 314 519 1123Wind by the Sea 75.6 76.7 74.5 78.9 61.0 61.2 84.0Level 121992-1993 1952 983 969 1590 362 720 1232Wind by the Sea 75.6 79.5 71.4 79.0 61.5 63.0 83.0Level 121993-1994 1964 1014 950 1574 390 732 1232Wind by the Sea 76.1 78.1 74.1 79.6 62.1 62.6 84.9Level 121994-1995 1996 1012 984 1595 401 789 1207Wind by the Sea 77.0 78.0 75.9 80.7 63.0 65.5 83.2Level 121995-1996 1902 990 912 1502 400 595 1247Wind by the Sea 76.1 78.5 73.7 79.9 64.3 66.1 83.3Level 121996-1997 1651 854 797 1253 398 681 969
4148,

Appendix B
Test Name AllStudents
Females Males Non-minorityStudents
MinorityStudents
Free &Reduced
Non Free&
ReducedStar Walk 59.3 63.4 55.2 63.2 41.2 40.5 66.7Level 131991-1992 1435 718 717 1180 255 407 1028Star Walk 74.4 77.7 70.9 77.3 62.7 59.2 82.1Level 131992-1993 2029 1051 978 1630 399 679 1350Star Walk 73.2 75.2 71.2 77.0 56.9 56.4 81.7Level 131993-1994 1864 930 934 1507 357 626 1238Star Walk 73.8 76.9 70.3 79.5 53.1 61.7 81.0Level 131994-1995 1839 978 861 1442 397 686 1153Star Walk 71.2 73.9 68.2 75.5 54.6 61.5 75.7Level 131995-1996 1661 862 799 1315 346 483 1129Star Walk 75.8 77.6 73.7 80.5 61.1 63.1 83.0Level 131996-1997 1506 802 704 1136 370 540 963Worlds Beyond 50.7 56.5 45.2 52.8 43.3 40.3 54.9Level 141991-1992 647 317 330 506 141 186 461Worlds Beyond 52.0 57.9 45.3 54.8 40.3 37.4 59.2Level 141992-1993 1006 534 472 810 196 334 672Worlds Beyond 51.0 56.0 45.7 54.4 39.5 38.2 59.6Level 141993-1994 531 277 254 412 119 212 319Worlds Beyond 51.6 50.1 53.1 57.1 37.5 36.9 61.6Level 141994-1995 744 377 367 536 208 301 443Worlds Beyond 48.6 52.5 43.8 55.6 32.6 37.2 55.7Level 141995-1996 867 474 393 603 264 293 540Worlds Beyond 56.5 56.4 56.5 59.7 44.4 44.7 64.0Level 141996-1997 852 443 409 672 180 333 519
4 9
42

Appendix B
Table B3. Mathematics: Elementary
Test Name AllStudents
Females Males Non-minorityStudents
MinorityStudents
Free &Reduced
Non Free&
Reduced,
Math 2 Sem. 1 88.9 NA NA NA NA 83.7 92.81996-1997
2344 1008 1297Math 2 Sem. 2 83.7 NA NA NA NA 75.9 89.71996-1997
2379 1034 1310
Math 3 Sem. 1 69.5 69.7 69.4 73.6 58.3 60.3 77.71996-1997
2173 1070 1103 1595 578 1014 1159Math 3 Sem. 2 62.0 61.7 62.2 65.1 53.1 52.3 70.31996-1997
2140 1055 1085 1583 557 987 1153
Math 4 Sem. 1 61.6 63.1 60.0 65.9 47.3 51.0 69.91996-1997
1988 993 995 1521 467 876 1112Math 4 Sem. 2 54.2 55.3 53.0 58.5 40.2 42.9 63.21996-1997
2053 1029 1024 1563 490 912 1141Note: Math 2 is processed differently than other tests. Programming is not in place to disaggregate thesefiles by gender and ethnicity. Tables will be updated when programming is completed.
Table B4. Mathematics: Middle
Test Name AllStudents
Females Males Non-minorityStudents
MinorityStudents
Free &Reduced
Non Free&
ReducedMath 7 Sem. 1 49.7 48.2 51.2 53.3 38.8 39.2 56.91996-1997
1454 769 685 1088 366 592 861
Math 8 Sem. 1 41.7 44.2 39.0 43.7 34.9 36.4 45.91996-1997
825 428 397 639 186 365 460Math 8 Sem. 2 20.5 19.1 22.0 21.8 15.9 17.0 23.31996-1997
794 413 381 618 176 348 446
5 043

Appendix B
Test Name AllStudents
Females Males Non-minorityStudents
MinorityStudents
Free &Reduced
Non Free&
ReducedPre-Algebra 54.4 53.3 55.6 56.5 42.5 41.7 57.71993-1994
706 368 338 600 106 144 562Pre-Algebra 63.6 61.5 65.9 64.2 59.8 56.0 65.41994-1995
698 361 337 601 97 134 564Pre-Algebra 63.7 60.5 67.2 66.7 46.4 52.3 66.61995-1996
755 392 363 645 110 128 613Pre-Algebra 55.7 53.0 59.1 58.1 45.2 46.2 58.61996-1997
741 411 330 606 135 171 570Algebra I 71.8 70.2 73.2 72.1 68.4 60.7 73.11994-1995
277 124 153 258 19 28 249Algebra I 68.9 64.3 74.1 67.2 81.4 55.3 71.01995-1996
351 185 166 308 43 47 303Algebra I 70.3 66.1 73.8 70.7 66.7 59.0 71.61996-1997
360 165 195 321 39 39 320Cent. Academy 100.0 100.0 100.0 100.0 100.0 100.0 100.0Geometry (S. 2)1996-1997 33 9 24 31 2 2 30Cent. Academy 94.1 66.7 100.0 NA NA NA NAAlgebra II (S. 1)1996-1997 17 3 14Note: Due to confidentiality guidelines, results for individual students are not released.
Table B5. Mathematics: High
Test Name AllStudents
Females Males Non-minorityStudents
MinorityStudents
Free &Reduced
Non Free&
ReducedIntroductory 17.6 15.2 19.4 22.6 7.6 10.4 22.0Mathematics1993-1994 431 184 247 287 144 163 268Introductory 24.0 17.2 29.6 27.0 17.1 20.9 26.1Mathematics1994-1995 387 174 213 270 117 153 234Introductory 15.4 9.3 20.3 21.8 8.5 10.2 20.2Mathematics1995-1996 241 108 133 124 117 98 124Introductory 20.1 16.1 23.5 27.1 10.9 11.4 31.3Mathematics1996-1997 299 137 162 170 129 167 131
5 144

Appendix B
Test Name AllStudents
Females Males Non-minorityStudents
MinorityStudents
Free &Reduced
Non Free&
ReducedIntroductory 37 34.3 39.9 36.8 37.6 39.9 36.2Algebra1991-1992 611 315 296 478 133 138 473Introductory 37.6 37.1 38.0 39.4 31.1 34.1 39.2Algebra1992-1993 548 272 276 429 119 170 378Introductory 42.9 38.4 47.8 42.3 47.1 45.2 42.2Algebra1993-1994 140 73 67 123 17 31 109Introductory 47.6 48.5 46.8 47.0 52.0 43.3 49.6Algebra1994-1995 191 97 94 166 25 60 131
Introductory 27.6 24.4 30.9 29.1 20.7 25.5 29.8Algebra1995-1996 163 82 81 134 29 55 104Introductory 27.5 22.7 32.1 26.4 31.3 32.8 24.2Algebra1996-1997 153 75 78 121 32 58 95
Algebra I 33.7 31.6 36.3 34.6 29.9 30.8 34.41994-1995
945 534 411 761 184 201 744Algebra I 29.7 28.4 31.3 32.4 20.9 26.4 31.11995-1996
993 539 454 763 230 197 762Algebra I 32.1 31.0 33.3 33.5 26.3 28.2 33.21996-1997
829 429 400 669 160 181 648
Geometry 74.2 69.7 80.2 73.4 78.6 57.1 76.3(Sem. 1)1996-1997 256 145 111 214 42 28 224Geometry 48.7 45.1 53.4 49.7 44.0 39.7 50.2(Sem. 2)1996-1997 867 494 373 708 159 136 729
Algebra II 37.7 39.0 35.9 38.8 32.1 41.0 37.6(Sem. 1)1995-1996 674 390 284 562 112 61 593Algebra II 29.6 27.3 32.4 30.3 26.1 25.7 29.6(Sem. 1)1996-1997 855 472 383 713 142 105 743
Algebra II 24.9 26.4 22.7 26.3 17.4 15.9 25.6(Sem. 2)1995-1996 704 409 295 589 115 63 620
Algebra II 33.8 35.1 32.2 34.8 27.8 23.6 35.8(Sem. 2)1996-1997 767 413 354 652 115 72 667
45 5 2
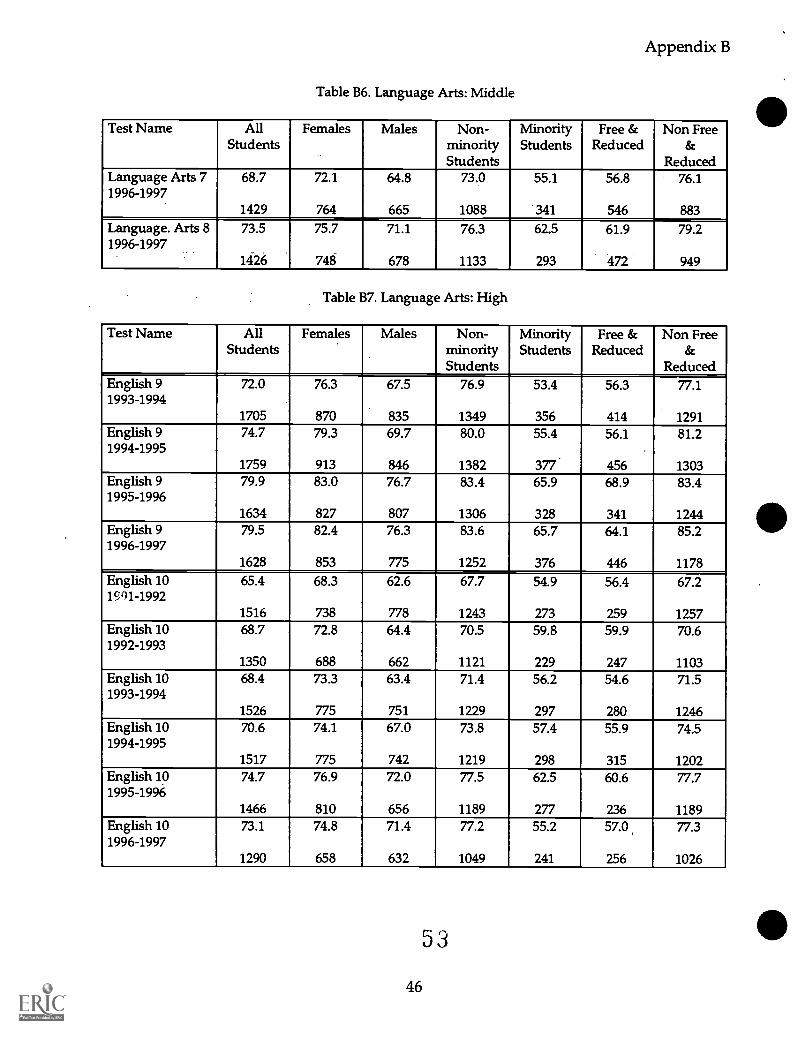
Appendix B
Table B6. Language Arts: Middle
Test Name AllStudents
Females Males Non-minorityStudents
MinorityStudents
Free &Reduced
Non Free&
ReducedLanguage Arts 7 68.7 72.1 64.8 73.0 55.1 56.8 76.11996-1997
1429 764 665 1088 341 546 883Language. Arts 8 73.5 75.7 71.1 76.3 62.5 61.9 79.21996-1997
14-26 748 678 1133 293 472 949
Table B7. Language Arts: High
Test Name AllStudents
Females Males Non-minorityStudents
MinorityStudents
Free &Reduced
Non Free&
ReducedEnglish 9 72.0 76.3 67.5 76.9 53.4 56.3 77.11993-1994
1705 870 835 1349 356 414 1291English 9 74.7 79.3 69.7 80.0 55.4 56.1 81.21994-1995
1759 913 846 1382 377 456 1303English 9 79.9 83.0 76.7 83.4 65.9 68.9 83.41995-1996
1634 827 807 1306 328 341 1244English 9 79.5 82.4 76.3 83.6 65.7 64.1 85.21996-1997
1628 853 775 1252 376 446 1178English 10 65.4 68.3 62.6 67.7 54.9 56.4 67.219014992
1516 738 778 1243 273 259 1257English 10 68.7 72.8 64.4 70.5 59.8 59.9 70.61992-1993
1350 688 662 1121 229 247 1103English 10 68.4 73.3 63.4 71.4 56.2 54.6 71.51993-1994
1526 775 751 1229 297 280 1246English 10 70.6 74.1 67.0 73.8 57.4 55.9 74.51994-1995
1517 775 742 1219 298 315 1202English 10 74.7 76.9 72.0 77.5 62.5 60.6 77.71995-1996
1466 810 656 1189 277 236 1189English 10 73.1 74.8 71.4 77.2 55.2 57.0 77.31996-1997
1290 658 632 1049 241 256 1026
5 3
46

Appendix B
Table B8. Foreign Language: Middle
Test Name AllStudents
Females Males Non-MinorityStudents
MinorityStudents
Free &Reduced
Non Free&
Reduced
MS French 46.4 53.3 36.1 45.6 50.0 36.0 48.41993-1994
153 92 61 125 28 25 128
MS French 54.5 61.3 45.8 53.2 62.5 52.2 55.21994-1995
110 62 48 94 16 23 87MS French 55.6 60.8 46.3 54.1 62.1 51.6 55.91995-1996
151 97 54 122 29 31 118
MS French 37.7 30.8 48.1 39.3 30.4 25.9 40.81996-1997
130 78 52 107 23 27 103
MS Spanish 46.5 54.1 37.0 47.1 44.3 45.2 47.01993-1994
372 207 165 293 79 93 279
MS Spanish 45.6 47.2 43.7 44.9 48.4 43.5 46.41994-1995
318 176 142 254 64 85 233
MS Spanish 49.4 53.5 43.8 50.2 47.3 52.7 47.71995-1996
395 226 169 285 110 112 281
MS Spanish 52.3 57.5 44.7 52.0 53.2 49.3 53.71996-1997
440 261 179 331 109 142 298
Table B9. Foreign Language: High
Test Name AllStudents
Females Males Non-MinorityStudents
MinorityStudents
Free &Reduced
Non Free&
Reduced
HS French 61.8 68.2 51.5 63.4 54.8 39.4 67.11993-1994
173 107 66 142 31 33 140
HS French 70.5 71.5 68.8 74.2 57.8 53.7 74.81994-1995
200 123 77 155 45 41 159
HS French 61.0 64.8 55.6 63.4 53.5 53.8 63.21995-1996
177 105 72 134 43 26 144
HS French 56.6 60.8 50.0 61.3 34.5 38.7 60.71996-1997
166 102 64 137 29 31 135
4754

Appendix B
Test Name AllStudents
Females Males Non-MinorityStudents
MinorityStudents
Free &Reduced
Non Free&
ReducedHS Spanish 49.2 52.9 44.3 51.6 38.2 41.4 51.01993-1994
612 350 262 502 110 116 496HS Spanish 53.5 53.4 53.7 55.9 44.4 47.9 54.81994-1995
654 371 283 521 133 119 535HS Spanish 56.4 59.3 53.4 59.8 43.4 49.6 58.41995-1996
700 361 339 557 143 131 546HS Spanish 59.8 66.8 50.2 60.5 57.2 53.2 61.71996-1997
642 371 271 504 138 141 501
Table B10. Science: Elementary
Test Name AllStudents
Females Males Non-minorityStudents
MinorityStudents
Free &Reduced
Non Free&
ReducedScience 3: 75.6 76.6 74.6 79.2 61.2 69.4 80.9Structures of Life1994-1995 1617 798 819 1290 327 744 873Science 3: 78.5 80.9 76.1 80.9 70.5 74.2 81.4Structures of Life1995-1996 1943 986 957 1499 444 708 1212Science 3: 77.6 78.0 77.3 80.5 69.2 73.1 81.5Structures of Life1996-1997 1865 905 960 1398 467 849 1015Science 3: 70.1 67.9 72.2 73.8 55.3 60.4 77.4Measurement1994-1995 1847 898 949 1478 369 793 1054Science 3: 65.5 64.6 66.4 68.7 54.4 57.0 71.0Measurement1995-1996 1749 874 875 1363 386 640 1088Science 3: 61.6 60.2 63.0 66.8 46.4 53.7 68.4Measurement1996-1997 1911 926 985 1428 483 875 1035Science 3: 62.9 64.2 61.6 66.1 50.3 59.9 65.3Earth Materials1994-1995 1790 880 910 1426 364 785 1005Science 3: 66.4 69.4 63.4 68.7 58.1 61.3 69.8Earth Materials1995-1996 1717 851 866 1347 370 628 1060Science 3: 68.1 68.7 67.4 70.3 61.6 63.3 72.4Earth Materials1996-1997 1709 841 868 1258 451 815 894
48

Appendix B
Test Name AllStudents
Females Males Non-minorityStudents,
MinorityStudents
Free &Reduced
Non Free&
ReducedScience 4: Pillbug 83.8 83.6 83.9 86.2 74.3 77.5 88.8& Pond Life1994-1995 1720 836 884 1366 354 764 956Science 4: Pillbug 84.4 84.9 83.9 86.4 75.9 77.5 88.7& Pond Life1995-1996 1720 834 886 1388 332 632 1063Science 4: Pillbug 87.5 87.3 87.6 89.3 81.4 83.6 90.4& Pond Life1996-1997 1858 940 918 1434 424 798 1060
Science 4: 81.2 81.2 81.3 85.7 65.1 75.9 85.4Water1994-1995 1914 930 984 1499 415 838 1076Science 4: 84.5 85.8 83.3 86.8 75.8 80.7 87.2Water1995-1996 2041 992 1049 1612 429 751 1254Science 4: 84.6 85.5 83.7 87.6 73.8 78.0 89.4Water1996-1997 1841 925 916 1440 401 765 1075
Science 4: 67.7 66.8 68.5 71.8 52.2 58.1 74.9Electricity1994-1995 1936 942 994 1530 406 836 1100Science 4: 72.5 72.1 72.8 76.3 57.5 62.9 78.0Electricity1995-1996 2051 994 1057 1637 414 727 1290Science 4: 70.4 71.8 68.9 73.3 60.9 61.6 77.2Electricity1996-1997 1856 929 927 1421 435 809 1047
Science 5: 68.7 66.1 71.2 71.7 56.3 58.1 76.0Landforms1994-1995 1571 763 808 1267 304 645 926Science 5: 67.7 67.8 67.6 71.3 55.5 58.8 73.1Landforms1995-1996 1884 932 952 1459 425 680 1181
Science 5: 74.0 72.5 75.5 76.8 63.5 63.8 81.2Landforms1996-1997 1952 954 998 1541 411 803 1148
Science 5: Powders 81.4 81.9 80.9 84.1 70.3 73.5 86.6& Crystals1994-1995 1725 855 870 1392 333 688 1037Science 5: Powders 81.1 83.3 79.0 83.0 74.8 75.9 84.0& Crystals1995-1996 1972 978 994 1516 456 714 1228
Science 5: Powders 84.3 86.2 82.3 86.8 75.9 78.3 88.5& Crystals1996-1997 1964 973 991 1512 452 816 1147
49 513

Appendix B
Test Name AllStudents
Females Males Non-minorityStudents
MinorityStudents
Free &Reduced
Non Free&
ReducedScience 5: Levers & 68.4 64.8 71.9 71.4 56.9 60.6 73.8Pulleys1994-1995 1579 785 794 1252 327 645 934Science 5: Levers & 65.4 62.3 68.5 69.7 51.3 58.9 69.9Pulleys1995-1996 1837 904 933 1408 429 671 1138Science 5: Levers & 68.1 66.6 69.6 72.0 54.5 58.9 74.9Pulleys1996-1997 1970 971 999 1530 440 834 1134
Table B11. Science: High School Biology
Test Name AllStudents
Females Males Non-minorityStudents
MinorityStudents
Free &Reduced
Non Free&
ReducedBiology Ml: 57.2 54.6 60.6 60.5 42.1 40.9 60.0Intro & Chem1995-1996 1038 584 454 855 183 149 874Biology Ml: 61.5 60.4 62.7 66.1 44.9 46.2 65.5Intro & Chem.1996-1997 1226 628 598 961 265 253 972Biology M2: 55.2 51.8 59.7 58.5 41.6 43.5 57.5Cytology1995-1996 1214 691 523 976 238 191 1002Biology M2: 65.7 65.4 65.9 70.3 49.1 54.4 68.6Cytology1996-1997 1270 651 619 995 275 261 1009Biology M3: 41.0 40.3 42.1 43.3 31.5 33.7 42.4Genetics1995-1996 1145 648 497 923 222 172 943Biology M3: 46.0 45.3 46.8 49.6 31.9 32.5 49.4Genetics1996-1997 1004 519 485 800 204 203 801
Biology M4: 73.9 72.1 76.3 77.3 59.5 63.4 75.9Evolution1995-1996 1188 674 514 961 227 172 987Biology M4: 72.5 69.9 75.3 76.9 56.9 56.1 76.7Evolution1996-1997 1198 607 591 938 260 237 960Biology M5: 33.8 35.3 31.9 36.9 20.9 25.7 35.5Kingdoms1995-1996 1137 629 508 917 220 171 941Biology M5: 45.4 44.6 46.1 48.6 32.9 31.1 48.8Kingdoms1996-1997 1025 522 503 815 210 196 826
5 7
50

Appendix B
Test Name AllStudents
Females Males Non-minorityStudents
MinorityStudents
Free &Reduced
Non Free&
Reduced
Biology M6: 59.2 59.6 58.8 63.4 43.5 44.1 61.7Human Systems1995-1996 1001 557 444 792 209 136 839
Biology M6: 60.9 61.6 60.2 67.1 37.9 45.3 64.6Human Systems1996-1997 1210 619 591 954 256 234 975
,
Biology M7: 70.6 68.3 73.3 74.0 56.1 62.0 72.1Ecology1995-1996 1111 616 495 897 214 179 914
,
Biology M7: 69.6 68.1 71.1 74.1 52.1 51.7 74.0Ecology1996-1997 1058 542 516 839 219 207 850
Table B12. Science: High School Chemistry
Test Name AllStudents
Females Males Non-minorityStudents
MinorityStudents
Free &Reduced
Non Free&
Reduced
Chemistry 74.1 71.1 77.9 76.3 63.5 67.1 74.9Module 11995-1996 745 415 330 619 126 73 665
Chemistry 62.6 59.6 66.5 66.8 46.5 48.0 64.7Module 11996-1997 767 433 334 608 159 98 669
Chemistry 48.9 47.4 50.8 50.1 43.1 47.8 48.8Module 21995-1996 707 392 315 591 116 67 633
Chemistry 55.5 53.3 58.3 57.8 45.4 44.2 56.3Module 21996-1997 542 300 242 445 97 52 467
Chemistry 57.7 53.7 62.6 60.3 43.8 48.4 58.6Module 31995-1996 667 365 302 562 105 62 597
Chemistry 53.0 46.9 60.9 55.6 41.0 47.0 53.8Module 31996-1997 596 335 261 491 105 66 530
Chemistry 44.1 42.4 46.4 45.3 36.9 41.3 44.4Module 41995-1996 589 328 261 505 84 46 531
Chemistry 49.7 44.4 56.7 52.0 38.7 50.9 49.6Module 41996-1997 553 315 238 460 93 57 496
5851

Appendix B
Test Name AllStudents
Females Males Non-minorityStudents
MinorityStudents
Free &Reduced
Non Free&
ReducedChemistry 63.9 62.6 65.5 64.8 58.8 66.7 63.3Module 51995-1996 582 321 261 497 85 45 526Chemistry 55.3 52.4 58.7 55.8 52.7 51.0 55.4Module 51996-1997 561 309 252 468 93 51 487Chemistry 48.3 45.0 52.1 48.7 46.2 44.2 48.2Module 61995-1996 613 331 282 522 91 52 548Chemistry 42.7 42.6 42.9 44.3 33.9 27.9 44.4Module 61996-1997 412 230 182 350 62 43 369
Table B13. Science: High School Physics
Test Name AllStudents
Females Males Non-minorityStudents
MinorityStudents
Free &Reduced
Non Free&
ReducedPhysics Ml: 57.8 51.1 64.4 57.8 57.8 47.6 58.7Forces1995-1996 460 227 233 377 83 42 412Physics Ml: 60.4 57.8 63.3 60.5 60.0 60.0 53.6Forces1996-1997 447 232 215 397 50 35 412Physics M2: 71.5 64.0 78.7 70.9 74.1 70.7 71.3Work1995-1996 452 222 230 371 81 41 404Physics M2: 57.7 52.9 63.2 57.7 57.7 67.6 56.9Work1996-1997 447 238 209 395 52 34 413Physics M3: Heat 68.2 66.0 70.4 67.9 69.6 56.8 69.51995-1996
393 194 199 324 69 37 347Physics M3: Heat 63.1 61.6 64.9 62.6 67.4 62.1 63.21996-1997
431 229 202 385 46 29 402Physics M4: 49.2 46.5 51.9 48.9 50.7 40.5 50.1Light1995-1996 429 213 216 354 75 37 383Physics M4: 52.2 54.1 50.0 52.0 53.8 53.8 52.1Light1996-1997 389 205 184 350 39 26 363
5 9
52

Appendix B
Test Name AllStudents
Females Males Non-minorityStudents
MinorityStudents
Free &Reduced
Non Free&
ReducedPhysics M5: 66.1 65.9 66.3 67.5 58.5 67.7 66.0Electricity1995-1996 345 179 166 292 53 31 306Physics M5: 69.7 68.2 71.7 70.0 66.7 50.0 71.0Electricity1996-1997 297 170 127 273 24 18 279
Table B14. Social Science: Elementary
Test Name AllStudents
Females Males Non-minorityStudents
MinorityStudents
Free &Reduced
Non Free&
ReducedSocial Science 3 71.8 71.5 72.2 75.7 58.2 61.9 78.41995-1996
2012 1002 1010 1569 443 727 1234Social Science 3 70.0 69.7 70.3 74.4 56.5 59.2 78.71996-1997
2021 1002 1019 1518 503 906 1115
Social Science 4 76.0 77.0 74.9 79.6 62.3 63.6 83.61995-1996
2122 1045 1077 1679 443 747 1321Social Science 4 77.7 77.5 77.9 81.7 63.1 66.1 86.21996-1997
1959 992 967 1533 426 828 1131
Social Science 5 52.1 51.5 52.8 57.6 34.2 45.0 61.81995-1996
2074 1022 1052 1591 483 744 1283Social Science 5 53.8 51.3 56.3 58.6 36.5 40.6 67.51996-1997
2109 1046 1063 1649 460 855 1253
GO
53

Appendix B
Table B15. Social Science: Middle
Test Name AllStudents
Females Males Non-minorityStudents
MinorityStudents
Free &Reduced
Non Free&
ReducedCentral Acad. 89.4 82.4 96.9 90.9 81.8 71.4 91.5Government1993-1994 66 34 32 55 11 7 59Central Acad. 86.0 84.1 88.1 86.2 84.6 75.0 87.1Government1994-1995 136 69 67 123 13 12 124Central Acad. 94.5 90.9 98.2 95.9 83.3 88.9 95.0Government1995-1996 110 55 55 98 12 9 100Central Acad. 96.3 95.8 97.1 97.3 87.5 100.0 96.1Government1996-1997 82 48 34 74 8 5 76
Table B16. Social Science: High
Test Name AllStudents
Females Males Non-minorityStudents
MinorityStudents
Free &Reduced
Non Free&
ReducedWorld History 71.4 39.4 32.4 63.4 8.28 29.0 49.9(Sem. 1)1996-1997 1723 919 804 1331 392 493 1227World History 44.2 42.6 45.8 46.9 31.9 30.8 50.3(Sem. 2)1995-1996 1316 659 657 1078 238 266 1013World History 39.0 35.9 42.3 43.2 26.4 27.1 46.5(Sem. 2)1996-1997 1572 810 762 1178 394 461 1111American 40.2 35.3 45.4 41.1 36.7 30.7 42.7History (Sem. 1)1996-1997 1329 688 641 1059 270 274 1055American 59.1 56.0 62.3 61.7 46.5 44.7 61.4History (Sem. 2)1995-1996 1325 675 650 1099 226 170 1113American 61.5 56.2 67.5 64.3 49.6 47.4 64.5History (Sem. 2)1996-1997 1343 707 636 1091 252 234 1109
61
54

Appendix B
Test Name AllStudents
Females Males Non-minorityStudents
MinorityStudents
Free &Reduced
Non Free&
Reduced
Government 63.7 61.7 65.6 66.7 52.3 46.8 66.71993-1994
535 256 279 426 109 79 456
Government 63.1 59.4 67.2 68.0 42.4 45.4 66.11994-1995
1283 668 615 1040 243 185 1098
Government 62.9 61.9 64.0 68.0 43.9 44.2 65.91995-1996
1280 669 611 1009 271 163 1104
Government 63.7 60.1 67.7 67.7 45.8 46.6 66.71996-1997
1176 622 554 962 214 174 1002
Economics 48.0 46.3 49.4 50.7 27.5 27.8 49.11992-1993
342 164 178 302 40 18 324
Economics 46.6 37.7 54.9 48.5 34.1 31.3 47.41993-1994
337 162 175 293 44 16 321
Economics 46.2 42.2 50.5 46.9 41.2 35.1 47.31994-1995
392 204 188 341 51 37 355
Economics 37.2 34.1 40.6 39.8 21.6 31.1 40.91995-1996
712 372 340 610 102 45 660
Economics 40.0 33.1 48.0 42.5 25.7 28.6 47.11996-1997
772 414 358 659 113 77 694
Table B17. Family & Consumer Science: High
Test Name AllStudents
Females Males Non-minorityStudents
MinorityStudents
Free &Reduced
Non Free&
Reduced
Food & Nutrition 28.8 31.6 23.8 35.1 15.3 21.6 33.71996-1997
475 307 168 325 150 185 285
Sewing 26.7 25.0 66.7 34.1 16.1 18.4 35.1
Technology1996-1997 75 72 3 44 31 38 37
55
6 2

Appendix B
Test Name AllStudents
Females Males Non-minorityStudents
MinorityStudents
Free &Reduced
Non Free&
ReducedChild 63.2 64.9 50.0 67.9 48.3 52.5 67.5Development1992-1993 495 439 56 377 118 141 354Child 60.7 63.5 26.7 66.3 36.1 43.4 67.7Development1993-1994 392 362 30 320 72 113 279Child 67.7 70.1 45.5 74.7 49.6 57.3 71.9Development1994-1995 465 421 44 336 129 131 334Child 63.6 65.8 46.8 72.2 42.9 48.0 71.3Development1995-1996 407 360 47 288 119 123 272Child 55.0 56.6 36.4 62.4 34.8 46.3 61.8Development1996-1997 429 396 33 314 115 177 249Personal 53.0 57.9 40.4 56.2 46.2 47.1 56.0Development1993-1994 202 145 57 137 65 68 134Personal 44.7 50.0 25.0 48.5 33.3 37.3 49.4Development1994-1995 132 104 28 99 33 51 81Personal 58.1 55.8 64.3 63.0 46.9 57.1 59.7Development1995-1996 105 77 28 73 32 35 67Personal 64.8 65.9 62.2 65.0 64.4 58.8 68.9Development1996-1997 125 88 37 80 45 51 74Parenting 61.8 65.2 30.0 63.1 55.6 52.6 100.01992-1993
102 92 10 84 18 19 53Parenting 57.5 60.7 35.3 60.6 44.0 41.4 61.91993-1994
134 117 17 109 25 29 105Parenting 61.7 66.2 30.0 68.7 28.6 22.2 73.01994-1995
81 71 10 67 14 18 63Parenting 35.8 37.8 25.0 38.7 31.8 25.0 45.51995-1996
53 45 8 31 22 16 33Parenting 52.2 53.9 30.0 57.1 36.4 40.4 58.91996-1997
138 128 10 105 33 47 90
63

Appendix C
Table Cl. 1996-1997 Elementary Mathematics Pilot Test Results
Test Name AllStudents
Females Males Non-minorityStudents
MinorityStudents
Free &Reduced
Non Free&
Reduced
Math 5 Sem. 1 56.7 56.9 56.5 61.1 41.8 43.3 66.6
1996-19972199 1081 1118 1701 498 932 1265
Math 5 Sem. 2 57.2 57.0 57.3 61.0 44.1 44.2 66.6
1996-19972144 1068 1076 1663 481 902 1241
Table C2. 1996-1997 Middle School Mathematics Pilot Test Results
Test Name AllStudents
Females Males Non-minorityStudents
MinorityStudents
Free &Reduced
Non Free&
Reduced
Math 6 Sem. 1 41.6 40.9 42.4 44.9 32.0 30.6 50.61996-1997
1722 878 844 1288 434 771 950
Math 6 Sem. 2 26.5 24.4 28.6 30.2 15.0 17.5 33.51996-1997
1686 862 824 1267 419 743 942
Math 7 Sem. 2 32.5 27.8 37.7 36.9 18.4 23.1 38.81996-1997
1270 663 607 971 299 506 763
Table C3. 1996-1997 Middle School Language Arts Pilot Test Results
Test Name AllStudents
Females Males Non-minorityStudents
MinorityStudents
Free &Reduced
Non Free&
Reduced
Lang. Arts 6(pilot)1996-1997
72.3
1751
74.5
889
70.1
862
76.8
1324
58.3
427
63.0
730
78.9
1020

Appendix C
Table C4. 1996-1997 Middle School Science Pilot Test Results
Test Name AllStudents
Females Males Non-minorityStudents
MinorityStudents
Free &Reduced
Non Free&
ReducedScience 6 Health(pilot)
50.3 46.6 54.0 54.6 35.6 38.9 58.7
1996-1997 1059 528 531 820 239 447 612Science 6 Unit 46.2 42.7 49.9 51.4 30.9 29.6 58.11/4 (pilot)1996-1997 1311 674 637 978 333 547 763Science 6 Unit 3(pilot)
43.0 41.5 44.5 47.1 28.3 32.1 52.1
1996-1997 1156 569 587 902 254 527 629Science 6 Unit 60.0 59.3 60.8 65.9 39.8 44.2 69.75/4 & 6 (pilot)1996-1997 1458 752 706 1131 327 552 905Science 7 Health(pilot)
33.3 36.2 30.1 40.9 21.1 23.2 45.4
1996-1997 285 152 133 176 109 155 130Science 7 Unit 1(pilot)
68.6 65.4 72.0 73.3 55.0 57.5 76.2
1996-1997 1346 702 644 999 347 515 823Science 7 Unit 2(pilot)
68.9 66.3 71.5 76.9 49.7 53.5 80.8
1996-1997 546 279 267 385 161 230 313Science 7 Unit 3(pilot)
37.4 33.4 41.9 42.8 21.1 23.5 45.6
1996-1997 1429 761 668 1073 356 528 899Science 7 Unit 6(pilot)
58.2 58.5 57.8 64.4 33.3 44.2 66.0
1996-1997 239 123 116 191 48 86 153Science 8 Unit 1(pilot)
47.4 45.3 49.4 53.3 25.0 36.2 52.4
1996-1997 1024 516 508 808 216 323 699Science 8 Unit 2(pilot)
37.3 33.7 41.0 42.6 19.9 26.9 42.4
1996-1997 1110 561 549 849 261 364 743Science 8 Unit 4(pilot)
15.6 12.3 19.4 19.1 7.3 11.1 17.7
1996-1997 461 244 217 324 137 144 317Science 8 Unit 5(pilot)
4.5 4.8 4.2 5.7 1.1 2.8 5.6
1996-1997 336 168 168 246 90 141 195Science 8 Unit 6(pilot)
4.1 4.6 3.7 5.5 1.3 1.1 6.1
1996-1997 460 241 219 311 149 180 280
6 5
58

Appendix C
Table C5. 1996-1997 High School Earth Science Pilot Test Results
Test Name AllStudents
Females Males Non-minorityStudents
MinorityStudents
Free &Reduced
Non Free&
Reduced
Earth Sd. 65.3 61.6 69.5 71.3 48.9 52.6 70.7Astronomy1996-1997 992 523 469 728 264 293 699
Earth Sd. 52.2 51.0 53.6 57.7 37.1 35.3 59.3Geology1996-1997 996 520 476 732 264 292 703
Earth Sci. 49.6 46.6 53.1 56.0 32.2 33.6 56.3.Meteorology1996-1997 905 481 424 663 242 265 639
Earth Sci. 57.9 56.0 60.0 63.5 42.5 44.8 63.5Oceanography1996-1997 1026 539 487 751 275 306 720
Earth Sci. 49.2 47.5 51.2 54.5 34.2 36.8 54.4Rocks/Minerals1996-1997 1010 537 473 747 263 291 717
1997-98 Test Development Plans
Development of criterion-referenced tests will continue throughout 1997-98 for thefollowing areas:
Mid-year:Finalizing
Math 5 Semester 1Math 6 Semester 1
End-of-year:Finalizing
Language Arts 6Math 5 Semester 2Math 6 Semester 2Math 7 Semester 2
PilotingFrenchSocial Science 6, 7, 8Reading (Scholastic), Grades 1-8.
Tests for middle and high school science continue to be developed on an ongoing basis.Some modular tests will be finalized, while others will be re-piloted.
6659

Table Dl. ITBS Historical ResultsGrade 3 & Grade 4 Percentile Ranks
National Student Norms
Grade 31995-96
Grade 31996-97
Grade 41995-96
Grade 41996-97
SCHOOL Core Total Core Total Core Total Core TotalAdams 56 67 58 65Brooks 33 36 35 42Cattell 52 40 54 54Douglas 61 60 61 60Edmunds 35 41 52 31Findley 43 49 58 49Garton 34 41 54 43Granger 63 40 56 55GreenW-Ood 82 74 84 81Hanawalt 83 81 83 86Hillis 73 78 67 66Howe 51 49 72 60Hubbell 62 67 76 63Jackson 51 44 60 53Jefferson 77 72 81 78Longfellow 29 51 31 30Lovejoy 52 51 54 56Lucas 37 43 26 31Madison 52 63 48 46Mann 43 43 46 45Mc Kee 39 40 34 42Mc Kinley 35 23 44 31Mitchell 51 47 57 58Monroe 58 55 59 53Moore 57 53 69 57Moulton 39 26 34 46Oak Park 52 46 59 51Park Avenue 51 57 59 60Perkins 51 36 63 45Phillips 62 57 64 58Pleasant Hill 64 67 58 58Stowe 51 45 62 57Studebaker 51 69 57 58Wallace 36 45 44 34Watrous 74 56 65 64Willard 34 29 39 34Windsor 63 66 61 69Woodlawn 56 55 60 54Wright 54 47 49 51
DISTRICT 55 55 58 55
6 7
60
Appendix D

Table D2. ITBS Percentile Rank TrendsGrade 3 (1995-96) To Grade 4 (1996-97)
National Student Norms
Grade 31995-96
Grade 41996-97
1995-96 to1996-97
SCHOOL Core Total Core Total ChangeAdams 56 65 9Brooks 33 42 9
Cattell 52 54 2Douglas 61 60 -1
Edmunds 35 31 4Findley 43 49 6Garton 34 43 9
Granger 63 55 -8Greenwood 82 81 -1
Hanawalt 83 86 3Hillis 73 66 -7Howe 51 60 9
Hubbell 62 63 1
Jackson 51 53 2Jefferson 77 78 1
Longfellow 29 30 1
Lovejoy 52 56 4Lucas 37 31 -6Madison 52 46 -6Mann 43 45 2
Mc Kee 39 42 3Mc Kinley 35 31 -4Mitchell 51 58 7Monroe 58 53 -5Moore 57 57 0Moulton 39 46 7Oak Park 52 51 -1
Park Avenue 51 60 9
Perkins 51 45 -6Phillips 62 58 -4Pleasant Hill 64 58 -6Stowe 51 57 6
Studebaker 51 58 7Wallace 36 34 -2Watrous 74 64 -10Willard 34 34 0Windsor 63 69 6
Woodlawn 56 54 -2Wright 54 51 -3
DISTRICT 55 55 0
61 6 8
Appendix D

Table D3. ITBS Grade Equivalent Score TrendsGrade 3 (1995-96) To Grade 4 (1996-97)
GRADE 31995-96
GRADE 41996-97
SCHOOL Core Total Core Total TRENDAdams 3.6 5.3 1.7Brooks 3.0 4.2 1.2Cattell 3.6 4.7 1.1Douglas 3.8 4.9 1.1Edmunds 3.1 3.7 0.6Findley 3.3 4.5 1.2Garton 3.0 4.3 1.3Granger 3.9 4.7 0.8Greenwood 4.7 6.2 1.5Hanawalt 4.7 6.4 1.7Hillis 4.3 5.3 1.0Howe 3.5 4.9 1.4Hubbell 3.8 5.1 1.3Jackson 3.5 4.7 1.2Jefferson 4.4 5.9 1.5Longfellow 2.9 3.7 0.8Lovejoy 3.5 4.7 1.2Lucas 3.1 3.7 0.6Madison 3.6 4.4 0.8Mann 3.3 4.4 1.1McKee 3.1 4.2 1.1McKinley 3.1 3.7 0.6Mitchell 3.5 4.7 1.2Monroe 3.7 4.7 1.0Moore 3.7 4.7 1.0Moulton 3.1 4.4 1.3Oak Park 3.6 4.6 1.0Park Avenue 3.5 4.9 1.4Perkins 3.5 4.4 0.9Phillips 3.8 4.8 1.0Pleasant Hill 3.9 4.8 0.9Stowe 3.5 4.7 1.2Studebaker 3.5 4.8 1.3Wallace 3.1 3.9 0.8Watrous 4.3 5.2 0.9Willard 3.0 3.9 0.9Windsor 3.9 5.4 1.5Wood lawn 3.7 4.7 1.0Wright 3.6 4.6 1.0
DISTRICT 3.6 4.7 1.1
6 9
62
Appendix D

Appendix E
Table El. ITBS Historical ResultsGrade 6 & Grade 7 Percentile Ranks
, National Student Norms
Grade 61995-96
Grade 61996-97
Grade 71995-96
Grade 71996-97
SCHOOL Core Total Core Total Core Total Core Total
Brody 62 60 62 62
Callanan 66 67 69 71
Goodrell 47 45 56 53
Harding 45 37 47 48
Hiatt 37 42 42 38
Hoyt 51 46 49 50
Mc Combs 53 57 55 52
Meredith 63 62 56 62
Merrill 70 69 71 70
Weeks 58 52 52 53
DISTRICT 56 56 56 57
7 0
63

Table E2. ITBS Percentile Rank TrendsGrade 6 (1995-96) To Grade 7 (1996-97)
National Student Norms
Grade 61995-96
Grade 71996-97
1995-96 to1996-97
SCHOOL Core Total Core Total Change
Brody. 62 62 0
Callanan 66 71 5
Goodrell 47 53 6
Harding 45 48 3
Hiatt 37 38 1
Hoyt 51 50 -1
Mc Combs 53 52 -1
Meredith 63 62 -1
Merrill 70 70 0
Weeks 58 53 5
DISTRICT 56 57 1
Table E3. ITBS Grade Equivalent Score TrendsGrade 6 (1995-96) To Grade 7 (1996-97)
GRADE 61995-96
GRADE 71996-97
SCHOOL Core Total Core Total TREND
Brody 7.4 8.5 1.1
Callanan 7.7 9.5 1.8
Goodrell 6.3 7.7 1.4
Harding 6.2 7.4 1.2
Hiatt 5.7 6.6 0.9
Hoyt 6.5 7.6 1.1
McCombs 6.7 7.7 1.0
Meredith 7.5 8.5 1.0
Merrill 8.1 9.4 1.3
Weeks 7.2 7.8 0.6
DISTRICT 7.0 8.1 1.1
64
71
Appendix E

Appendix F
Table Fl. Percent of Students Scoring on Grade Level (50th Percentile) or Higher1996-97 Iowa Tests of Basic Skills
School Core Total Reading Total Language Total Math Total Sources ofInformation Total
Gr. 3 Gr. 4 Gr. 3 Gr. 4 Gr. 3 Gr. 4 Gr. 3 Gr. 4 Gr. 3 Gr. 4
Adams 66.7 73.3 63.3 64.4 71.4 82.2 66.7 57.8 63.3 64.4Brooks . 34 40.5 23.4 24.3 31.9 35.1 51.1 56.8 51.1 41.7Cattell 29.4 48.5 27.1 51.5 32.4 45.6 47.8 55.9 42.9 51.5Douglas 50.6 59.1 50.6 56.7 55.6 69.7 61.7 54.5 65.4 70.1
Edmunds 39.5 31 40.9 33.3 38.6 28.6 44.2 26.2 43.2 33.3Findley 48.9 48.7 51.1 39.5 44.4 53.5 57.8 51.3 64.4 53.5Garton 31.9 33.3 26 47.5 31.3 40 59.6 41 30 40Granger 43.1 45 47.5 41.5 42.4 47.5 39.7 51.2 41.4 51.2Greenwood 69.2 77.6 66.7 76 75.8 79.6 70.8 80 74.2 84Hanawalt 84 94.7 78 87.7 84 91.2 78 89.5 74.4 91.3Hillis 80.4 60.4 75.4 52.8 83.9 66 86 62.3 78.9 66Howe 50.9 58.5 47.3 53.7 54.5 61 56.4 56.1 49.1 65.9Hubbell 64.2 61.5 64.2 67.3 69.8 51.9 60.4 69.2 73.6 86.5Jackson 44.4 50 47.7 59.4 42.2 38.5 48.4 61.5 56.2 50.8Jefferson 69.7 81.3 76.3 78.7 69.7 76 75 88 76 93.2Longfellow 47.8 12.8 56.5 10.3 43.5 12.8 65.2 30.8 60.9 17.9
Lovejoy 44.2 52.3 44.4 50 47.7 50 54.5 56.8 61.4 56.8Lucas 32.3 17.9 29 22.5 40.6 30 55.9 35.9 38.2 38.5Madison 57.8 36.7 64.4 40 66.7 43.3 42.2 36.7 73.3 40Mann 39.5 41.4 41 40 43.6 46.7 42.1 54.8 46.2 62.5Mc Kee 30.8 31.7 22.5 33.3 35 41.5 53.8 40.5 30 35.7Mc Kin ley 15 16.7 20 10 7.5 33.3 27.5 40 22.5 23.3Mitchell 46.3 55.3 48.8 60.5 43.9 57.9 40.5 60.5 52.4 73Monroe 41.9 50 50.8 52.9 52.4 47.1 46.8 48.5 55.6 61.8Moore 47.4 56.7 52.6 55 52.6 63.3 52.6 56.7 58.9 65
Moulton 14 39.5 13.7 39.5 20 50 23.5 44.7 38 42.1Oak Park 44.1 49 45.1 48.1 39.1 50 50 52.9 51.4 53.8Park Avenue 57.4 65.2 51.8 52.9 52.7 54.9 70.9 74.6 69.6 70.8
Perkins 34.2 35.8 36.5 43.3 32.9 35.8 42.5 38.8 35.3 40.3Phillips 55.2 54.4 53.7 61.8 55.2 53.6 65.7 66.7 62.7 59.4Pleasant Hill 55.9 58.2 64.7 53.6 61.8 58.9 76.5 54.5 67.6 50Stowe 39.3 52.8 40.6 50.9 39.3 54.7 50 62.3 43.7 59.6Studebaker 72.4 56.1 72.4 63.2 65.5 58.8 70.7 54.5 70.7 63.2Wallace 35.9 30 17.9 30 41 30 64.1 36.7 56.4 43.3Watrous 62.7 59 51 61.5 60.8 64.1 49 59 56.9 61.5Willard 20 30.6 26.4 30.6 23.5 22.6 34 37.1 32 29
Windsor 65.5 63.5 65.5 68.3 55.4 63.5 77.2 77.8 61.4 74.6
Wood lawn 49.2 57.1 53.7 53.4 47.8 57.6 48.5 56.1 48.5 57.6
Wright 42.9 42.5 45.2 52.5 42.9 53.7 50 45 50 53.7
District 48.5 51.7 48.4 51.6 49.4 52.7 55.6 56.4 55.0 57.6
657 2

Appendix F
Table F2. Percent of Students Scoring on Grade Level (50th Percentile) or Higher1996-97 Iowa Tests of Basic Skills
School Core Total Reading Total Language Total Math Total Sources ofInformation Total
Gr. 6 Gr. 7 Gr. 6 Gr. 7 Gr. 6 Gr. 7 Gr. 6 Gr. 7 Gr. 6 Gr. 7
Brody 59.4 64.4 58.2 60.1 55.3 61.6 64.2 68 61.9 67.7
Callanan 65.3 69.5 63.2 64.4 62.1 69.4 67.4 68.8 68.9 75.4
Goodrell 44.1 54.6 41.9 44 40.1 51.6 51.7 59.8 48.9 57.6
Harding 34.7 48.2 27.3 36.2 _ 30.6 49.8 39.5 52.2 44.1 44.9
Hiatt 36.5 33.9 35.8 31.9 40.4 31 43.4 37.6 43.9 36.5
Hoyt 47 51.6 43.5 42.9 49.1 55.2 47.3 51 51.2 50.7
Mc Combs 59.1 53.8 59.9 48.9 56.2 51.7 60 55.1 65.6 55.1
Meredith 62.9 63.8 64.1 62.7 56.1 62.6 61.4 66.2 61.8 61.4
Merrill 72.5 72.7 76.8 69.3 68.5 74.7 68.3 72.5 77 75.9
Weeks 53.7 53 50.7 46.8 49.8 54.6 59.7 54.6 58.3 55.1
7 3
66

U.S. Department of EducationOffice of Educational Research and Improvement (OERI)
Educational Resources Information Center (ERIC)
REPRODUCTION RELEASE
I. DOCUMENT IDENTIFICATION:
(Specific Document)
ERICITM029081
Title: A aezsvnQ Rnocimm rekNi)t916 .123
Author(s): D , D.ep,Corporate Source:
Og--3 0 A82 (1 k) 1114 k3e,lkoi Dit3 ftl*C-61 Publication Date:
-CLII11 9 9 e
/........
II. REPRODUCTION RELEASE:In order to cisserninate as widely as possible timely and significant materials of interest to the educational community, documents announced
in the monthly abstract journal of the ERIC system, Resourcds in Education (RIE), are usually made available to users in microfiche, reprodiced
paper copy, and electronic/optic& mode, and sold through the ERIC Document Reproduction Service (EDRS) or other ERIC vendors. Credit is
given to the source of each document, and, if reproduction release is granted, one of the following notices is affixed to the document
If permission is granted to reproduce and disseminate the identified document, please CHECK ONE of the following two options and sign at
the bottom of the page.
Check hereFor Level 1 Release:Permitting reproduction inmicrofiche (4 x 6' film) orother ERIC archival media(e.g., electronic or optical)and paper copy.
The sample sticker shown below will beaffixed to all Level 1 documents
PERMISSION TO REPRODUCE ANDDISSEMINATE THIS MATERIAL
HAS BEEN GRANTED BY
cfr
TO THE EDUCATIONAL RESOURCESINFORMATION CENTER (ERIC)
Level 1
The sample sticker shown below will beaffixed to all Levet 2 documents
PERMISSION TO REPRODUCE ANDDISSEMINATE THIS
MATERIAL IN OTHER THAN PAPERCOPY HAS BEEN GRANTED BY
\e
cfrcc`9
TO THE EDUCATIONAL RESOURCESINFORMATION CENTER (ERIC)
Level 2
Documents will be processed as indicated provided reproduction quality permits. If permission
to reproduce is granted, but neither box is checked, documents will be processed at Level 1.
Check hereFor Level 2 Release:Permitting reproduction inmicrofiche (4" x 6' film) orother ERIC archival media(e.g., electronic or optical),but not in paper copy.
Sign Signaturei,here-0please
lhoreby grant to the Educational Resources Information Center(ERIC) nonexclusive permission to reproduce' end disseminate
this document as indicated above. Reproduction from the ERIC microfiche or electronicroptical media by persons other than
ERIC employees and Its system contractors requires permission from the copyright holder. Exception is made for non-profit
woduction by libraries and other service agencies to satisfy information needs of educators in response to discrete inquiries."
i Printed Name/Position/Title:
I
WriraTiriairci AWE(eoa GQrd Raz-.Deis o rie-s
liattar-mail ress.
-7_43_1 Cists)a.c4A.-2.7 lb15
teiertoOdw, 61/4.
1,,
(over)