Embed Size (px)
Citation preview

135
7.3 Geophysical detection of rock mass instability
Source: Krautblatter (2008). Rock Permafrost Geophysics and its Explanatory Power for Permafrost-Induced
Rockfalls and Rock Creep: a Perspective. Paper presented at the 9th Int. Conf. on Permafrost, Fairbanks,
Alaska, US: 999-1004.
7.3.1 Introduction
Degrading permafrost in rock walls is hazardous, partly due to the amount of potential energy that is released in
case of instabilities (Harris et al., 2001). In 2002, the Dzhimarai-khokh rock/ice avalanche (Russian Caucasus)
detached approximately 4 million m³ from a 1 km wide starting zone and caused more than 140 casualties
(Haeberli, 2005; Kääb et al., 2003). Even smaller permafrost rockfalls, such as the 2003 Matterhorn rockfall, are
considered as major hazards in densely populated high mountain areas (Gruber et al., 2004a). Inventories show
that the frequency of these rockfalls has considerably increased in the warm 1990s and was boosted by the hot
summer of 2003 (Schoeneich et al., 2004). Moreover, slow rock creep in permafrost rocks causes significant
damage especially to tourist infrastructure in high mountain areas.
Besides temperature logger data, borehole information and rock temperature modeling approaches, the geo-
physical applications described here provide a new tool for the spatial and temporal analysis of rock permafrost.
In some cases, information on the thermal state of permafrost reveals sizeable information for stability consid-
eration (Davies et al., 2001), but changing hydrological properties of ice such as water content may also play a
vital part in decreasing resistive forces of ice-contained rock masses (Gruber and Haeberli, 2007). This paper
combines a review of existing geophysical techniques that are applicable in permafrost rocks and a perspective
how these can contribute to the understanding of mass movements in permafrost-affected bedrock in future. It
will address three questions:
(i) What geophysical methods can be applied in permafrost rocks? (ii) What properties do they detect? (iii) What
is their explanatory power for permafrost-induced mass movements?
7.3.2 Investigation sites
Methods described in this article were tested at three investigation sites: the “Steintälli” a N-S exposed crestline
(Matter-/Turtmann Valleys, Switzerland) at about 3070-3150 m a.s.l. with slaty paragneiss (see Fig. 1); the North
Face of the Zugspitze limestone summit (Wetterstein Mountains, Germany/Austria) at about 2800 m a.s.l. and
the gneissic Gemsstock crestline (Switzerland) at 2900 m a.s.l. in collaboration with Marcia Phillips. Fig. 1
shows a typical arrangement of a 2D-ERT in steep permafrost-affected bedrock. More detailed site characteris-
tics can be sourced from Krautblatter and Hauck (2007) and Gude and Barsch (2005). Problems associated with
the comparison of different field sites and extrapolation of results are discussed in Krautblatter & Dikau
(Krautblatter and Dikau, 2007).

136
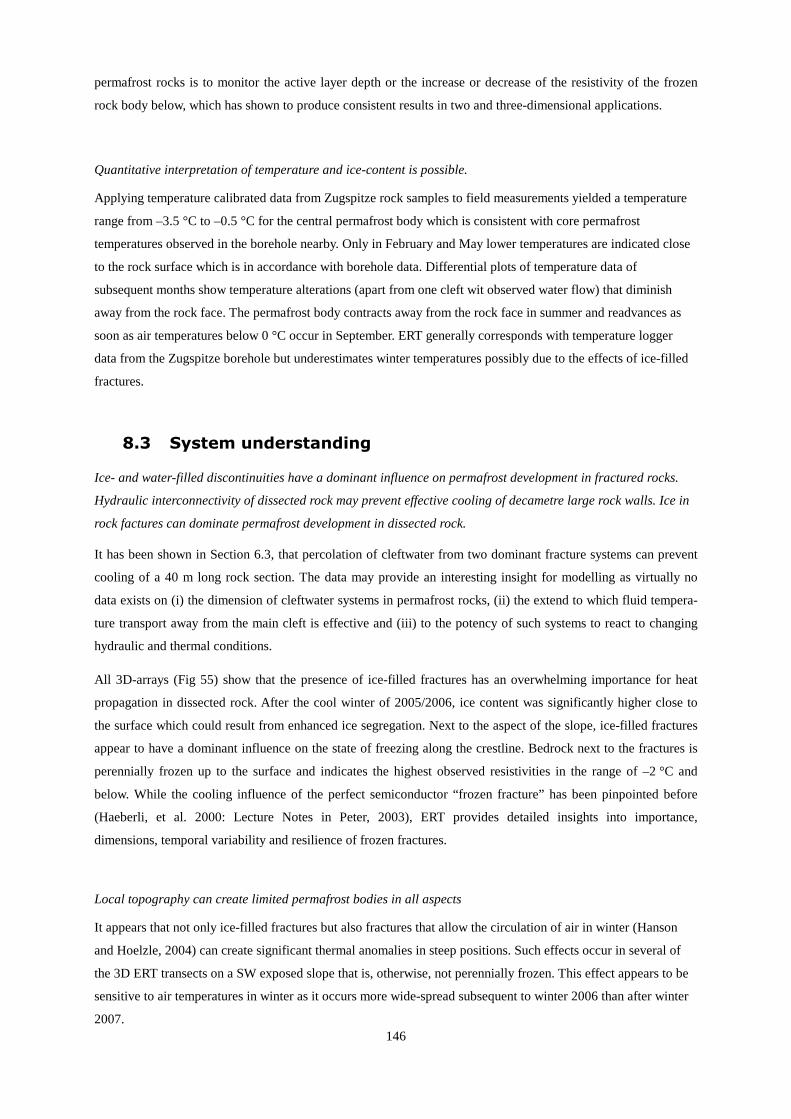
Fig. 68: Electrical resistivity measurement along Transect South at the Matter-/Turtmann Valleys crestline,
3150 m a.s.l., Switzerland.
41 large steel screws serve as electrodes along each transect.
7.3.3 Geophysical methods for rock permafrost and detectable proper-
ties
Surface-based geophysical methods represent a cost-effective approach to permafrost mapping and characterisa-
tion (Harris et al., 2001). Hauck (2001) provided a systematic comparison of different geophysical methods for
monitoring permafrost in high-mountain environments. However, the application of geophysical methods to
permafrost rock walls just began in 2005 (Krautblatter and Hauck, 2007). This section will give a quick over-
view of methods that have successfully been applied to permafrost rocks in the last three years. Data used for
Figures 2, 6 and 8 was previously published in Krautblatter & Hauck (2007) and are described there in detail.
7.3.3.1 Electrical resistivity tomography (ERT)
ERT is a key method in permafrost research as freezing and thawing of most materials are associated with a
resistivity change that spans one order of magnitude, which is, in turn, easily detectable. The first approach to
derive spatial information from rock faces by ERT was applied by Sass (2003). In subsequent studies, he pro-
vided further evidence that ERT measurements are capable of measuring the degree of rock moisture (Sass,
2005a) and temporal and spatial variations of freeze and thaw limits (Sass, 2004) in rock faces. These ERT
measurements were confined to the monitoring of the upper weathering crust (centimeter- to decimeter-scale) of
non-permafrost rock faces. Krautblatter and Hauck (2007) extended this method to a decameter-scale and ap-
plied it to the investigation of active-layer processes in permafrost-affected rock walls.

137
Fig. 69: ERT in an east-facing rock wall recorded at August 17, 2005 at the Matter-/Turtmann Valleys crest-
line, 3130 m a.s.l. Switzerland)
Arrays with centimeter-long steel screws as electrodes were drilled into solid rock (see Fig. 68) and were meas-
ured repeatedly with high voltages (mostly 10² -10³ V) to improve the signal to noise ratio. A detailed survey of
hardware and software adaptations and a systematic discussion of error sources is provided by Krautblatter and
Hauck (2007). Errors associated with different ERT-arrays were assessed alongside with the impact of topogra-
phy and other geometric error sources (Krautblatter and Verleysdonk, 2008a). The Res2DInv software was cho-
sen as it is capable of topographic correction and “real” time-lapse inversion of subsequent measurements. To
cope with high resistivity gradients, inversions models with mesh size smaller than the electrode distance and
robust inversion routines provide better results. Resistivity values that correspond to the transition between fro-
zen and thawed rock were measured repeatedly at the rock surface along different arrays and yielded evidence
that the transition occurs between 13 and 20 kΩm for the gneissic rocks at the Steintälli (Krautblatter and Hauck,
2007) and are in the same range as those established for carbonate rocks at the Zugspitze by Sass (2004) and
own measurements (Krautblatter and Verleysdonk, 2008b). Fig. 69 shows an ERT that was measured close to
Fig. 1 at an east-facing part of the rock crestline between Matter- and Turtmann Valleys. It shows a 3 m thick
thawed surface layer of rock above a constantly frozen permafrost layer; a plunge in temperature following the
14th of August is evident due to frozen rock close to the surface in all parts of the transect. Resistivity-
temperature patterns of rock samples of all field sites are currently tested in a freezing chamber in the laboratory.
The relation between measured resistivity and rock temperature is straightforward. For temperatures below the
freezing point, resistivity (p) depends mainly on unfrozen water content until most of the pore water is frozen. In
Alpine environments resistivity can be calculated based on a reference value po as an exponential response to the
temperature below the freezing point (Tf) according to McGinnis et al. (1973):
)(0
TTb fe −= ρρ
Equ. 7.1
The factor b in Equation (1) determines the rate of resistivity increase and can be derived empirically (Hauck,
2001; Hauck, 2002). Short-term changes in resistivity can be attributed to changes in pore water content and
temperature, while changes in porosity and water chemistry can be neglected over daily to monthly measurement
intervals in low-porosity rocks. Due to the exponential response of resistivity to temperatures below 0 °C, freeze-
thaw transitions correspond to an increase in resistivity by one order of magnitude and are thus, a very sensitive
method for detecting the state of rock permafrost close to 0 °C. On the other hand, deeply frozen bedrock (below
–5 °C) along the measured transects causes problems for the electrode contact.

138
7.3.3.2 Refraction Seismic Tomography (RST)
Fig. 70: RST- North-south transect 9 (September 20, 2006), measured at the Matter-/Turtmann Valleys crest-
line, 3150 m a.s.l..
The application of refraction seismics in permafrost studies is based on the interpretation of refracted headwaves
that indicate the transition of a slower unfrozen top layer to a frozen layer with faster P-wave propagation below.
Recent approaches apply tomographic inversion schemes (Otto and Sass, 2006) often based on high-resolution
data sets (Maurer and Hauck, 2007; Musil et al., 2002). Seismics are also applied to determine 2D and 3D rock
mass properties and potential instabilities (Heincke et al., 2006b). Preliminary results from Krautblatter et al.
(2007) indicate that refraction seismics are applicable for permafrost detection in solid rock walls, even if they
provide less depth information than ERT measurements. On the other hand, it appears that they resolve small-
scale features such as ice-filled clefts in more detail. For instance, Fig. 70 shows a cross-cut through the E-W
trending Steintälli crestline at Transect 9. Thoroughly frozen rock aligns along ice-filled discontinuities indicat-
ing the good thermal conduction (k = 2.2 W/(m*K)) without latent buffers in the readily frozen ice in clefts.
In practice, P-Waves were stimulated with a 5 kg sledgehammer. Per transect, 24 drilled geophone positions in
bedrock and 40 marked and fixed shot positions were arranged in line with the ERT transects so that RST and
ERT were measured simultaneously (Krautblatter and Hauck, 2007). A direct comparison of ERT and RST
showed that frozen high-resistivity rocks in the ERT typically have P-wave velocities significantly above 4000
m/s (see section below) while wet and dry rock masses indicate a significantly slower propagation. As P-wave
velocities of frozen and thawed rock differ only by a few hundred m/s in velocity it is important to define the
geometry of shot and recording position exactly, which was done using a high-resolution tachymeter. High P-
wave velocities in rock necessitate high temporal resolution of geophone signals. Surface waves are not deceler-
ated by a soft surface layer such as soil and thus often disturb signals recorded by geophones close to the shot
position. We applied REFLEXW, Version 4.5 by Sandmeier Scientific Software, with model settings, such as
initial P-wave velocity assumption, adjusted to bedrock conditions.

139
Fig. 71: Estimation of P-wave velocities of rock with different porosity and pore content.
Air-, water- and ice-filled pores in rock lead to significantly different attenuation of P-wave-velocities. This is
especially true for air-filled porosity. Fig. 71 shows theoretical P-wave velocity for different pore-fillings and
rock porosities derived from mixing laws. However, it appeared in simultaneous ERT and RST measurements
that carefully conducted RST can resolve the difference between water and ice-filled rock even in low-porosity
(2-3 %) bedrock, and that velocity differences are larger than expected from mixing laws for certain rock poros-
ities. This could be due to the fact that melting in low-permeability rocks leads to a small gas content in pores to
compensate the ice-water volume reduction or that the seismic velocities provide a more integral signal that
includes ice in discontinuities in the rock mass.
7.3.3.3 The third dimension: 3D ERT and RST
Fig. 72: 3D-ERT cross sections at three different depths cutting the Turtmann-/Matter Valley crestline N-S.
Measured with ca. 1000 datum points from ca. 200 electrodes at September 5-9, 2006.
ERT and RST can be conducted in 3D. Fig. 72 shows three horizontal sections cut at depths of 7-9 m, 9-11 m
and 11-14 m with N-S orientation that indicate a sharp divide between frozen rock to the north and thawed rock
to the south at meter 44. Problems that arise when conducting three-dimensional geophysics in permafrost rocks,
are time-consuming measurements (ca. one week of uninterrupted measurements), the necessity of highly-

140
precise topographic information and the required high resolution due to the enormous resistivity/seismic velocity
gradients present in permafrost rock systems. Moreover, traditional 3D arrays (e.g. Pole-Pole or Dipol-Dipol
ERT) result in bad signal to noise ratios (Krautblatter and Verleysdonk, 2008a) and electrode/geophone spacing
and arrays must be adjusted to local conditions. Therefore, the first 3D ERT and 3D RST array in permafrost
rocks, that was conducted in 2006, relied on a very close (2 m) arrangement of geophones (120), electrodes (205)
and shot positions (200) (Fig. 72) (Krautblatter and Hauck, 2007) and is based on Wenner-arrays that yield much
better signal to noise ratios than Pole or Dipole-type arrays.
7.3.3.4 The fourth dimension: Time-lapse ERT
The installation of permanent electrodes and modeling of subsequent resistivity data sets within the same inver-
sion routine (so-called time-lapse inversion) allows for a direct assessment of spatial and temporal permafrost
variability (Hauck, 2002; Hauck and Vonder Mühll, 2003). Fig. 73 shows the freezing of the previously thawed
surface rock up to 3m depth following a plunge in temperature after the 14th of August 2005. While time-lapse
routines for ERT are already in place, time-lapse routines for RST are still more difficult to perform.
Fig. 73: Freezing of surface rock from August 17 (top) to August 25, 2005 (bottom) due to a severe drop in
air temperature recorded at the Steintälli E-transect (3130 m a.s.l., Matter-/Turtmann Valleys, Switzerland)
Time-lapse inversion of subsequent measurements provides insights into short-term and long-term freeze-thaw
thermal regimes (Krautblatter and Hauck, 2007), response times (Krautblatter and Verleysdonk, 2008b), changes
in hydrological rock conductivity and permafrost aggradation and degradation. Moreover, changes in subsequent
time sections can definitely be attributed to changes in rock moisture or the state of freezing, while changes in
geological properties can be ruled out for short-timescales.

141
Table 6: Geophysically detectable properties of permafrost rocks
ERT Space-referenced integral tomography of frozen and thawed
rock and hydrological conductivity at all measured depths
Temperature estimation (0 °C to -5 °C) in combination with
laboratory measurements (McGinnis)
RST Space-referenced integral tomography of
air-, water and ice filled rock porosity.
Exact positions of the uppermost freezing/thawing front and
dominant air-, water and ice-filled rock discontinuities
3D-measurements 3D spatial information on the freezing/melting front, hydraulic
conductivity and the persistence/ importance of discontinuity
zones
Time-lapse
inversions
Development of heat fluxes, the permafrost system (aggrada-
tion/degradation), and the hydraulic system over time
7.3.4 Explanatory power for permafrost-induced mass movements
We define permafrost-induced mass movements as those, whose kinematical behavior is at least partly influ-
enced by ice mechanics and permafrost hydrology. The most common types are rockfalls and rock block creep.
These are usually explained (i) by a reduction of the resisting force e.g. shear-strength in ice-filled clefts (Davies
et al., 2001; Davies et al., 2000) or (ii) an increase in the driving force e.g. hydrological pressure (Fischer et al.,
2007).
7.3.4.1 Ice-filled discontinuities
Fig. 74: RST- North-south transect 7 (August 31, 2006) of the Matter-/Turtmann Valleys crestline, 3150 m
a.s.l.. Mention the disposition of the frozen discontinuity zones as possible detachment zones with daylighted
bedding.
A cross-cut through the E-W trending Steintälli crestline is shown in Fig. 74. Geometrical position, orientation
and persistence of ice-filled clefts in the upper 10 meters can be well detected in RST surveys. It is assumed that
ice-filled discontinuities react according to stress-strain behavior of weight-loaded polycrystalline ice. The de-
formation of ice at constant stress is characterized by four phases: Elastic deformation (1) that is followed by

142
permanent deformation, firstly at a decreasing rate (2, primary creep), then at a constant rate (3, secondary creep)
and finally at an increasing rate (4, tertiary creep) (Budd and Jacka, 1989). Mostly secondary creep and tertiary
creep occur at speeds relevant for mass movements. The flow relation for secondary creep relates the shear strain
rate εxy to the shear stress τxy,
nxyxy Aτε =
Equ. 7.2
where A depends mainly on ice temperature, anisotropic crystal orientation, impurity content and water content
and n increases at shear stresses greater than 500 kPa (Barnes et al., 1971). Crystal orientation, impurity content
and shear stresses remain more or less constant over short timescales. In contrary, ice temperature and water
content in mass movement systems are subject to major annual and interannual changes. Thus, for temperatures
above –10 °C, A can be approached by
)16700
exp()exp( 00 TA
RT
QAA −≈−=
Equ. 7.3
where A0 is independent of temperature, R is the universal gas constant and Q is the activation energy
(Weertman, 1973) and A0t for tertiary creep
13150 )(10*)8.52.3( −−−+= skPaWA t
Equ. 7.4
can be related to the percentage water content W. It must be stressed that the water content strongly decreases
with temperature. Paterson (2001) states –2 °C as the lowest temperature at which the effect of water in the ice is
relevant for the stress-strain behavior.
Equ. 7.3 and Equ. 7.4 show, that both, ice temperature and water content play a dominant role for the mechani-
cal behavior of ice-filled clefts at temperatures close to 0 °C. Assuming moderate water content of 0.6 %, the
creep rate at 0 °C is three times the rate at –2 °C (Paterson, 2001), which has serious effects on displacement
rates and factors of safety considerations of mass movements.
As has been shown above, ERT and refraction seismic are highly susceptible to water/ice content inside the
rock system just below the freezing point. Thus, the susceptibility range of seismic velocity and resistivity (ca. -0
to –5 °C) corresponds to the most important changes in ice-mechanical properties. This means, the values tem-
perature and water content, which are relevant for stability considerations in well-jointed permafrost rocks, are
targeted by ERT and refraction seismics and combined interpretation strategies.

143
7.3.4.2 Hydrological pressure
Fig. 75: ERT of Transect NE (September 13, 2005). Mention the persistently thawed deep- reaching cleft wa-
ter zones.
Fig. 75 shows light-colored low-resistivity cleft water zones percolated by glacial melt water that were ob-
served to persist over several years and to limit the spatial extension of permafrost bodies. While pressure effects
only have a small effect on the stress-strain behavior of ice itself (resisting force) (Weertman, 1973), the reduc-
tion of applied normal stress and the increase in shear stress (driving force) may play a key role in preparing and
triggering mass movements (Fischer et al., 2007; Terzaghi, 1962). According to Wegmann (1998), permafrost
degradation and aggradation in rocks in response to altered hydraulic conductivity occurs at all depths and
quickly responds to annual melting patterns. He could also show that rock deformation quickly responds to spa-
tial changes in permafrost rock conductivity. Unfrozen cleft zones can easily be detected at the surface with RST
and with ERT measurements possibly up to the maximum depth of the applied array (e.g. 80 m at the Zugspitze,
400 m Schlumberger-array). As shown in Fig. 8, resistivity in water-filled cleft zones and frozen rock typically
differs by 1-2 orders of magnitude and is, thus, easily detectable even at greater depths (Krautblatter and Hauck,
2007). This opens up a whole range of new possibilities e.g. for the investigation of rock permafrost hydrology
(Wegmann, 1998), glacier-permafrost interconnectivity (Moorman, 2005) and rock deformation processes that
are closely linked to freeze-thaw processes by latent heat transfer in clefts (Murton et al., 2006; Wegmann,
1998).
7.3.5 Conclusion
Resistivity monitoring may provide indications on temperature changes and water saturation, while refraction
seismics help to gain insight into discontinuity zones and exact geometric properties of instable bodies. Repeated
time-sections reveal interannual, annual and multiannual time-patterns as well as response times, the fourth di-
mension of rock permafrost systems.
For permafrost-induced mass movements, with secondary and tertiary creep of ice close to 0 °C, three highly-
variable forces play a key role in unbalancing resisting and driving forces. The resisting force of ice-creep in
clefts, is mainly controlled by (i) temperature and (ii) water content in the ice. Due to the laws of electrolytic
conductivity, resistivity values assessed by ERT react sensitively to both parameters and water content is a key
control for P-wave velocity. The highly variable driving force (iii) hydrological pressure is well detectable in
ERT time-sections as pore and cleft space supersaturation lead to a plunge in electrolytic resistivity. However,
many other anisotropic factors distort ERT and seismic measurements and further field and laboratory experience
is needed for the allocation of their influence and for the “suppression” of such noise.

144
8 Main findings and short discussion
As all chapters include a separate discussion, only a short recapitulatory review on the hypotheses postulated in
Section 4 will be given here.
8.1 Theory
A better understanding of the instability of permafrost-affected bedrock subsequent to warming could derive from
a combination of the relaxation time concept (Brunsden and Thornes, 1979) and its rock mechanical analogue,
the subcritical and time-dependent brittle fracture propagation (Kemeny, 2003).
The theoretic outline showed that the reaction time of rockslides on existing sliding planes is likely to be
dominated by ice-mechanical properties of the basal sliding plane. Creep rates and the stress level needed for
“failure” of ice in clefts react instantaneously to warming and can be held responsible for rapid response within
days to weeks. Evidence is provided by (i) the presence of ice on the sliding planes of rockfalls that detached
with short reaction time in summer 2003 (e.g. Matterhorn July 17, 2003) (Gruber and Haeberli, 2007). (ii) Ice-
dominated sliding processes in the Steintaelli show a peak deformation in late summer. Velocities of ice-
supported sliding increase on average by a factor of 20 in comparison to all season measurements. This indicates
a short reaction time in the range of weeks and the high susceptibility of ice stability to warming.
Applying the laws of subcritical fracture propagation (Kemeny, 2003), it appears that relaxation time, until a
new equilibrium slope is approached, will take hundreds to thousands of years. In its time-dependent
presentation, the approach by Kemeny (2003) shows sources of path-dependence of slope adaptation. The
underlying processes, i.e. the reduction of total friction and critical fracture toughness due to reduced
compressive strength of thawing saturated rock, react much slower to warming than the ice-mechanical
properties described above. Much of the slow response is explained by a gradual reduce of the total friction
which causes additional loading and slow subcritical destruction of rock bridges. Evidence comes from the 6000
year delay of large rockslides to deglaciation (Prager et al., 2008; Soldati et al., 2004). The same line of evidence
is followed by the delayed response of large rockslides from permafrost-affected bedrock (Gude and Barsch,
2005; Jerz and Poschinger, 1995; Jerz, 1999; Tinner et al., 2005), but reasoning is more difficult.
Thermal and the geomorphologic understanding of “transience”, while different, provide an approach to
understand path-dependent behaviour where the thermal balance was upset by large rock slides or climate
change.
Kohl (1999) could show that complex topographies affect transient thermal fields even at depths of several hun-
dred meters below the surface. In accordance, Noetzli and Gruber (2008) point out that alpine rock summits such
as the Matterhorn are large enough to have preserved transient thermal signals deriving from the Last Glacial
Maximum. Climatic fluctuation such as the Little Ice Age as well as the Holocene or Medieval Climatic Opti-
mum alternate faster than relaxation times of large rock slopes. While shallow rockslides may be predictable in
terms of present day thermal regimes, large rockslides are not. It is worth considering, whether large rock sum-

145
mits have a decoupled core permafrost systems that is not explainable in terms of present day surfaces fluxes.
The detachment of a 200 m thick rockslide at the Zugspitze 3700 B.P. and subsequent exposure of the scarp to
the atmosphere may have caused a more significant thermal shift than millennia of warming on the prior rock
surface. It is, thus, rather the rule than the exception that large rock permafrost summits inherit not reworked
thermal and stability signals that may in the case of large instabilities be more important than present day ther-
mal fluxes. Warming since the Little Ice Age and especially in the last two decades initiated a new transient re-
gime that may incorporate unprecedented changes. In view of the geomorphologic transience theory, it is worth
considering whether these might evoke unforeseen “nonlinear” changes in the thermal system such as a decame-
ter deep reaching and rapidly advancing heat transfer by cleft water. A good example is the presently observed
thawing of a tertiary karst system in the Zugspitze summit, which may open a hydraulic and heat transfer system
that was probably blocked during most of the Quaternary.
8.2 Methodology
Resistivity is an accurate proxy of rock temperature.
Laboratory data has shown that temperature-resistivity paths of hard rocks are different from those established
for brines and soft sediments (McGinnis et al., 1973). Stable alterations of the equilibrium freezing point,
metastable supercooling effects, pore wall attraction and the effects of confinement create a different physical
system setting for freezing behaviour. Separate linear functions for unfrozen, supercooled and frozen
temperature-resistivity paths describe accurately the change in electrical properties. The supposition by Seguin
(1978) that ERT may substitute temperature measurements where these are difficult to conduct, can be confirmed
for frozen rocks, where temperature gradients of 1 °C are higher than the distortion due to internal variability of
the rock sample.
ERT can monitor changes in active layer thickness as well as multiannual permafrost aggradation and
degradation accurately in a two-dimensional and three-dimensional space.
Several arguments support the applicability of ERT in permafrost rocks: (i) Repeated measurements with the
same electrodes deliver identical results with an accuracy level much better than 1 %. (ii) Normal-reciprocal
error level measurements yield error levels of approximately 7-9 % for high resistances in all measurements. (iii)
Observed conditions (surface freezing, warm periods, ice-filled crevasses, cleft water outflow, snow overburden
and overhang positions) are matched by ER tomographies in their spatial and the temporal dimension. (iv)
Resistivity values measured in the field for the freezing transition of Steintaelli gneiss (Krautblatter and Hauck,
2007) could later be confirmed by laboratory experiments. (v) 3D ERT transects subsequent to the cold winter of
2005/2006 indicate much higher resistivities than those of later years. Multiannual measurements deliver
resembling freezing patterns with larger change confined to the surface and gradual changes in deeper layers.
Measurement of active layer depths is a straightforward application of ERT as the electric field expands in a
relatively homogeneous half space above the frozen body. Allocation of unfrozen bodies below a frozen layer
poses a greater challenge and requires careful analysis of raw data, uncertainty propagation and depth of investi-
gation (Alumbaugh and Newman, 2000; Oldenburg and Li, 1999). However, the usual application of ERT in
146
permafrost rocks is to monitor the active layer depth or the increase or decrease of the resistivity of the frozen
rock body below, which has shown to produce consistent results in two and three-dimensional applications.
Quantitative interpretation of temperature and ice-content is possible.
Applying temperature calibrated data from Zugspitze rock samples to field measurements yielded a temperature
range from –3.5 °C to –0.5 °C for the central permafrost body which is consistent with core permafrost
temperatures observed in the borehole nearby. Only in February and May lower temperatures are indicated close
to the rock surface which is in accordance with borehole data. Differential plots of temperature data of
subsequent months show temperature alterations (apart from one cleft wit observed water flow) that diminish
away from the rock face. The permafrost body contracts away from the rock face in summer and readvances as
soon as air temperatures below 0 °C occur in September. ERT generally corresponds with temperature logger
data from the Zugspitze borehole but underestimates winter temperatures possibly due to the effects of ice-filled
fractures.
8.3 System understanding
Ice- and water-filled discontinuities have a dominant influence on permafrost development in fractured rocks.
Hydraulic interconnectivity of dissected rock may prevent effective cooling of decametre large rock walls. Ice in
rock factures can dominate permafrost development in dissected rock.
It has been shown in Section 6.3, that percolation of cleftwater from two dominant fracture systems can prevent
cooling of a 40 m long rock section. The data may provide an interesting insight for modelling as virtually no
data exists on (i) the dimension of cleftwater systems in permafrost rocks, (ii) the extend to which fluid tempera-
ture transport away from the main cleft is effective and (iii) to the potency of such systems to react to changing
hydraulic and thermal conditions.
All 3D-arrays (Fig 55) show that the presence of ice-filled fractures has an overwhelming importance for heat
propagation in dissected rock. After the cool winter of 2005/2006, ice content was significantly higher close to
the surface which could result from enhanced ice segregation. Next to the aspect of the slope, ice-filled fractures
appear to have a dominant influence on the state of freezing along the crestline. Bedrock next to the fractures is
perennially frozen up to the surface and indicates the highest observed resistivities in the range of –2 °C and
below. While the cooling influence of the perfect semiconductor “frozen fracture” has been pinpointed before
(Haeberli, et al. 2000: Lecture Notes in Peter, 2003), ERT provides detailed insights into importance,
dimensions, temporal variability and resilience of frozen fractures.
Local topography can create limited permafrost bodies in all aspects
It appears that not only ice-filled fractures but also fractures that allow the circulation of air in winter (Hanson
and Hoelzle, 2004) can create significant thermal anomalies in steep positions. Such effects occur in several of
the 3D ERT transects on a SW exposed slope that is, otherwise, not perennially frozen. This effect appears to be
sensitive to air temperatures in winter as it occurs more wide-spread subsequent to winter 2006 than after winter
2007.

147
ER tomographies operate at the scale of permafrost rock instability and help to gain insight into the principles of
rock destabilisation.
All extensometer transects with elevated velocities were situated above or adjacent to permafrost positions indi-
cated in the 3D ERT sections. Rock deformations above permafrost were on average three to four times faster
and all extreme rates of several mm/month were found in permafrost affected bedrock. Moreover, ER tomo-
graphies display position and depths of discontinuities, approximate sliding depths and the degree of disintegra-
tion, which are essential inputs for rock stability modelling.
9 Outlook
There are many ways to proceed with this topic. As has been shown, geophysical soundings can directly provide
meaningful input data for thermal, hydraulic, mechanic and slope geomorphology applications and it must be the
aim of future work to establish reliable interfaces. While only ERT was included in this thesis, other techniques
such as refraction seismics and IP were successfully applied in the meantime to permafrost rocks and provide
complementary input e.g. for critical fracture toughness (seismics) and joint infillings (IP). The observed slow
rock deformations challenge our rock- and ice-mechanical understanding and full instrumentation at the Stein-
taelli and at the Zugspitze in 2009 in combination with laboratory work on stability and rethinking will hopefully
provide further insights into the processes and dimensions of ice-supported rock sliding. While this thesis oper-
ated on a laboratory scale and a decametre field scale, it might be possible to modify geophysical techniques for
the use on a mountain scale. As has been shown in the conceptional part, the questions that arise on this scale in
terms of path-dependence and transient thermal/stability configuration may be among the most important ques-
tions in future mountain permafrost research. “If we use the chance that the geomorphic experiment by global
change probably presents to us, it seems that periglacial geomorphology has a great future ahead (Barsch,
1993).”

148
Acknowledgements:
I owe thanks to Michael Moser, Dave Petley and Heather Viles who engaged my interest for geomorphology and
slope instability, to Richard Dikau who supported and inspired my work at all stages, to Oliver Sass for mentor-
ing my work on rockfall and ERT, to Christian Hauck who made ERT in the Steintaelli possible and offered
steady personal support, to Wilfried Haeberli for friendly support, to the Bonn crew (Thomas H., Jan, Jutta, Mi-
chael N., Ole, Herwig, Rainer B., Thomas P.) for mental and scientific support, to the hard-working “Permafrost
rocks”-crew (Sarah and also Pauline, Daniel F., Daniel D., Basti W.) for rendering every assistance, to Matthias
S. for the self-designed freezing laboratory and the climbing work, to the geophysics/petrophysics crew (Andreas
Kemna, Adrian and Norbert) for the great collaboration, to the permafrost people from Zürich and Chambéry
(Philip, Stephan, Christian H., Ludovic, Jeannette, Andi, Luzia) for all kinds of assistance, to Julian Murton for
helpful reviews, to all who ascended 1200 m in the morning to help me with the exhausting work in the Stein-
taelli (Olaf K., Levke F., Michele R., Chris & Wossi, Stefan-Daniel H., Frank L., Jan B., Katharina B., Winfried
S., Milla V., Dennis Ö.) and to the Berckum family (Oberems United) for all kinds of hospitality.

149
Abbreviations
Equ.: Equation
Fig.: Figure
ERT Electrical resistivity tomography
IPCC Intergovernmental Panel for Climate Change
DEM Digital elevation model
MAGST Mean annual ground surface temperature
MAAT Mean annual surface temperature
MART Mean annual rock temperature
ρ Resistivivty
T Temperature
a annum (year)
SPCC research bundle “Sensitivity of Permafrost to Climate Change”
m metre
2D two-dimensional
3D three-dimensional
cal. B.P. calibrated (years) before present
ka 1000 years
SI-units are used in accordance with their established abbreviations.
Index of Tables
Table 1: Measured shear stress based on raw data by Guenzel (2008) compared to model results. ..................... 39
Table 2: Petrophysical and temperature-resistivity characteristics of permafrost rocks........................................ 55
Table 3: Classification and characterization of typical features in the ERT transects ........................................... 72
Table 4: Resistivity increase with increasing penetration depth in the rock face. ................................................. 86
Table 5: Error model parameters for different transects of the 3D ERT measurements in the Steintaelli ............117
Table 6: Geophysically detectable properties of permafrost rocks...................................................................... 141

150
Index of Figures
Fig. 1: A conceptual model for the thermal development of rock permafrost including two-dimensional sources
of heterogeneity..................................................................................................................................................... 15
Fig. 2: Theoretical heat transmission and melting time at different depths........................................................... 21
Fig. 3: North-South-Transect cutting through the Zugspitze summit at Gauss-Krueger coordinates 4423552..... 26
Fig. 4: Mechanisms of rock slope failure controlled by progressive shear plane development or by internal rock
mass deformation and shear (Eberhardt et al. 2004)............................................................................................. 29
Fig. 5: Failure curves for different rock discontinuity settings (Wyllie and Norrish, 1996). ................................ 30
Fig. 6: Uniaxial compressive and tensile strength of unfrozen and frozen Barre granite, Berea sandstone and
Indiana limestone (Mellor, 1973).......................................................................................................................... 31
Fig. 7: Patton’s dilatation concept to quantify the influence of surface roughness. .............................................. 32
Fig. 8: Fracture mechanics model of 2a large single rock bridge under far field normal and shear stress............ 33
Fig. 9: Schematic illustration of time- and stress-dependent evolution of ice-mechanical properties. ................. 35
Fig. 10: Uniaxial loading in pure polycrystalline ice (Hallam 1986 in Sanderson 1988). .................................... 36
Fig. 11: Temperature at failure during constant stress test with concrete-ice samples (Guenzel, 2008)............... 37
Fig. 12: Own reanalysis of data provided by Guenzel (2008) (see Fig. 11). ......................................................... 38
Fig. 13: Reaction time and relaxation time of thawing permafrost rock slopes. ................................................... 43
Fig. 14: Massive ice at the detachment zone of the 2003 rockfall in July below the Carrel (photo by L. Trucco in
Gruber and Haeberli, 2007)................................................................................................................................... 44
Fig. 15: Time-dependent development of cohesion along rock bridges and resulting factor of safety of a
hypothetical rockslide (Kemeny, 2003). ............................................................................................................... 46
Fig. 16: Time after warming versus rockfall size. ................................................................................................. 46
Fig. 17: T-ρ paths of eight permafrost rock samples with linear approximation of up to four arrays. .................. 54
Fig. 18: The effect of porosity on frozen and unfrozen T-ρ gradients. .................................................................. 54
Fig. 19: Supercooling, spontaneous freezing and melting hysteresis of a mineralized paragneiss sample........... 56
Fig. 20: Linear T-ρ approximation of reanalyzed data by Pearson et al. (1983), Seguin (1978) and Mellor (1973).
.............................................................................................................................................................................. 56
Fig. 21: The position of the DC-resistivity monitoring transects in the study area “Steintälli”. ........................... 62
Fig. 22: Mean monthly temperatures measured at the study site during the thaw periods 2003 to 2005.............. 63
Fig. 23: Daily air temperatures and moving average of air temperature in 2005. ................................................. 63

151
Fig. 24: Test measurement of frozen rock surface resistivity values at the NE transect (August 15, 2005). ........ 65
Fig. 25: Apparent resistivity data of Transects NE, NW, E and S ......................................................................... 66
Fig. 26: Time-lapse ERT inversion models of Transect E with approximate freezing/thawing front (dashed line).
.............................................................................................................................................................................. 68
Fig. 27: Time-lapse ERT inversion models of Transect S illustrating damp unfrozen rock (u.r.) next to water-
filled clefts that feed water outflows. .................................................................................................................... 69
Fig. 28: Time-lapse ERT inversion models of Transect NW with approximate freezing/thawing front (dashed
line) influenced by frost-susceptible surface rock (f.r.), the lagged response (l.r.) of the intermediate layer to
warm June/July temperatures and a deep-seated permafrost body........................................................................ 70
Fig. 29: Time-lapse ERT inversion models of Transect NE showing unfrozen bedrock (u.r.) in the intermediate
and bottom layer next to water-filled clefts that feed permanent cleft water outflows (c.o.). ............................... 71
Fig. 30: Position of transects in the Steintaelli. ..................................................................................................... 80
Fig. 31: Model uncertainty and relative sensitivity of the time lapse initial models of Transect NW and NE...... 83
Fig. 32: Average monthly temperatures from 2003 to 2007 measured at a meteorological station located at a
horizontal distance of 900 m and at an altitudinal difference of 330 m from the study site (2770 m a.s.l.).......... 84
Fig. 33: Apparent resistivities of the permafrost-affected left side (electrode array midpoints –30 m to –6 m) of
Transect NW with increasing electrode spacing. .................................................................................................. 85
Fig. 34: Four ERT time-sections of Transect NW, which are apparently determined by the rock surface
temperature regime. .............................................................................................................................................. 87
Fig. 35: Mean apparent resistivities of the left side of Transect NE (electrode array midpoints –30 m to + 3 m)
with increasing electrode spacing. ........................................................................................................................ 90
Fig. 36: Four ERT time-sections of Transect NE determined by both, the rock surface temperature regime and
heat transfer by meltwater in water-filled cleft systems........................................................................................ 90
Fig. 37: Map of the study site showing the ERT transect, geology, and features that were attributed to permafrost
degradation after the Holocene climatic optimum (rockfall scarp) and at present................................................ 96
Fig. 38: Picture of the rockfall scarp and rock wall section covered by the ERT transect. ................................... 96
Fig. 39: MAAT of the Zugspitze meteorological station (2962 m a.s.l.) from 1991 to 2007 in comparison to 30-
year reference periods since 1901. ........................................................................................................................ 97
Fig. 40: Wetterstein limestone sample instrumented with electrodes and high-precision thermometers in the
freezing chamber. .................................................................................................................................................. 99
Fig. 41: Geophysical instrumentation in the Kammstollen gallery 25 m from the North Face at 2800 m a.s.l..
Permafrost is evidenced by perennial ice on the floor; the picture shows electrodes and a temperature logger on
the right side........................................................................................................................................................ 100
152
Fig. 42: ERT grid with 127 electrodes along the gallery. .................................................................................... 101
Fig. 43: Laboratory calibration of Wetterstein limestone from the Kammstollen study site............................... 105
Fig. 44: Mean resistivity behavior of refrozen Wetterstein limestone with mean deviations.............................. 106
Fig. 45: Error model based on a bin analysis of the differences between normal and reciprocal measurements.106
Fig. 46: Mean monthly air temperature in 2006 and 2007 referenced to 1991-2007 mean values and mean
deviation.............................................................................................................................................................. 107
Fig. 47: ERT inversion results based on 127 electrodes and on average 1550 resistance measurements per ERT
frame. .................................................................................................................................................................. 108
Fig. 48: a, Absolute changes of ERT plots from February to October 2007. b, Comparison of the temperature
range obtained by borehole data at the north face below the Zugspitze summit (2920 m a.s.l.) and the values
obtained by temperature-calibrated ERT at the Kammstollen North face (2800 m a.s.l., position see Fig. 12)...110
Fig. 49: Mean daily temperatures, 22 April to 30 October 2007, derived from hourly temperature measurements
with sensor placed in the side gallery at 40 cm rock depth. Loggers are labeled according to their distance from
the north face........................................................................................................................................................111
Fig. 50: Implemented arrays (left) and raw data distortion of different arrays measured subsequently with
conventional protocol files along the same transects with identical conditions. ..................................................115
Fig. 51: Electrode positions of a 3D-ERT measurement across a rock crestline with NE and SW-exposed rock
faces. ....................................................................................................................................................................116
Fig. 52: Finite-element ERT mesh adjusted to smoothed topographies of all five transects (for dimensions see
Fig. 55; processed by A. Flores-Orozco)..............................................................................................................117
Fig. 53: Laboratory results of two rock specimen sampled inside the 3D ERT array. .........................................117
Fig. 54: Air temperature and temperature in 10 cm rock depth in different aspects measured in the Steintaelli
(NW, S and E: 3150 m a.s.l., NE : 3060 m a.sl.). .................................................................................................118
Fig. 55: Five parallel, vertical ERT-sections cutting through the NE-SW facing Steintaelli crestline recorded in
2006, 2007 and 2008 (for crevices see Fig. 56). ................................................................................................. 120
Fig. 56: Ice-filled rock crevices and topographic factors that influence the distribution of frozen rock in the 3D-
ERT array. ........................................................................................................................................................... 122
Fig. 57: Disintegrated rock material on the SW-exposed slope of Transect 1 and 3 (180 m) that overlies a small
permafrost lens with few meters diameter........................................................................................................... 123
Fig. 58: Rockfall accumulation on the Rothorn-NE glacieret in the Steintaelli subsequent to the warm July 2006
(Photo August 5, 2006). ...................................................................................................................................... 125
Fig. 59: A, Deformation of the Gemsstock (Andermatt, CH) summit cable car station by recent rock creep in
thawing permafrost rocks. B, Widespread rock creep („sackung“) mapped in the geological map close to the
Steintaelli in the same geological unit (Bearth, 1980). ....................................................................................... 126
153
Fig. 60: Indications of rock creep at different altitudes with the same underlying lithology (two – mica
paragneisses and schists)..................................................................................................................................... 127
Fig. 61: Position of extensometer transects relative to the 3D ERT grid. ........................................................... 128
Fig. 62: Major crevices (>1 m depth) in the 3D-ERT grid. ................................................................................. 129
Fig. 63: Measured rock deformation in nine reference measurements along 18 transects from 2005 to 2008. .. 129
Fig. 64: Absolute total displacements (blue) and annual displacements (red) of all extensometer transects in
respect to their position (Fig. 61) and permafrost occurrence (Fig. 55). ............................................................. 130
Fig. 65: Absolute velocities of rock deformation in all-year measurements (1-3) and late summer measurements
(4-9). ................................................................................................................................................................... 131
Fig. 66: The relation of mean rock displacement and mean air temperature of transects with direct permafrost
evidence from ERT measurements from 2005 to 2006 (Fig. 55, Transect 5)...................................................... 131
Fig. 67: Laserscanning of the Barrhorn/Barrwang North Faces (Turtmanntal, Valais, Switzerland). ................. 134
Fig. 68: Electrical resistivity measurement along Transect South at the Matter-/Turtmann Valleys crestline, 3150
m a.s.l., Switzerland. ........................................................................................................................................... 136
Fig. 69: ERT in an east-facing rock wall recorded at August 17, 2005 at the Matter-/Turtmann Valleys crestline,
3130 m a.s.l. Switzerland)................................................................................................................................... 137
Fig. 70: RST- North-south transect 9 (September 20, 2006), measured at the Matter-/Turtmann Valleys crestline,
3150 m a.s.l.. ....................................................................................................................................................... 138
Fig. 71: Estimation of P-wave velocities of rock with different porosity and pore content. ............................... 139
Fig. 72: 3D-ERT cross sections at three different depths cutting the Turtmann-/Matter Valley crestline N-S.
Measured with ca. 1000 datum points from ca. 200 electrodes at September 5-9, 2006. ................................... 139
Fig. 73: Freezing of surface rock from August 17 (top) to August 25, 2005 (bottom) due to a severe drop in air
temperature recorded at the Steintälli E-transect (3130 m a.s.l., Matter-/Turtmann Valleys, Switzerland)......... 140
Fig. 74: RST- North-south transect 7 (August 31, 2006) of the Matter-/Turtmann Valleys crestline, 3150 m a.s.l..
Mention the disposition of the frozen discontinuity zones as possible detachment zones with daylighted bedding.
............................................................................................................................................................................ 141
Fig. 75: ERT of Transect NE (September 13, 2005). Mention the persistently thawed deep- reaching cleft water
zones. .................................................................................................................................................................. 143

154
Bibliography
Abele, G., 1972. Kinematik und Morphologie spät- und postglazialer Bergstürze in den Alpen. Z. Geomorph. N.F., Suppl.-Bd. 14: 138-149.
AEG, 1931. Die bayerische Zugspitzbahn. AEG-Mitteilungen. AEG, Berlin.
Ahnert, F., 1970. Functional relationships between denudation, relief and uplift in large mid-latitude drainage basins. Am. J. Sci., 268: 243-263.
Ahnert, F., 1994. Equilibrium, Scale and Inheritance in Geomorphology. Geomorphology, 11(2): 125-140.
Alba-Simionesco, C., Coasne, B., Dosseh, G., Dudziak, G., Gubbins, K.E., Radhakrishan, R. and Sliwinska-Bartkowiak, M., 2006. Effects of confinement on freezing an melting. J. Phys.: Condens. Matter, 18: 15-68.
Alumbaugh, D.L. and Newman, G.A., 2000. Image appraisal for 2-D and 3-D electromagnetic inversion. Ge-ophysics, 65(5): 1455-1467.
Archie, G.E., 1942. The electric resistivity log as an aid in determining some reservoir characteristics. Trans. AIME, 146: 54-62.
Arenson, L., 2003. Unstable Alpine Permafrost: A Potentially Important Natural Hazard - Variations of Geotech-nical Behavior with Time and Temperature. Ph.D. Thesis, ETH Zurich, Zurich.
Arenson, L.U., Hoelzle, M. and Springman, S.M., 2002. Borehole deformation measurements and internal struc-ture of some rock glaciers in Switzerland. Permafrost and Periglac. Process., 13(2): 117-135.
Arenson, L.U., Johansen, M.M. and Springman, S.M., 2004. Effects of volumetric ice content and strain rate on shear strength under triaxial conditions for frozen soil samples. Permafrost and Periglac. Process., 15(3): 261-271.
Arenson, L.U. and Springman, S.M., 2005a. Mathematical description for the behaviour of ice-rich frozen soils at temperatures close to zero centigrade. Canadian Geotechnical Journal, 42(2): 431-442.
Arenson, L.U. and Springman, S.M., 2005b. Triaxial constant stress and constant strain rate tests on ice-rich permafrost samples. Canadian Geotechnical Journal, 42(2): 412-430.
Atkinson, B.K., 1984. Subcritical Crack-Growth in Geological-Materials. Journal of Geophysical Research, 89(NB6): 4077-4114.
Augustinus, P.C., 1992. The Influence on Rock Mass Strength on Glacial Valley Cross-Profile Morphometry: A Case Study from the Southern Alps, New Zealand. Earth Surf. Process. Landforms, 17: 39-51.
Barker, R.D., 1989. Depth of investigation of collinear symmetrical four-electrode arrays. Geophysics, 54(8): 1031-1037.
Barnes, P., Tabor, D. and Walker, J.C.F., 1971. Friction and creep of polycrystalline ice. Proc. of the Royal Socie-ty of London, Series A, 324(1557): 127-155.
Barsch, D., 1993. Periglacial geomorphology in the 21st century. Geomorphology, 7: 141-163.
Barton, N. and Choubey, V., 1977. The shear strength of rock joints in theory and practise. Rock Mech., 10: 1-54.
Bearth, P., 1980. Geologische Karte St. Niklaus 1:25.000, Geologischer Atlas der Schweiz. Schweizer Geologi-sche Kommission, Basel.
Beniston, M., 2004. Climatic Change and its Impacts: An overview focusing on Switzerland. Kluwer Academic Publishers, Dordrecht.
Berkowitz, B., 2002. Characterizing flow and transport in fractured geological media: A review. Advances in Water Resources, 25(8-12): 861-884.
Binley, A. and Kemna, A., 2005. Electrical methods. In: Y. Rubin and S.S. Hubbard (Editors), Hydrogeophysics. Springer: 129-156.
Binley, A., Ramiraz, A. and Daily, W., 1995. Regularised image reconstruction of noisy electrical resistance tomography data, 4th Workshop of the European Concerted Action on Process Tomography, Bergen, Norway.
Blaschek, R., Hördt, A. and Kemna, A., 2008. A new sensitivity-controlled focusing regularization scheme for the inversion of induced polarization data based on the minimum gradient support. Geophysics, 73(2): 45-54.
Bottino, G., Chiarle, M., Joly, A. and Mortara, G., 2002. Modelling rock avalanches and their relation to per-mafrost degradation in glacial environments. Permafrost and Periglac. Process., 13(4): 283-288.
Brunsden, D., 2004. Relaxation time. In: A. Goudie (Editor), Encyclopedia of Geomorphology. Routledge, Lon-don: 838-840.

155
Brunsden, D. and Thornes, J.B., 1979. Landscape sensitivity and change. Transactions of the British Institute of Geographers, 4(4): 463-484.
Budd, W.F. and Jacka, T.H., 1989. A review of ice rheology for ice-sheet modeling. Cold Regions Science and Technology, 16: 107-144.
Bussian, A.E., 1983. Electrical conductance in a porous medium. Geophysics, 48(9): 1258-1268.
Chan, T., Christiansson, R., Boulton, G.S., Ericsson, L.O., Hartikainen, J., Jensen, M.R., Mas Ivars, D., Stan-chell, F.W., Vistrand, P. and Wallroth, T., 2005. DECOVALEX III BMT3/BENCHPAR WP4: The ther-mo-hydro-mechanical responses to a glacial cycle and their potential implications for deep geological disposal of nuclear fuel waste in a fractured crystalline rock mass. International Journal of Rock Me-chanics and Mining Sciences, 42(5-6): 805-827.
Chang, S.-H., Lee, C.-I. and Jeon, S., 2002. Measurement of rock fracture toughness under modes I and II and mixed-mode conditions by using disc-type specimens. Engineering Geology, 66(1-2): 79-97.
Choi, J.S., Ryu, H.H., Lee, I.M. and Cho, G.C., 2006. Rock mass classification using electrical resistivity - An analytical study. In: S.S. Lee, J.H. Lee, S.J. Song and M.Y. Choi (Editors), Advanced Nondestructive Evaluation. Key engineering materials. Trans Tech Publications LTD, Zurich-Uetikon: 1411-1414.
Chorley, R.J. and Kennedy, B.A., 1971. Physical Geography - A Systems Approach. Prentice-Hall, London.
Crosta, G.B., Hungr, O., Sosio, R. and Frattini, P., 2007. Dynamic analysis of the Punta Thurwieser rock avalan-che. Geophysical Research Abstracts, 9: 09602.
Cruden, D.M., 2003. The shapes of cold, high mountains in sedimentary rocks. Geomorphology, 55(1-4): 249-261.
Davies, M.C.R., Hamza, O. and Harris, C., 2001. The effect of rise in mean annual temperature on the stability of rock slopes containing ice-filled discontinuities. Permafrost and Perigl. Process., 12(1): 137-144.
Davies, M.C.R., Hamza, O. and Harris, C., 2003. Physical modelling of permafrost warming in rock slopes. In: M. Phillips, S. Springman and L. Arenson (Editors), 8th Int. Con. on Permafrost. Balkema, Zürich: 169-174.
Davies, M.C.R., Hamza, O., Lumsden, B.W. and Harris, C., 2000. Laboratory measurements of the shear strength of ice-filled rock joints. Annals of Glaciology, 31: 463-467.
Day-Lewis, F.D., Singha, K. and Binley, A.M., 2005. Applying petrophysical models to radar travel time and electrical resistivity tomograms: Resolution-dependent limitations. Journal of Geophysical Research - Solid Earth, 110(B8): B08206.
Deline, P., 2002. Etude géomorphologique des interactions écroulement rocheux/glaciales dans la haut montagne alpine (versant sud-est du massif Mont Blanc). Ph.D. Thesis, Universite de Savoie, Bourget du Lac.
Deline, P., Jaillet, S., Rabatel, A. and Ravanel, L., 2008. Ground-Based LiDAR data on permafrost-related rock fall activity in the Mont-Blanc massif. In: D.L. Kane and K.M. Hinkel (Editors), 9th Int. Conf. on Per-mafrost. Inst. of. North. Engineering, UAF, Fairbanks, Alsaka, US: 349-354.
Deparis, J., Fricout, B., Jongmans, D., Villemin, T., Effendiantz, L. and Mathy, A., 2008. Combined use of ge-ophysical methods and remote techniques for characterizing the fracture network of a potentially unstable cliff site (the 'Roche du Midi', Vercors massif, France). Journal of Geophysics and Enginee-ring, 5(2): 147-157.
Dey, A. and Morrison, H.F., 1979. Resistivity modelling for arbitrarily shaped two-dimensional structures. Ge-ophysical Prospecting, 27: 106-136.
Dikau, R., 2006. Komplexe Systeme in der Geomorphologie. Mitt. Österr. Geogr. Ges., 148: 125-150.
Dorren, L.K.A., 2003. A review of rockfall mechanics and modelling approaches. Progress in Physical Ge-ography, 26(1): 69-87.
Eberhardt, E., Spillmann, T., Maurer, H., Willenberg, H., Loew, S. and Stead, D., 2004. The Randa Rockslide Laboratory: Establishing brittle and ductile instability mechanisms using numerical modelling and mic-roseismicity, 9th Int. Symposium of Landslides A.A. Balkema, Rio de Janeiro: 481-487.
Edwards, L.S., 1977. A modified pseudosection for resistivity and IP. Geophysics, 42(5): 1020-1036.
Erismann, T.H. and Abele, G., 2001. Dynamics of Rockslides and Rockfalls. Springer, Heidelberg.
Fischer, L. and Huggel, C., 2008. Methodical Design for Stability Assessments of Permafrost-Affected High-Mountain Rock Walls. In: D.L. Kane and K.M. Hinkel (Editors), 9th Int. Conf. on Permafrost. INE-UAF, Fairbanks, Alaska, US: 439-444.
Fischer, L., Huggel, C. and Lemy, F., 2007. Investigation and modeling of periglacial rock fall events in the Eu-ropean Alps. Geophysical Research Abstracts, 9: 08160.

156
Fischer, L., Kääb, A., Huggel, C. and Noetzli, J., 2006. Geology, glacier retreat and permafrost degradation as controlling factors of slope instability in a high-mountain rock wall: the Monte Rosa east face. Nat. Ha-zards Earth Syst. Sci., 6: 761-772.
Fleming, R.W. and Johnson, A.M., 1989. Structures associated with strike-slip faults that bound landslide ele-ments. Eng. Geol., 27: 39-114.
Frauenfelder, R., 2005. Regional-scale modelling of the occurrence and dynamics of the distribution of paleo-permafrost. Ph.D. Thesis, University of Zurich, Zurich.
French, H. and Thorn, C.E., 2006. The changing nature of periglacial geomorphology. Géomorphologie: relief, processus, environnement, 3: 1-13.
Friedel, S., Thielen, A. and Springman, S.M., 2006. Investigation of a slope endangered by rainfall-induced landslides using 3D resistivity tomography and geotechnical testing. Journal of Applied Geophysics, 60(2): 100-114.
Glawe, U., 1991. Bericht über die geotechnischen Untersuchungen im Bereiche des Waxensteinkammes. Un-published report for the Geological Survey of Bavaria.
Gruber, S., 2005. Mountain Permafrost: Transient spatial modelling, model verification and the use of remote sensing. Ph.D. Thesis, Universität Zurich, Zurich.
Gruber, S. and Haeberli, W., 2007. Permafrost in steep bedrock slopes and its temperature-related destabilization following climate change. Journal of Geophysical Research - Earth Surface, 112(F2): F02S13.
Gruber, S. and Hoelzle, M., 2001. Statistical modelling of mountain permafrost distribution: Local calibration and incorporation of remotely sensed data. Permafrost and Periglac. Process., 12(1): 69-77.
Gruber, S., Hoelzle, M. and Haeberli, W., 2004a. Permafrost thaw and destabilization of Alpine rock walls in the hot summer of 2003. Geophys. Res. Lett., 31(13): L15054.
Gruber, S., Hoelzle, M. and Haeberli, W., 2004b. Rock-wall temperatures in the Alps: Modelling their to-pographic distribution and regional differences. Permafrost and Periglac. Process., 15(3): 299-307.
Gruber, S., Peter, M., Hoelzle, M., Woodhatch, I. and Haeberli, W., 2003. Surface temperatures in steep alpine rock faces – A strategy for regional-scale measurement and modelling. In: M. Phillips, S. Springman and L. Arenson (Editors), 8th International Conference on Permafrost, Proceedings. Swets & Zeitlinger, Lisse, Zürich: 325-330.
Gude, M. and Barsch, D., 2005. Assessment of the geomorphic hazards in connection with permafrost occurren-ce in the Zugspitze area (Bavarian Alps, Germany). Geomorphology, 66(1-4): 85-93.
Guenzel, F., 2008. Shear Strength of Ice-Filled Rock Joints. In: D.L. Kane and K.M. Hinkel (Editors), 9th Int. Conf. on Permafrost. INE-UAF, Fairbanks, Alaska, US: 581-586.
Hack, J., 1960. Interpretation of erosional topography in humid temperate regions. Am. J. Sci., 258-A: 80-97.
Haeberli, W., 1992. Construction, environmental problems and natural hazards in periglacial mountain belts. Permafrost and Periglac. Process., 3: 111-124.
Haeberli, W., 2005. Investigating glacier-permafrost relationships in high-mountain area: historical background, selected examples and research needs. In: C. Harris and J.B. Murton (Editors), Cryospheric Systems: Glaciers and Permafrost. Geological Society Special Publication, London: 29-37.
Haeberli, W. and Beniston, M., 1998. Climate change and its impact on glaciers and permafrost in the Alps. Am-bio, 27: 258-265.
Haeberli, W., Huggel, C., Kääb, A., Polkvoj, A., Zotikov, I. and Osokin, N., 2003. Permafrost conditions in the starting zone of the Kolka-Kamadon rock/ice-slide of the 20th September 2002 in North Osetia (Russ-ian Caucasus). . In: W. Haeberli and D. Brandova (Editors), ICOP 2003 Permafrost: Extended Abstracts, Zürich: 49-50.
Haeberli, W., Huggel, C., Kääb, A., Zgraggen-Oswald, S., Polkvoj, A., Galushkin, I., Zotikov, I. and Osokin, N., 2004. The Kolka-Karmadon rock/ice slide of 20 September 2002: an extraordinary event of historical dimensions in North Ossetia, Russian Caucasus. Journal of Glaciology, 50: 533-546.
Haeberli, W., Wegmann, M. and Vonder Mühll, D., 1997. Slope stability problems related to glacier shrinkage and permafrost degradation in the Alps. Eclogae Geologicae Helvetiae, 90: 407-414.
Hall, K., Thorn, C.E., Matsuoka, N. and Prick, A., 2002. Weathering in cold regions: some thoughts and perspec-tives. Progress in Phys. Geogr., 26(4): 577-603.
Hansen, M.J., 1984. Strategies for classification of landslides. In: D. Brunsden and D.B. Prior (Editors), Slope Instability. Wiley, Chichester.
Hanson, S. and Hoelzle, M., 2004. The thermal regime of the active layer at the Murtel rock glacier based on data from 2002. Permafrost and Periglac. Process., 15(3): 273-282.

157
Harris, C., Arenson, L.U., Christiansen, H.H., Etzelmüller, B., Frauenfelder, R., Gruber, S., Haeberli, W., Hauck, C., Hölzle, M., Humlum, O., Isaksen, K., Kääb, A., Kern-Lütschg, M.A., Lehning, M., Matsuoka, N., Murton, J.B., Nötzli, J., Phillips, M., Ross, N., Seppälä, M., Springman, S.M. and Vonder Mühll, D., 2009. Permafrost and climate in Europe: Monitoring and modelling thermal, geomorphological and ge-otechnical responses. Earth-Science Reviews, 92(3-4): 117-171.
Harris, C., Davies, M.C.R. and Etzelmüller, B., 2001. The assessment of potential geotechnical hazards associa-ted with mountain permafrost in a warming global climate. Permafrost and Perigl. Process., 12(1): 145-156.
Harris, C., Davies, M.C.R. and Rea, B.R., 2003a. Gelifluction: viscous flow or plastic creep? Earth Surf. Pro-cess. Landforms, 28(12): 1289-1301.
Harris, C., Vonder Mühll, D., Isaksen, W., Haeberli, W., Sollid, J.L., King, L., Homlund, P., Dramis, F., Gugliel-min, M. and Palacios, D., 2003b. Warming permafrost in European mountains. Global and Planetary Change, 39(3-4): 215-225.
Hasler, A., Talzi, I., Beutel, J., Tschudin, C. and Gruber, S., 2008. Wireless Sensor Networks in Permafrost Re-search: Concept, Requirements, Implementation, and Challenges. In: D.L. Kane and K.M. Hinkel (Edi-tors), 9th Int. Conf. on Permafrost. INE-UAF, Fairbanks, Alaska, US: 669-674.
Hauck, C., 2001. Geophysical methods for detecting permafrost in high mountains. Ph.D. Thesis, ETH Zurich, Zurich.
Hauck, C., 2002. Frozen ground monitoring using DC resistivity tomography. Geophys. Res. Lett., 29(21): 2016.
Hauck, C., Bach, M. and Hilbich, C., 2008. A four-phase model to quantify subsurface ice content in permafrost regions based on geophysical data sets. In: D.L. Kane and K.M. Hinkel (Editors), 9th Int. Conf. on Permafrost. Institute of Northern Engineering, UAF, Fairbanks, US: 675-680.
Hauck, C. and Vonder Mühll, D., 2003. Inversion and interpretation of two-dimensional geoelectrical measure-ments for detecting permafrost in mountainous regions. Permafrost Periglac. Process., 14(4): 305-318.
Hayley, K., Bentley, L.R., Gharibi, M. and Nightingale, M., 2007. Low temperature dependence of electrical resistivity: Implications for near surface monitoring. Geophysical Research Letters, 34: L18402.
Heincke, B., Green, A.G., van der Kruk, J. and Willenberg, H., 2006a. Semblance-based topographic migration (SBTM): a method for identifying fracture zones in 3-D georadar data. Near Surface Geophysics, 4(2): 79-88.
Heincke, B., Maurer, H., Green, A.G., Willenberg, H., Spillmann, T. and Burlini, L., 2006b. Characterizing an unstable mountain slope using shallow 2-D and 3-D seismic tomography. Geophysics, 71(6): 241-256.
Hera, U., 1997. Gletscherschwankungen in den Nördlichen Kalkalpen seit dem 19. Jh. Münchner Geogr. Abh. Reihe B, 25: 1-205.
Herwanger, J.V., Pain, C.C., Binley, A., de Oliveira, C.R.E. and Worthington, M.H., 2004. Anisotropic resistivity tomography. Geophysical Journal International, 158(2): 409-425.
Hewitt, K., Clague, J.J. and Orwin, J.F., 2008. Legacies of catastrophic rock slope failures in mountain landsca-pes. Earth-Science Reviews, 87(1-2): 1-38.
Hilbich, C., Hauck, C., Hoelzle, M., Scherler, M., Schudel, L., Voelksch, I., Muehll, D.V. and Maeusbacher, R., 2008. Monitoring mountain permafrost evolution using electrical resistivity tomography: A 7-year study of seasonal, annual, and long-term variations at Schilthorn, Swiss Alps. Journal of Geophysical Re-search - Earth Surface, 113(F1): F01590.
Hirtlreiter, G., 1992. Spät- und postglaziale Gletscherschwankungen im Wettersteingebirge und seiner Umge-bung. Münchner Geographische Abhandlungen, Beihe B, 15: 1-154.
Hoek, E., 2007. Practical Rock Engineering. Rocscience EBooks.
Hoek, E. and Bray, J., 1981. Rock Slope Engineering. Institution of Mining and Metallurgy, London.
Hoelze, M., 1994. Permafrost und Gletscher im Oberengadin. Grundlagen und Anwendungsbeispiele für automa-tisierte Schätzverfahren. VAW Mitteilungen, 132: 1-121.
Hoelzle, M., Mittaz, C., Etzelmüller, B. and Haeberli, W., 2001. Surface energy fluxes and distribution models of permafrost in European mountain areas: an overview of current developments. Permafrost and Periglac. Process., 12(1): 53-68.
Holcombe, H.T. and Jiracek, G.R., 1984. Three-dimensional terrain corrections in resistivity surveys. Geophy-sics, 49(4): 439-452.
Hormes, A., Muller, B.U. and Schluchter, C., 2001. The Alps with little ice: evidence for eight Holocene phases of reduced glacier extent in the Central Swiss Alps. Holocene, 11(3): 255-265.
Hovius, N., Lague, D. and Dadson, S., 2004. Processes, rates and patterns of mountain belt erosion. In: P.N. Owens and O. Slaymaker (Editors), Mountain Geomorphology. Arnold, London.

158
Huggel, C., in press. Recent extreme slope failures in glacial environments: effects of thermal perturbation. Qua-ternary Science Reviews.
Huggel, C., Gruber, S., Caplan-Auerbach, J., Wessels, R.L. and Molnia, B.F., 2008. The 2005 Mt. Steller, Alaska, Rock-Ice Avalanche: A Large Slope Failure in Cold Permafrost. In: D.L. Kane and K.M. Hinkel (Edi-tors), 9th Int. Conf. on Permafrost. INE-UAF, Fairbanks, Alaska, US: 747-752.
Hungr, O., Evans, S.G. and Hazzard, J., 1999. Magnitude and frequency of rock falls and rock slides along the main transportation corridors of southwestern British Columbia. Canadian Geotechnical Journal, 36(2): 224-238.
Hurrel, J.W. and van Loon, H., 1997. Decadal variations in climate associated with the North Atlantic oscillation. Climatic Change, 36: 301-306.
Isaksen, K., Benestad, R.E., Harris, C. and Sollid, J.L., 2007. Recent extreme near-surface permafrost temperatu-res on Svalbard in relation to future climate scenarios. Geophysical Research Letters, 34(17): L17502.
Ivy-Ochs, S., Kerschner, H., Kubik, P.W. and Schluchter, C., 2006. Glacier response in the European Alps to Heinrich Event 1 cooling: the Gschnitz stadial. Journal of Quaternary Science, 21(2): 115-130.
Jaeger, J.C., Cook, N.G.W. and Zimmerman, R.W., 2007. Fundamentals of Rock Mechanics. Blackwell Publis-hing, Oxford.
Jähnert, S., Chavez, F.V., Schaumann, G.E., Schreiber, A., Schonhoff, M. and Findenegg, G.H., 2008. Melting and freezing of water in cylindrical silica nanopores. Physical Chemistry Chemical Physics, 10(39): 6039-6051.
Jerz, H. and Poschinger, A.v., 1995. Neuere Ergebnisse zum Bergsturz Eibsee-Grainau. Geologica Bavarica, 99: 383-398.
Jerz, U., 1999. Nacheiszeitliche Bergstürze in den Bayerischen Alpen. Relief, Boden, Paläoklima, 14: 31-40.
Jorgenson, M.T., Shur, Y.L. and Pullman, E.R., 2006. Abrupt increase in permafrost degradation in Arctic Alas-ka. Geophysical Research Letters, 33(2): L02503.
Jouniaux, L., Zamora, M. and Reuschle, T., 2006. Electrical conductivity evolution of non-saturated carbonate rocks during deformation up to failure. Geophysical Journal International, 167(2): 1017-1026.
Jungo, P. and Beniston, M., 2001. Changes in the anomalies of extreme temperatures in the 20th century at Swiss climatological stations located at different latitudes and altitudes. Theor. and Appl. Clim., 69: 1-12.
Kääb, A., Wessels, R., Haeberli, W., Huggel, C., Kargel, J.S. and Khalsa, S.J., 2003. Rapid aster imaging facilita-tes timely assessments of glacier hazards and disasters. EOS, 13(84): 117, 121.
Keller, F. and Gubler, H.U., 1993. Interaction between snow cover and mountain permafrost, Murtèl-Corvatsch, Swiss Alps, 6th Int. Conf. on Permafrost. South China University of Technology Press, Beijing, China: 332-337.
Keller, G.V. and Frischknecht, F.C., 1966. Electrical Methods in Geophysical Prospecting. Pergamon Press, Ox-ford.
Kemeny, J., 2003. The time-dependent reduction of sliding cohesion due to rock bridges along discontinuities: A fracture mechanics approach. Rock. Mech. Rock Eng., 36(1): 27-38.
Kemna, A., 2000. Tomographic inversion of complex resistivity—Theory and application. Ph.D. Thesis, Univer-sity of Bochum, Bochum.
Kleinberg, R.L. and Griffin, D.D., 2005. NMR measurements of permafrost: unfrozen water assay, pore-scale distribution of ice, and hydraulic permeability of sediments. Cold Regions Science and Technology, 42(1): 63-77.
Kneisel, C., 2006. Assessment of subsurface lithology in mountain environments using 2D resistivity imaging. Geomorphology, 80(1-2): 32-44.
Kneisel, C., Hauck, C., Fortier, R. and Moorman, B., 2008. Advances in geophysical methods for permafrost investigations. Permafrost and Perigl. Process., 19(2): 157-178.
Koestel, J., Kemna, A., Javaux, M., Binley, A. and Vereecken, H., 2008. Quantitative imaging of solute transport in an unsaturated and undisturbed soil monolith with 3D ERT and TDR. Water Resour. Res., 44(12): W12411.
Kohl, T., 1999. Transient thermal effects below complex topographies. Tectonophysics, 306(3-4): 311-324.
Kohl, T. and Gruber, S., 2003. Evidence of paleotemperature signals in mountain permafrost areas, 8th Int. Conf. on Permafrost, Zurich: 83-84.
Kolditz, O., 2001. Non-linear flow in fractured rock. International Journal of Numerical Methods for Heat & Fluid Flow, 11(6): 547-575.

159
Körner, H. and Ulrich, R., 1965. Geologische und felsmechanische Untersuchungen für die Gipfelstation der Seilbahn Eibsee - Zugspitze. Geologica Bavarica, 55: 404-421.
Korup, O., 2008. Rock type leaves topographic signature in landslide-dominated mountain ranges. Geophysical Research Letters, 35(11): L11402.
Krautblatter, M., 2008. Rock Permafrost Geophysics and its Explanatory Power for Permafrost-Induced Rock-falls and Rock Creep: a Perspective. In: D.L. Kane and K.M. Hinkel (Editors), 9th Int. Conf. on Per-mafrost. INE-UAF, Fairbanks, Alaska, US: 999-1004.
Krautblatter, M. and Dikau, R., 2007. Towards a uniform concept for the comparison and extrapolation of rock-wall retreat and rockfall supply. Geografiska Annaler, 89 A(1): 21-40.
Krautblatter, M. and Hauck, C., 2007. Electrical resitivity tomography monitoring of permafrost in solid rock walls. Journal of Geophysical Research - Earth Surface, 112(F2): F02S20.
Krautblatter, M., Hauck, C. and Wolf, S., 2007. Geophysical 2D and 3D-monitoring of permafrost in rock walls. Geophysical Research Abstracts, 9: A-09884.
Krautblatter, M. and Verleysdonk, S., 2008a. Rock wall permafrost monitoring with high-resolution 2D-ERT: lessons learnt from error estimates and a comparison of Wenner, Schlumberger, Gradient and Dipole-type arrays. Geophysical Research Abstracts, 10: A-10383.
Krautblatter, M. and Verleysdonk, S., 2008b. Thawing regime and response time of present-day and relict per-mafrost revealed by monthly geophysical monitoring (Zugspitze, German/Austrian Alps). Geophysical Research Abstracts, 10: A-10455.
Krus, M., 1995. Feuchtetransport und Speicherkoeffizienten poröser mineralischer Baustoffe - theoretische Grundlagen und neue Meßtechniken. Ph.D. Thesis, University of Stuttgart, Stuttgart.
Kukkonen, I.T. and Safanda, J., 2001. Numerical modelling of permafrost in bedrock in northern Fennoscandia during the Holocene. Global and Planetary Change, 29: 259-274.
LaBrecque, D.J., Miletto, M., Daily, W., Ramirez, A. and Owen, E., 1996. The effects of noise on Occam's inver-sion of resistivity tomography data. Geophysics, 61(2): 538-548.
Lachenbruch, A.H. and Marshall, B.V., 1986. Changing Climate - Geothermal Evidence from Permafrost in the Alaskan Arctic. Science, 234(4777): 689-696.
Lautridou, J.P., 1988. Recent advances in cryogenic weathering. In: J.M. Clark (Editor), Advances in Periglacial Geomorphology. Wiley, Chichester: 33-47.
Lawrence, D.M. and Slater, A.G., 2005. A projection of severe near-surface permafrost degradation during the 21st century. Geophysical Research Letters, 32(24): L24401.
Le Guen, Y., Renard, F., Hellmann, R., Brosse, E., Collombet, M., Tisserand, D. and Gratier, J.P., 2007. Enhan-ced deformation of limestone and sandstone in the presence of high P-co2 fluids. Journal of Geophysi-cal Research - Solid Earth, 112(B5): B05421.
Linde, N., 2005. Characterization of Hydrogeological Media using electromagnetic geophysics. Ph.D. Thesis, University of Uppsala, Uppsala.
Lock, G.S.H., 2005. The growth and decay of ice. Studies in Polar Research. University Press, Cambridge.
Loke, M. and Barker, R., 1995. Least-square deconvolution of apparent resistivity pseudosections. Geophysics, 60(6): 1682-1690.
Loke, M.H. and Barker, R.D., 1996. Rapid least-squares inversion of apparent resistivity pseudosections by a quasi-Newton method. Geophysical Prospecting, 44(1): 131-152.
Matias, M.J.S., 2008. Electrical strike imaging and anisotropy diagnosis from surface resistivity measurements. Near Surface Geophysics, 6(1): 49-58.
Matsuoka, N., 1990. The rate of bedrock weathering by frost action: field measurements and a predictive model. Earth Surf. Process. Landforms, 15(1): 73-90.
Matsuoka, N., 2001. Microgelivation versus macrogelivation: Towards bridging the gap between laboratory and field frost weathering. Permafrost and Periglac. Process., 12(3): 299-313.
Matsuoka, N., 2008. Frost weathering: Recent advances and future directions. Permafrost and periglacial proces-ses, 19(2): 195-210.
Maurer, H. and Hauck, C., 2007. Instruments and Methods: Geophysical imaging of alpine rock galciers. Journal of Glaciology, 53(180): 110-120.
McGinnis, L.D., Nakao, K. and Clark, C.C., 1973. Geophysical identification of frozen and unfrozen ground, Antarctica, 2nd Int. Conf. on Permafrost, Yakutsk, Russia: 136-146.
Mears, B., 1997. Pleistocene Gelifluction and Rock Deformation on Slopes in Southern Wyoming. Permafrost and Periglac. Process., 8: 251-255.

160
Mellor, M., 1973. Mechanical Properties of Rocks at Low Temperatures, 2nd Int. Conference on Permafrost, Yakutsk, Russia: 334-344.
Miller, H., 1961. Der Bau des westlichen Wettersteingebirges. Z. dt. geol. Ges., 113: 409-25.
Mittaz, C., Hoelzle, M. and Haeberli, W., 2000. First results and interpretation of energy-flux measurements over Alpine permafrost. Annals of Glaciology, 31: 275-280.
Montgomery, D.R., 2001. Slope distributions, threshold hillslopes, and steady-state topography. American Jour-nal of Science, 301(4-5): 432-454.
Moon, B.P., 1984. Refinement of a technique for determining rock mass strength fro geomorphological purposes. Earth Surf. Process. Landforms, 9: 183-193.
Moore, I.D., Norton, T.W. and Williams, J.E., 1993. Modeling Environmental Heterogeneity in Forested Lands-capes. Journal of Hydrology, 150(2-4): 717-747.
Moorman, B.J., 2005. Glacier-permafrost hydrological interconnectivity: Stagnation Glacier, Bylot Island, Cana-da. In: C. Harris and J.B. Murton (Editors), Cryospheric Systems: Glaciers and Permafrost. Geological Society Special Publication, London: 63-74.
Murton, J.B., Coutard, J.-P., Lautridou, J.P., Ozouf, J.-C., Robinson, D.A., Williams, R.B.G., Guillemet, G. and Simmons, P., 2000. Experimental design for a pilot study on bedrock weathering near the permafrost table. Earth Surf. Process. Landforms, 25: 1281-1294.
Murton, J.B., Peterson, R. and Ozouf, J.-C., 2006. Bedrock Fracture by Ice Segregation in Cold Regions. Scien-ce, 314: 1127-1129.
Musil, M., Maurer, H., Green, A.G., Horstmeyer, H., Nitsche, F., Vonder Mühll, D. and Springman, S., 2002. Shallow seismic surveying of an Alpine rock glacier. Geophysics, 67(6): 1701-1710.
Mustafa, O., 2002. Permafrostverbreitung an der Zugspitze - Modellierung und Geländebefunde. Diploma The-sis, University of Jena, Jena.
Noetzli, J., 2008. Modeling Transient Three-dimensional Temperature Fields in Mountain Permafrost. Ph.D. Thesis, University of Zurich, Zurich.
Noetzli, J., Gruber, S., Kohl, T., Salzmann, N. and Haeberli, W., 2006. Transient modeling of ground temperatu-res in an idealized high mountain topography. Geophys. Res. Abstracts, 8: A01957.
Noetzli, J., Gruber, S., Kohl, T., Salzmann, N. and Haeberli, W., 2007. Three-dimensional distribution and evolu-tion of permafrost temperatures in idealized high-mountain topography. Journal of Geophysical Re-search - Earth Surface, 112(F2): F02S13.
Noetzli, J., Hoelzle, M. and Haeberli, W., 2003. Mountain permafrost and recent Alpine rock-fall events: a GIS-based approach to determine critical factors. In: M. Phillips, S. Springman and L. Arenson (Editors), 8th International Conference on Permafrost. Swets & Zeitlinger, Zurich.
Nogués-Bravo, D., Araújo, M.B., Errea, M.P. and Martínez-Rica, J.P., 2007. Exposure of global mountain sys-tems to climate warming during the 21st Century. Global Environmental Change, 17: 420-428.
Norton, J.J. and Redden, J.A., 1960. Structure Associated with Rock Creep in the Black Hills, South-Dakota. Geological Society of America Bulletin, 71(7): 1109-1112.
NRC-Permafrost-Subcommitee, 1988. Glossary of Permafrost and related ground-ice terms. NRC Technical Memorandum, 142: 1-156.
Oldenburg, D.W. and Li, Y.G., 1999. Estimating depth of investigation in DC resistivity and IP surveys. Geophy-sics, 64(2): 403-416.
Otto, J.C. and Dikau, R., 2004. Geomorphologic system analysis of a high mountain valley in the Swiss Alps. Z. Geomorph. N.F., 48(3): 323-341.
Otto, J.C. and Sass, O., 2006. Comparing geophysical methods for talus slope investigations in the Turtmann valley (Swiss Alps). Geomorphology, 76(3-4): 257-272.
Paterson, W.S.B., 2001. The Physics of Glaciers. Butterworth & Heinemann, Oxford.
Patton, F.D., 1966. Multiple modes of shear failure in rock, 1st Congress Int. Society for Rock Mech. Lab. of Civil Engineering, Lisbon, Portugal: 509-513.
Pearson, C., Murphy, J., Halleck, P., Hermes, R. and Mathews, M., 1983. Sonic and resistivity measurements on Berea sandstone containing tetrahydrofuran hydrates: a possible analog to natural gas hydrate deposits, 4th Int. Conf. On Permafrost. UAF, Fairbanks, Alaska, US: 973-978.
Penck, W., 1924. Die morphologische Analyse. J. Engelshorn Verlag, Stuttgart.
Peter, M., 2003. Untersuchungen von Felstemperaturen im alpinen Permafrost. Diploma Thesis, University of Zurich, Zurich.

161
Petley, D.N. and Petley, D.J., 2005. On the initiation of large rockslides: perspectives from a new analysis of the Vajont movement record. In: S. Evans (Editor), Large Rock Slope Failures. Kluwer, Rotterdam (Nato Science Series).
Phillips, J.D., 2006. Evolutionary geomorphology: thresholds and nonlinearity in landform response to environ-mental change. Hydrology and Earth System Sciences, 10(5): 731-742.
Pogrebiskiy, M.I. and Chernyshev, S.N., 1977. Determination of the Permeability of the Frozen Fissured Rock Massif in the Vicinity of the Kolyma Hydroelectric Power Station. Cold Regions Research and Engi-neering Laboratory - Draft Translation, 634: 1-13.
Prager, C., Zangerl, C., Patzelt, G. and Brandner, R., 2008. Age distribution of fossil landslides in the Tyrol (Austria) and its surrounding areas. Natural Hazards and Earth System Sciences, 8(2): 377-407.
Prinz, H., 1997. Abriß der Ingenieurgeologie. Enke, Stuttgart.
Quinton, W.L. and Carey, S.K., 2008. Towards an energy-based runoff generation theory for tundra landscapes. Hydrological Processes, 22(23): 4649-4653.
Quinton, W.L., Shirazi, T., Carey, S.K. and Pomeroy, J.W., 2005. Soil water storage and active-layer develop-ment in a sub-alpine tundra hillslope, southern YukonTerritory, Canada. Permafrost and Periglac. Pro-cess., 16(4): 369-382.
Rabatel, A., Deline, P., Jaillet, S. and Ravanel, L., 2008. Rock falls in high-alpine rock walls quantified by ter-restrial lidar measurements: A case study in the Mont Blanc area. Geophys. Res. Lett., 35(10): L10502.
Ravanel, L., Deline, P., Jaillet, S. and Rabatel, A., 2008. Quantifying rock falls/avalanches in steep high-alpine rock walls: three years of laserscanning in the MontBlanc massif. Geophysical Research Abstracts, 10: 10361.
Renshaw, C.E. and Schulson, E.M., 2001. Universal behaviour in compressive failure of brittle materials. Na-ture, 412(6850): 897-900.
Renwick, W.H., 1992. Equilibrium, Disequilibrium, and Nonequilibrium Landforms in the Landscape. Geo-morphology, 5(3-5): 265-276.
Roberts, J.J., 2002. Electrical properties of microporous rock as a function of saturation and temperature. Journal of Applied Physics, 91(3): 1687-1694.
Salzmann, N., Noetzli, J., Gruber, S., Hoelzle, M. and Haeberli, W., 2007. Ground-surface temperature scenarios for complex high-mountain topography based on regional climate model results. Journal of Geophysical Research - Earth Surface, 112(F2): F02S12.
Sanderson, T., 1988. Ice mechanics and risks to offshore structures. Springer, Amsterdam.
Sass, O., 1998. Die Steuerung von Steinschlagmenge durch Mikroklima, Gesteinsfeuchte und Gesteinseigen-schaften im westlichen Karwendelgebirge. Münchner Geogr. Abh., Reihe B, 29: 1-175.
Sass, O., 2003. Moisture distribution in rockwalls derived from 2D-resistivity measurements. Z. Geomorph. N.F., Suppl.-Bd., 132: 51-69.
Sass, O., 2004. Rock moisture fluctuations during freeze-thaw cycles: Preliminary results from electrical resisti-vity measurements. Polar Geography, 28(1): 13-31.
Sass, O., 2005a. Rock moisture measurements: Techniques, results, and implications for weathering. Earth Surf. Process. Landforms, 30(3): 359-374.
Sass, O., 2005b. Spatial patterns of rockfall intensity in the northern Alps. Z. Geomorph. N.F., Suppl.-Bd. 138: 51-65.
Sass, O., Krautblatter, M. and Morche, D., 2007. Rapid lake infill following major rockfall (bergsturz) events revealed by ground-penetrating radar (GPR) measurements, Reintal, German Alps. Holocene, 17(7): 965-976.
Schoeneich, P., Hantz, D., Vengon, M., Frayssines, M., Deline, P., Amelot, F. and Savary, J., 2004. A new Alpine rockfall inventory, Swiss Geoscience Meeting, Lausanne.
Seguin, M.K., 1978. Temperature-electrical resistivity relationship in continuous permafrost at Purtuniq, Ungava Peninsula. In: C.B. Crawford (Editor), 3rd Int. Conf. on Permafrost. NRC, Edmonton, Canada.
Selby, M.J., 1980. A rock mass strength classification for geomorphic purposes. Z. Geomorph. N. F., 24: 31-51.
Selby, M.J., 1989. Rock Slopes. In: M.G. Anderson and K.S. Richards (Editors), Slope stability. Wiley, Chi-chester.
Singha, K. and Gorelick, S.M., 2006. Effects of spatially variable resolution on field-scale estimates of tracer concentration from electrical inversions using Archie's law. Geophysics, 71(3): G83-G91.
Slater, L. and Binley, A., 2006. Synthetic and field-based electrical imaging of zerovalent iron barrier: Implicati-ons for monitoring long-term barrier performance. Geophysics, 71: 129-137.

162
Slater, L., Binley, A., Daily, W. and Johnson, R., 2000. Cross-hole electrical imaging of a controlled saline tracer injection. Journal of Applied Geophysics, 44: 85-102.
Sliwinska-Bartkowiak, M., Jazdzewska, M., Huang, L.L. and Gubbins, K.E., 2008. Melting behavior of water in cylindrical pores: carbon nanotubes and silica glasses. Physical Chemistry Chemical Physics, 10(32): 4909-4919.
Soldati, M., Corsini, A. and Pasuto, A., 2004. Landslides and climate change in the Italian Dolomites since the Late glacial. Catena, 55(2): 141-161.
Springman, S. and Arenson, L., 2008. Recent advances in permafrost geophysics. In: D.L. Kane and K.M. Hin-kel (Editors), 9th Int. Conf. on Permafrost. INE-UAF, Fairbanks, Alaska, US: 1685-1694.
Springman, S.M., Jommi, C. and Teysseire, P., 2003. Instabilities on moraine slopes induced by loss of suction: a case history. Geotechnique, 53(1): 3-10.
Stocker-Mittaz, C., Hoelzle, M. and Haeberli, W., 2002. Permafrost distribution modeling based on energy-balance data: a first step. Permafrost and Periglac. Process., 13(4): 271-282.
Tang, G.Z. and Wang, X.H., 2006. Modeling the thaw boundary in broken rock zones in permafrost in the pre-sence of surface water flows. Tunnelling and Underground Space Technology, 21(6): 684-689.
Telford, W.M., Geldart, L.P. and Sheriff, R.E., 1990. Applied Geophysics. University Press, Cambridge.
Terrana, S., Gambillara, R., Scesi, L. and Figaroli, M., 2005. Fissured aquifer in north-western area of Como lake basin: permeability calculation and relation with springs (central western Como lake, Italy). Ge-ophys. Res. Abstracts, 7: A07069.
Terzaghi, K., 1962. Stability of steep slopes in hard unweathered rock. Geotechnique, 12: 251-270.
Tinner, W., Kaltenrieder, P., Soom, M., Zwahlen, P., Schmidhalter, M., Boschetti, A. and Schluchter, C., 2005. The postglacial rockfall in the Kander valley (Switzerland): ge and effects on palaeo-environments. Ec-logae Geologicae Helvetiae, 98(1): 83-95.
Ulrich, R. and King, L., 1993. Influence of mountain permafrost on construction in the Zugspitze mountains, Bavarian Alps, Germany, 6th Int. Conf. on Permafrost, Bejing: 625-630.
Varnes, D.J., 1978. Slope Movement Types and Processes. In: R.L. Schuster and R.J. Krizek (Editors), Landsli-des Analysis and control. TRB, Special Report National Research Council, Washington, D.C.: 11-33.
Viles, H.A., 2001. Scale issues in weathering studies. Geomorphology, 41(1): 63-72.
Vogel, H.J., Cousin, I., Ippisch, O. and Bastian, P., 2006. The dominant role of structure for solute transport in soil: experimental evidence and modelling of structure and transport in a field experiment. Hydrology and Earth System Sciences, 10(4): 495-506.
Vosteen, H.D. and Schellschmidt, R., 2003. Influence of temperature on thermal conductivity, thermal capacity and thermal diffusivity for different types of rock. Phys. and Chem. of the Earth, 28(9-11): 499-509.
Wagner, W., Saul, A. and Pruß, A., 1994. International Equations for the Pressure along the Melting and along the Sublimation Curve of Ordinary Water Substance. J. Phys. Chem. Ref. Data, 23(3): 516-527.
Weertman, J., 1973. Creep of ice. In: E. Whalley, S.J. Jones and L.W. Gold (Editors), Physics and Chemistry of Ice. Royal Soc. of Canada, Ottawa: 320-337.
Wegmann, M., 1998. Frostdynamik in hochalpinen Felswänden am Beispiel der Region Jungfraujoch - Aletsch. Ph.D. Thesis, ETH Zurich, Zurich.
Wegmann, M., Gudmundsson, G.H. and Haeberli, W., 1998. Permafrost changes in rock walls and the retreat of Alpine glaciers: a thermal modelling approach. Permafrost and Periglac. Process., 9: 23-33.
Witherspoon, P.A., 2000. Inverstigations at Berkeley on Fracture Flow in Rock: From Parallel Plate Model to Chaotic Systems In: B. Faybishenko, P.A. Witherspoon and S.M. Benson (Editors), Dynamics of fluids in fractured rocks. American Geophysical Union, Washington D.C.: 1-58.
Wyllie, D.C. and Norrish, N.I., 1996. Rock strength properties and their measurement. In: A.K. Turner and R.L. Schuster (Editors), Landslides: Inverstigation and Mitigation. Transportation Research Board Special Report. NRC, Washington: 372-390.
Yershov, E.D., 2004. General Geocryology. University Press, Cambridge.
Zarnetske, J.P., Gooseff, M.N., Brosten, T.R., Bradford, J.H., McNamara, J.P. and Bowden, W.B., 2007. Tran-sient storage as a function of geomorphology, discharge, and permafrost active layer conditions in Arc-tic tundra streams. Water Resources Research, 43(7): W07410.
Zisser, N. and Nover, G., in press. Anisotropy of permeability and complex resistivity of tight sandstones subjec-ted to hydrostatic pressure. Journal of Applied Geophysics.
Zisser, N., Nover, G., Durrast, H. and Siegesmund, S., 2007. Relationship between electrical and hydraulic pro-perties of sedimentary rocks. Zeitschrift dt. Gesellschaft für Geowissenschaften, 158(4): 883-894.


![1838 marino[1]](https://img.dokumen.tips/doc/110x75/556c0f42d8b42a852a8b4a41/1838-marino1.jpg)


