Embed Size (px)
Citation preview

Thet-test

Datafiles
• SATpassage.sav• sel2elpBook.savHomework:- Word_recall.sav- LuckyCharm.sav

Comparingmeans
• CorrelaEonandregressionlookforrelaEonshipsbetweenvariables
• Testscomparingmeanslookfordifferencesbetweenthemeansoftwoormoresamples
• Generalnullhypothesis:thesamplescomefromthesamepopulaEon
• Generalresearchhypothesis:thesamplescomefromdifferentpopulaEons

ChoosingastaEsEcaltest:normality
• TherearetwosetsofstaEsEcaltestsforcomparingmeans:– Parametrictests:workwithnormallydistributedscaledata
– Non-parametrictests:usedwithnotnormallydistributedscaledataandwithordinaldata

ChoosingstaEsEcaltests:howmanymeans?
• Withinparametricandnon-parametrictests– someworkwithjusttwomeans– othersworkwithmorethantwomeans

ChoosingstaEsEcaltests:researchdesign
• MoststaEsEcaltestshaveatleasttwoversions:– oneforrelated(paired,within-subjects,repeatedmeasures)design
– andoneforunrelated(independent,betweensubjects)designs

The t-test • Parametric: works on normally
distributed scale data • Compares TWO means • There are different versions for different
designs

Typesoft-test
• Onesample:– comparethemeanofasampletoapredefinedvalue
• Dependent(related)samples:– comparethemeansoftwocondiEonsinwhichthesame(orcloselymatched)parEcipantsparEcipated
• Independent(unrelated)samples:– comparethemeansoftwogroupsofparEcipants

William Sealy Gosset (1876–1937)
William Gosset again: Student’s t-distribution
HiredbyGuinesstofindacheapwayofmonitoringstoutquality

THEONE-SAMPLET-TEST

The One Sample t test The One-sample t test is used to compare a sample mean to a specific value (e.g., a population parameter; a neutral point on a Likert-type scale, chance performance, etc.).
Examples: 1. A study investigating whether stock brokers differ from the general population on
some rating scale where the mean for the general population is known.
2. An observational study to investigate whether scores differ from chance.
Calculation of t : t =
mean - comparison value
Standard Error

• Thestandarderror(SE)isthestandarddeviaEonofthesamplingdistribuEon:– AnesEmateofthe“error”intheesEmaEonofthepopulaEonmean
• WeusethesamplemeantoesEmatethepopulaEonmean• ThisesEmatemaybemoreorlessaccurate• IfwehavealargenumberofobservaEonsandalloftheseobservaEonsareclosetothesamplemean(largeN,smallSD),wecanbeconfidentthatouresEmateofthepopulaEonmean(i.e.,thatitequalsthesamplemean)isfairlyaccurate=>smallSE
• IfwehaveasmallnumberofobservaEonsandtheyvaryalot(smallN,largeSD),ouresEmateofthepopulaEonislikelytobequiteinaccurate=>largeSE
SE = SDNStandardError

Theone-sampletformula
M:themeanofoursamplethepopulaEonmean(oranyparameterwewanttocompareourmeanto)SD:thesampleStandardDeviaEonN:samplesizeSE:theStandardError
SEXMt −
=

HypothesistesEngwitht• WecandrawasamplingdistribuEonoft-values(theStudentt-
distribuEon)– thisshowsthelikelihoodofeacht-valueifthenullhypothesisistrue– h[p://www.distributome.org/V3/calc/index.html
• ThedistribuEonwillbeaffectedbysamplesize(ormoreprecisely,bydegreesoffreedom)
• Weevaluatethelikelihoodofobtainingourt-valuegiventhet-distribuEon
Degreesoffreedom(df):ThenumberofvaluesthatarefreetovaryifthemeanofthetotalisgivenWithonesample,df=N–1

Assumptions
The one-sample t test requires the following statistical assumptions:
1. Random and Independent sampling.
2. Data are from normally distributed populations. Note: The one-sample t test is generally considered robust against violation of this
assumption once N > 30.

Anexample:Katzetal1990
• SATscoreswithoutreadingthepassage(SATpassage.sav)
• Researchhypothesis:studentsdobe[erthanchance
• Nullhypothesis:studentsperformatchancelevel
• Chance:20(100quesEonswith5choiceseach)
• Runthetest

SPSS Output
degreesoffreedom=N-1
Thevaluetowhichyoucompareyoursamplemean
t=Diffbetweenmeans/StdError

WriEnguptheresultsKatzetal.(1990)presentedstudentswithexamquesEonssimilartothoseontheSAT,whichrequiredthemtoanswer100five-choicemulEple-choicequesEonsaboutapassagethattheyhadpresumablyread.Oneofthegroups(N=28)wasgiventhequesEonswithoutbeingpresentedwiththepassage,buttheywereaskedtoanswerthemanyway.Asecondgroupwasallowedtoreadthepassage,buttheyarenotofinteresttoushere.
IfparEcipantsperformpurelyatrandom,thoseintheNoPassagecondiEonwouldbeexpectedtoget20itemscorrectjustbychance.Ontheotherhand,ifparEcipantsreadthetestitemscarefully,theymightbeabletorejectcertainanswersasunlikelyregardlessofwhatthepassagesaid.Aone-samplettestrevealedthatparEcipantsintheNoPassagecondiEonscoredsignificantlyabovechance(M=46.57,t(27)=20.59,p<.001).Thatis,itispossibletoanswersomeofthequesEonscorrectlywithoutevenasingleglanceatthetexttowhichtheyrefer.

PAIREDSAMPLET-TEST

Repeated Measures Designs
• Also called a within-subject or related or paired design – Entire experiment is conducted “within” each
subject/participant – Each individual participates in each condition
of the experiment • Repeated measurements on dependent
variable

RepeatedMeasuresDesigns
• Why Use This Design: – Don’t have to worry about balancing
individual differences across conditions of the experiment (because all participants are in each condition)
– Require fewer participants – Convenient and efficient – More sensitive

Paired-samplettest
• Meandifference:meandifferencebetweenscoresinthetwocondiEons
• Comparisonvalue:0,becauseweexpectnodifferenceiftheIVmanipulaEonhasnoeffect
• StandardError:standarderrorofthedifferences– i.e.:esEmateofaccuracyofthemeandifferencemeasuredinthe
samplewhenitisusedtoesEmatethemeandifferenceinthepopulaEon
t =
mean difference - comparison value
Standard Error

“Sampling distribution” of mean differences
AdistribuEonofmeandifferencesbetweenscores.
• CentralLimitTheoremRevisited.Wecanplotthemeandifferencebetweentwoscoresofarandomsample.TheplotwillapproachanormaldistribuEon.ItsstandarddeviaEonwillbetheSSofthedeviaEonofeachdifferencescorefromthemeandifferencedividedbyN-1.

StandardErrorofmeandifferences
• IfmeandifferencescanhaveadistribuEon– ThedistribuEonwillhaveaStandardError
11)( 2
−=
−−Σ
=NSS
NMDSD DD
D
NSDSE D
D =

Calculating One-Sample t and Paired-Sample t Statistics
Single Sample t Statistic
NSDSE =
Standard Error of a Sample
SEMt )( µ−
=t Statistic for Single-Sample t Test
11)( 2
−=
−−Σ
=NSS
NMXSD
Standard Deviation of a Sample
Paired Sample t Statistic
D
DD
SEMt )( µ−
=
T Statistic for Paired-Sample t Test I (mean difference divided by SE)
11)( 2
−=
−−Σ
=NSS
NMDSD DD
D
NSDSE D
D =Standard Error of Sample Differences
Standard Deviation of Sample Differences

Paired Sample t Test Example
• We want to know if there is a difference in the salary for the same job in Boise, ID, and LA, CA. The salary of 6 employees in the 25th percentile in the two cities is given.
Profession Boise LosAngeles
ExecuEveChef 53,047 62,490
GeneEcsCounselor 49,958 58,850
GrantsWriter 41,974 49,445
Librarian 44,366 52,263
Schoolteacher 40,470 47,674
SocialWorker 36,963 43,542
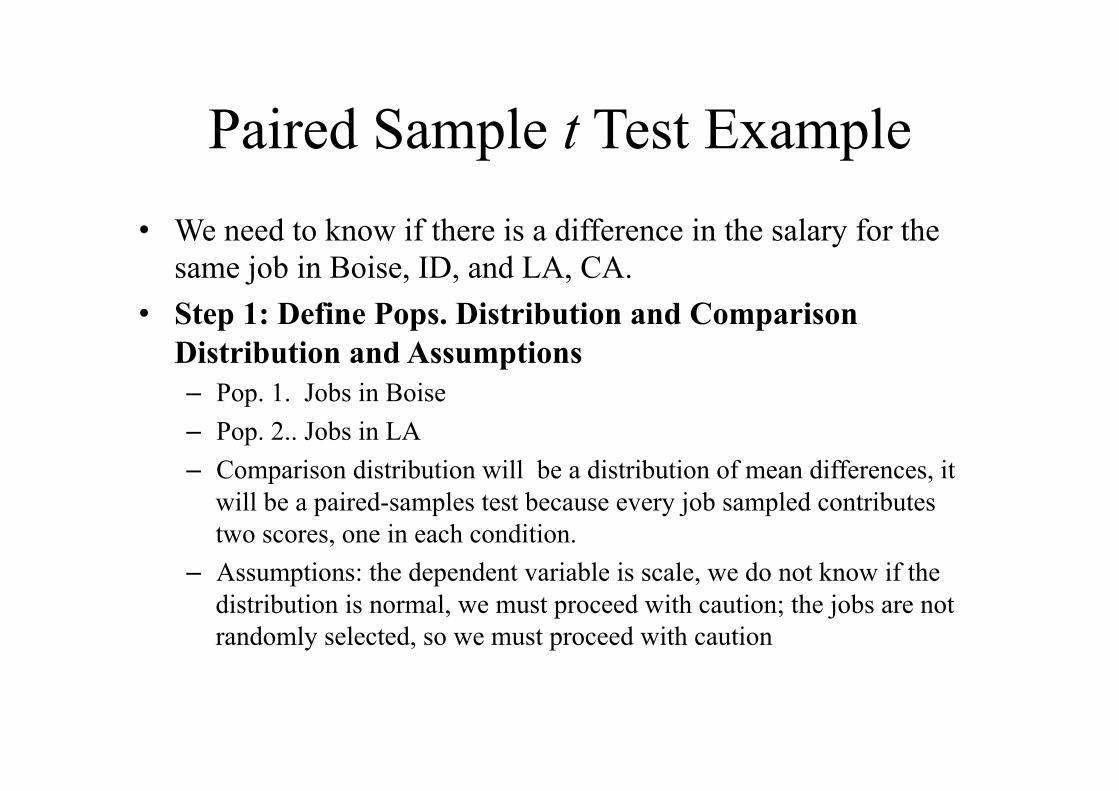
Paired Sample t Test Example • We need to know if there is a difference in the salary for the
same job in Boise, ID, and LA, CA. • Step 1: Define Pops. Distribution and Comparison
Distribution and Assumptions – Pop. 1. Jobs in Boise – Pop. 2.. Jobs in LA – Comparison distribution will be a distribution of mean differences, it
will be a paired-samples test because every job sampled contributes two scores, one in each condition.
– Assumptions: the dependent variable is scale, we do not know if the distribution is normal, we must proceed with caution; the jobs are not randomly selected, so we must proceed with caution

Paired Sample t Test Example • Step 2: Determine the Characteristics of Comparison Distribution
(mean difference, standard deviation of difference, standard error) • M difference = 7914.333 Sum of Squares (SS) = 5,777,187.333
Profession Boise Los Angeles X-Y D(X-Y)-MM=7914.33
D^2
Executive Chef 53,047 62,490 -9,443 -1,528.67 2,336,821.78
Genetic Counselor 49,958 58,850 -8,892 -977.67 955,832.11Grants Writer 41,974 49,445 -7,471 443.33 196,544.44Librarian 44,366 52,263 -7,897 17.33 300.44School teacher 40,470 47,674 -7,204 710.33 504,573.44Social Worker 36,963 43,542 -6,579 1,335.33 1,783,115.11
93.10745
333.186,777,51
==−
=NSSSD D
D 83.438693.1074
===N
SDSE DD

Paired Sample t Test Example • Step 3: Determine Critical Cutoff • df = N-1 = 6-1= 5 • t statistic for 5 df , p < .05, two-tailed, are -2.571 and 2.571 • Step 5: Calculate t Statistic
• Step 6 Decide
04.18333.438
)0333.7914()(=
−=
−=
D
DD
SEMt µ
Effectsizes
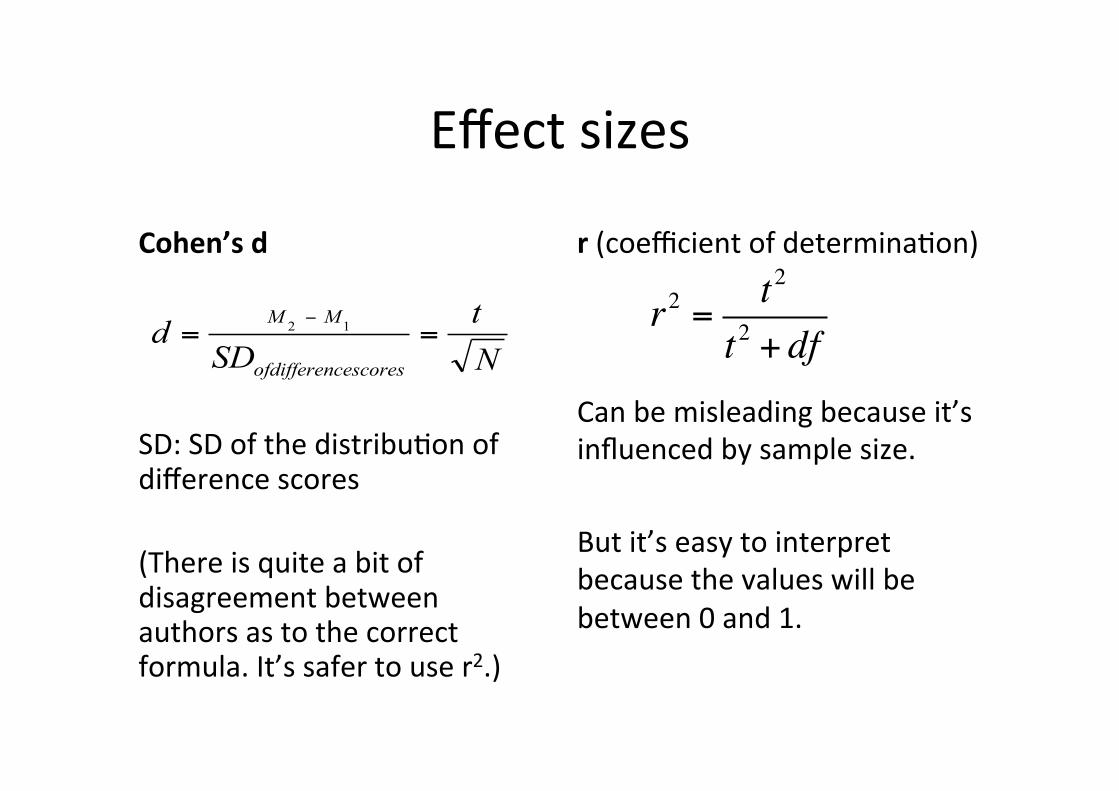
Cohen’sd r(coefficientofdeterminaEon)SD:SDofthedistribuEonofdifferencescores(Thereisquiteabitofdisagreementbetweenauthorsastothecorrectformula.It’ssafertouser2.)
Nt
SDd
cescoresofdifferen
MM==
− 12 r2 = t2
t2 + dfCanbemisleadingbecauseit’sinfluencedbysamplesize.Butit’seasytointerpretbecausethevalueswillbebetween0and1.

Exercise:sel2elpBook.sav
AresearcherisinterestedinassessingtheeffecEvenessofaself-helpbook(“MenarefromMars,WomenarefromVenus”)designedtoincreaserelaEonshiphappiness.500parEcipantsreadboththeself-helpbookandaneutralbook(staEsEcsbook).RelaEonshiphappinessismeasuredaserreadingeachbook.Theorderinwhichthebooksarereadincounterbalancedandthereisasixmonthdelaybetweenthetwo.(sel2elpBook.sav)
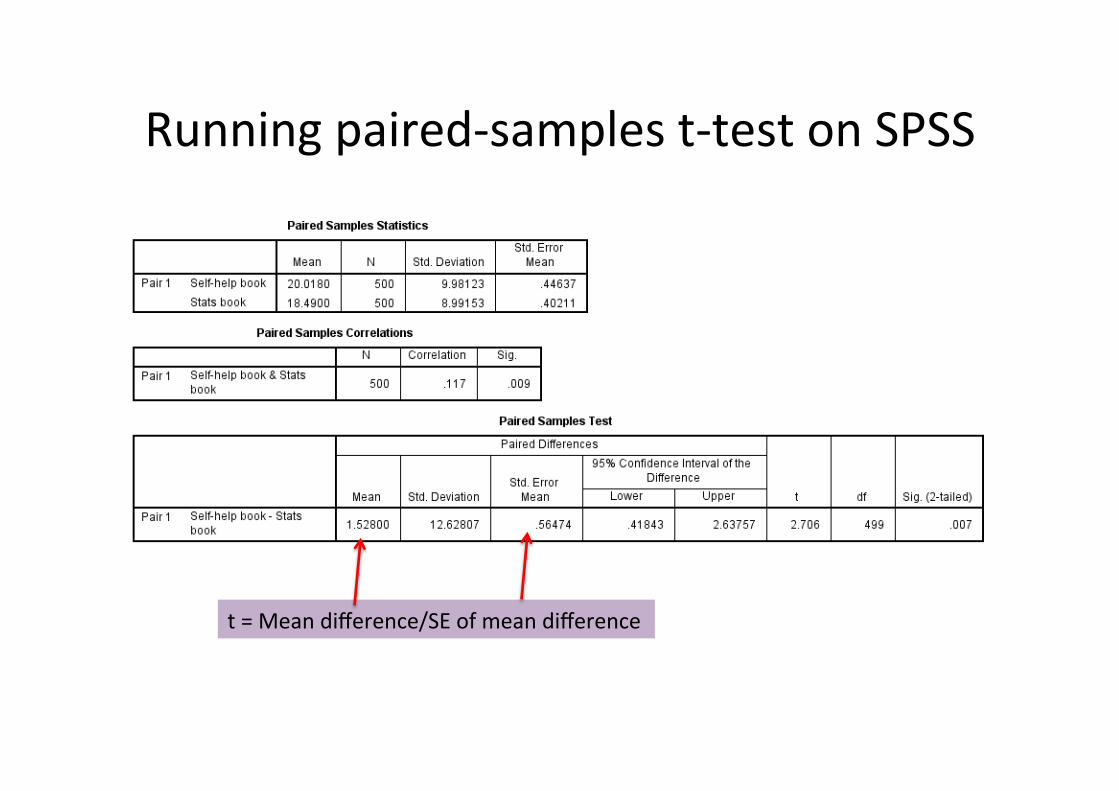
Runningpaired-samplest-testonSPSS
t=Meandifference/SEofmeandifference

ReporEngtheresultsTherelaEonshiphappinessof500parEcipantswasmeasuredaserreadingMenarefromMars,WomenarefromVenusandaserreadingastaEsEcsbook.Onaverage,thereportedrelaEonshiphappinessaserreadingtheself-helpbook(M=20.2,SD=9.98)wassignificantlyhigherthaninthecontrolcondiEon(M=18.49,SD=8.99),t(499)=2.71.p=.007.However,thesmalleffectsizeesEmate(r2=.01)indicatesthatthisdifferencewasnotofpracEcalsignificance.
YoucouldreportSEorconfidenceintervalsinsteadofSD

The Independent Groups t test: Between-subjects designs Participants contributing to the two means come from different groups; therefore, each person contributes only one score to the data.
M2–M1:thedifferencebetweenthemeansofthetwogroupsComparisonvalue:theexpecteddifferencebetweenthetwomeans,
normally0underthenullhypothesisSE:standarderrorofthedistribuEonofdifferencesbetweenmeans
SEvaluecomparisonMMt −−
=)( 12

Independent t Test
Independent t Test • Single observation from each
participant from two independent groups
• The observation from the second group is independent from the first since they come from different subjects.
• Comparing the difference between two means to a distribution of differences between mean scores.
Paired-Sample • Two observations from each
participant • The second observation is
dependent upon the first since they come from the same person.
• Comparing the mean of differences to a distribution of mean difference scores

SamplingdistribuEonofdifferencesbetweenmeans
• TaketwosamplesfromapopulaEon,calculatethedifferencebetweentheirmeans
• Takeanothertwosamples,calculatethedifferencebetweentheirmeans
• DothisafewhundredEmesandthenplotthefrequencydistribuEonofthedifferences:yougetasamplingdistribuEonofdifferencesbetweenmeans
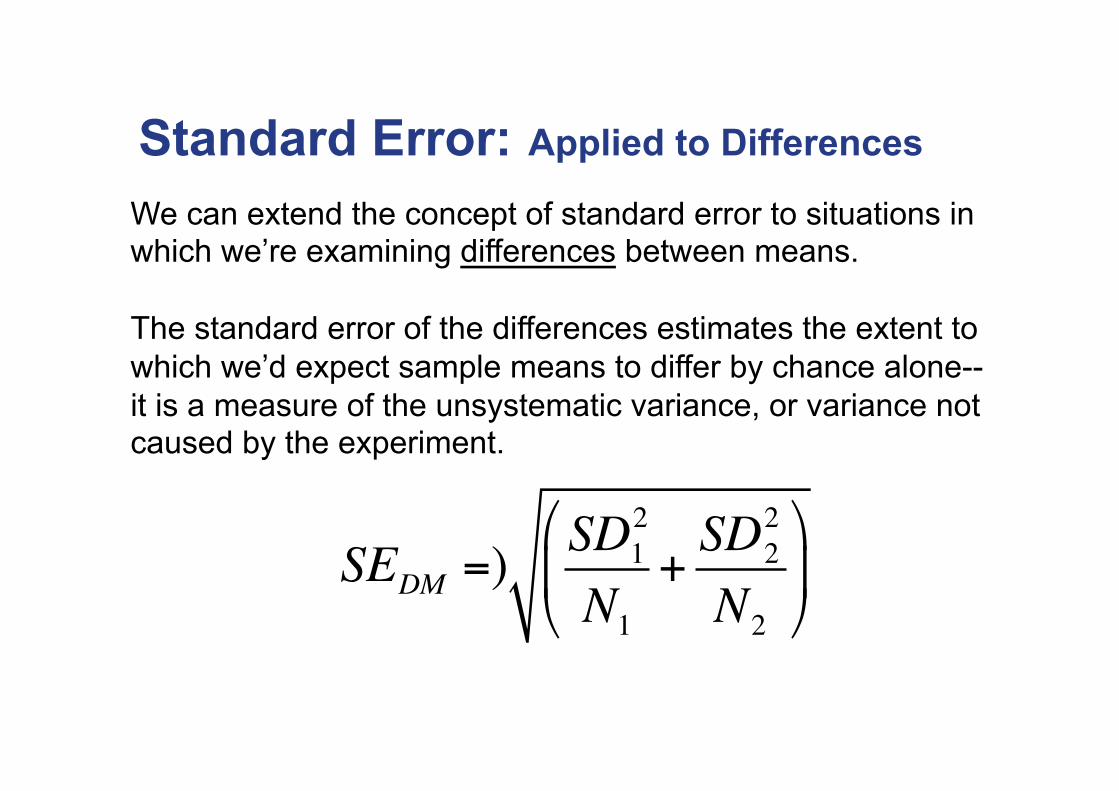
Standard Error: Applied to Differences
We can extend the concept of standard error to situations in which we’re examining differences between means. The standard error of the differences estimates the extent to which we’d expect sample means to differ by chance alone--it is a measure of the unsystematic variance, or variance not caused by the experiment.
SEDM =)SD2
1
N1+SD2
2
N2
⎛
⎝⎜
⎞
⎠⎟

Theformula
2)1()1(
21
2211222
−+
−+−=
NNSDNSDNSDp
2
22
1
21
NSD
NSD pp
MMt+
−=
• Whensamplesizesareequal:
• Whensamplesizesareunequal:
t = M1 −M2
SD21
N1+SD2
2
N2

Equalvariances
• BecauseSEfortheindependentt-testiscalculatedfromthevariancesofthetwogroups,thet-distribuEonisdistortedwhenthetwovariancesareverydifferent.
• TesEngtheequality(homogeneity)ofvariances:Levene’stest(SPSSautomaEcallycalculatesit)– Equalvariancesassumed:whenthevariancesofthetwosetsofscoresareapproximatelyequal
– Equalvariancesnotassumed:whenthetwovariancesarequitedifferent–acorrecEonisappliedtothedf

• Degreesoffreedom:N1–1+N2–1(thedegreesoffreedomofthetwogroupsaddedtogether)

Effectsizesh[p://www.socscistaEsEcs.com/effectsize/Default3.aspx
Cohen’sd r2
2)1()1(
21
221122
−+
−+−=
NNSDNSDNSD
r2 = t2
t2 + df
Canbemisleadingbecauseit’sinfluencedbysamplesize.Butit’seasytointerpretbecausethevalueswillbebetween0and1.
d = M2 −M1
SDpooled
There’ssomedisagreementovertheformulahere.

Example:SATpassage.sav
TheSATperformanceofthegroupofstudentswhodidnotreadthepassagewascomparedtotheperformanceofagroupofstudentswhodidreadthepassage.LookatdistribuEons.Outliers?Drawgraph.

Ploungtheresults

SPSS Output: Independent-Groups t test
LookatLevene’stestfirst:Ifsignificant(p<.05),thevariancesofthetwosamplesarenotequalandacorrecEonmustbeapplied.
Whatwoulditmeaniftheconfidenceintervalincluded0?

Reporting the Results TheSATperformanceofthegroupofstudentswhodidnotreadthepassage(N=28)wascomparedtotheperformanceofagroupofstudentswhodidreadthepassage(N=17).Anindependentsamplesttestrevealedthatthestudentswhoreadthepassagehadsignificantlyhigherscores(M=71.06,SD=11.06)thantheNo-passagegroup(M=46.57,SD=6.83),(t(43)=-9.21,p<.001).Whilepeoplemayshowbe[erthanchanceperformancewithoutreadingthepassage,theirscoreswillnotapproximatethescoresofthosewhoreadthepassage.Thiseffectwasverylarge(Cohen’sd=2.66).
YoucouldreportSEorconfidenceintervalsinsteadofSD
Anoteonproblems
• Ifthedata– Arenotquitenormallydistributedor– Haveoutliers
• ThesimplestsoluEonistousebootstrappedconfidenceintervals– Lookattheconfidenceintervalsofthedifferencebetweenthegroups/condiEons(thisshouldnotinclude0)and
– Theconfidenceintervalsofthemeansofthetwogroups/condiEons(theseshouldnotoverlap)

Homework1:Word_recall.sav• ParEcipantsrecalledwordspresentedwithorwithoutpictures.Theresearchersusedcounterbalancing:eachparEcipantsawwordsbothwithandwithoutpictures.
• RundescripEves,checknormality,checkforoutliers
• Drawgraph• Runappropriatet-test• Calculateeffectsize• Writeuptheresults

Homework2:LuckyCharm.sav• Damishetal(2010):Doesaluckycharmwork?• ParEcipantsbringluckycharmandplayamemorygame:picture
cardsareturnedfacedown,parEcipanthastofindthepairsturningonecardataEme.– Onegrouphastheluckycharmwiththemwhendoingthetest.– Othergrouphastoleavethecharminanotherroom.
• Dependentvariable:howfastparEcipantsfinishedrelaEvetoabaseline(lowscore=be[erperformance)
• Hypothesis?Significancelevel?Tails?DescripEves,outliers,graphs• Runappropriatet-test• Calculateeffectsize• Writeitup


![3. 資料 - Inzai...52 表 10 土地利用(平成23年3月現在) 面積の種類 旧印西市 旧印旛村 旧本埜村 印西市 行政面積 53.51[43] 46.57[38] 23.72[19] 123.8](https://img.dokumen.tips/doc/110x75/60a60a43f27558385b54a05d/3-e-inzai-52-e-10-oeoeci233oecoei-ecce.jpg)