Embed Size (px)
Citation preview

7 th Grade Mathematics (Accelerated)
ORANGE PUBLIC SCHOOLS
OFFICE OF CURRICULUM AND INSTRUCTION
OFFICE OF MATHEMATICS
Scale Drawings and Proportional Relationships
Unit 1 Pacing Calendar - Illustrative Mathematics
Revised: 08/28/2019

From the New Jersey State Learning Standards: Traditional Pathway Accelerated 7th Grade
In Accelerated 7th Grade, instructional time should focus on four critical areas: (1) Rational Numbers and
Exponents; (2) Proportionality and Linear Relationships; (3) Introduction to Sampling Inference; (4) Creating,
Comparing, and Analyzing Geometric Figures
1. Students develop a unified understanding of number, recognizing fractions, decimals (that have a finite or
a repeating decimal representation), and percents as different representations of rational numbers.
Students extend addition, subtraction, multiplication, and division to all rational numbers, maintaining the
properties of operations and the relationships between addition and subtraction, and multiplication and
division. By applying these properties, and by viewing negative numbers in terms of everyday contexts (e.g.,
amounts owed or temperatures below zero), students explain and interpret the rules for adding,
subtracting, multiplying, and dividing with negative numbers. They use the arithmetic of rational numbers as
they formulate expressions and equations in one variable and use these equations to solve problems. They
extend their mastery of the properties of operations to develop an understanding of integer exponents, and
to work with numbers written in scientific notation.
2. Students use linear equations and systems of linear equations to represent, analyze, and solve a variety of
problems. Students recognize equations for proportions (y/x = m or y = mx) as special linear equations ( y=
mx + b), understanding that the constant of proportionality (m) is the slope, and the graphs are lines
through the origin. They understand that the slope (m) of a line is a constant rate of change, so that if the
input or x‐coordinate changes by an amount A, the output or y‐coordinate changes by the amount m×A.
Students strategically choose and efficiently implement procedures to solve linear equations in one
variable, understanding that when they use the properties of equality and the concept of logical
equivalence, they maintain the solutions of the original equation.
3. Students build on their previous work with single data distributions to compare two data distributions and
address questions about differences between populations. They begin informal work with random
sampling to generate data sets and learn about the importance of representative samples for drawing
inferences
4. Students continue their work with area from Grade 6, solving problems involving the area and
circumference of a circle and surface area of three‐dimensional objects. In preparation for work on
congruence and similarity, they reason about relationships among two‐dimensional figures using scale
drawings and informal geometric constructions, and they gain familiarity with the relationships between
angles formed by intersecting lines. Students work with three‐dimensional figures, relating them to
two‐dimensional figures by examining cross sections. They solve real‐ world and mathematical problems
involving area, surface area, and volume of two‐ and three‐dimensional objects composed of triangles,
quadrilaterals, polygons, cubes and right prisms. Students use ideas about distance and angles, how they
behave under translations, rotations, reflections, and dilations, and ideas about congruence and similarity to
describe and analyze two‐dimensional figures and to solve problems. Students show that the sum of the
angles in a triangle is the angle formed by a straight line, and that various configurations of lines give rise to
similar triangles because of the angles created when a transversal cuts parallel lines. Students complete
their work on volume by solving problems involving cones, cylinders, and spheres.

Major Work Supporting Content Additional Content

Table of Contents
I. Unit Overview p. 1
II. Pacing Guide p. 2
III. Scope and Sequence p. 3-4
IV. Pacing Calendar p. 5-6
V. PARCC Assessment Evidence Statement p. 7
VI. Differentiated Instruction p. 8
VII. Vocabulary p. 9
VIII. Assessment Framework p. 10
IX. Performance Tasks p. 11-14
X. 21st Century Career Ready Practices p. 15
XI. References p. 16

Accelerated 7th Grade Unit 1: Scaled Drawings and Proportional Relationships
1
I. Unit Overview
In this unit, students learn to understand and use the terms “scaled copy,” “to scale,” “scale
factor,” “scale drawing,” and “scale,” and recognize when two pictures or plane figures are or
are not scaled copies of each other. They use tables to reason about measurements in scaled
copies, and recognize that angle measures are preserved in scaled copies, but lengths are
scaled by a scale factor and areas by the square of the scale factor. They make, interpret, and
reason about scale drawings. These include maps and floor plans that have scales with and
without units.
Additionally, students learn to understand and use the terms “proportional,” “constant of
proportionality,” and “proportional relationship,” and recognize when a relationship is or is not
proportional. They represent proportional relationships with tables, equations, and graphs.
Students use these terms and representations in reasoning about situations that involve
constant speed, unit pricing, and measurement conversions.

Accelerated 7th Grade Unit 1: Scaled Drawings and Proportional Relationships
2
II. Pacing Guide
Activity New Jersey State
Learning Standards (NJSLS)
Estimated Time
(Blocks)
Lesson 1: What are Scaled Copies? 7.G.A.1 1
Lesson 2: Making Scaled Copies 7.G.A.1 1
Lesson 3: The Size of the Scale Factor 7.G.A.1 1
Lesson 4: Scaling and Area 7.G.A.1, 7.G.B.6 1
Lesson 5: Scale Drawings and Maps 7.G.A.1 1
Lesson 6: Changing Scales 7.G.A.1 1
Lesson 7: Scales without Units 7.G.A.1 1
Lesson 8: Units in Scale Drawings 7.G.A.1 1
Lesson 9: Introducing Proportional Relationships with Tables 7.RP.A.2.a, 7.RP.A.2.b, 7.RP.A.2
1
Lesson 10: More About Constant of Proportionality 7.RP.A.2.a, 7.RP.A.2.b, 7.RP.A.2
1
Lesson 11: Proportional Relationships and Equations 7.RP.A.2.b, 7.RP.A.2.c, 7.RP.A.2
1
Lesson 12: Using Equations to Solve Problems 7.RP.A.2.c, 7.RP.A.2 1
Lesson 13: Comparing Relationships with Tables 7.RP.A.2 1
Lesson 14: Comparing Relationships with Equations 7.G.B.6, 7.RP.A.1, 7.RP.A.2
1
Lesson 15: Solving Problems about Proportional Relationships 7.RP.A.2 1
Lesson 16: Interpreting Graphs of Proportional Relationships 7.RP.A.2.a, 7.RP.A.2.d, 7.RP.A.2
1
Lesson 17: Using Graphs to Compare Relationships 7.RP.A.2 1
Lesson 18: Two Graphs for Each Relationship 7.RP.A.2 1
Performance Task 1 7.G.A.1 ½
Total Time 18 ½ Blocks
Major Work Supporting Content Additional Content

Accelerated 7th Grade Unit 1: Scaled Drawings and Proportional Relationships
3
III. Scope & Sequence Accelerated Unit Lesson
Accelerated Lesson Name Original
Unit Lesson Activity Name
1.1 What are Scaled Copies?
7.1.1 Printing Portraits
7.1.1 Scaling F 7.1.1 Pairs of Scaled Polygons
7.1.2 Corresponding Parts
7.1.2 Scaled Triangles
7.1.2 Comparing Polygons ABCD and PQRS
1.2 Making Scaled Copies
7.1.3 More or Less?
7.1.3 Which Operations? (Part 1)
7.1.3 Which Operations? (Part 2)
7.1.3 More Scaled Copies
7.1.4 Three Quadrilaterals (Part 1)
7.1.4 Three Quadrilaterals (Part 2)
7.1.4 Scaled or Not Scaled?
7.1.4 Comparing Pictures of Birds
1.3 The Size of the Scale Factor
7.1.5 Number Talk: Missing Factor
7.1.5 Scaled Copies Card Sort
7.1.5 Missing Figure, Factor, or Copy
7.1.5 Scaling a Rectangle
1.4 Scaling and Area
7.1.6 Scaling a Pattern Block
7.1.6 Scaling More Pattern Blocks
7.1.6 Area of Scaled Parallelograms and Triangles
7.1.6 Enlarged Areas
1.5 Scale Drawings and Maps
7.1.7 What is a Scale Drawing?
7.1.7 Sizing Up a Basketball Court
7.1.7 Tall Structures
7.1.7 Length of a Bus and Width of a Lake
7.1.8 Driving on I-90
7.1.8 Biking Through Kansas
1.6 Changing Scales
7.1.9 Two Maps of Utah
7.1.10 Appropriate Measurements
7.1.10 Same Plot, Different Drawings
7.1.10 A New Drawing of the Playground
1.7 Scales Without Units
7.1.11 One to One Hundred
7.1.11 Apollo Lunar Module
7.1.11 Same Drawing, Different Scales
7.1.11 Scaled Courtyard Drawings
1.8 Units in Scale Drawings
7.1.12 Centimeters in a Mile
7.1.12 Scales Card Sort
7.1.12 The World’s Largest Flag (optional)
7.1.12 Pondering Pools (optional)
7.1.12 Drawing the Backyard
1.9 Introducing Proportional Relationships with Tables
7.2.2 Notice & Wonder: Paper Towels by the Case
7.2.2 Feeding a Crowd
7.2.2 Making Bread Dough
7.2.2 Quarters and Dimes
7.2.2 Green Paint

Accelerated 7th Grade Unit 1: Scaled Drawings and Proportional Relationships
4
1.10 More About Constant of Proportionality
7.2.3 Equal Measures
7.2.3 Centimeters and Millimeters
7.2.3 Pittsburgh to Phoenix
7.2.3 Fish Tank
1.11 Proportional Relationships and Equations
7.2.4 Feeding a Crowd, Revisited
7.2.4 Denver to Chicago
7.2.5 Meters and Centimeters
7.2.5 Filling a Water Cooler
1.12 Using Equations to Solve Problems
7.2.6 Number Talk: Quotients with Decimal Points
7.2.6 Concert Ticket Sales
7.2.6 Recycling
7.2.6 Granola
1.13 Comparing Relationships with Tables
7.2.7 Adjusting a Recipe
7.2.7 Visiting the State Park
7.2.7 Running Laps
7.2.7 Apples and Pizza
1.14 Comparing Relationships with Equations
7.2.8 Notice & Wonder: Patterns with Rectangles
7.2.8 More Conversions
7.2.8 Total Edge Length, Surface Area, & Volume
7.2.8 All Kinds of Equations
7.2.8 Tables and Chairs
1.15 Solving Problems about Proportional Relationships
7.2.9 What Do You Want to Know?
7.2.9 Info Gap: Biking and Rain
7.2.9 Moderating Comments
7.2.9 Steel Beams
1.16 Interpreting Graphs of Proportional Relationships
7.2.10 Notice These Points
7.2.10 T-shirts for Sale
7.2.10 Matching Tables and Graphs
7.2.11 What Could the Graph Represent?
7.2.11 Seagulls Eat What?
1.17 Using Graphs to Compare Relationships
7.2.12 Number Talk: Fraction Multiplication & Division
7.2.12 Race to the Bumper Cars
7.2.12 Space Rocks and the Price of Rope
7.2.12 Revisiting the Amusement Park
1.18 Two Graphs for Each Relationship
7.2.13 True or False? Fractions and Decimals
7.2.13 Tables, Graphs, and Equations
7.2.13 Hot Dog Eating Contest
7.2.13 Spicy Popcorn

Accelerated 7th Grade Unit 1: Scaled Drawings and Proportional Relationships
5
III. Pacing Calendar
Please complete the pacing calendar based on the suggested pacing (see Pacing Guide on page 2).
SEPTEMBER Sunday Monday Tuesday Wednesday Thursday Friday Saturday
1 2 3 4 5 6 7
8 9 10
11 12 13 14
15 16 17 18 19 20 21
22 23 24 25
26 27 28
29 30

Accelerated 7th Grade Unit 1: Scaled Drawings and Proportional Relationships
6
Please complete the pacing calendar based on the suggested pacing (see Pacing Guide on page 2).
OCTOBER Sunday Monday Tuesday Wednesday Thursday Friday Saturday
1 2 3 4
5
6 7 8 9 10 11 12
13 14
15
16 17 18 19
20
21 22 23 24 25
26
27
28 29 30
31

Accelerated 7th Grade Unit 1: Scaled Drawings and Proportional Relationships
7
IV. PARCC Assessment Evidence Statements Type I Type II Type III
NJSLS Evidence Statement Clarification Math
Practices
Calculator
?
7.G.1 Solve problems involving scale drawings of geometric figures, including computing actual lengths and areas from a scale drawing and reproducing a scale drawing at a different scale.
i) Tasks may or may not have context
MP.2 MP.5
No
7.G.6 Solve real-world and mathematical problems involving area, volume, and surface area of two- and three-dimensional objects composed of triangles, quadrilaterals, polygons, cubes, and right prisms.
i) Tasks may or may not have context
MP.2 MP.5
No
7.RP.2a Recognize and represent proportional relationships between quantities: a. Decide whether two quantities are in a proportional relationship, e.g., by testing for equivalent ratios in a table or graphing on a coordinate plane and observing whether the graph is a straight line through the origin.
i) Tasks have “thin context”2 or no context. ii) Tasks are not limited to ratios of whole numbers. iii) Tasks use only coordinates in Quadrant 1 and use only a positive constant of proportionality.
MP.2 MP.5
Yes
7.RP.2b Recognize and represent proportional relationships between quantities: b. Identify the constant of proportionality (unit rate) in tables, graphs, equations, diagrams, and verbal descriptions of proportional relationships.
i) Tasks may or may not have a context. ii) Tasks sample equally across the listed representations (graphs, equations, diagrams, and verbal descriptions). iii) Tasks use only coordinates in Quadrant 1 and use only a positive constant of proportionality.
MP.2 MP.5 MP.8
No
7.D.2 Solve multi-step contextual problems with degree of difficulty appropriate to grade 7, requiring application of knowledge and skills articulated in 6.RP.A, 6.EE.C, 6.G.
i) Tasks may have scaffolding, if necessary, in order to yield a degree of difficulty appropriate to grade 7.
MP.1 MP.2 MP.4 MP.5 MP.7
Yes
7.C.6.1 Construct, autonomously, chains of reasoning that will justify or refute propositions or conjectures. Content Scope: Knowledge and skills articulated in 7.RP.2
i) Tasks use only coordinates in Quadrant 1 and use only a positive constant of proportionality.
MP.2 MP.3 MP.6
Yes

Accelerated 7th Grade Unit 1: Scaled Drawings and Proportional Relationships
8
V. Differentiated Instruction
Supporting English Language Learners
The purpose of this document is to nudge the field forward by offering support to the next generation of
mathematics learners and by challenging persistent assumptions about how to support and develop students’
disciplinary language. The goal is to provide guidance to mathematics teachers for recognizing and supporting
students’ language development processes in the context of mathematical sense making. UL/SCALE provides a
framework for organizing strategies and special considerations to support students in learning mathematics
practices, content, and language. The framework is intended to help teachers address the specialized
academic language demands in math when planning and delivering lessons, including the demands of reading,
writing, speaking, listening, conversing, and representing in math (Aguirre & Bunch, 2012). Therefore, while
the framework can and should be used to support all students learning mathematics, it is particularly well-
suited to meet the needs of linguistically and culturally diverse students who are simultaneously learning
mathematics while acquiring English.
For more information, click the link below:
Supporting ELL Learners
Supporting Students with Disabilities
The philosophical stance that guided the creation of these materials is the belief that with proper structures,
accommodations, and supports, all children can learn mathematics. Lessons are designed to maximize access
for all students and include additional suggested supports to meet the varying needs of individual students.
While the suggested supports are designed for students with disabilities, they are also appropriate for many
children who struggle to access rigorous, grade-level content. Teachers should use their professional judgment
about which supports to use and when, based on their knowledge of the individual needs of students in their
classroom.
For more information, click the link below:
Supporting Students with Disabilities
Accelerated 7th Grade Unit 1: Scaled Drawings and Proportional Relationships
9
VI. Vocabulary
Corresponding: If a part of the original figure matches up with a part of the copy, we call
them corresponding parts. The part could be an angle, point, or side, and you can have corresponding angles, corresponding points, or corresponding sides. If you have a distance between two points in the original figure, then the distance between the corresponding points in the copy is called the corresponding distance.
Constant of
Proportionality
See proportional relationship.
Origin In the coordinate plane, the origin is the point (0,0).
Proportional
Relationship
If there is a positive constant k so that the quantities x and y are related by
the equation y=kx, then we say that y and x are in a proportional
relationship, and that y is proportional to x. The constant k is called the
constant of proportionality.
Scaled Copy: Scaled copy of a figure is a figure in which every length in the original figure
is increased or decreased by the same scale factor.
Scale Drawing: A scale drawing of an object is a drawing in which all lengths in the drawing
correspond to lengths in the object by the same scale. The scale tells you
how the lengths correspond; for example, a scale of "1 inch to 2 feet" means
that 1 inch in the drawing represents 2 feet in the object.
Scale Factor: Scale factor is the factor by which every length in an original figure is
increased or decreased when you make a scaled copy. For example, if you
draw a copy of a figure in which every length is magnified by 2, then you
have a scaled copy with a scale factor of 2.

Accelerated 7th Grade Unit 1: Scaled Drawings and Proportional Relationships
10
VII. Assessment Framework
Unit 1 Assessment Framework
Assessment NJSLS Estimated Time
Format Graded ?
Pre-Unit 1 Diagnostic Assessment
(Beginning of Unit – Optional) Illustrative Mathematics
4.MD.A.1, 5.MD.A.1, 5.NF.B.5.a, 6.G.A.1, 6.EE.A.2.c, 6.RP.A.3.a, 7.G.A.1
½ Block Individual Yes (No Weight)
End-of-Unit 1 Assessment (End of Unit – Optional) Illustrative Mathematics
7.G.A.1, 7.RP.A.2.a 1 Block Individual Yes
Pre-Unit 2 Diagnostic Assessment
(Beginning of Unit – Optional) Illustrative Mathematics
6.RP.A.1,6.RP.A.3.a, 6.RP.A.2,6.RP.A.3.b, 6.RP.A.3,
½ Block Individual Yes (No Weight)
End-of-Unit 2 Assessment (End of Unit – Optional) Illustrative Mathematics
7.RP.A.2a,
7.RP.A.2d,7.RP.A.2c,
7.RP.A.2b, 7.RP.A.2
1 Block Individual Yes
Unit 1 Performance Assessment Framework
Assessment NJSLS Estimated Time
Format Graded ?
Unit 1 Performance Task 1 (Early October) Map Distance
7.G.A.1 ½ Block Individual Yes; Rubric
Unit 1 Performance Task Option 1
(Optional) Buy Coffee
7.RP.A.2 Teacher Discretion
Teacher Discretion
Yes, if administered
Accelerated 7th Grade Unit 1: Scaled Drawings and Proportional Relationships
11
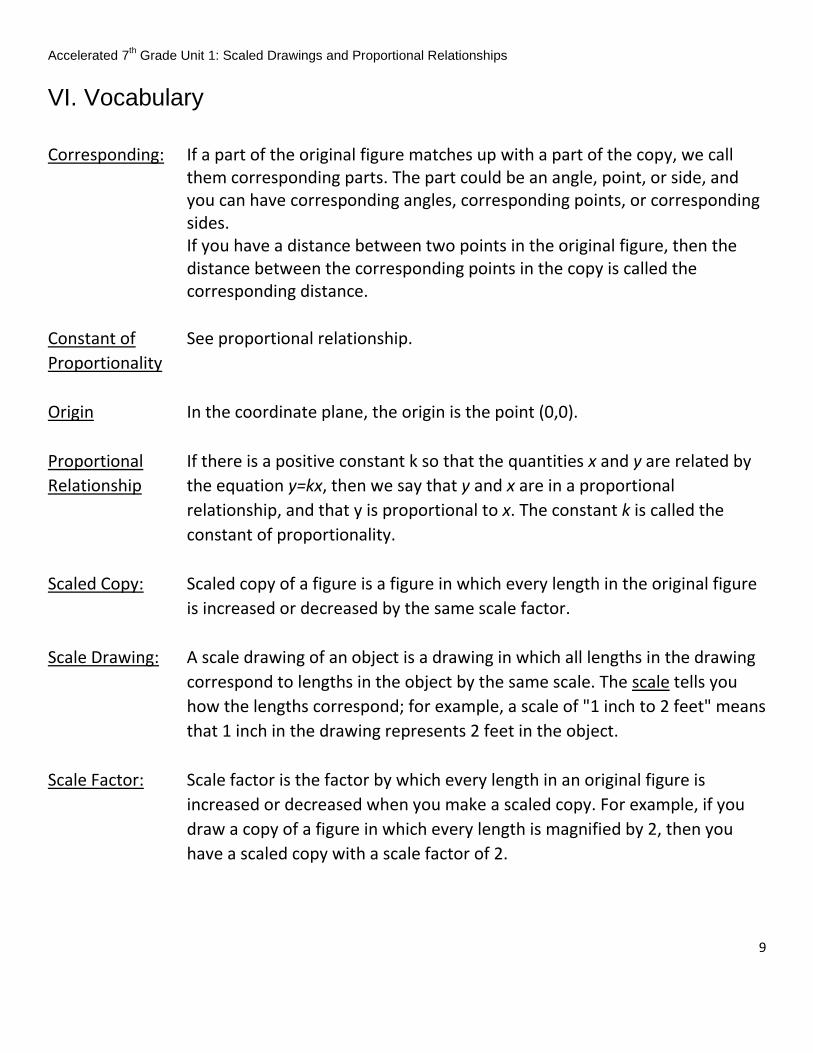
Name ________________________ Block ______ Date __________
Map Distance (7.G.A.1)
On the map below, ¼ inch represents one mile. Candler, Candor, and Oteen are three cities on the map.
a. If the distance between the real towns of Candler and Canton is 9 miles, how far apart are Canton and Candler on the map?
b. If Candler and Oteen are 3½ inches apart on the map, what is the actual distance between Candler and Oteen in miles?
Accelerated 7th Grade: Unit 1 Performance Task
12
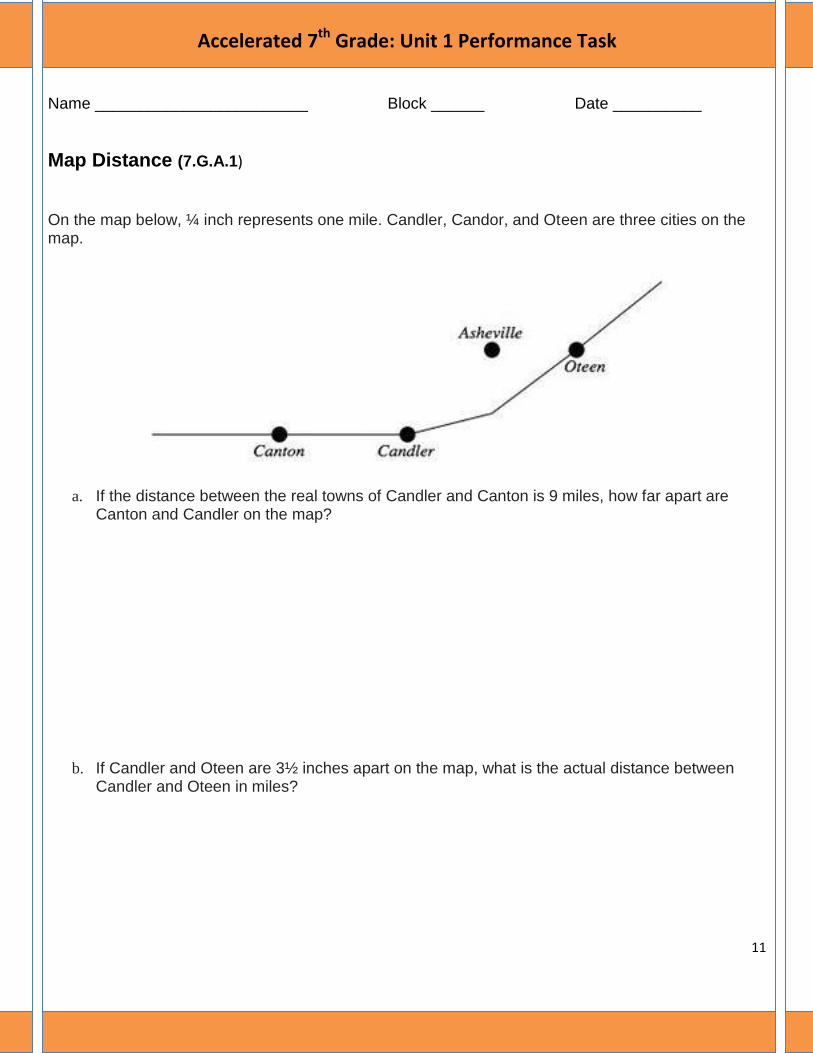
7th Grade Map Distance – Rubric Name: ___________________ Date: ___________
NJSLS: 7.G.A.1 Type: ___________ Teacher: ___________________
Task Description
Clearly constructs and communicates a complete response based on concrete referents provided in the prompt or constructed by the student such as diagrams that are connected to a written (symbolic) method, number line diagrams or coordinate plane diagrams.
Clearly constructs and communicates a complete response by using a logical approach based on a conjecture and/or stated assumptions providing an efficient and logical progression of steps using grade-level vocabulary, symbols, and labels providing a justification of a conclusion with minor computational error evaluating, interpreting and critiquing the validity and efficiency of others’ responses
Command Level
Description
Level 5:
Distinguished Command
Perform the task items
accurately or with minor
computation errors.
Level 4:
Strong Command
Perform the task items
with
some non-conceptual
errors
Level 3:
Moderate Command
Perform the task items
with minor conceptual
errors and some
computation errors.
Level 2:
Partial Command
Perform the task items
with some errors on
both math concept and
computation.
Level 1:
Perform the task items
with serious errors on
both math concept and
computation.
Score range 5 pts 4 pts 3 pts 2 pts 0-1 pt
Task Score &
PLD Assigned

Accelerated 7th Grade Unit 1: Scaled Drawings and Proportional Relationships
13
7th Grade Map Distance – Scoring Guide NAME: ___________________
# Answer Scoring
Part A **** Solutions may vary ***
A distance of nine miles means 9 quarter inches on the map. This is
9 × ¼ = 9/4
Or 2¼ inches between Candler and Canton on the map.
2 points: 1 point for the correct strategy and 1 point for an accurate explanation 2 TOTAL POINTS
Part B To find this, we divide: 3 ½ ÷ ¼ = 7/2 × 4/1 = 14 So, there are 14 miles between Chandler and Oteen.
2 points: for correctly dividing the fractions. OR 1 point: for identifying the necessary expression with minor mistakes. 1 point for correct explanation. 3 TOTAL POINTS

Accelerated 7th Grade Unit 1: Scaled Drawings and Proportional Relationships
14
Name ________________________ Block ______ Date __________
Buying Coffee (7.RP.A.2)
Coffee costs $18.96 for 3 pounds.
1. What is the cost for one pound of coffee?
2. At this store, the price for a pound of coffee is the same no matter how many pounds you buy. Let x be the number of pounds of coffee and y be the total cost of x pounds. Draw a graph of the relationship between the number of pounds of coffee and the total cost.
3. Where can you see the cost per pound of coffee in the graph? What is it?
Accelerated 7th Grade: Unit 1 Performance Task Option 1

Accelerated 7th Grade Unit 1: Scaled Drawings and Proportional Relationships
15
IX. 21st Century Career Ready Practices CRP1. Act as a responsible and contributing citizen and employee.
CRP2. Apply appropriate academic and technical skills.
CRP3. Attend to personal health and financial well-being.
CRP4. Communicate clearly and effectively and with reason.
CRP5. Consider the environmental, social and economic impacts of decisions.
CRP6. Demonstrate creativity and innovation.
CRP7. Employ valid and reliable research strategies.
CRP8. Utilize critical thinking to make sense of problems and persevere in solving them.
CRP9. Model integrity, ethical leadership and effective management.
CRP10. Plan education and career paths aligned to personal goals.
CRP11. Use technology to enhance productivity.
CRP12. Work productively in teams while using cultural global competence.
For additional details see 21st Century Career Ready Practices .

Accelerated 7th Grade Unit 1: Scaled Drawings and Proportional Relationships
16
References
“Illustrative Mathematics” Open Up Resources. 2018
<https://auth.openupresources.org/register/complete>