Embed Size (px)
Citation preview

ICES AFWG REPORT 2016 | 433
7 Golden redfish (Sebastes norvegicus) in Subareas 1 and 2
Multiyear advice
Following a three year advice cycle, (covering advice for 20142016) this stock is now
due for a new update assessment. This is presented here.
7.1 Status of the Fisheries
7.1.1 Recent regulations of the fishery
A description of the historical development of the fishery and regulations is found in
the Stock Annex for this stock. The Stock Annex was last updated in February 2012.
Prior to 1 January 2003 there were no regulations particularly for the S. norvegicus fish-
ery, and the regulations aimed at S. mentella had only marginal effects on the S. norvegi-
cus stock. After this date, all directed trawl fishery for redfish (both S. norvegicus and S.
mentella) outside the permanently closed areas were forbidden in the Norwegian Eco-
nomic Zone north of 62°N and in the Svalbard area. When fishing for other species it
was legal to have up to 15% redfish (both species together) in round weight as bycatch
per haul and on board at any time. Until 14 April 2004 there were no regulations of the
other gears/fleets fishing for S. norvegicus. After this date, a minimum legal catch size
of 32 cm has been set for all fisheries, with the allowance to have up to 10% undersized
(i.e. less than 32 cm) specimens of S. norvegicus (in numbers) per haul. In addition, a
time-limited moratorium (up to 8 months) was enforced in the conventional fisheries
(gillnet, longline, handline, Danish seine) except for handline vessels less than 11 me-
ters. Since 2015 all directed fisheries with conventional gears have been forbidden (ex-
cept for the smaller handline vessels), and from 2016 trawling outside 12 nm is allowed
to have up to 20% by weight of redfish in each catch and upon landing. When trawling
inside 12 nm, it is permitted to have up to 10% bycatch. It is generally prohibited to
fish for redfish with conventional gears north of 62 ° N. The ban does not, however,
apply to vessels less than 15 meters fishing with handline during1 June - 31 August.
When fishing with conventional gears for other species, it is permitted to have up to
10% by weight of redfish. Vessels less than 21 meters can still have up to 30% by weight
of redfish in the period 1 August to 31 December. Bycatch of redfish is calculated in
live weight per week.
7.1.2 Landings prior to 2016 (Tables 7.1–7.4, D1 & D2, Figures 7.1-7.2)
Nominal catches of S. norvegicus by country for Sub-areas 1 and 2 combined, and for
each Sub-area and Division are presented in Tables 7.1—7.4. The total landings for both
S. norvegicus and S. mentella are presented in Tables D1 and D2 (see Section 6). Landings
of S. norvegicus showed a decrease from a level of 23 000—30 000 t in 1984—1990 to a
stable level of about 16 000—19 000 t in the years 1991—1999. Since then the landings
have decreased further, and the total landings figures for S. norvegicus in 2003—2013
have been low but remarkably stable between 5500—8000 t. In 2014 the landings de-
creased to 4436 t, followed by a further decrease in 2015 with landings of 3633 t, mainly
due to stronger regulations. The time-series of S. norvegicus landings is given in Figure
7.1.
The Norwegian landings are presented by gear and month/year in Figures 7.2a,b. Re-
ported landings continued to decrease in 2015 and are now at the lowest level since the

434 | ICES AFWG REPORT 2016
World War II. Since 2015 only bycatches of S. norvegicus are allowed except for a lim-
ited amount caught by vessels less than 15 meters fishing with handline during 1 June-
31 August.
The reported Russian catches of S. norvegicus have been around 600900 t since 2001,
while ten other countries together usually report catches of about or less than 300500 t
per year (Table 7.1). The bycatch of redfish (Sebastes spp.) in the Norwegian Barents Sea
shrimp fisheries during 19832015 were completely dominated by S. mentella, and hence
influenced the S. norvegicus to a much lesser extent. However, these bycatches probably
inflicted an extra mortality on S. norvegicus in the coastal areas before the sorting grid
was enforced in 1990. From 1 January 2006, the maximum legal bycatch of redfish ju-
veniles in the international shrimp fisheries in the northeast Arctic has been reduced
from ten to three redfish per 10 kg shrimp.
Information describing the splitting of the redfish landings by species and area is given
in the Stock Annex.
7.1.3 Expected landings in 2016
New regulations have been designed and implemented in the Norwegian coastal fish-
eries with conventional gears this year. No directed fishery will be allowed, but the
bycatch-regulations are currently rather liberal with vessels less than 21 meters being
allowed to have up to 30% by weight of redfish in the period 1 August31 December,
and calculated in live weight per week. No further reduction in the catches is hence
expected. Based on reports from the three first months of the year, and a legal bycatch
in all trawl fisheries that also in 2016 will be 20% outside 12 nautical miles, the total
landings in 2016 are expected to be about the same as in 2015, i.e. about 3500 t.
7.2 Data Used in the Assessment (Table 0.1 and Figure E2)
An overview of the sampling levels (by season, area and gear) of the data used in the
assessment is presented in Figure E2 for 2013. Although Table 0.1 (see Section 0) shows
a reasonably good total sampling level for this stock, the number of different boats
sampled and the gear and area coverage should be improved.
7.2.1 Catch at length and age (Table 7.5)
Age composition data for 2015 were only provided by Norway, accounting for 70% of
the total landings. Other countries were assumed to have the same relative age distri-
bution and mean weight as Norway. The updated catch in numbers-at-age matrix is
shown in Table 7.5. Catch at length data were available from Norway in 2015 (Figure
7.3).
7.2.2 Catch weight at Age (Table 7.6)
Weight-at-age data for ages 7–24+ were available from the Norwegian landings in 2015,
and revised for 2014. Variations in the weight-at-age of young individuals (<10 years)
must be considered with caution as these numbers are derived from only a small num-
ber of aged individuals.
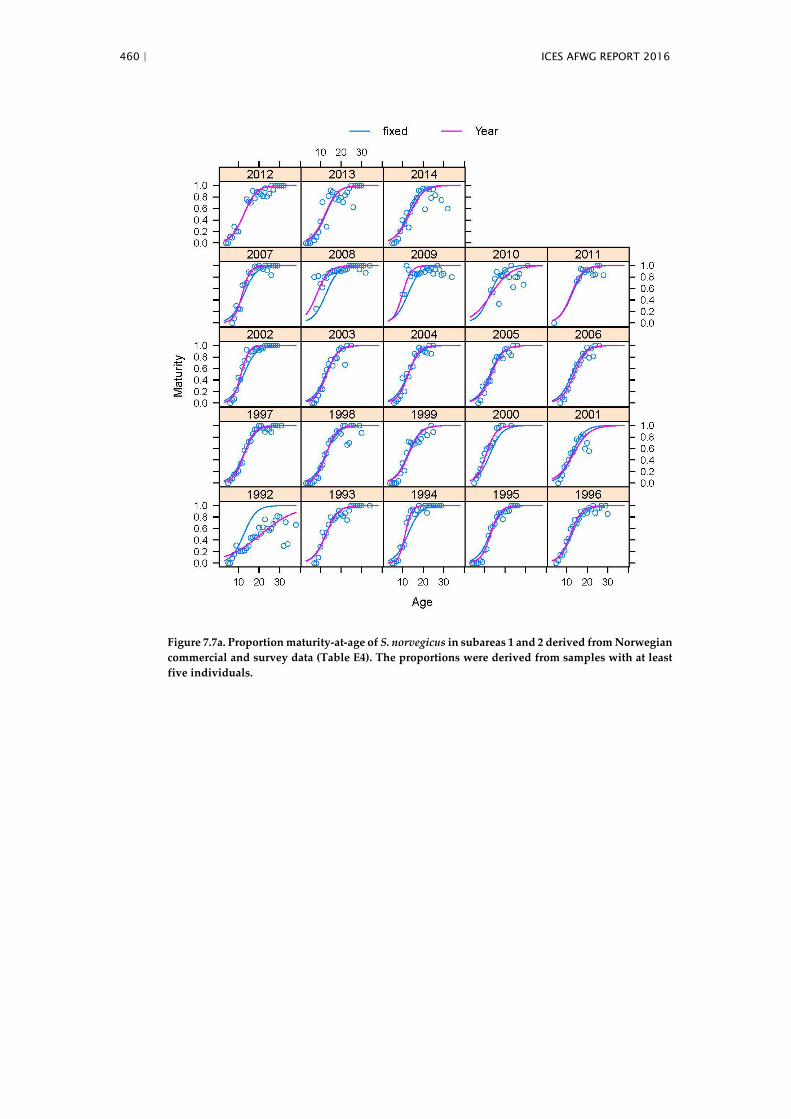
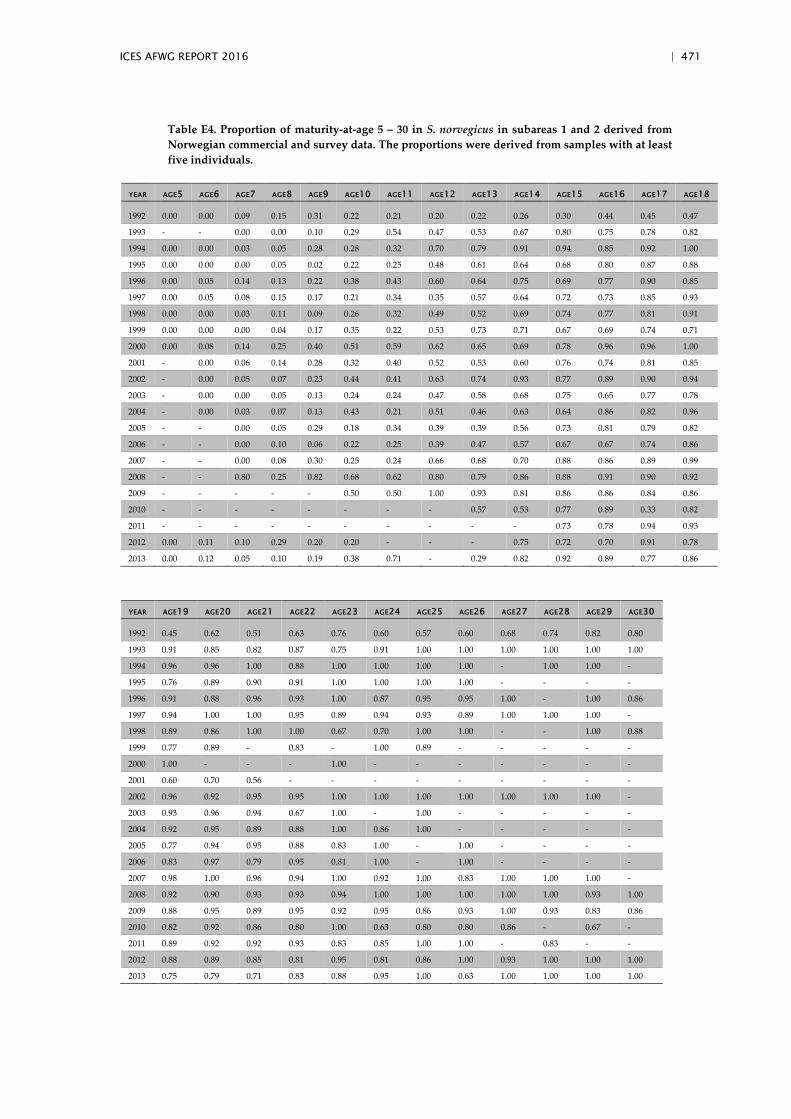
7.2.3 Maturity-at-age (Table E4, Figure 7.7a-b)
A maturity ogive has previously not been available for S. norvegicus, and knife-edge
maturity-at-age 15 (age 15 as 100% mature) had hence been assumed. Maturity-at-age
and length is available from Norwegian surveys and landings, as reported in Table E4

ICES AFWG REPORT 2016 | 435
and presented in Figure 7.7a. The maturity ogive modelled by Gadget is presented
(Figure 7.7b). This analysis shows that 50% of the fish are mature at age 12.
7.2.4 Survey results (Tables E1a,b-E2a,b-E3, Figures 7.4a,b–7.5a,b)
The results from the following research vessel survey series were evaluated by the
Working Group:
Winter Norwegian Barents Sea (Division 2.a) bottom-trawl survey (BS-NoRu-Q1 (BTr))
from 1986 to 2016 (joint with Russia some of the years since 2000) in fishing depths of
100—500 m. Length compositions for the years 1986—2016 are shown in Table E1a and
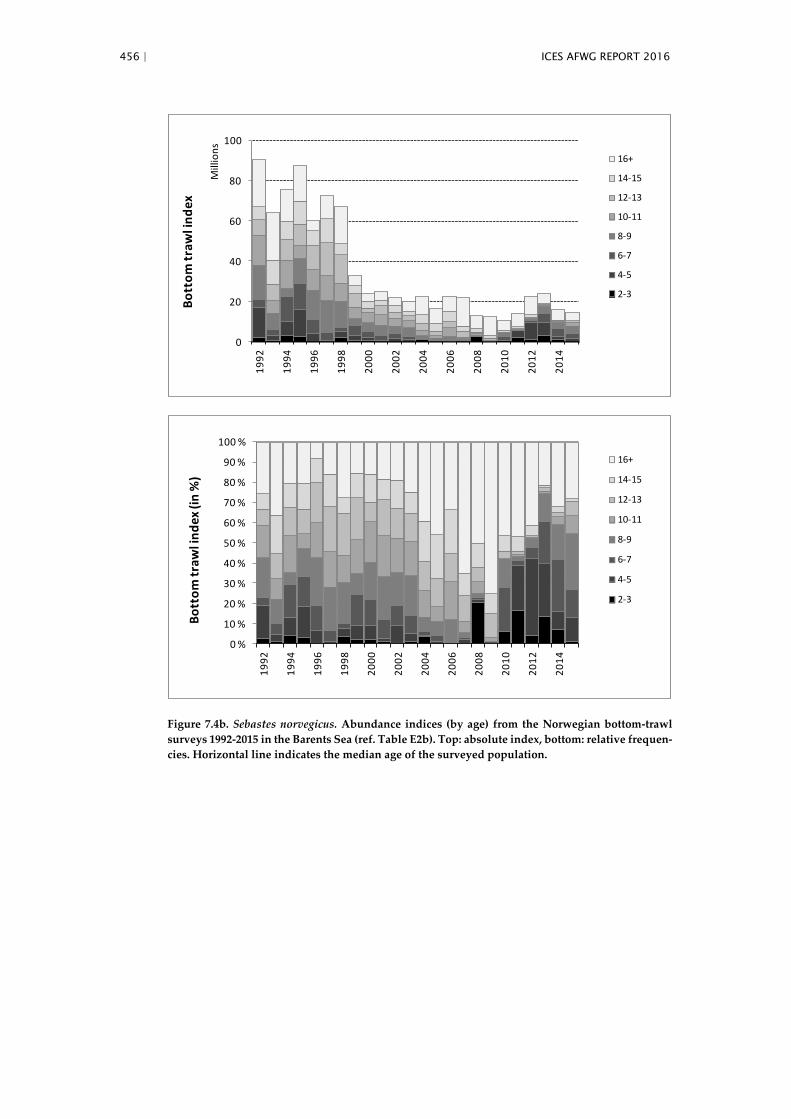
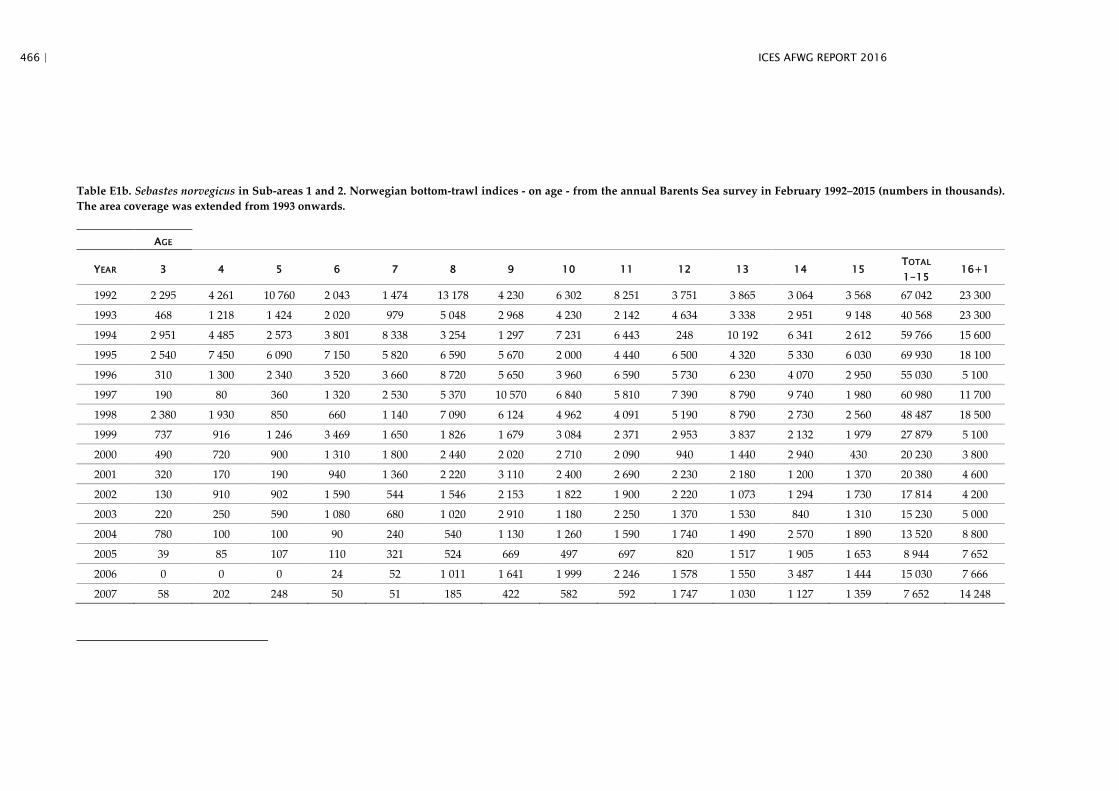
Figure 7.4a. Age compositions for the years 1992—2015 are shown in Table E1b and
Figure 7.4b. This survey covers important nursery areas for the stock.
Norwegian Svalbard (Division 2.b) bottom-trawl survey (August-September) from
19852015 in fishing depths of 100—500 m (depths down to 800 m incl. in the swept-
area). Since 2005 this is part of the Ecosystem survey (Eco-NoRu-Q3 (BTr)). Length
compositions for the years 1985—2015 and age compositions for the years 1992—2008
and 2012 and 2013 are shown in Table E2a and E2b, respectively. This survey covers
the northernmost part of the species’ distribution. Insufficient number of age readings
in 2009 and 2011, and no age samples collected in 2010 did not allow for updating the
age composition in these years.
Data on length and age from both these surveys have been combined and are shown
in Figures 7.5a,b.
Age disaggregated catch rates (numbers/nm2 averaged for all stations within subareas
and finally averaged, weighted by subarea, for the total surveyed area) of Sebastes
norvegicus from the Norwegian Coastal and Fjord survey in 1995—2010 from Finn-
mark to Møre (NOcoast-Aco-Q4) (Table E3). The estimated catch rates in 2008 and 2009
were particularly high due to one trawl station with an exceptional high catch. Updat-
ing of table E3 is discontinued. The data are no longer used as input to the Gadget
analytical assessment as described in the stock annex.
The bottom-trawl surveys covering the Barents Sea and the Svalbard areas show that
the abundance indices over the commercial size range (> 25 cm) were relatively stable
up to 1998 but declined to lower levels afterwards. Abundance of prerecruits (<25cm)
has steadily decreased since 1991 and has dropped to very low levels after 2000 (Figure
7.4a). An increase in the number of prerecruits is visible from 2008 onwards. Although
this could originally partly result from taxonomic misidentification, the confirmation
of increased numbers for individuals of size 15 cm and greater gives some confidence
that at least some of the increasing numbers are S. norvegicus.
7.3 Assessment with the GADGET model
7.3.1 Description of the model
Since AFWG2005, experimental analytical assessments have been conducted on this
stock using GADGET, and results presented for the years 1990—2013. This model was
evaluated by the WKRED (2012) benchmark meeting (ICES CM 2012/ACOM:48), and
its continued use for analysing this stock was recommended. The stock has a three year
advice cycle, and advice will be updated this year. Note that the natural mortality es-
timate (M) was changed from 0.1 to 0.05 in 2012, and results are thus not directly com-
parable with earlier years.

436 | ICES AFWG REPORT 2016
The GADGET model used for the assessment of S. norvegicus in areas 1 and 2 is closely
related to the GADGET model that currently is used by the ICES North-Western WG
on S. norvegicus (Björnsson and Sigurdsson 2003). The functioning of a Gadget model,
including parameter estimation and data used for tuning, is described in Bogstad et al.
(2004) and in the stock annex for S. norvegicus. In brief, the model is a single species
forward simulation age–length structured model, split into mature and immature com-
ponents. There are two commercial fleets (a gillnet fleet and a combined trawl and
other gears fleet), and one survey used in the model. Growth and fishing selectivity are
assumed constant over time, and recruitment is estimated on annual basis (no SSB-
recruit relationship).
The weighting scheme for combining the different datasets into a single likelihood
score is an ad hoc method where weights are selected so that the catch and survey data
have approximately equal contribution to the overall likelihood score in the optimized
model, and that each dataset within each group gives approximately equal contribu-
tions to each other. The parameters in the model are estimated using a combination of
Simulated Annealing (wide area search) and Hooke and Jeeves (local search) repeated
in sequence until a converged solution is found.
7.3.2 Data used for tuning
Quarterly catch in tonnes from two commercial fishing fleets, i.e. Norwegian
gillnet and ‘all others’, to 2015.
Quarterly length distribution of total international commercial landings
from two commercial fishing fleets, i.e. Norwegian gillnet and ‘all others’ to
2015. Due to late data submissions, there is one year time-lag in the inclusion
of length distributions from other countries than Norway.
Quarterly age–length keys from the same fishing fleets, up to 2015
Length disaggregated survey indices from the Barents Sea (Division 2.a) bottom-trawl
survey (February) from 1990—2015 (Table E1a)
Age–length keys and aggregated survey indices from the same survey up to 2015 (Ta-
ble E1b)

ICES AFWG REPORT 2016 | 437
7.3.3 Assessment results using the Gadget model
The text table below compares the results from this year’s Gadget model with previous
years for two reference years 1990 and 2003. Note that the natural mortality in the
model was changed in 2012, meaning that results from the 2012—2015 assessments are
not directly comparable with earlier years.
TOTAL
STOCK (3+)
BY 1
JANUARY
1990 (TONS)
MEAN
WEIGHT IN
STOCK
1990 (KG)
SSB (15+) BY
1 JANUARY
1990 (TONS)
TOTAL STOCK
(3+) BY 1
JANUARY
2003 (TONS)
MEAN
WEIGHT IN
STOCK
2003 (KG)
SSB (15+) BY
1 JANUARY
20031
(TONS)
WG
2006 179 313 0.39 64 019 71 013 0.71 38 927
WG
2007 163 536 0.35 66 712 64 240 0.64 43 096
WG
2008 158 851 0.35 64 838 74 717 0.78 47 693
WG
2009 149 763 0.34 66 153 73 673 0.77 51 683
WG
2010 152 419 0.34 58 774 80 073 0.79 55 995
WG
2011 148 727 0.33 56 271 80 808 0.78 55 810
WG 2
2012 109 021 0.43 48 308 55 229 0.80 40 030
WG 2
2013 111 216 0.37 47 620 50 151 0.79 33 400
WG 2
2014 111 850 0.37 48 861 56 090 0.93 39 050
WG 2
2015 113 840 0.37 49 800 59 510 0.91 41 960
Since WG2007 based on modelled maturation and not 15+, dataseries used for estima-
tion of maturity modified in 2010
The natural mortality in the model was reduced from 0.1 to 0.05 in 2012. This reduced
overall numbers and biomass, and increased mean weight. Results are therefore not
directly comparable with earlier years.
The general patterns in the stock dynamics of S. norvegicus are similar to those mod-
elled for the past several years (Figure 7.10). The overall stock numbers and biomass
continue to show a decline, with possible good year classes recruited in recent years.
Mature biomass and numbers are in steady decline, while modelled immature num-
bers and biomass show signs of beginning to improve – although this is not yet re-
flected in the catch data on the older fish,
As in previous reports it should be noted that it is possible that the improved recruit-
ment signal from the 2003 yearclass may be due to misidentification of small S. mentella
(which is a larger stock and has had good recent recruitment) as S. Norvegicus, and the
model has repeatedly revised down the estimate of this recruitment, although not to
zero. The largest of these fish are now in the 35-40 cm length category, and have been
tracked through multiple survey years. However they are not yet showing up in the
catch data, although the model prediction is that they are large enough to begin to enter
the fishery. It is therefore still unclear to what extent this recruitment signal is genuine.

438 | ICES AFWG REPORT 2016
Assuming the recruitment to be genuine, albeit smaller than originally estimated ini-
tially gives the possibility for stabilizing or even starting to recover the stock with im-
proved management. A second, larger, recruitment peak exists from the 2009 yearclass
(showing up as age 3 in 2012). This should be considered highly uncertain, as species
identification on these smallest fish is difficult. It should therefore be stressed that the
exact size of the recruitment events, and the extent to which they will impact on the
SSB, remains uncertain.
The most important conclusions to be drawn from the current assessment using the
Gadget model are:
The recruitment to the stock has been very poor for a long period, and especially prior
to 2005 (Figure 7.9)
There has been somewhat better estimated recruitment in recent years, although still
below the long-term average. The exact level is still somewhat uncertain. There may
also be a second pulse of good recruitment, however this is still highly uncertain, and
will need to be tracked for some years to reduce this uncertainty.
The estimated fishing mortality (F12-19) declined between 1990 and 2005 and steadily
increased since 2005, briefly stabilized between 2010 and 2011, and increased again in
2012 and 2013. The current mortality is estimated to 0.27 (Figure 7.8), well above a sus-
tainable level for a redfish species. This estimate is based on the 2003 yearclass being a
good one, and the estimate would be higher if this is not the case.
According to the model the total-stock biomass (3+) of S. norvegicus has decreased from
about 151 000 tonnes in 1992—1993 to around 20 000 tonnes in 2015 (Figure 7.10, Table
7.8). Due to the improved recent recruitment the total biomass is beginning to stabilize,
although the SSB is continuing to decline.
The spawning-stock biomass of S. norvegicus has decreased from a maximum of about
55 thousand tonnes in 1996 to barely 10 thousand tonnes in 2015 (Figure 7.10, Table
7.8). This reduction is primarily the result of prolonged low recruitment, combined
with excessively high fishing pressure. Although this continues to decline, the rate of
that decline is starting to slow, based on the estimated strong 2003 year class.
It should be noted that there is a strong retrospective pattern in the assessment model,
with mature biomass consistently revised upwards and F downwards between years
(figure 7.11). This may relate to the partial coverage of the stock by the survey (and
especially the lack of coverage of mature fish in the survey), or due to errors in species
identification. The 7 years Mohn’s rho index on F is -0.88, indicating a strong tendency
to revise downwards. The revision between years does not change the picture of a de-
clining SSB at a low level, and not does it result in the terminal year estimate being
higher than the previous terminal year. There is no strong retrospective pattern in the
juvenile biomass, suggesting that it may be fisheries data that is driving the pattern in
SSB. An experimental retrospective run excluding the survey offers support for this,
showing similar trends in mature SSB stock, and similar retrospective patterns. Note
that not all years in this experimental run converged, so this does not represent an
alternative assessment. This lack of retrospective in the juvenile biomass also indicates
that the estimates of a period of poor recruitment are robust to the identified retrospec-
tive trend in the SSB. Consequently, we conclude that this is something which should
be considered further in the next benchmark. Ideally one would want survey coverage
of the mature individuals in order to get level information on this fraction of the stock.
However, given the strong downward trend which is not changed by the revisions, the
similar pattern seen in the “no survey” model, and the confirmation of these trends
ICES AFWG REPORT 2016 | 439
from the WKRED production model, the retrospective patterns should not affect the
current advice of “zero directed catch, minimize bycatch”.
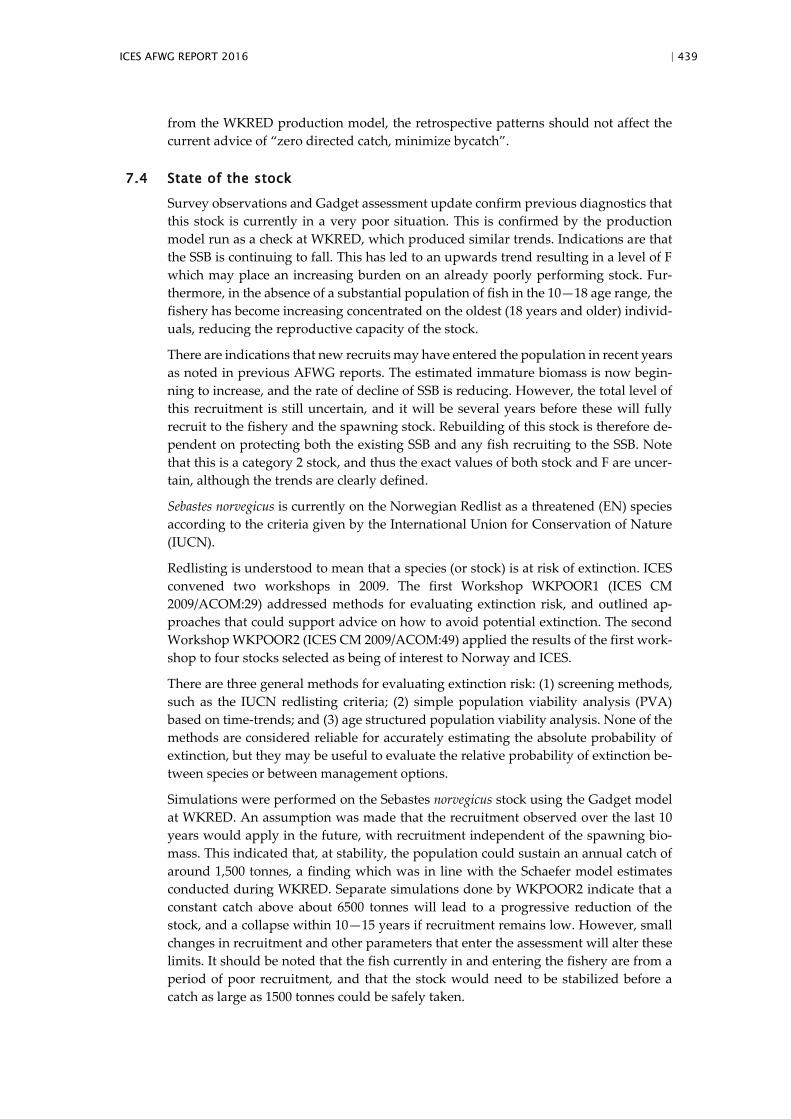
7.4 State of the stock
Survey observations and Gadget assessment update confirm previous diagnostics that
this stock is currently in a very poor situation. This is confirmed by the production
model run as a check at WKRED, which produced similar trends. Indications are that
the SSB is continuing to fall. This has led to an upwards trend resulting in a level of F
which may place an increasing burden on an already poorly performing stock. Fur-
thermore, in the absence of a substantial population of fish in the 10—18 age range, the
fishery has become increasing concentrated on the oldest (18 years and older) individ-
uals, reducing the reproductive capacity of the stock.
There are indications that new recruits may have entered the population in recent years
as noted in previous AFWG reports. The estimated immature biomass is now begin-
ning to increase, and the rate of decline of SSB is reducing. However, the total level of
this recruitment is still uncertain, and it will be several years before these will fully
recruit to the fishery and the spawning stock. Rebuilding of this stock is therefore de-
pendent on protecting both the existing SSB and any fish recruiting to the SSB. Note
that this is a category 2 stock, and thus the exact values of both stock and F are uncer-
tain, although the trends are clearly defined.
Sebastes norvegicus is currently on the Norwegian Redlist as a threatened (EN) species
according to the criteria given by the International Union for Conservation of Nature
(IUCN).
Redlisting is understood to mean that a species (or stock) is at risk of extinction. ICES
convened two workshops in 2009. The first Workshop WKPOOR1 (ICES CM
2009/ACOM:29) addressed methods for evaluating extinction risk, and outlined ap-
proaches that could support advice on how to avoid potential extinction. The second
Workshop WKPOOR2 (ICES CM 2009/ACOM:49) applied the results of the first work-
shop to four stocks selected as being of interest to Norway and ICES.
There are three general methods for evaluating extinction risk: (1) screening methods,
such as the IUCN redlisting criteria; (2) simple population viability analysis (PVA)
based on time-trends; and (3) age structured population viability analysis. None of the
methods are considered reliable for accurately estimating the absolute probability of
extinction, but they may be useful to evaluate the relative probability of extinction be-
tween species or between management options.
Simulations were performed on the Sebastes norvegicus stock using the Gadget model
at WKRED. An assumption was made that the recruitment observed over the last 10
years would apply in the future, with recruitment independent of the spawning bio-
mass. This indicated that, at stability, the population could sustain an annual catch of
around 1,500 tonnes, a finding which was in line with the Schaefer model estimates
conducted during WKRED. Separate simulations done by WKPOOR2 indicate that a
constant catch above about 6500 tonnes will lead to a progressive reduction of the
stock, and a collapse within 10—15 years if recruitment remains low. However, small
changes in recruitment and other parameters that enter the assessment will alter these
limits. It should be noted that the fish currently in and entering the fishery are from a
period of poor recruitment, and that the stock would need to be stabilized before a
catch as large as 1500 tonnes could be safely taken.

440 | ICES AFWG REPORT 2016
7.4.1 Biological reference points
The ability to set biological reference points was examined at WKRED (2012). It was
not possible to accurately define a SSB-recruitment relationship, or the productivity
level of the stock. In addition, there was considerable uncertainty over recent levels of
recruitment (due to possible species misidentification and inconsistent signals in the
winter survey). As a result, it was not considered possible to set target reference points
for this stock at that time. There is now greater confidence in the recruitment event in
2003. One could therefore consider the associated SSB the previous year (2002) as a
lower reference point (Bloss that led to good recruitment), which would give a value of
just over 40,000 tonnes. This yearclass is seen in multiple years of the winter survey,
and now shows up as a bimodal length distribution, with low values visible in the mid
length ranges representing the extended period of poor recruitment prior to 2003.
However, the model predicts that this yearclass should have begun to enter the fishery,
while the available fisheries biological sampling data does not show any upturn in the
youngest ages caught. This may be due to poor sampling of the smallest fraction of the
catch or a change in selectivity since there were last abundant fish of this size. How-
ever, it may also be that the signal in the survey is misidentified S. mentella. Conse-
quently, we do not present a calculation for Blim/Bpa here. Rather, we recommend that
this be considered at the planned 2018 benchmark, by which time the 2003 yearclass
will have entered the fishery more strongly. The benchmark is also recommended to
take a broader look at available survey data, which should also help confirm (or refute)
this good yearclass. Blim and Bpa are thus currently undefined for this stock. We note that
the SSB is currently at the lowest observed value in the time period of the model, and
the stock should thus be considered below any potential reference level. Therefore this
lack of a formal Blim/Bpa does not affect the perception of the stock as below safe limits,
nor impact on the advice or management of the stock in the short term.
A maximum exploitation rate of 5% has been suggested sustainable for long lived spe-
cies like Sebastes spp. when the stocks show no sign of reduced reproductive potential
(corresponding to keeping SPR at 60% of the level when no fishing occurs; see chapter
7.8 and Dorn 2002). If we take this to imply a preliminary Flim of 0.05, then this gives a
Fpa of 0.036 (0.05/1.4). However, this should be considered further at the next bench-
mark. Based on the selection curves for the fleets, a reasonable approximation of the
fishable biomass would be the mature biomass. The modelling at WKRED, using both
Gadget and a Schaefer model, suggested around 1500 t as the sustainable yield at av-
erage recent recruitment levels, once the stock has recovered from its current low level.
At present a recovery strategy is required rather than MSY fishing.
7.4.2 Management advice
AFWG considers that the current catch level is several times higher than can be sus-
tained by the stock, given the ongoing downwards trend in mature biomass. AFWG
therefore recommends that current area closures and low bycatch limits should be
maintained. No directed fishery should be conducted on this stock at the moment, and
the percent legal bycatch should be set as low as possible for other fisheries to continue.
There will be no directed fishery for S. norvegicus in 2015 except for a small-scale fishery
with handline that is expected to catch less than 100 tonnes in 2015. The current bycatch
regulations are, however, in general too liberal to further constrain the catch as would
be required for the stock to recover.

ICES AFWG REPORT 2016 | 441
7.4.3 Implementing the ICES FMSY framework
As a long lived species, S. norvegicus has many year classes contributing to the popula-
tion, and consequently a relatively stable stock level from year-to-year. This makes it
relatively simple to manage to some proxy of MSY (e.g. F0.1) provided adequate
measures can be implemented to reduce fishing pressure to an appropriate level. It
should be noted that the current fishery (F(12-19) = 0.27) is well above the suggested
Fpa of 5% of the stock (Section 7.6). The main focus should therefore be on reducing
total F to no higher than Fpa. The current priority is to stabilize the stock and prevent
further decline, only then could a recovery strategy and eventually an MSY fishery be
implemented. The recent upturn in immature biomass gives some hope that such re-
covery may be possible, given light fishing pressure.
During the ICES Workshop on Implementing the ICES FMSY framework (WKFRAME),
the closely related beaked redfish Sebastes mentella stock in Sub-areas 1 and 2 was used
as a case study (ICES CM 2010/ACOM:54) for a data limited situation. The results of
this Workshop refer also to Sebastes norvegicus in the Barents Sea, where the AFWG is
faced with a data limited situation. WKFRAME recommends that the bounds for FMSY
proxies should be evaluated in function of the YPR and SPR curves, and that the repro-
ductive capacity of the S. mentella (in this case S. norvegicus) stock be at least above 30%
of the SPR at F=0. The YPR curve left of the plateau can be used as lower bound (F0.1
proxy) and a prescribed per-cent SPR as upper bound. The WKFRAME also illustrates
by examples why it is informative and important to carry out sensitivity analyses, par-
ticularly assumptions regarding natural mortality, selection pattern, growth (density-
dependence) and maturity. The WG did some preliminary analyses of the sensitivity
of F0.1 for different natural mortalities. Compared with S. mentella, F0.1 for S. norvegicus
is much less sensitive towards changes in natural mortality
During WKRED 2012, the yield-per-recruit (YPR) was calculated by adding recruit-
ment in a single year. Repeat runs were made using a range of values for F, with the
results shown in Figure E1. It should be noted that there is no spawning stock–recruit-
ment relationship in the model, rather these calculations assume a constant annual re-
cruitment. Consequently the model may over-predict yield at higher fishing levels,
because these levels will lead to a larger reduction in SSB than in overall stock. The
yields presented here should therefore be considered an upper bound (especially at
higher fishing levels). The highest yield obtained is at Fmax = 0.15, but from a rather flat
topped curve. F0.1 (the point at which the slope is 10% of the slope at the origin, a typical
precautionary proxy for FMSY) is around F0.1 = 0.08. Other proxy values are certainly
possible. Using a constant annual recruitment of 2.6 million individuals with the above
fishing mortalities gives the corresponding sustainable yields.
For Fmax = 0.15 the sustainable yield at (then) current recruitment is 1500 tonnes per year
For F0.1 = 0.08 the sustainable yield at (then) current recruitment is 1400 tonnes per year
However, it should be stressed that these are average values for FMSY and yield at the
currently estimated recruitment level and for healthy stock. The stock is currently de-
pleted, and recruitment has for a long period prior to the late 2000s been lower than
the recent average. Consequently the stock cannot currently sustain these levels of
catches and recover at the same time, and a recovery strategy is required first.
442 | ICES AFWG REPORT 2016
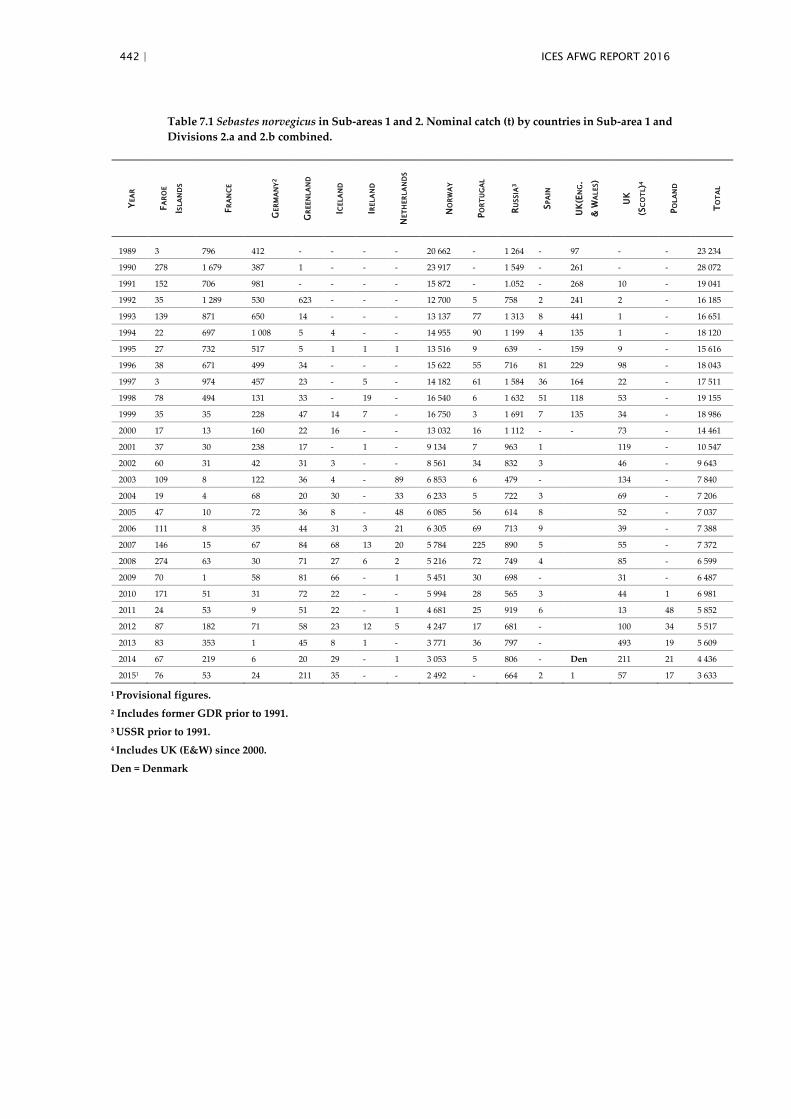
Table 7.1 Sebastes norvegicus in Sub-areas 1 and 2. Nominal catch (t) by countries in Sub-area 1 and
Divisions 2.a and 2.b combined. Y
EA
R
FA
RO
E
ISLA
ND
S
FR
AN
CE
GER
MA
NY
2
GR
EEN
LA
ND
ICELA
ND
IRELA
ND
NET
HER
LA
ND
S
NO
RW
AY
PO
RT
UG
AL
RU
SSIA
3
SPA
IN
UK
(EN
G.
& W
ALES)
UK
(SC
OT
L)4
PO
LA
ND
TO
TA
L
1989 3 796 412 - - - - 20 662 - 1 264 - 97 - - 23 234
1990 278 1 679 387 1 - - - 23 917 - 1 549 - 261 - - 28 072
1991 152 706 981 - - - - 15 872 - 1.052 - 268 10 - 19 041
1992 35 1 289 530 623 - - - 12 700 5 758 2 241 2 - 16 185
1993 139 871 650 14 - - - 13 137 77 1 313 8 441 1 - 16 651
1994 22 697 1 008 5 4 - - 14 955 90 1 199 4 135 1 - 18 120
1995 27 732 517 5 1 1 1 13 516 9 639 - 159 9 - 15 616
1996 38 671 499 34 - - - 15 622 55 716 81 229 98 - 18 043
1997 3 974 457 23 - 5 - 14 182 61 1 584 36 164 22 - 17 511
1998 78 494 131 33 - 19 - 16 540 6 1 632 51 118 53 - 19 155
1999 35 35 228 47 14 7 - 16 750 3 1 691 7 135 34 - 18 986
2000 17 13 160 22 16 - - 13 032 16 1 112 - - 73 - 14 461
2001 37 30 238 17 - 1 - 9 134 7 963 1 119 - 10 547
2002 60 31 42 31 3 - - 8 561 34 832 3 46 - 9 643
2003 109 8 122 36 4 - 89 6 853 6 479 - 134 - 7 840
2004 19 4 68 20 30 - 33 6 233 5 722 3 69 - 7 206
2005 47 10 72 36 8 - 48 6 085 56 614 8 52 - 7 037
2006 111 8 35 44 31 3 21 6 305 69 713 9 39 - 7 388
2007 146 15 67 84 68 13 20 5 784 225 890 5 55 - 7 372
2008 274 63 30 71 27 6 2 5 216 72 749 4 85 - 6 599
2009 70 1 58 81 66 - 1 5 451 30 698 - 31 - 6 487
2010 171 51 31 72 22 - - 5 994 28 565 3 44 1 6 981
2011 24 53 9 51 22 - 1 4 681 25 919 6 13 48 5 852
2012 87 182 71 58 23 12 5 4 247 17 681 - 100 34 5 517
2013 83 353 1 45 8 1 - 3 771 36 797 - 493 19 5 609
2014 67 219 6 20 29 - 1 3 053 5 806 - Den 211 21 4 436
20151 76 53 24 211 35 - - 2 492 - 664 2 1 57 17 3 633
1 Provisional figures.
2 Includes former GDR prior to 1991.
3 USSR prior to 1991.
4 Includes UK (E&W) since 2000.
Den = Denmark
ICES AFWG REPORT 2016 | 443
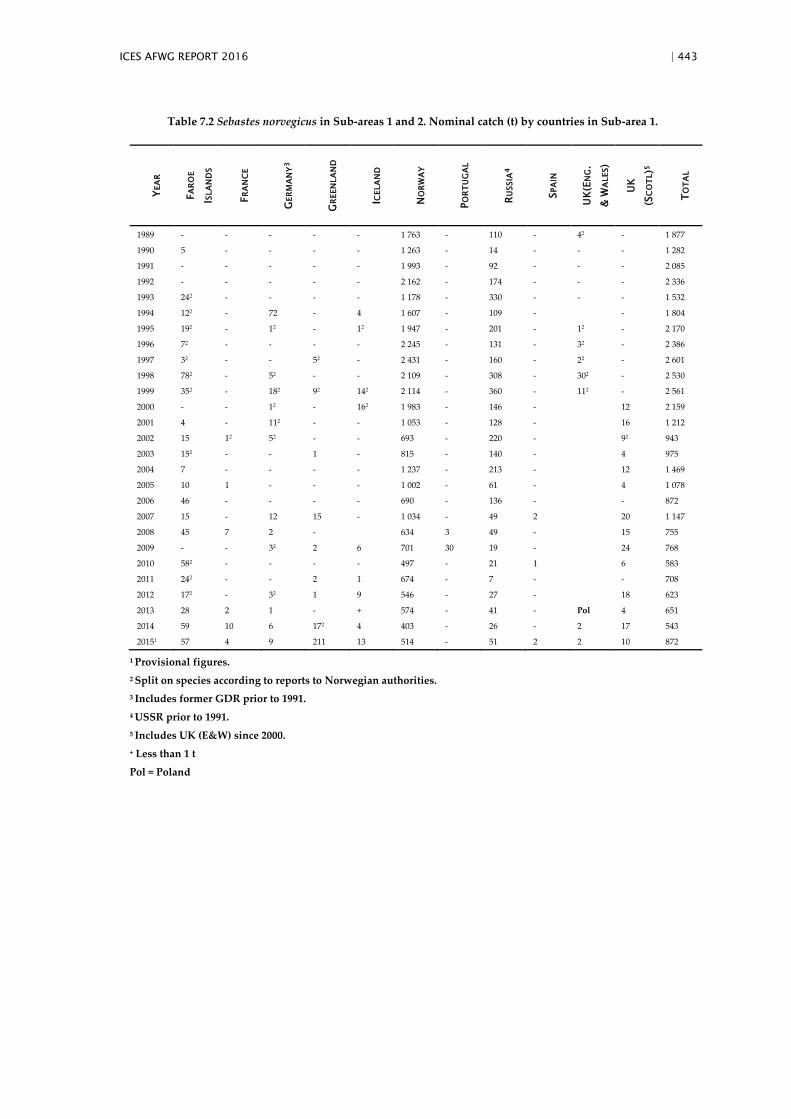
Table 7.2 Sebastes norvegicus in Sub-areas 1 and 2. Nominal catch (t) by countries in Sub-area 1.
YEA
R
FA
RO
E
ISLA
ND
S
FR
AN
CE
GER
MA
NY
3
GR
EEN
LA
ND
ICELA
ND
NO
RW
AY
PO
RT
UG
AL
RU
SSIA
4
SPA
IN
UK
(EN
G.
& W
ALES)
UK
(SC
OT
L)5
TO
TA
L
1989 - - - - - 1 763 - 110 - 42 - 1 877
1990 5 - - - - 1 263 - 14 - - - 1 282
1991 - - - - - 1 993 - 92 - - - 2 085
1992 - - - - - 2 162 - 174 - - - 2 336
1993 242 - - - - 1 178 - 330 - - - 1 532
1994 122 - 72 - 4 1 607 - 109 - - 1 804
1995 192 - 12 - 12 1 947 - 201 - 12 - 2 170
1996 72 - - - - 2 245 - 131 - 32 - 2 386
1997 32 - - 52 - 2 431 - 160 - 22 - 2 601
1998 782 - 52 - - 2 109 - 308 - 302 - 2 530
1999 352 - 182 92 142 2 114 - 360 - 112 - 2 561
2000 - - 12 - 162 1 983 - 146 - 12 2 159
2001 4 - 112 - - 1 053 - 128 - 16 1 212
2002 15 12 52 - - 693 - 220 - 92 943
2003 152 - - 1 - 815 - 140 - 4 975
2004 7 - - - - 1 237 - 213 - 12 1 469
2005 10 1 - - - 1 002 - 61 - 4 1 078
2006 46 - - - - 690 - 136 - - 872
2007 15 - 12 15 - 1 034 - 49 2 20 1 147
2008 45 7 2 - 634 3 49 - 15 755
2009 - - 32 2 6 701 30 19 - 24 768
2010 582 - - - - 497 - 21 1 6 583
2011 242 - - 2 1 674 - 7 - - 708
2012 172 - 32 1 9 546 - 27 - 18 623
2013 28 2 1 - + 574 - 41 - Pol 4 651
2014 59 10 6 172 4 403 - 26 - 2 17 543
20151 57 4 9 211 13 514 - 51 2 2 10 872
1 Provisional figures.
2 Split on species according to reports to Norwegian authorities.
3 Includes former GDR prior to 1991.
4 USSR prior to 1991.
5 Includes UK (E&W) since 2000.
+ Less than 1 t
Pol = Poland
444 | ICES AFWG REPORT 2016
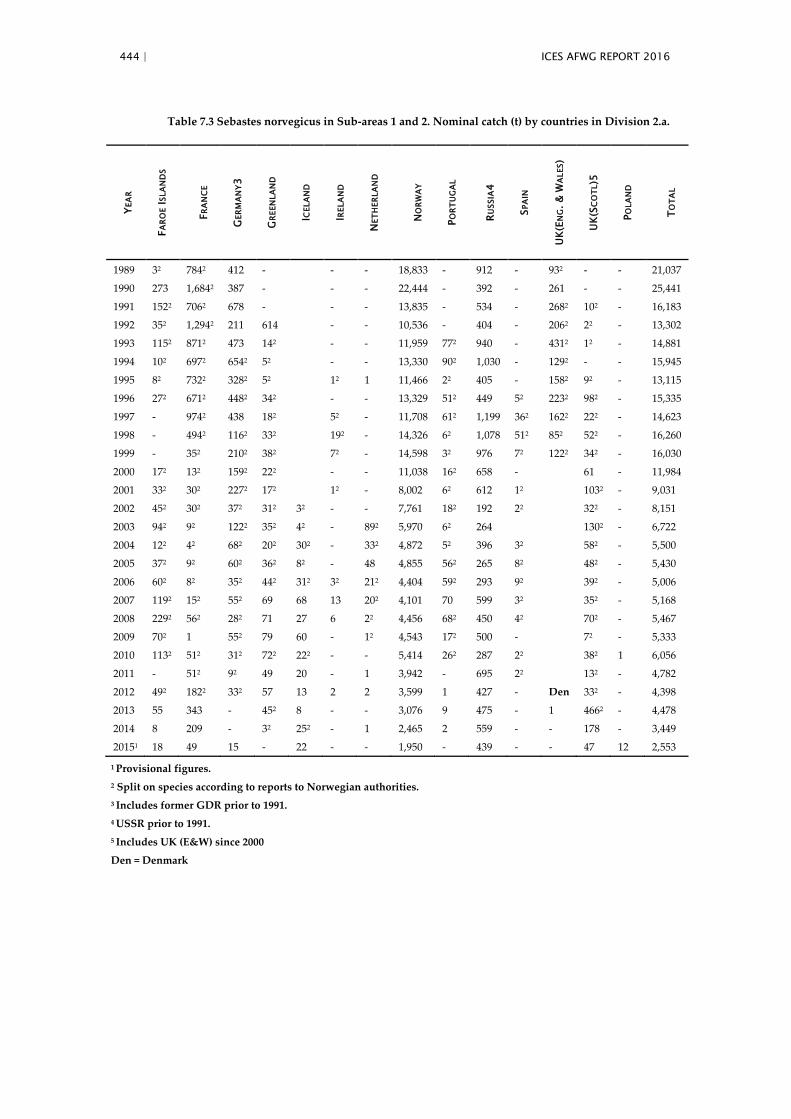
Table 7.3 Sebastes norvegicus in Sub-areas 1 and 2. Nominal catch (t) by countries in Division 2.a. Y
EA
R
FA
RO
E I
SLA
ND
S
FR
AN
CE
GER
MA
NY3
GR
EEN
LA
ND
ICELA
ND
IRELA
ND
NET
HER
LA
ND
NO
RW
AY
PO
RT
UG
AL
RU
SSIA
4
SPA
IN
UK
(EN
G.
& W
ALES)
UK
(SC
OT
L)5
PO
LA
ND
TO
TA
L
1989 32 7842 412 - - - 18,833 - 912 - 932 - - 21,037
1990 273 1,6842 387 - - - 22,444 - 392 - 261 - - 25,441
1991 1522 7062 678 - - - 13,835 - 534 - 2682 102 - 16,183
1992 352 1,2942 211 614 - - 10,536 - 404 - 2062 22 - 13,302
1993 1152 8712 473 142 - - 11,959 772 940 - 4312 12 - 14,881
1994 102 6972 6542 52 - - 13,330 902 1,030 - 1292 - - 15,945
1995 82 7322 3282 52 12 1 11,466 22 405 - 1582 92 - 13,115
1996 272 6712 4482 342 - - 13,329 512 449 52 2232 982 - 15,335
1997 - 9742 438 182 52 - 11,708 612 1,199 362 1622 222 - 14,623
1998 - 4942 1162 332 192 - 14,326 62 1,078 512 852 522 - 16,260
1999 - 352 2102 382 72 - 14,598 32 976 72 1222 342 - 16,030
2000 172 132 1592 222 - - 11,038 162 658 - 61 - 11,984
2001 332 302 2272 172 12 - 8,002 62 612 12 1032 - 9,031
2002 452 302 372 312 32 - - 7,761 182 192 22 322 - 8,151
2003 942 92 1222 352 42 - 892 5,970 62 264 1302 - 6,722
2004 122 42 682 202 302 - 332 4,872 52 396 32 582 - 5,500
2005 372 92 602 362 82 - 48 4,855 562 265 82 482 - 5,430
2006 602 82 352 442 312 32 212 4,404 592 293 92 392 - 5,006
2007 1192 152 552 69 68 13 202 4,101 70 599 32 352 - 5,168
2008 2292 562 282 71 27 6 22 4,456 682 450 42 702 - 5,467
2009 702 1 552 79 60 - 12 4,543 172 500 - 72 - 5,333
2010 1132 512 312 722 222 - - 5,414 262 287 22 382 1 6,056
2011 - 512 92 49 20 - 1 3,942 - 695 22 132 - 4,782
2012 492 1822 332 57 13 2 2 3,599 1 427 - Den 332 - 4,398
2013 55 343 - 452 8 - - 3,076 9 475 - 1 4662 - 4,478
2014 8 209 - 32 252 - 1 2,465 2 559 - - 178 - 3,449
20151 18 49 15 - 22 - - 1,950 - 439 - - 47 12 2,553
1 Provisional figures.
2 Split on species according to reports to Norwegian authorities.
3 Includes former GDR prior to 1991.
4 USSR prior to 1991.
5 Includes UK (E&W) since 2000
Den = Denmark

ICES AFWG REPORT 2016 | 445
Table 7.4 Sebastes norvegicus in Sub-areas 1 and 2. Nominal catch (t) by countries in Division 2.b.
YEA
R
FA
RO
E I
SLA
ND
S
FR
AN
CE
GER
MA
NY
2
GR
EEN
LA
ND
ICELA
ND
IRELA
ND
NET
HER
LA
ND
S
NO
RW
AY
PO
RT
UG
AL
RU
SSIA
5
SPA
IN
UK
(EN
G.
& W
ALES)
UK
(SC
OT
L)6
PO
LA
ND
TO
TA
L
1989 - - - - 66 - 242 - - - - 308
1990 - - - 12 210 - 1157 - - - - 1 368
1991 - - 303 - 44 - 426 - - - - 773
1992 - - 319 92 2 52 180 2 352 - - 552
1993 - - 177 - - - 43 83 102 - - 238
1994 - - 282 - 18 - 60 43 62 12 - 371
1995 - - 187 - 103 7 33 - - - - 330
1996 4 - 512 - 27 5 136 762 32 - - 302
1997 - - 20 - 43 - 225 - - - - 288
1998 - - 102 - 105 - 246 - 32 - - 364
1999 - - - - 38 - 355 - 22 - - 395
2000 - - - - 10 - 308 - - - - 318
2001 - - - - 79 12 223 - - - - 303
2002 - - - - 107 162 420 12 52 - 549
2003 - - - - 68 - 75 - - - 143
2004 - - - - 124 - 113 - - - 237
2005 - - 132 - 2281 - 288 - - - 529
2006 52 - - - 1
211
102 284 - - - 1 510
2007 12 - - - 649 155 242 - - - 1 057
2008 - - - - 126 12 250 - - - 377
2009 - - - - 207 - 179 - - - 386
2010 - - - - 83 22 257 - - - 342
2011 - 2 - - 1 - - 65 25 217 42 - 48 362
2012 212 - 352 - 1 8 3 102 16 227 - 49 34 496
2013 - 9 - - - 1 - 120 27 281 - 232 19 480
2014 - - - - - - - 185 3 221 - Den 162 19 444
20151 - - - - - - - 28 - 175 - 1 - 3 207
1 Provisional figures.
2 Split on species according to reports to Norwegian authorities.
3 Split on species according to the 1992 catches.
4 Includes former GDR prior to 1991.
5 USSR prior to 1991.
6 Includes UK (E&W) since 2000.
Den = Denmark

446 | ICES AFWG REPORT 2016
Table 7.5. Sebastes norvegicus in Sub-areas 1 and 2. Catch numbers-at-age (in thousands).
YEAR/AGE 7 8 9 10 11 12 13 14 15 16 17 18 19 20 21 22 23 +GP
TOTAL
NUM.
TONS
LAND.
1992 5 22 78 114 394 549 783 1718 3102 2495 2104 1837 998 858 688 547 268 3110 19670 16185
1993 0 24 193 359 406 1036 1022 1523 2353 1410 1655 1678 745 716 534 528 576 3482 18240 16651
1994 46 7 292 640 816 1930 2096 2030 1601 2725 2668 1409 617 733 514 256 177 1508 20065 18120
1995 60 85 230 672 908 1610 2038 2295 1783 1406 785 563 670 593 419 368 250 3232 17967 15616
1996 9 119 313 361 879 1234 1638 2134 1675 1614 1390 952 679 439 560 334 490 3135 17955 18043
1997 9 98 156 321 686 1065 1781 2276 2172 1848 1421 851 804 608 511 205 334 2131 17277 17511
1998 28 51 206 470 721 968 1512 1736 1582 1045 1277 970 1018 846 443 764 486 3389 17512 19155
1999 78 593 855 572 1006 1230 1618 1480 1612 1239 1407 1558 1019 394 197 459 174 2131 17622 18986
2000 4 13 70 245 902 958 1782 1409 2121 2203 1715 753 483 458 132 230 224 895 14597 14460
2001 23 23 44 199 347 482 1120 1342 1674 1653 1243 568 119 183 154 112 135 254 9675 10547
2002 14 36 71 143 414 686 1199 1943 1377 1274 1196 388 313 99 104 117 113 253 9740 9643
2003 22 25 30 44 204 359 705 1687 1338 1071 937 481 367 146 84 51 18 69 7637 7841
2004 19 47 46 65 198 277 504 590 677 963 1059 787 436 169 183 108 79 186 6390 7320
2005 40 55 94 80 165 173 393 779 741 916 926 743 376 210 189 129 111 220 6338 7037
2006 45 32 56 70 245 204 201 809 549 779 794 747 496 332 310 188 165 397 6419 7348
2007 15 21 31 68 138 306 448 495 523 637 892 616 510 396 225 322 170 630 6443 7306
2008 1 4 14 12 49 139 265 366 361 443 442 538 547 479 281 223 144 1032 5342 6557
2009 0 0 1 3 9 31 144 245 272 270 416 391 536 431 332 332 266 954 4633 6261
2010 0 0 0 9 8 36 92 336 437 489 420 336 610 537 498 319 317 884 5328 7744
2011 0 0 0 0 2 5 64 305 469 269 317 228 382 295 252 234 257 1010 4089 5852
2012 1 0 3 12 1 3 39 227 285 296 205 174 226 308 268 293 306 1226 3871 5517
2013 0 8 23 34 9 20 51 241 362 429 228 168 151 273 350 236 184 1117 3884 5609
2014 1 2 7 8 8 15 27 50 67 205 198 148 169 186 165 159 215 1228 2858 4436
2015 0 0 6 17 27 44 29 97 113 129 171 148 160 117 99 96 222 1173 2649 3633
1 Provisional figures.

ICES AFWG REPORT 2016 | 447
Table 7.6. Sebastes norvegicus in Sub-areas 1 and 2. Catch weights at age (kg).
YEAR/AGE 7 8 9 10 11 12 13 14 15 16 17 18 19 20 21 22 23 +GP
1992 0.18 0.29 0.48 0.42 0.50 0.59 0.58 0.65 0.65 0.71 0.82 0.84 0.94 1.02 1.03 1.15 1.27 1.27
1993 0.2 0.33 0.36 0.43 0.51 0.51 0.64 0.64 0.76 0.86 0.89 0.98 1 1.03 1.21 1.03 1.2 1.14
1994 0.25 0.37 0.38 0.49 0.51 0.64 0.74 0.76 0.86 0.95 1.03 1.07 1.11 1.16 1.15 1.13 1.02 1.36
1995 0.33 0.43 0.64 0.61 0.59 0.65 0.74 0.79 0.84 0.92 1.12 1.01 1.01 1.21 1.14 1.09 1.3 1.01
1996 0.22 0.49 0.56 0.65 0.71 0.81 0.84 0.88 0.96 1 1.02 1.01 1 1.03 1.04 1.14 1.09 1.16
1997 0.23 0.51 0.53 0.74 0.72 0.78 0.8 0.86 0.91 0.99 1.16 1.18 1.21 1.34 1.28 1.54 1.19 1.29
1998 0.37 0.21 0.47 0.62 0.67 0.77 0.77 0.85 1.05 0.96 1.25 1.28 1.3 1.23 1.87 1.46 1.73 1.29
1999 0.14 0.26 0.44 0.57 0.69 0.78 0.86 1.04 1.07 1.12 1.18 1.71 1.09 1.18 1.04 1.34 1.18 1.34
2000 0.19 0.24 0.32 0.44 0.53 0.64 0.73 0.84 0.96 1.11 1.25 1.32 1.53 1.06 1.29 1.32 1.12 1.2
2001 0.15 0.26 0.45 0.55 0.58 0.67 0.8 0.89 1.01 1.14 1.33 1.43 1.62 1.6 1.47 2 2.7 2.31
2002 0.17 0.25 0.33 0.42 0.54 0.67 0.72 0.84 0.98 1.09 1.2 1.3 1.44 1.78 1.68 1.88 2.12 1.84
2003 0.19 0.22 0.31 0.39 0.49 0.58 0.69 0.84 0.96 1.05 1.29 1.36 1.65 1.74 2.09 1.85 2.3 2.38
2004 0.21 0.26 0.36 0.45 0.51 0.59 0.68 0.8 0.96 1.07 1.22 1.34 1.57 1.67 1.75 2.09 1.9 2.04
2005 0.16 0.21 0.36 0.45 0.52 0.58 0.68 0.82 0.94 1.03 1.16 1.36 1.46 1.51 1.67 1.91 2.23 2.27
2006 0.13 0.15 0.28 0.41 0.51 0.58 0.66 0.74 0.83 1 1.14 1.27 1.39 1.46 1.37 1.47 1.64 2.03
2007 0.15 0.21 0.33 0.39 0.5 0.59 0.65 0.77 0.9 1 1.09 1.27 1.42 1.32 1.53 1.47 1.69 1.81
2008 0.41 0.55 0.55 0.57 0.52 0.58 0.65 0.81 0.9 1.07 1.14 1.36 1.51 1.81 1.99 2.01 2.26 1.93
2009 - - 0.62 0.55 0.54 0.51 0.77 0.88 0.9 1.06 1.16 1.25 1.36 1.53 1.59 1.66 1.72 1.55
2010 - - - 0.33 0.46 0.79 0.71 0.85 0.95 1.11 1.24 1.38 1.45 1.6 1.71 2 1.78 1.86
2011
2012
0.36
0.40
-
0.38
-
0.51
-
0.71
0.54
0.60
0.52
0.88
0.72
0.69
0.91
0.87
1.08
0.95
1.14
1.04
1.21
1.14
1.45
1.19
1.40
1.35
1.43
1.52
1.53
1.38
1.59
1.54
1.73
1.51
1.85
1.79
20131 - 0.35 0.37 0.48 0.47 0.57 0.69 0.88 0.97 1.10 1.19 1.20 1.31 1.38 1.37 1.59 1.81 1.99
2014 0.39 0.36 0.39 0.41 0.56 0.61 0.72 0.87 0.95 1.07 1.14 1.28 1.46 1.35 1.49 1.62 1.67 1.92
2015 - 0.35 0.37 0.51 0.51 0.60 0.66 0.88 0.93 1.03 1.15 1.18 1.23 1.34 1.50 1.49 1.48 1.64
1 Provisional figures.

448 | ICES AFWG REPORT 2016
Table 7.7. Sebastes norvegicus in Sub-areas 1 and 2. Fishing mortalities as estimated by Gadget.
1990 1991 1992 1993 1994 1995 1996 1997 1998 1999 2000 2001
4 0.000 0.000 0.000 0.000 0.000 0.000 0.000 0.000 0.000 0.000 0.000 0.000
5 0.000 0.000 0.000 0.000 0.000 0.000 0.000 0.000 0.000 0.000 0.000 0.000
6 0.001 0.001 0.001 0.001 0.001 0.001 0.001 0.001 0.001 0.001 0.001 0.000
7 0.004 0.003 0.003 0.003 0.003 0.002 0.003 0.002 0.003 0.003 0.002 0.002
8 0.032 0.010 0.008 0.008 0.009 0.007 0.008 0.008 0.009 0.009 0.008 0.005
9 0.067 0.046 0.021 0.021 0.021 0.018 0.020 0.019 0.022 0.023 0.019 0.014
10 0.095 0.080 0.066 0.041 0.043 0.036 0.041 0.040 0.045 0.048 0.039 0.029
11 0.130 0.105 0.098 0.098 0.074 0.062 0.070 0.069 0.078 0.083 0.068 0.052
12 0.172 0.134 0.121 0.130 0.141 0.094 0.107 0.104 0.119 0.127 0.105 0.080
13 0.219 0.167 0.147 0.155 0.175 0.151 0.147 0.144 0.164 0.176 0.145 0.111
14 0.273 0.203 0.175 0.181 0.201 0.178 0.210 0.184 0.210 0.226 0.187 0.142
15 0.332 0.242 0.204 0.207 0.228 0.199 0.236 0.241 0.254 0.275 0.227 0.173
16 0.394 0.283 0.234 0.234 0.254 0.219 0.257 0.263 0.311 0.319 0.264 0.202
17 0.459 0.325 0.264 0.260 0.280 0.239 0.278 0.282 0.332 0.374 0.297 0.227
18 0.492 0.368 0.295 0.286 0.305 0.258 0.298 0.300 0.351 0.393 0.335 0.248
19 0.524 0.389 0.324 0.311 0.329 0.275 0.315 0.316 0.369 0.411 0.347 0.271
20 0.556 0.410 0.339 0.334 0.351 0.292 0.332 0.331 0.384 0.427 0.360 0.279
21 0.587 0.430 0.353 0.346 0.371 0.306 0.347 0.344 0.398 0.442 0.371 0.286
22 0.615 0.450 0.366 0.357 0.381 0.320 0.359 0.356 0.410 0.454 0.381 0.293
23 0.641 0.468 0.379 0.367 0.390 0.326 0.371 0.366 0.420 0.465 0.389 0.299
24 0.664 0.484 0.390 0.376 0.398 0.331 0.376 0.374 0.428 0.473 0.395 0.304
25 0.683 0.498 0.401 0.385 0.406 0.337 0.380 0.378 0.435 0.480 0.400 0.307
26 0.698 0.510 0.410 0.392 0.413 0.341 0.385 0.381 0.438 0.486 0.405 0.310
27 0.710 0.519 0.417 0.399 0.419 0.345 0.388 0.384 0.441 0.488 0.408 0.312
28 0.719 0.526 0.422 0.404 0.424 0.349 0.392 0.387 0.443 0.490 0.409 0.314
29 0.725 0.531 0.427 0.408 0.428 0.352 0.395 0.389 0.446 0.492 0.410 0.315
30 0.733 0.538 0.433 0.414 0.431 0.355 0.398 0.391 0.448 0.494 0.412 0.316
This year
12 - 19 0.358 0.264 0.221 0.221 0.239 0.202 0.231 0.229 0.264 0.287 0.238 0.182
Previous year
12 - 19 0.352 0.266 0.222 0.220 0.238 0.201 0.231 0.232 0.271 0.304 0.260 0.202
2002 2003 2004 2005 2006 2007 2008 2009 2010 2011 2012 2013
0.000 0.000 0.000 0.000 0.000 0.000 0.000 0.000 0.000 0.000 0.000 0.000
0.000 0.000 0.000 0.000 0.000 0.000 0.000 0.000 0.000 0.000 0.000 0.000
0.000 0.000 0.000 0.000 0.000 0.000 0.000 0.000 0.001 0.001 0.001 0.001
0.002 0.001 0.001 0.001 0.002 0.002 0.001 0.001 0.002 0.002 0.003 0.004
0.005 0.004 0.004 0.004 0.005 0.005 0.005 0.005 0.008 0.007 0.010 0.014
0.014 0.011 0.011 0.011 0.013 0.013 0.012 0.013 0.019 0.018 0.024 0.034
0.028 0.023 0.022 0.022 0.026 0.027 0.025 0.026 0.039 0.038 0.049 0.069
0.050 0.040 0.039 0.039 0.044 0.047 0.044 0.047 0.069 0.067 0.085 0.118
0.075 0.062 0.060 0.060 0.067 0.071 0.068 0.072 0.105 0.103 0.130 0.180
0.104 0.086 0.083 0.083 0.092 0.098 0.095 0.101 0.146 0.143 0.180 0.249
0.133 0.110 0.105 0.105 0.116 0.124 0.122 0.130 0.188 0.185 0.231 0.322
0.160 0.133 0.126 0.126 0.139 0.149 0.146 0.158 0.228 0.225 0.281 0.394
0.184 0.153 0.145 0.143 0.158 0.170 0.168 0.182 0.263 0.261 0.327 0.461
0.205 0.170 0.160 0.158 0.173 0.187 0.186 0.202 0.292 0.291 0.367 0.522
0.223 0.185 0.173 0.169 0.185 0.200 0.200 0.217 0.315 0.316 0.399 0.573
0.238 0.197 0.183 0.178 0.195 0.210 0.210 0.229 0.332 0.335 0.425 0.615
0.253 0.206 0.191 0.185 0.202 0.218 0.217 0.237 0.345 0.349 0.444 0.647
0.258 0.214 0.197 0.191 0.207 0.223 0.223 0.243 0.353 0.359 0.457 0.670
0.263 0.217 0.202 0.194 0.210 0.227 0.226 0.247 0.359 0.365 0.466 0.685
0.267 0.220 0.204 0.198 0.213 0.230 0.229 0.250 0.363 0.369 0.472 0.696
0.270 0.222 0.205 0.199 0.215 0.232 0.231 0.252 0.366 0.372 0.476 0.702
0.273 0.224 0.207 0.200 0.216 0.233 0.232 0.253 0.367 0.374 0.478 0.706
0.275 0.226 0.208 0.201 0.217 0.234 0.233 0.254 0.368 0.375 0.480 0.708
0.277 0.227 0.209 0.201 0.217 0.234 0.233 0.254 0.369 0.376 0.480 0.710
0.278 0.228 0.210 0.202 0.218 0.235 0.233 0.254 0.370 0.376 0.481 0.711
0.279 0.228 0.210 0.202 0.218 0.235 0.234 0.255 0.370 0.377 0.481 0.711
0.280 0.229 0.211 0.203 0.219 0.235 0.234 0.255 0.370 0.377 0.482 0.712
0.165 0.137 0.129 0.128 0.141 0.151 0.149 0.162 0.234 0.232 0.292 0.414
0.186 0.156 0.148 0.146 0.159 0.169 0.165 0.176 0.255 0.253 0.327

ICES AFWG REPORT 2016 | 449
Table 7.8. Sebastes norvegicus in Sub-areas 1 and 2. Stock numbers, biomass, mean weight and maturity ogives as estimated by GADGET.
TOTAL STOCK MATURE IMMATURE RECRUIT CATCH
YEAR NUMBER MEAN WT BIOMASS NUMBER MEAN WT BIOMASS NUMBER MEAN WT BIOMASS AGE 3 (1000T)
(MILLIONS) (KG) (1000T) (MILLIONS) (KG) (MILLIONS) (KG) (1000T) (MILLIONS)
1986 380 0.36 137.80 92 0.76 69.8 287 0.24 68.05 4.43 30
1987 366 0.36 131.00 88 0.73 64.7 278 0.24 66.30 3.14 24
1988 348 0.36 126.07 85 0.70 60.0 262 0.25 66.05 2.30 26
1989 328 0.37 120.66 82 0.67 55.0 246 0.27 65.70 2.16 23
1990 311 0.37 113.84 79 0.63 49.7 232 0.28 64.11 2.33 28
1991 297 0.38 112.17 80 0.62 49.1 218 0.29 63.10 2.13 19
1992 283 0.40 112.51 82 0.62 50.8 202 0.31 61.67 1.74 16
1993 269 0.42 112.38 84 0.64 53.3 186 0.32 59.08 1.65 17
1994 251 0.44 110.34 84 0.66 55.1 167 0.33 55.19 1.24 18
1995 231 0.47 107.51 83 0.68 56.6 148 0.34 50.86 0.93 16
1996 209 0.50 104.14 81 0.71 57.8 128 0.36 46.33 0.58 18
1997 187 0.53 98.67 77 0.74 57.2 110 0.38 41.43 0.59 18
1998 165 0.55 91.29 72 0.76 54.9 93 0.39 36.39 0.39 19
1999 142 0.57 81.55 65 0.78 50.3 77 0.40 31.25 0.34 19
2000 123 0.60 73.46 58 0.80 46.5 64 0.42 26.97 0.26 14
2001 105 0.62 65.53 52 0.82 42.5 53 0.43 23.01 0.22 11
2002 93 0.67 62.55 49 0.86 42.3 44 0.46 20.26 0.13 10
2003 82 0.73 59.52 46 0.91 42.0 36 0.49 17.55 0.08 8
2004 72 0.79 56.36 43 0.97 41.4 29 0.52 14.96 0.09 7
2005 63 0.85 53.51 40 1.03 40.9 23 0.54 12.59 0.06 7

450 | ICES AFWG REPORT 2016
TOTAL STOCK MATURE IMMATURE RECRUIT CATCH
YEAR NUMBER MEAN WT BIOMASS NUMBER MEAN WT BIOMASS NUMBER MEAN WT BIOMASS AGE 3 (1000T)
(MILLIONS) (KG) (1000T) (MILLIONS) (KG) (MILLIONS) (KG) (1000T) (MILLIONS)
2006 62 0.81 50.21 36 1.09 39.7 26 0.41 10.53 0.77 7
2007 56 0.82 46.12 33 1.14 37.4 24 0.37 8.70 0.31 7
2008 49 0.85 42.01 29 1.20 34.8 20 0.36 7.24 0.09 7
2009 45 0.84 37.89 26 1.24 31.7 19 0.32 6.17 0.26 6
2010 42 0.81 34.17 22 1.28 28.7 19 0.28 5.48 0.32 8
2011 50 0.57 28.71 18 1.28 23.5 32 0.17 5.23 1.52 6
2012 75 0.35 26.00 16 1.24 20.0 59 0.10 6.02 3.05 6
2013 69 0.34 23.21 15 1.11 16.3 54 0.13 6.92 0.13 5.6
2014 62 0.33 20.65 14 0.94 12.7 49 0.16 7.98 0.03 4.4
2015 57 0.34 19.34 13 0.78 10.2 44 0.21 9.10 0.03 3.6

ICES AFWG REPORT 2016 | 451
Table 7.8. continued
AGE PROPORTION MATURE
4 0.037136
5 0.064873
6 0.100898
7 0.147063
8 0.205177
9 0.276624
10 0.361776
11 0.459238
12 0.565117
13 0.672747
14 0.776436
15 0.859185
16 0.921533
17 0.961288
18 0.984072
19 0.994578
20 0.998589
21 0.999702
22 0.999953
23 0.999994
24 0.999999
25-30 1

452 | ICES AFWG REPORT 2016
Figure 7.1. Sebastes norvegicus in Sub-areas 1 and 2. Total international landings 19082015 (in thou-
sand tonnes).
0
10
20
30
40
50
60
1908
1913
1918
1923
1928
1933
1938
1943
1948
1953
1958
1963
1968
1973
1978
1983
1988
1993
1998
2003
2008
2013
Lan
din
gs in
1000 t
Year

ICES AFWG REPORT 2016 | 453
Figure 7.2a. Illustration of the seasonality in the different Norwegian S. norvegicus fisheries in 2003,
2014 and 2015, also illustrating how the current regulations are working.
2003
0
100
200
300
400
500
600
700
800
1 2 3 4 5 6 7 8 9 10 11 12
Month
Ro
un
d w
eig
ht
in
ton
ne
s
Gillnet Longline Trawl Danish seine Handline
0
50
100
150
200
250
300
350
400
1 2 3 4 5 6 7 8 9 10 11 12
Ro
un
d w
eig
ht
in
ton
ne
s
Month
2014
Gillnet Longline Trawl Danish seine Handline
0
50
100
150
200
250
1 2 3 4 5 6 7 8 9 10 11 12
Ro
un
d w
eig
ht in
to
nn
es
Month
2015
Gillnet Longline Trawl Danish seine Handline

454 | ICES AFWG REPORT 2016
Figure 7.2b. Interannual changes in the Norwegian catches by fleet of S. norvegicus fisheries (2003-
2015).
Figure 7.3. Sebastes norvegicus. Length frequency of S. norvegicus reported from Norwegian catches
in subarea 1, 2.a and 2.b in 2015, all gears combined.
0
1000
2000
3000
4000
5000
6000
7000
8000
9000
2003 2005 2007 2009 2011 2013 2015
Ro
un
d w
eig
ht
(to
nn
es)
Year
Danish Seine
Handline
Longline
Gillnet
Trawl
0 %
2 %
4 %
6 %
8 %
10 %
12 %
27 32 37 42 47 52 57
Len
gth
fre
qu
en
cy
Length (cm)
I
IIa
IIb

ICES AFWG REPORT 2016 | 455
Figure 7.4a. Sebastes norvegicus. Abundance indices disaggregated by length for the Norwegian
bottom-trawl survey in the Barents Sea in winter 1986-2016 (ref. Table E2a). Top: absolute index
values, bottom: relative frequencies.
0
20
40
60
80
100
120
140
19
86
19
88
19
90
19
92
19
94
19
96
19
98
20
00
20
02
20
04
20
06
20
08
20
10
20
12
20
14
20
16
Bo
tto
m t
raw
l in
de
x
Mill
ion
s
>45.0
40.0-44.9
35.0-39.9
30.0-34.9
25.0-29.9
20.0-24.9
15.0-19.9
10.0-14.9
0 %
10 %
20 %
30 %
40 %
50 %
60 %
70 %
80 %
90 %
100 %
19
86
19
88
19
90
19
92
19
94
19
96
19
98
20
00
20
02
20
04
20
06
20
08
20
10
20
12
20
14
20
16
Bo
tto
m t
raw
l in
dex
(in
%)
>45.0
40.0-44.9
35.0-39.9
30.0-34.9
25.0-29.9
20.0-24.9
15.0-19.9
10.0-14.9
456 | ICES AFWG REPORT 2016
Figure 7.4b. Sebastes norvegicus. Abundance indices (by age) from the Norwegian bottom-trawl
surveys 1992-2015 in the Barents Sea (ref. Table E2b). Top: absolute index, bottom: relative frequen-
cies. Horizontal line indicates the median age of the surveyed population.
0
20
40
60
80
100
19
92
19
94
19
96
19
98
20
00
20
02
20
04
20
06
20
08
20
10
20
12
20
14
Bo
tto
m t
raw
l in
de
x
Mill
ion
s
16+
14-15
12-13
10-11
8-9
6-7
4-5
2-3
0 %
10 %
20 %
30 %
40 %
50 %
60 %
70 %
80 %
90 %
100 %
19
92
19
94
19
96
19
98
20
00
20
02
20
04
20
06
20
08
20
10
20
12
20
14
Bo
tto
m t
raw
l in
dex
(in
%)
16+
14-15
12-13
10-11
8-9
6-7
4-5
2-3

ICES AFWG REPORT 2016 | 457
Figure 7.5a. Sebastes norvegicus. Abundance indices disaggregated by length when combining the
Norwegian bottom-trawl surveys 19862015 in the Barents Sea (winter) and at Svalbard (sum-
mer/fall). Top: absolute index values. Bottom: relative frequencies. Horizontal line indicates the
median length in the surveyed population.
0
20
40
60
80
100
120
140
160
19
86
19
88
19
90
19
92
19
94
19
96
19
98
20
00
20
02
20
04
20
06
20
08
20
10
20
12
20
14
Bo
tto
m t
raw
l in
de
x
Mill
ion
s
>45.0
40.0-44.9
35.0-39.9
30.0-34.9
25.0-29.9
20.0-24.9
15.0-19.9
10.0-14.9
0 %
10 %
20 %
30 %
40 %
50 %
60 %
70 %
80 %
90 %
100 %
19
86
19
88
19
90
19
92
19
94
19
96
19
98
20
00
20
02
20
04
20
06
20
08
20
10
20
12
20
14
Bo
tto
m t
raw
l in
dex
(in
%)
>45.0
40.0-44.9
35.0-39.9
30.0-34.9
25.0-29.9
20.0-24.9
15.0-19.9
10.0-14.9

458 | ICES AFWG REPORT 2016
Figure 7.5b. Sebastes norvegicus. Abundance indices disaggregated by age. Combined Norwegian
bottom-trawl surveys 19922015 in the Barents Sea (winter) and Svalbard survey (summer/fall). Top:
absolute index values, bottom: relative frequencies. Horizontal line indicates median age of the
surveyed population. In 2009-2011 and 2014-2015, there was insufficient number of age readings to
derive numbers-at-age
0
50
100
150
19
92
19
94
19
96
19
98
20
00
20
02
20
04
20
06
20
08
20
10
20
12
20
14
Bo
tto
m t
raw
l in
de
x
Mill
ion
s
16+
14-15
12-13
10-11
8-9
6-7
4-5
2-3
0 %
10 %
20 %
30 %
40 %
50 %
60 %
70 %
80 %
90 %
100 %
19
92
19
94
19
96
19
98
20
00
20
02
20
04
20
06
20
08
20
10
20
12
20
14
Bo
tto
m t
raw
l in
dex
(in
%)
16+
14-15
12-13
10-11
8-9
6-7
4-5
2-3

ICES AFWG REPORT 2016 | 459
Figure 7.6. Sebastes norvegicus in Sub-areas 1 and 2. Results from the Gadget assessment compared
to the scientific survey. The Figure shows comparison of observed and modelled survey indices
(total number scaled to sum=100 during the time period) – the traditional Barents Sea February
survey Dots: survey indices. Plain lines: survey indices estimated by the model.
sc
ale
d s
urv
ey i
nd
ex
year
Comparison between real and model survey index
model
survey (%)
460 | ICES AFWG REPORT 2016
Figure 7.7a. Proportion maturity-at-age of S. norvegicus in subareas 1 and 2 derived from Norwegian
commercial and survey data (Table E4). The proportions were derived from samples with at least
five individuals.

ICES AFWG REPORT 2016 | 461
Figure 7.7b. Sebastes norvegicus in Sub-areas 1 and 2. Estimates of maturity-at-age by Gadget. Input
data have been proportions of S. norvegicus mature both at age and length as collected and classi-
fied from Norwegian commercial landings and surveys.
Figure 7.8. Sebastes norvegicus in subareas 1 & 2. Unweighted average fishing mortality of ages 1219
as estimated by Gadget in 2016 (solid line) and at the 2014 AFWG.
0
0.2
0.4
0.6
0.8
1
1.2
0 5 10 15 20 25 30
pro
po
rtio
n m
atu
re
age
Proportion mature at age
F
year
Modelled F
This year
Previousyear

462 | ICES AFWG REPORT 2016
Figure 7.9. Sebastes norvegicus in Sub-areas 1 and 2. Estimates of abundance at age 3-6 by Gadget
using two surveys as input. Gadget outputs provided in 2014 are shown as dotted line. Current
results are shown as plain lines.
nu
mb
er
(10,0
00)
year
redfish age 3-6

ICES AFWG REPORT 2016 | 463
Figure 7.10. Sebastes norvegicus in Sub-areas 1 and 2. Stock numbers (in thousands) and biomass
(in tonnes) for the total stock (3+) (upper panel), and the fishable and mature stock (middle panel),
and the immature stock (lower panel), as estimated by Gadget using two surveys as input. Gadget
outputs provided in 2014 are shown as dotted lines. Current results are shown as plain lines.

464 | ICES AFWG REPORT 2016
Figure 7.11. 7 year retrospective plots for the S. norvegicus Gadget model.
0
10
20
30
40
50
60
70
80
1985 1990 1995 2000 2005 2010 2015 2020
Axi
s Ti
tle
Axis Title
Mature biomass
to 2009
to 2010
to 2011
to 2012
to 2013
to 2014
to 2015
0
10
20
30
40
50
60
70
80
1985 1990 1995 2000 2005 2010 2015 2020
Axi
s Ti
tle
Axis Title
Immature biomass
to 2009
to 2010
to 2011
to 2012
to 2013
to 2014
to 2015
0
20
40
60
80
100
120
140
160
1985 1990 1995 2000 2005 2010 2015 2020
Axi
s Ti
tle
Axis Title
Total stock biomass
to 2009
to 2010
to 2011
to 2012
to 2013
to 2014
to 2015
0
10
20
30
40
50
60
1985 1990 1995 2000 2005 2010 2015 2020
Axi
s Ti
tle
year
Recruits at age 3
to 2009
to 2010
to 2011
to 2012
to 2013
to 2014
to 2015
0
0.05
0.1
0.15
0.2
0.25
0.3
0.35
0.4
0.45
1990 1995 2000 2005 2010 2015
Axi
s Ti
tle
Axis Title
F retro
2009
2010
2011
2012
2013
2014
2015

ICES AFWG REPORT 2016 | 465
Table E1a. Sebastes norvegicus in Sub-areas 1 and 2. Abundance indices - on length - from the bot-
tom-trawl surveys in the Barents Sea (Division 2.a) in the winter 1986-2016 (numbers in millions).
The area coverage was extended from 1993.
LENGTH GROUP (CM)
YEAR 5.0-
9.9
10.0-
14.9
15.0-
19.9
20.0-
24.9
25.0-
29.9
30.0-
34.9
35.0-
39.9
40.0-
44.9
>45.0 TOTAL
1986 3.0 11.7 26.4 34.3 17.7 21.0 12.8 4.4 2.6 133.9
1987 7.7 12.7 32.8 7.7 6.4 3.4 3.8 3.8 4.2 82.5
1988 1.0 5.6 5.5 14.2 12.6 7.3 5.2 4.1 3.7 59.2
1989 48.7 4.9 4.3 11.8 15.9 12.2 6.6 4.8 3.0 112.2
1990 9.2 5.3 6.5 9.4 15.5 14.0 8.0 4.0 3.4 75.3
1991 4.2 13.6 8.4 19.4 18.0 16.1 14.8 6.0 4.0 104.5
1992 1.8 3.9 7.7 20.6 19.7 13.7 10.5 6.6 5.8 90.3
1993 0.1 1.2 3.5 6.9 10.3 14.5 12.5 8.6 6.3 63.9
1994 0.7 6.5 9.3 11.7 11.5 19.4 9.1 4.4 2.8 75.4
1995 0.6 5.0 13.1 11.5 9.1 15.9 17.2 10.9 4.7 88.0
1996 + 0.7 3.5 6.4 9.4 11.7 16.6 7.9 3.9 60.1
19971 - 0.5 1.3 2.7 6.9 21.4 28.2 8.5 3.3 72.7
19981 0.1 3.9 2.0 7.4 5.8 25.3 13.2 7.0 2.3 67.0
1999 0.2 0.9 2.1 4.0 4.6 6.4 6.0 5.3 3.5 33.0
2000 0.5 1.1 1.5 4.2 4.7 5.0 3.5 1.8 1.2 24.0
2001 0.1 0.4 0.4 2.4 5.8 5.6 5.0 3.5 1.8 25.0
2002 0.1 1.0 1.9 1.7 3.7 4.1 3.3 3.6 2.5 22.0
2003 0.0 0.5 1.2 1.5 4.3 3.8 2.7 3.3 2.9 20.2
2004 0.7 0.2 0.4 1.0 2.9 4.4 5.5 4.0 3.2 22.3
2005 + 0.1 0.2 0.4 1.1 2.0 3.7 4.6 4.3 16.4
2006 0.0 0.0 0.0 0.2 2.5 5.4 6.1 4.1 4.2 22.5
2007 0.0 0.1 0.5 0.1 1.0 4.0 5.4 5.9 4.9 21.9
2008 1.8 2.6 0.2 0.2 0.4 0.7 1.9 2.5 4.4 14.8
2009 0.0 0.0 0.1 0.0 0.0 0.4 1.7 3.7 6.6 12.7
2010 0.4 2.0 1.2 0.6 0.1 0.1 0.8 1.1 3.9 10.3
2011 0.3 3.1 2.1 0.3 0.4 0.1 0.3 2.3 5.2 14.1
2012 0.8 4.4 4.0 1.9 0.6 0.3 0.9 3.6 8.3 24.8
2013 0.0 7.4 4.9 4.0 1.6 0.4 0.9 0.8 3.7 23.8
2014 0.1 1.1 1.5 3.0 3.4 1.0 0.5 1.4 4.0 16.0
2015 0.1 0.9 1.5 3.1 2.6 2.0 0.5 0.7 3.4 14.8
2016 0.8 1.3 1.5 2.4 4.2 3.6 3.4 1.7 5.9 24.7
1 - Adjusted indices to account for not covering the Russian EEZ in Subarea 1
466 | ICES AFWG REPORT 2016
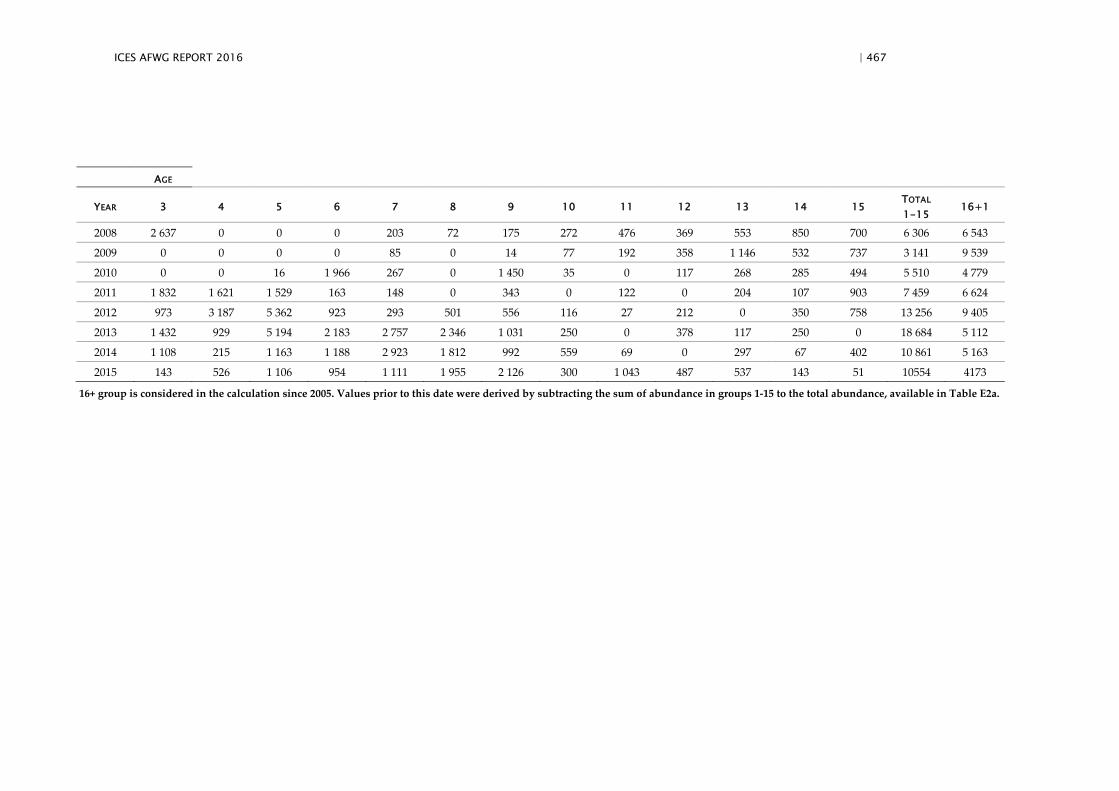
Table E1b. Sebastes norvegicus in Sub-areas 1 and 2. Norwegian bottom-trawl indices - on age - from the annual Barents Sea survey in February 1992–2015 (numbers in thousands).
The area coverage was extended from 1993 onwards.
AGE
YEAR 3 4 5 6 7 8 9 10 11 12 13 14 15 TOTAL
1-15 16+1
1992 2 295 4 261 10 760 2 043 1 474 13 178 4 230 6 302 8 251 3 751 3 865 3 064 3 568 67 042 23 300
1993 468 1 218 1 424 2 020 979 5 048 2 968 4 230 2 142 4 634 3 338 2 951 9 148 40 568 23 300
1994 2 951 4 485 2 573 3 801 8 338 3 254 1 297 7 231 6 443 248 10 192 6 341 2 612 59 766 15 600
1995 2 540 7 450 6 090 7 150 5 820 6 590 5 670 2 000 4 440 6 500 4 320 5 330 6 030 69 930 18 100
1996 310 1 300 2 340 3 520 3 660 8 720 5 650 3 960 6 590 5 730 6 230 4 070 2 950 55 030 5 100
1997 190 80 360 1 320 2 530 5 370 10 570 6 840 5 810 7 390 8 790 9 740 1 980 60 980 11 700
1998 2 380 1 930 850 660 1 140 7 090 6 124 4 962 4 091 5 190 8 790 2 730 2 560 48 487 18 500
1999 737 916 1 246 3 469 1 650 1 826 1 679 3 084 2 371 2 953 3 837 2 132 1 979 27 879 5 100
2000 490 720 900 1 310 1 800 2 440 2 020 2 710 2 090 940 1 440 2 940 430 20 230 3 800
2001 320 170 190 940 1 360 2 220 3 110 2 400 2 690 2 230 2 180 1 200 1 370 20 380 4 600
2002 130 910 902 1 590 544 1 546 2 153 1 822 1 900 2 220 1 073 1 294 1 730 17 814 4 200
2003 220 250 590 1 080 680 1 020 2 910 1 180 2 250 1 370 1 530 840 1 310 15 230 5 000
2004 780 100 100 90 240 540 1 130 1 260 1 590 1 740 1 490 2 570 1 890 13 520 8 800
2005 39 85 107 110 321 524 669 497 697 820 1 517 1 905 1 653 8 944 7 652
2006 0 0 0 24 52 1 011 1 641 1 999 2 246 1 578 1 550 3 487 1 444 15 030 7 666
2007 58 202 248 50 51 185 422 582 592 1 747 1 030 1 127 1 359 7 652 14 248
ICES AFWG REPORT 2016 | 467
AGE
YEAR 3 4 5 6 7 8 9 10 11 12 13 14 15 TOTAL
1-15 16+1
2008 2 637 0 0 0 203 72 175 272 476 369 553 850 700 6 306 6 543
2009 0 0 0 0 85 0 14 77 192 358 1 146 532 737 3 141 9 539
2010 0 0 16 1 966 267 0 1 450 35 0 117 268 285 494 5 510 4 779
2011 1 832 1 621 1 529 163 148 0 343 0 122 0 204 107 903 7 459 6 624
2012 973 3 187 5 362 923 293 501 556 116 27 212 0 350 758 13 256 9 405
2013 1 432 929 5 194 2 183 2 757 2 346 1 031 250 0 378 117 250 0 18 684 5 112
2014 1 108 215 1 163 1 188 2 923 1 812 992 559 69 0 297 67 402 10 861 5 163
2015 143 526 1 106 954 1 111 1 955 2 126 300 1 043 487 537 143 51 10554 4173
16+ group is considered in the calculation since 2005. Values prior to this date were derived by subtracting the sum of abundance in groups 1-15 to the total abundance, available in Table E2a.

468 | ICES AFWG REPORT 2016
Table E2a. Sebastes norvegicus in Subarea 1 and 2. Abundance indices - on length - from the bottom-
trawl survey in the Svalbard area (Division 2.b) in summer/fall 1985–2015 (numbers in thousands).
LENGTH GROUP (CM)
YEAR 5.0-
9.9
10.0-
14.9
15.0-
19.9
20.0-
24.9
25.0-
29.9
30.0-
34.9
35.0-
39.9
40.0-
44.9
>45.0 TOTAL
19851 - 1 307 795 1 728 2 273 1 417 311 142 194 8 325
19861 200 2 961 1 768 547 643 1 520 639 467 196 8 941
19871 100 1 343 1 964 1 185 1 367 652 352 29 44 7 060
19881 500 1 001 1 953 1 609 684 358 158 68 95 6 450
1989 200 1 629 2 963 2 374 1 320 846 337 323 104 10 100
1990 1 700 3 886 4 478 4 047 2 972 1 509 365 140 122 19 185
1991 100 5 371 5 821 9 171 8 523 4 499 1 531 982 395 36 420
1992 1 700 10 228 8 858 5 330 13 960 12 720 4 547 494 346 58 172
1993 200 10 160 9 078 5 855 7 071 4 327 2 088 1 552 948 41 284
1994 100 3 340 5 883 4 185 3 922 3 315 1 021 845 423 22 985
1995 470 2 000 9 100 5 070 3 060 2 400 1 040 920 780 24 840
1996 80 130 1 260 2 480 1 030 480 550 990 400 7 400
1997 0 810 1 980 5 470 5 560 2 340 590 190 450 17 430
1998 180 2 698 1 741 4 620 4 053 1 761 535 545 241 16 403
1999 0 794 7 057 3 698 4 563 2 449 467 619 369 20 017
2000 40 360 1 240 1 390 2 010 760 400 160 390 6 750
2001 10 110 790 1 470 3 710 4 600 1 880 680 370 13 660
2002 0 0 64 415 459 880 620 565 519 3 522
2003 90 90 108 83 525 565 447 760 769 3 437
2004 0 0 10 50 650 740 670 430 190 2 740
2005 0 45 0 30 315 384 307 159 274 1 513
2006 0 0 70 64 167 376 473 735 1 514 3 398
2007 0 32 58 1 003 1 049 3 875 4 656 811 1 267 12 751
2008 7 009 3 573 175 21 42 142 475 162 529 12 130
2009 227 1 476 114 114 0 0 185 213 193 2 522
2010 666 917 1 506 522 0 117 172 0 985 4 885
2011 0 0 681 33 0 0 0 131 568 1 413
2012 0 85 1 512 2 138 2 145 327 32 0 133 6 372
2013 48 437 1 971 3 239 2 564 412 152 33 392 9 248
2014 47 0 316 130 223 443 208 0 452 1819
2015 0 0 0 206 193 276 768 0 651 2094
1 - Old trawl equipment (bobbins gear and 80 meter sweep length)
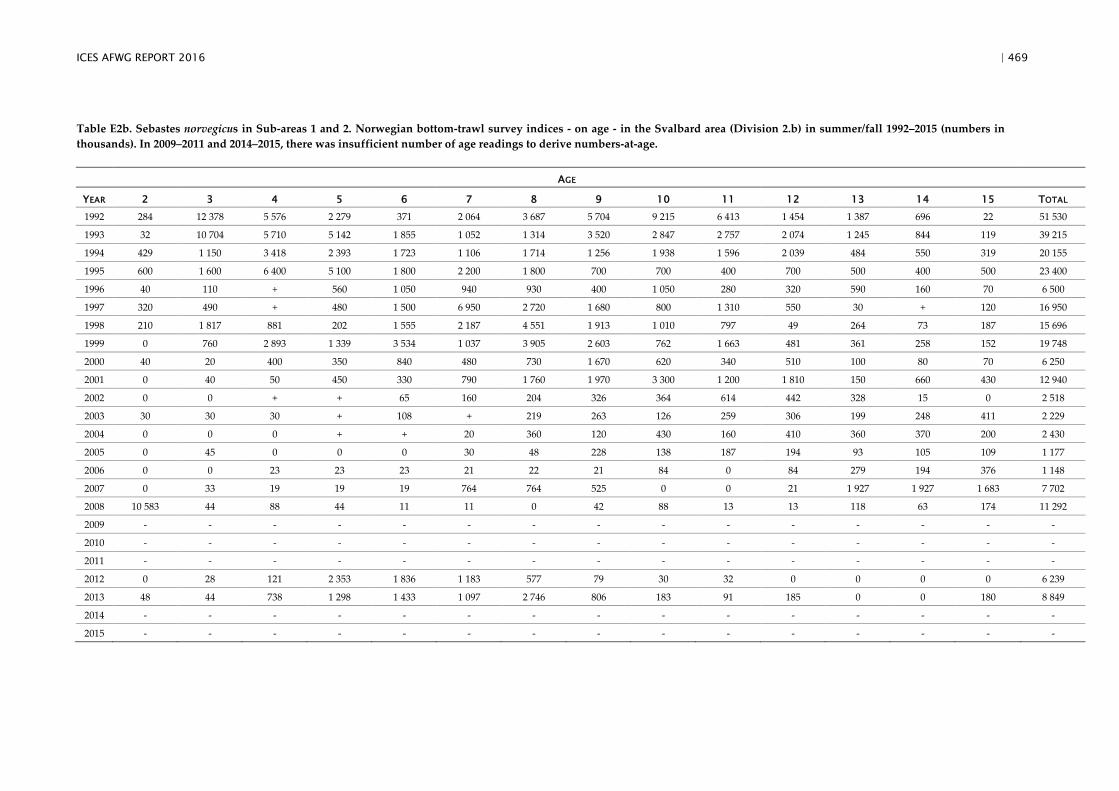
ICES AFWG REPORT 2016 | 469
Table E2b. Sebastes norvegicus in Sub-areas 1 and 2. Norwegian bottom-trawl survey indices - on age - in the Svalbard area (Division 2.b) in summer/fall 1992–2015 (numbers in
thousands). In 2009–2011 and 2014–2015, there was insufficient number of age readings to derive numbers-at-age.
AGE
YEAR 2 3 4 5 6 7 8 9 10 11 12 13 14 15 TOTAL
1992 284 12 378 5 576 2 279 371 2 064 3 687 5 704 9 215 6 413 1 454 1 387 696 22 51 530
1993 32 10 704 5 710 5 142 1 855 1 052 1 314 3 520 2 847 2 757 2 074 1 245 844 119 39 215
1994 429 1 150 3 418 2 393 1 723 1 106 1 714 1 256 1 938 1 596 2 039 484 550 319 20 155
1995 600 1 600 6 400 5 100 1 800 2 200 1 800 700 700 400 700 500 400 500 23 400
1996 40 110 + 560 1 050 940 930 400 1 050 280 320 590 160 70 6 500
1997 320 490 + 480 1 500 6 950 2 720 1 680 800 1 310 550 30 + 120 16 950
1998 210 1 817 881 202 1 555 2 187 4 551 1 913 1 010 797 49 264 73 187 15 696
1999 0 760 2 893 1 339 3 534 1 037 3 905 2 603 762 1 663 481 361 258 152 19 748
2000 40 20 400 350 840 480 730 1 670 620 340 510 100 80 70 6 250
2001 0 40 50 450 330 790 1 760 1 970 3 300 1 200 1 810 150 660 430 12 940
2002 0 0 + + 65 160 204 326 364 614 442 328 15 0 2 518
2003 30 30 30 + 108 + 219 263 126 259 306 199 248 411 2 229
2004 0 0 0 + + 20 360 120 430 160 410 360 370 200 2 430
2005 0 45 0 0 0 30 48 228 138 187 194 93 105 109 1 177
2006 0 0 23 23 23 21 22 21 84 0 84 279 194 376 1 148
2007 0 33 19 19 19 764 764 525 0 0 21 1 927 1 927 1 683 7 702
2008 10 583 44 88 44 11 11 0 42 88 13 13 118 63 174 11 292
2009 - - - - - - - - - - - - - - -
2010 - - - - - - - - - - - - - - -
2011 - - - - - - - - - - - - - - -
2012 0 28 121 2 353 1 836 1 183 577 79 30 32 0 0 0 0 6 239
2013 48 44 738 1 298 1 433 1 097 2 746 806 183 91 185 0 0 180 8 849
2014 - - - - - - - - - - - - - - -
2015 - - - - - - - - - - - - - - -

470 | ICES AFWG REPORT 2016
Table E3. Sebastes norvegicus in Sub-area 1 and 2. Mean catch rates (Num/NM2) of Sebastes norvegicus from Norwegian Coastal Surveys (Division 2.a) in 1995-2010 within 100-350 m
depth. Catch rates for the total area.
LENGTH
RANGE
(CM)
0-4
5-9
10
-1
4
15
-1
9
20
-2
4
25
-2
9
30
-3
4
35
-3
9
40
-4
4
45
-4
9
50
-5
4
55
-5
9
60
-6
4
# H
AU
LS
TO
TA
L.D
IST
AN
CE (
NM
)
# F
ISH
CA
UG
HT
# F
ISH
SA
MPLED
AR
EA
(N
M^
2)
1995 0 41 118 59 54 38 69 214 157 21 2 1 0
1996 0 34 87 124 151 67 210 415 209 64 0 0 0
1997 0 4 9 12 64 112 96 178 190 45 2 1 0
1998 0 0 0 4 12 16 17 110 96 18 3 0 0
1999 0 0 19 242 160 34 43 151 117 15 4 2 0
2000 0 0 2 13 7 10 30 160 155 30 4 0 0
2001 0 0 2 11 14 22 15 83 160 30 2 0 0
2002 0 0 0 0 2 6 29 259 213 26 4 1 0
2003 0 0 6 10 43 66 49 219 225 55 6 1 2 123 160 1367 1053 43574
2004 0 1 3 6 21 66 35 351 552 42 3 1 0 104 130 1290 950 43574
2005 0 1 5 5 30 46 48 190 171 37 1 0 0 99 132 833 780 43574
2006 0 0 3 0 2 3 30 145 256 66 9 0 0 112 112 771 680 43574
2007 0 0 0 0 4 7 17 129 177 29 1 0 0 131 140 637 637 43574
2008 0 4 5 1 4 5 17 363 490 99 12 2 0 110 140 1156 850 43574
2009 0 0 8 3 10 19 45 808 945 109 14 1 0 109 127 2945 581 43574
2010 0 40 78 20 9 1 3 67 214 99 7 2 0 117 136 833 690 43574
ICES AFWG REPORT 2016 | 471
Table E4. Proportion of maturity-at-age 5 – 30 in S. norvegicus in subareas 1 and 2 derived from
Norwegian commercial and survey data. The proportions were derived from samples with at least
five individuals.
YEAR AGE5 AGE6 AGE7 AGE8 AGE9 AGE10 AGE11 AGE12 AGE13 AGE14 AGE15 AGE16 AGE17 AGE18
1992 0.00 0.00 0.09 0.15 0.31 0.22 0.21 0.20 0.22 0.26 0.30 0.44 0.45 0.47
1993 - - 0.00 0.00 0.10 0.29 0.54 0.47 0.53 0.67 0.80 0.75 0.78 0.82
1994 0.00 0.00 0.03 0.05 0.28 0.28 0.32 0.70 0.79 0.91 0.94 0.85 0.92 1.00
1995 0.00 0.00 0.00 0.05 0.02 0.22 0.25 0.48 0.61 0.64 0.68 0.80 0.87 0.88
1996 0.00 0.05 0.14 0.13 0.22 0.38 0.43 0.60 0.64 0.75 0.69 0.77 0.90 0.85
1997 0.00 0.05 0.08 0.15 0.17 0.21 0.34 0.35 0.57 0.64 0.72 0.73 0.85 0.93
1998 0.00 0.00 0.03 0.11 0.09 0.26 0.32 0.49 0.52 0.69 0.74 0.77 0.81 0.91
1999 0.00 0.00 0.00 0.04 0.17 0.35 0.22 0.53 0.73 0.71 0.67 0.69 0.74 0.71
2000 0.00 0.08 0.14 0.25 0.40 0.51 0.59 0.62 0.65 0.69 0.78 0.96 0.96 1.00
2001 - 0.00 0.06 0.14 0.28 0.32 0.40 0.52 0.53 0.60 0.76 0.74 0.81 0.85
2002 - 0.00 0.05 0.07 0.23 0.44 0.41 0.63 0.74 0.93 0.77 0.89 0.90 0.94
2003 - 0.00 0.00 0.05 0.13 0.24 0.24 0.47 0.58 0.68 0.75 0.65 0.77 0.78
2004 - 0.00 0.03 0.07 0.13 0.43 0.21 0.51 0.46 0.63 0.64 0.86 0.82 0.96
2005 - - 0.00 0.05 0.29 0.18 0.34 0.39 0.39 0.56 0.73 0.81 0.79 0.82
2006 - - 0.00 0.10 0.06 0.22 0.25 0.39 0.47 0.57 0.67 0.67 0.74 0.86
2007 - - 0.00 0.08 0.30 0.25 0.24 0.66 0.68 0.70 0.88 0.86 0.89 0.99
2008 - - 0.80 0.25 0.82 0.68 0.62 0.80 0.79 0.86 0.88 0.91 0.90 0.92
2009 - - - - - 0.50 0.50 1.00 0.93 0.81 0.86 0.86 0.84 0.86
2010 - - - - - - - - 0.57 0.53 0.77 0.89 0.33 0.82
2011 - - - - - - - - - - 0.73 0.78 0.94 0.93
2012 0.00 0.11 0.10 0.29 0.20 0.20 - - - 0.75 0.72 0.70 0.91 0.78
2013 0.00 0.12 0.05 0.10 0.19 0.38 0.71 - 0.29 0.82 0.92 0.89 0.77 0.86
YEAR AGE19 AGE20 AGE21 AGE22 AGE23 AGE24 AGE25 AGE26 AGE27 AGE28 AGE29 AGE30
1992 0.45 0.62 0.51 0.63 0.76 0.60 0.57 0.60 0.68 0.74 0.82 0.80
1993 0.91 0.85 0.82 0.87 0.75 0.91 1.00 1.00 1.00 1.00 1.00 1.00
1994 0.96 0.96 1.00 0.88 1.00 1.00 1.00 1.00 - 1.00 1.00 -
1995 0.76 0.89 0.90 0.91 1.00 1.00 1.00 1.00 - - - -
1996 0.91 0.88 0.96 0.93 1.00 0.87 0.95 0.95 1.00 - 1.00 0.86
1997 0.94 1.00 1.00 0.95 0.89 0.94 0.93 0.89 1.00 1.00 1.00 -
1998 0.89 0.86 1.00 1.00 0.67 0.70 1.00 1.00 - - 1.00 0.88
1999 0.77 0.89 - 0.83 - 1.00 0.89 - - - - -
2000 1.00 - - - 1.00 - - - - - - -
2001 0.60 0.70 0.56 - - - - - - - - -
2002 0.96 0.92 0.95 0.95 1.00 1.00 1.00 1.00 1.00 1.00 1.00 -
2003 0.93 0.96 0.94 0.67 1.00 - 1.00 - - - - -
2004 0.92 0.95 0.89 0.88 1.00 0.86 1.00 - - - - -
2005 0.77 0.94 0.95 0.88 0.83 1.00 - 1.00 - - - -
2006 0.83 0.97 0.79 0.95 0.81 1.00 - 1.00 - - - -
2007 0.98 1.00 0.96 0.94 1.00 0.92 1.00 0.83 1.00 1.00 1.00 -
2008 0.92 0.90 0.93 0.93 0.94 1.00 1.00 1.00 1.00 1.00 0.93 1.00
2009 0.88 0.95 0.89 0.95 0.92 0.95 0.86 0.93 1.00 0.93 0.83 0.86
2010 0.82 0.92 0.86 0.80 1.00 0.63 0.80 0.80 0.86 - 0.67 -
2011 0.89 0.92 0.92 0.93 0.83 0.85 1.00 1.00 - 0.83 - -
2012 0.88 0.89 0.85 0.81 0.95 0.81 0.86 1.00 0.93 1.00 1.00 1.00
2013 0.75 0.79 0.71 0.83 0.88 0.95 1.00 0.63 1.00 1.00 1.00 1.00

472 | ICES AFWG REPORT 2016
Figure E1. Sebastes norvegicus in Sub-areas 1 and 2. Yield-per-recruit for S. norvegicus, computed
from the base case GADGET model presented at the benchmark assessment in February 2012
(WKRED).

ICES AFWG REPORT 2016 | 473
Figure E2. Overview of the Norwegian biological age samples (number individuals, number
hauls/sets, number of boats) from the commercial fisheries for S. norvegicus in 2013 representing
more than 80% of the catches and which the input data to the Gadget model are based upon. The
colours denote which sampling platform has been used: High Seas Reference fleet, port sampling,
Coast guard, Coastal Reference Fleet, or inspectors/observers at sea. The green crosses show the
catch in tonnes for the different seasons, areas and gears.


![Supplementary Table 1 - hnRNP K co-immunoprecipitated ... · Elmo3 Rattus norvegicus engulfment and cell motility 3 (Elmo3), mRNA [NM_001030028] 97.64 Grlf1 PREDICTED: Rattus norvegicus](https://img.dokumen.tips/doc/110x75/5f165050ace2765afb16af7c/supplementary-table-1-hnrnp-k-co-immunoprecipitated-elmo3-rattus-norvegicus.jpg)