Embed Size (px)
Citation preview

J . Phys. Chem. 1990, 94, 3531-3539 3531
the =C-F fluorines with chlorines, for example, the wavenumber drops20 even when the C=C force constant is essentially un- ~ h a n g e d . ~ ’
In both experimental studies20J4 two a l bands near 1400 cm-I were assigned based partly on the polarized nature of these bands in the Raman spectrum. Important indications of our theoretical calculations are (a) there should be only one a l fundamental a t around 1400 cm-’ ( v J , (b) the highest b2 fundamental (q8) should also be placed in this region, (c) u3 (the third a , fundamental) is about 1150 cm-’ and has a very high depolarization ratio suggesting that it could be observed as depolarized in the Raman, and (d) still another b2 fundamental should be found at a wavenumber as high as 1320 cm-’ ( u 1 9 ) . It is disturbing that the experimental studies show all the bands around 1400 cm-’ (1420, 1383, and 1375 cm-I; KNP) to be definitely polarized in the Raman; one possible candidate, however, as a combination band around 1380 cm-I is -980 cm-’ (b,) + -420 cm-’ (b2).
The present theoretical results further suggest that the highest a2 and b, fundamentals a t HFCB are fairly near each other with wavenumbers about I200 cm-I. Thus, a band should be found in both the IR and Raman spectra of HFCB in this region. Furthermore, according to the calculated intensities, the highest b, fundamental ( ~ 1 4 ) should have the greatest intensity in the IR spectrum. The strongest and in the 1140-1340-~m-~ region is at
1174 cm-I in the gas. Thus it seems reasonable to assign the band at 1 174 cm-’ to ~ 1 4 and a somewhat higher wavenumber to v9.
The calculations are perfectly in line with all but three of KNPs assignments below 1000 cm-I. The exceptions are uIo ( N 120 cm-I), vI5 (-70 cm-I), and u2, (-70 cm-I), where the differences in parentheses are theoretical minus experimental. It is very likely that the assignment of ul0 should be revised: however, experimental verification could be complicated by the fact that calculation predicts this band to almost coincide with us. The experimental assignment of u l S was quite uncertain: and the calculation predicts that it should be at a somewhat higher wavenumber. Lastly, from past experience it is quite unlikely that a force field calculation at the Hartree-Fock SCF level for a molecule like HFCB would place a fundamental a t too low a wavenumber, which suggests a new assignment for v~~ may be in order.
Acknowledgment. This work was supported by the National Science Foundation under Grants CHE84-11165 and CHE88- 10070 to Oregon State University. We are grateful to the College of Science of OSU for a generous grant of computing time.
Supplementary Material Available: From each plate: tables of total intensities, final backgrounds, and molecular intensities (15 pages). Ordering information is given on any current masthead page.
7-Azaindole and Its Clusters with Ar, CH,, H,O, NH,, and Alcohols: Molecular Geometry, Cluster Geometry, and Nature of the First Excited Singlet Electronic State
Seong K. Kim and Elliot R . Bernstein*
Chemistry Department, Colorado State University, Fort Collins, Colorado 80523 (Received: September 1 1 , 1989)
Mass-resolved excitation vibronic spectra of jet-cooled 7-azaindole and its clusters with Ar, CH,, NH,, H20, D20, CH,OH, and C2H50H are reported and analyzed with regard to molecular and cluster geometry and the nature of the first excited singlet state. Large changes in the various spectra are observed upon clustering and upon deuteration of 7-azaindole. The observed vibronic spectra of both 7-azaindole and its clusters can be rationalized with two general assumptions: (1) the hydrogen attached to the pyrrole nitrogen of 7-azaindole is out of the molecular plane in the first excited singlet state: and (2) the observed spectra are characterized by strong na*--?Ta* mixing not completely removed by the clustering. MOPACS calculations of molecular geometry suggest that the SI state is nonplanar. Additional cluster potential energy calculations suggest that the formation of cyclic hydrogen-bonded clusters is not likely for these gas-phase 1: 1 or 1.2 7-azaindole/solvent clusters: the major gas-phase solvent clustering probably takes place at the a-system of the 7-azaindole molecule.
I. Introduction 7-Azaindole (see Figure la, 7AZI) is suggested to have two
very interesting and important properties in solution: (1) when solvated by hydrogen-bonding solvents (such as water, alcohols, ammonia, or even itself), it is thought to form a cyclic structure through a double hydrogen bond (Figure lb);1-3 and (2) it will tautomerize (Figure IC) in protic solvent solutions via a cyclic hydrogen-bonded intermediate.1*2*e8 Such behavior is suggestive
( I ) Taylor, C. A.; El-Bayoumi, M. A,; Kasha, M. Proc. Natl. Acad. Sci.
(2) Ingham, K. C.; El-Bayoumi, M. A. J . Am. Chem. SOC. 1974.96, 1674. (3) Staglich, P.: Zander, M. Z . Naturforsch. 1976, 310, 1391. (4) Tokumura, K.; Watanabe, Y.; Itoh, M. J . Phys. Chem. 1986,90,2362.
Tokumura, K.; Watanabe, Y.; Udagawa, M.; Itoh, M. J . Am. Chem. SOC. 1987, 109, 1346.
(5) bulska, H.; Chodkowsks, A. J . Am. Chem. SOC. 1980, 80, 3259. (6) Hetherington, W. M.; Micheels. R. M.; Eisenthal, K. B. Chem. Phys.
U.S.A. 1969.63, 253.
Lett. 1979, 66, 230.
0022-3654 19012094-353 1$02.50 10
of the behavior of DNA bases,g and thus, 7AZI has been a particularly attractive and compelling system for study.
Spectra of isolated 7AZI and/or 7AZI clustered with various hydrogen-bonding and non-hydrogen-bonding solvents should aid in the elucidation of the energetics and dynamics involved in both the cyclic hydrogen-bonded solvation structures and in the tau- tomerization process. Supersonic jet expansion techniques coupled with laser spectroscopy and mass resolution (mass-resolved ex- citation spectroscopy) are, of course, an excellent experimental approach to the study of molecular and cluster structure and energetics. Through these techniques coupled with state of the art molecular orbital semiemperical calculations and potential energy cluster structure calculations, a good deal can be learned
(7 ) McMorrow, D.; Aartsma, T. J . Chem. Phys. Left. 1986, 125, 581. (8) Moog, R. S.; Bovino, S. C.; Simon, J . C. J . Phys. Chem. 1988, 92,
(9) Cantor, C. R.; Schimmel, P. R. Biophysical Chemistry I; Freeman: 6545.
San Francisco, CA, 1980.
0 1990 American Chemical Society

3532 The Journal of Physical Chemistry, Vol. 94, No. 9, 1990
a 1) C
Kim and Bernstein
Hio H
Figure 1. Structures of (a) 7AZI and (b) 7AZI/water cluster with a double-hydrogen-bonding structure, and (c) (7AZI), and its possible tautomerization. The numbering on atoms in a is used in describing atoms in text and in Tables 11, 111, and IV.
about bare molecular and cluster static and dynamic proper- ties.]*'
Spectra of jet-cooled 7AZI, (7AZI),, and 7AZI/water clusters have been previously obtained with a view toward the interpre- tation of the tautomerization p r o c e ~ s . ' ~ - ' ~ The cluster spectra evidence large red shifts from the bare molecule spectrum and are quite complex: in general, the bare molecule and the various cluster spectra do not appear to coincide with regard to either vibronic structure or intensity. These observations were attributed to double hydrogen bonding such as shown in Figure 1. Never- theless, aside from this explanation, no firm evidence exists for such structure in the gas phase. In fact, evidence from other theoretical and experimental studies of isolated van der Waals (vdW) cluster^^*'^ strongly suggests that the major interaction between aromatic (solute) molecules and small solvent (i.e., H20, NH3, CnHZn+2, ROH, etc.) molecules is through the a-electron system of the solute and the major electron density of the solvent. For systems with a substantial hydrogen-bonding interaction in addition to the usual dispersion interaction, the cluster may have multiple stable structures: a planar hydrogen-bonding structure, a ring-centered a-electron/electron density structure, and a compromise structure in which neither form of interaction dom- inates the geometry.
In addition to the above likely complications of multiple cluster geometries for 7AZI clusters and dimers, the isolated molecule may evidence its own complicated spectral behavior due to three potential causes: ( I ) mixing between nearly degenerate 'L, and 'Lb air* excited electronic states; (2) mixing between the lowest a n * state (probably ILb, which corresponds to the IBzu state of benzene) and low-lying nn* states: and (3) nonplanarity of the 7AZI molecule in SI, in particular, a t the pyrrole nitrogen. The 'Lb state with its dipole parallel to the long axis of the molecule is rather insensitive to the solvent environment while the ]La state is lowered in energy by polar environments. In the case of 7AZ1, both transitions are polarized more or less along the long molecular axis." The 'La and 'Lb state are well separated in gas-phase indole'* but are apparently close together in 7AZ1.1,19 For most isolated indole-like systems, only the 'Lb state is identified at low energy. na*-an* interactions have not been reported or docu- mented for 7AZI but have been suggested for purinesZo and other systems.21,22 A rotational analysis of the 0; transition for SI - S023 does not suggest any nr*-nn* mixing, but almost all the
( I O ) Nowak, R.; Menapace, J. A.; Bernstein, E. R. J . Chem. Phys. 1988,
( I I ) Schauer, M.; Bernstein, E. R. J. Chem. Phys. 1985, 82, 726. (12) Schauer, M.; Law, K . S.; Bernstein. E. R . J. Chem. Phys. 1985,82,
(13) Wanna, J. : Bernstein. E. R. J. Chem. Phys. 1986, 84, 927. (14) Fuke, K.; Kaya, K. J. Phys. Chem. 1989, 93, 614. (15) Fuke, K.; Yoshiuchi, H.; Kaya, K. J . Phys. Chem. 1984, 88, 5840. (16) Ruane, T. P. Thesis, Princeton University, 1987. (17) Catalan, J.; Perez, P . J . Theor. Biol. 1979, 81, 213. (18) Bersohn, R.; Even, U.; Jortner, J . J . Chem. Phys. 1984, 80, 1050. (19) Wagner. R. W. Thesis, Michigan State University, 1971. (20) Clark, L. B.; Tinoco, L . J . Am. Chem. SOC. 1965, 87, 1 I . (21) Wanna, J.; Bernstein, E. R. J . Chem. Phys. 1987, 86. 6707. (22) Nimlos, M. R.; Kelley, D. F.; Bernstein, E. R. J . Phys. Chem. 1989.
89, 1309.
736.
93. 643.
b d l . 7 A Z I
a 7 A Z I '35
I b C 3 4 6 3 4
2 3 4 3 0 6
I ' I
34600 3 4 8 0 0 35000 35200 35400 35600
c m . 1
Figure 2. One-color TOFMS of (a) 7AZI and (b) 7AZI-d,(Hlo) for the region 0; + 1000 cm-'. The peak at 34634 cm-' is assigned as the 7AZI origin. The origin featuers are 2 or 3 times larger than shown.
transition intensity is expected to be of a a n * character. The work reported in this paper addresses the above three
complications for the SI state of bare and clustered 7AZI. Ad- ditionally, structures for 7AZI clusters with argon, methane, water, alcohols, and ammonia are suggested based on calculational and spectroscopic data.
11. Experimental Procedures A detailed description of the supersonic jet/laser apparatus is
found in ref 24. The doubled output of a pulsed Nd:YAG laser pumps a dye laser (R590, R6 IO, KR620, R640, and SR640 plus DCM) whose output is in turn doubled into the ultraviolet in order to excite the samples of interest. The spectral range covered for a given sample often includes the output from several dyes so that relative intensities must be calibrated in overlapping dye regions. For such situations, the intensities are noted in the figure captions.
Mass-resolved excitation spectra (time-of-flight-mass spec- troscopy, TOFMS) are obtained for all samples discussed in this report as the 7AZI (Aldrich, 98%) contains impurities that strongly absorb and emit light in the spectral regions of interest. These impurities could not be readily removed by recrystallization or vacuum sublimation. For the study of clusters, two-color TOFMS are needed to obtain clear spectra of clusters of specific stoichiometry.
7AZI is placed inside the head of a pulsed supersonic nozzle heated to ca. 70 "C. The expansion is generated with 50-70 psi of helium carrier gas. The solvents for clustering are either mixed with the carrier gas (gases) or placed in a trap before the nozzle.
7AZI-d1 (at the pyrrole ring nitrogen-HI, on N , , see Figure 1 ) is synthesized by mixing 7AZI (1%) with D 2 0 at room tem- perature, extracting the 7AZI-dl with ether, and drying the organic component in vacuum. NMR spectra taken of the sample confirm that only the most acidic hydrogen (Hlo of Figure 1 ) is replaced.
111. Geometry Optimization Calculations The geometry of the 7AZI molecule is calculated for the So
and SI electronic states with the molecular orbital package v. 5 ( M ~ P A C S ) . ~ ~ MOPACS uses the semiempirical MNDO method with optimized parametric Hamiltonians AM126 and PM3.27 With a given set of input data for bond lengths and angles, the program optimizes molecular geometry and point-charge distributions over the atoms to obtain the minimum heat of formation. Additional molecular constants such as bond characteristics, dipole moment, and normal modes of vibration can also be found. These calcu- lations are carried out for both the ground and first excited singlet states of 7AZI
Two methods are employed to calculate the minimum energy geometries and binding energies for 7AZI/solvent clusters: the
Bryant, P.; Hollas, J . M. Indian J. Phys. 1986, 608, 1 . Bernstein, E. R.; Law, K.; Schauer, M. J . Chem. Phys. 1984.80, 207. Stewart, J . J. P. MOPAC, A General Molecular Orbital Package, 5th
ed , 1988.
Am. Chem. SOC. 1985, 107, 3902. (26) Dewar, M. J . S.; Zoebisch, E. G.; Healy, E. F.; Stewart, J . J . P. J.
(27) Stewart, J . J . P. J . Comput. Chem. 1989, IO, 209, 221.

7-AZI and Its Clusters with Ar, CH4, NH3, and Alcohols
a 7 A Z I
6 8 0 7 0 0 7 2 0 7 4 0 7 6 0 7 8 0 8 0 0
Relative wavenumber (em.’)
Figure 3. One-color TOFMS of (a) 7 A Z I and (b) 7AZ1-dl with an expanded energy scale. Note the collapse of 7 A Z I doublet structure in this region upon H , o dueteration.
above MOPACS program and a potential energy calculation based on Lennard-Jones, hydrogen bonding, and coulomb atom-atom interactions.28 These latter calculations are well described in our previous publications.22
Input data for the potential energy cluster calculations are the potential parameters for the different forms of interactions and different atoms and the bond angles, bond lengths and atomic charges for all the molecules. These molecular data come from MOPACS AMI and PM3 Hamiltonian calculations.
IV. Results and Discussion A. 7- Azaindole-Spectroscopy. The one-color TOFMS of
7AZI is presented in Figure 2. The intense feature a t 34 634 cm-’ is believed to be the SI +- So transition origin. Low-energy vibronic features, which play a major role in our overall analysis of the bare molecule and cluster spectra, are assigned at 234, 280. 306,467, and 483 cm-I. Prominent doublets are identified in this spectrum at 714, 718 and 730, 735 cm-’, and an intense feature is located a t 934 cm-’. Upon deuteration of 7AZI at the acidic H I o position (7AZI-dl), two changes are found in the 7AZI spectrum: ( I ) many of the low-frequency modes shift to lower energy by as much as 3% (Figure 2b); and (2) the doublets in the spectrum collapse (Figure 3). These changes are tabulated in Table I . Both of the above observations are quite unusual in a qualitative and quantitative sense for a “normal” aromatic SI +- So t r a n ~ i t i o n . ~ ~ Additionally, the 7AZI spectrum displays a large number of vibronic features of quite weak intensity, which are not very obvious from the figures. This is another striking aspect of the 7AZI spectrum.
Upon comparing the 7AZI spectrum with that of i n d ~ l e , ~ * ~ ~ ~ one finds few common features. The vibronic features between 700 and 800 cm-I are similar for both molecules, but the doublet structure here and throughout the spectrum (for weaker features) is unique to 7AZI. The low-energy peaks at 234, 280, 306, 467, and 483 cm-l are also unique to 7AZI. These differences between the two spectra are surprising considering the SI - So transition is supposed to be to the same rr* ILb SI state in both instances. Moreover, indole has only 2 weak vibronic features below 600 cm-1,18*30 while 7AZI has more than 13 klatively intense low- energy features.
The unusually large number of low-lying vibronic features for 7AZI and the difference between the 7AZ1, 7AZI-d,, and indole spectra can be accounted for by two molecular properties of 7AZI: ( I ) the molecule is nonplanar in SI, particularly a t the Nl-Hlo pyrrolic site; and (2) strong n r* - r r* vibronic mixing occurs in the region of the S, - So transition.
The nonplanarity of 7AZI in the SI state (in particular a t Hl0) would account for the large deuterium substitution (shifts and collapse of doublets) effect on the spectrum and might also lead
(28) Nemethy, G.: Pottle, M. S.; Scherga, H. A. J . Phys. Chem. 1983,87, 188. Momany, F. A.; Carruthers, L. M.; McGuire, R. F.; Scherga, H. A. J . Phys. Chem. 1974, 78, 1595.
(29) Atomic and Molecular Clusters; Bernstein, E. R., Ed.; Elsevier: Amsterdam, 1990.
(30) Hager. J.; Wallace, S . C. J . Phys . Chem. 1983, 87, 2121.
The Journal of Physical Chemistry, Vol. 94. No. 9, 1990 3533
TABLE I: Deuterium Substitution (HI,,, See Figure 1) Effect on Vibrational Energies of 7AZI’
vibrational energies/cm-’ 7 A Z I 7 A Z I - d I intensity
0 (34634) 0 (34637) vs, 0: origin 234 230 m 280 272 S 306 30 1 m 372 366 W
404, 409 397, 400 W
457 453 W
467 458 m 483 475 S
527 523 W
547 545 W
574, 578 567, 573 W
672 652 W
682 688 W
696 695 W
706 700 W
714, 718 708, 709 m 730, 735 725, 726 S
747 735, 736 m 751 742, 743 S 772 750, 752 W
796 m 857, 866 851, 859 W
934 934 S
‘Not all weak peaks after 700 cm-I are tabulated.
to an increased number of allowed vibronic transitions. Even this nonplanarity, however, should not give rise directly to so many transitions.
We suggest that a strong nr*- r r* mixing would account for the apparent density of vibronic transitions in the SI +- So ma- nifold. Similar suggestions have been made for i s ~ q u i n o l i n e , ~ ’ ~ ~ ~ quinoline,21 2-hydro~ypyridine,~~ and other molecules. The in- tensity of these vibronic transitions comes from the AT* state but the peak positions are associated with nr*lra* vibronic resonances and couplings. As in the case of isoquinoline, we are unable to detect direct absorption (through either TOFMS or FE experi- ments) from So to the n r * excited state.
In order to elucidate this problem further, two approaches are useful: (1 ) calculation of the So and S1 geometry and (2) clustering of 7AZI with various solvents to alter the nr*- r r* coupling and perhaps to affect the 7AZI planarity.
B. 7-Azaindole-Calculations. The geometry and atomic point-charge distribution for 7AZI in both the ground and first excited singlet states are calculated with MOPACS AMI and PM3 Hamiltonians. These data are summarized in Tables I1 and 111. The optimum geometries calculated with either Hamiltonian are the same for the ground state, although significant differences are found for the atomic partial charges a t various atoms (e.g., C9 and N,). For the first excited state, the two Hamiltonians give different geometries: the A M 1 Hamiltonian yields a nonplanar molecule (C9 and Hlo) while the PM3 Hamiltonian yields a planar molecule. These calculations, however, are neither very accurate nor reliable as the convergence criteria for optimum SI geometry for both these calculations is poor (=7 for SI as opposed to 0.01 for So). Moreover, different optimum geometries obtain for different initial input geometries. The general trend of results for the AMI calculations seems sound, however; 7AZI apparently has a propensity for nonplanarity of the pyrrolic ring in SI, es- pecially a t C9 and Hlo. The AMI Hamiltonian can generate a nonplanar 7AZI for the first excited singlet state. HIo is typically out of plane by 18-19’ (see Figure 4).
We can conclude from both the experimental and theoretical results that some of the spectral crowding and doubling of various vibronic features in the 7AZI spectrum may well be due to the loss of planarity in S,. The potential well for H l o motion with
(31) Hiraya, A,; Achiba, Y.; Kimura, K.; Lim, E. C. J . Chem. Phys. 1984, 81, 3345.

3534 The Journal of Physical Chemistry, Vol. 94, No. 9, 1990 Kim and Bernstein
TABLE 11: Optimum Geometry and Charge Distribution for 7AZI in the Ground State, Results from MOPACS Calculations Using the PM3 and AM1 Hamiltonians
bond length/A bond angle/deg twist angle/deg charge (e)
atom Io PM3 AM1 PM3 AM1 PM3 AM1 J K Lb PM3 AM1 1N 0.3155 -0.2033 2 c 1.410 1.397 1 -0.2419 -0.0762 3 c 1.381 1.392 109.27 110.59 2 1 -0.1466 -0.1921 4 c 1.403 1.396 134.72 135.68 -179.93 180.00 9 3 2 -0.0035 -0.0420 5 c 1.378 1.386 117.62 117.99 179.98 180.00 4 9 3 -0.1871 -0.2116 6C 1.417 1.419 120.96 119.86 0.01 0.03 5 4 9 -0.0454 -0.0530 7N 1.337 1.336 123.17 125.34 -0.02 -0.02 6 5 4 -0.0687 -0.1454 8C 1.402 1.402 107.95 108.14 0.15 0.09 1 2 3 -0.1681 0.028 1 9 c 1.424 1.459 107.87 107.59 0.12 -0.07 8 1 2 -0.1300 -0.1210
0.2592 1 OH 0.987 0.985 125.66 126.46 179.55 179.87 1 2 3 0.0768 0.1676 0.1400 11H 1.090 1.092 128.40 129.33 179.98 179.98 2 3 9
12H 1.087 1.085 126.77 126.79 179.91 179.96 3 2 1 0.1285 0.1587 13H 1.094 1.099 120.50 120.58 180.01 179.99 4 9 8 0.1061 0.1386
0.1407 14H 1.094 1.097 120.43 120.95 180.00 180.02 5 4 9 15H 1.096 1.106 121.34 119.75 179.99 179.99 6 5 4 0.1 125 0.1568
final heat of formation: 48.15 kcal/mol for PM3; 66.97 kcal/mol for AM1
0.1 118
ONumbering of atoms are as specified in Figure la. bThe bond length is defined between I and J . The bond angle is defined between lines ZJ and J K . The twisting angle is defined between plane J K L and line IJ.
TABLE 111: Optimum Geometry and Charge Distribution for 7AZI in the First Excited Singlet State, Results from MOPACS Calculations Using the PM3 and AM1 Hamiltonians"
bond length/A bond angle/deg twist angle/deg charge (e)
a t o m I PM3 AM1 PM3 AM 1 PM3 AM1 J K L PM3 AM1
1N 2 c 3 c 4 c 5 c 6C 7N 8C 9 c 1 OH 11H 12H 13H 14H 15H
1.364 1.436 1.385 1.418 1.377 1.395 1.422 1.422 0.986 1.092 1.088 1.092 1.094 1.094
1.362 1.459 1.404 1.404 1.395 1.365 1.446 1.454 0.993 1.092 1.085 1.095 1.099 1.105
108.34 134.98 117.18 121.63 122.88 109.76 107.31 125.28 126.66 125.65 121.73 118.59 123.41
1 10.04 134.96 - 116.89 120.82 125.20 108.23 107.23 126.47 127.26 125.26 121.37 119.66 121.08
.179.80 179.82
0.08 0.01
-0.18 0.20
179.86 179.95 179.95 179.93 180.03 180.02
179.85 -179.88
1.22 -0.42 -3.57
4.20 -161.22 -176.44 -1 77.45
177.86 -178.98 -178.85
final heat of formation: 145.81 kcal/mol for PM3; 170.05 kcal/mol for AM1
Osee footnotes given in Table 11.
Y ; i x
a 0
( 3 4 5 8 8 )
1 2 1 9 3 2 4 9 3 5 4 9 6 5 4 1 2 3 8 1 2 1 2 3 2 3 9 3 2 1 4 9 8 5 4 9 6 5 4
0.4769 -0.4079 -0.003 1 -0.1 176 -0.1255 -0.0854 -0.1268 -0.1590 -0.1307
0.0648 0.1585 0.1252 0.1111 0.1047 0.1 147
7AZI( CH4)l
-0.1686 -0.1737 -0.0743 -0.1329 -0.1619 -0.0926 -0.1743
0.0887 -0.1330
0.2510 0.1760 0.1630 0.1393 0.1267 0.1562
2 3 1 883 h h
a =18.8O c m - l
Figure 4. MOPACS result for the first excited singlet state geometry of 7AZ1, employing the AM1 Hamiltonian.
Figure 5* Two-co1or Wavelength for the ionizing laser is 3200 A.
Of (a) 7AZ1(CH4)I and (b) 7AZ1(Ar)l*
respect to the plane of the heavy atom ring is a double shifts for other solute systems. For example for toluene, pyrazine, pyrimidine, benzene, and indole the origin shift for 1 : 1 methane clusters are -43,12 -33,13 -57,32 -41 ,I1 and -3633 cm-', respectively,
-2635
well with a barrier to the zero-degree, planar conformation. C. 7-Azaindole (Ar) , and (CH4)l Clusters. The general reason
posed above: ( 1 ) the ( S , ) nonplanarity of 7AZI and its ensuing to look at cluster spectra at this point is to resolve the two issues and the shifts for benzene and indole with argon are -2134 and
respectively. double-well ootential surface and (2) the imoortance of n.lr*-m*
\ I
mixing for this molecule. Spectra for 7AZI(Ar), and (CH,), are presented in Figure 5.
The cluster shifts for the 0; transition are -1 8 cm-' for 7AZI(Ar)l
(32) Wanna, J.; Menapace, J. A.; Bernstein, E. R. J. Chem. Phys. 1986,
( 3 3 ) Hager, J.; Ivanco, M.; Smith, M. A.; Wallace, S . C. Chem. Phys. Lett. 857 1795*
1985. 113. 503. and -46 cm-I for 7AZI(CH4)1. These are quite typical of cluster (34) Stephenson, T. A.; Rice, S. A. J. Chem. Phys. 1984, 81, 1083.

7-AZI and Its Clusters with Ar, CH4, NH,, and Alcohols The Journal of Physical Chemistry, Vol. 94, No. 9, 1990 3535
a AMI b PM 3 b a
-345 cm-1 -645 cm-1
Figure 6. Optimum geometries for 7AZI(Ar), and 7AZI(CH4), obtained with a potential energy calculation. Both PM3 and AM1 7AZI struc- tures and charges result in identical cluster geometries. Also shown are cluster binding energies.
736
a . 7AZI(H20)1
185 (33046)
I! I I
I
33400 33600 33800 34000 3 4 2 0 0 33200
743 7AZI( H20) 2
b o (32637)
I
377 . U L C 0
(32559)
745 162
597 I A . )i
32600 32800 33000 33200 33400
c m - 1
Figure 7. One-color TOFMS of (a) 7AZI(H20)I and (b) 7AZI(H20), The peaks between 33 200 and 33 400 cm-' are 2-3 times larger than shown.
Calculations of cluster geometry are presented in Figure 6. Again, very typical behavior is observed for the single minimum energy configurations of these clusters.
By contrast, comparison of the vibrational structure of these clusters with each other and bare 7AZI shows substantial changes in the vibronic features brought about by clustering. This is strong evidence that n r* - r r* mixing is distorting the observed cluster and bare molecule vibronic structure. Thus, the apparent density of vibronic features in the 7AZI bare molecule spectrum may well be due to vibronic coupling between a low-lying n r * state and the Yobserved" rr* state "SI". The observed vibronic transitions in this region can reflect this interaction and not existing vibra- tional structure in the 7AZI excited rr* electronic state.
At higher vibrational levels in SI, the transition intensity of both clusters begins to decrease due to vibrational predissociation of the clusters.36 The intense feature at +934 cm-l above the 0; transition of the bare molecule is no longer observed due to either vibrational predissociation or removal of the nr*- r r* interaction upon clustering. In either event, this demonstrates that the 934-cm-l feature is a vibronic one and not a new electronic origin (e.g., ILa). Thus, the observed spectra are suggested to be due to a transition involving the 'Lb (rr*). The excited 'Lb (rr*) state probably interacts with a lower energy singlet n r * state to produce the observed complex high-density SI - So transition in the 34 600-35 600-cm-l region.
D. 7-Azaindolel H 2 0 Clusters. The spectra of 7AZI(H20) are presented in Figure 7. The 0; transition for 7AZI(H20)I is located at 33 346 cm-', red-shifted by 1288 cm-' from the bare molecule 0; transition. The 7AZI(H20),,, spectra are further
(35) Hager, J.; Wallace, S. C. J. Phys. Chem. 1984, 88, 5513. (36) Kelley, D. F.; Bernstein, E. R. J. Phys. Chem. 1986, 90, 5164.
Y "-0' P L x
0
a = 1 3 6 . 1 ' p = 8 3 . 8 ' y = 1 3 5 . 8 '
r1=2.542 A r2=2.614 r 3 = 2 . 2 1 1 A
Figure 8. MOPACS results for the local hydrogen-bonding structure of 7AZI(H20)1, using (a) PM3 and (b) AM1 Hamiltonians.
red-shifted by 1997 and 2075 cm-', respectively. These red shifts are enormous considering those found for benzene32 (+85 cm-l), indole37 (-1 35 cm-I), (-356 cm-l), fluorene39 (+57 cm-'), and isoquinoline21 (0.6 cm-') clusters with (H,O),. The unusually large red shift for 7AZI/water clusters suggests that the n r * - m * excited-state interaction has been (at least partially) removed by the interaction of 7AZI with water. Hydrogen-bonding solvents are known to raise the energy of n r * states with respect to rr* states.40 The suggested mechanism for this increase in the n r * excitation energy is the lowering of the ground-state n orbital energy due to hydrogen bond formation between water and the lone pair electrons on the ring nitrogen (see Figure lb). If the n r * state were raised in energy above the rr* state, additional lowering in energy of the rr* state would occur through inter- action between these two zero-order descriptions.
Not only is the origin shift of 7AZI/water clusters with respect to 7AZI suggestive of excited electronic state mixing but the observed cluster vibronic structure is as well. Note that the low-energy modes of 7AZI SI have changed nearly 33% in 7AZI(H20)I : this is almost unique for vdW clusters. Apparent overtone structure is observed for both systems. The strong 7AZI feature at 934 cm-l is missing in 7AZI(H20), spectra; vibrational predissociation is unlikely to be the reason for this absent feature based on binding energy considerations.
Given the large cluster shifts, the change in SI vibrational structure upon clustering with water, and the absence of any other 7AZI/water features in the 33 000-36 OOO-cm-' region, we believe that the excited state observed for 7AZI/water is 'Lb with a significant removal of nr*-state interference. The 'La state is probably not observed in this region.
Cluster structure has been explored through a number of different calculations. Both MOPACS and potential energy cal- culations are performed on the 7AZI(H20), clusters. Table IV and Figures 8 and 9 summarize the results of such studies. The MOPACS calculation gives distorted double-hydrogen-bonded structures for the PM3 Hamiltonian (Figure 8a) but single-hy- drogen-bonded structures for the AM 1 Hamiltonian (Figure 8b). In neither case is the water nor the 7AZI structures and charges much different from those of the isolated individual molecules. Note that the MOPACS calculation [tested in this study for the pyrazine4l and pyrimidine4' dimers and pyrazine(NH,) tends to underestimate the vdW dispersion interaction between the
(37) Montoro, T.; Jourvet, C.; Campillo, A. L.; Soep, B. J. Phys. Chem.
(38) Fuke, K.; Kaya, K. Chem. Phys. Lett. 1983, 94, 97. (39) Im, H. S.; Grassian, V. H.; Bernstein, E. R. J. Phys. Chem. 1990, 94,
(40) See ref 21 and references quoted therein. (41) Wanna, J.; Menapace, J. A.; Bernstein, E. R. J. Chem. Phys. 1986,
1983,87, 3582.
222.
85, 777.
3536 The Journal of Physical Chemistry, Vol. 94, No. 9, 1990 Kim and Bernstein
a) amu=118+18
P
Y i-. PM3 (100%) -819 cm-1
AM1 (25%) -856 c m - 1
b
00 0
-a 0
AM1 (36%) -816 c m - 1 AM1 (25%) -858 cm-1
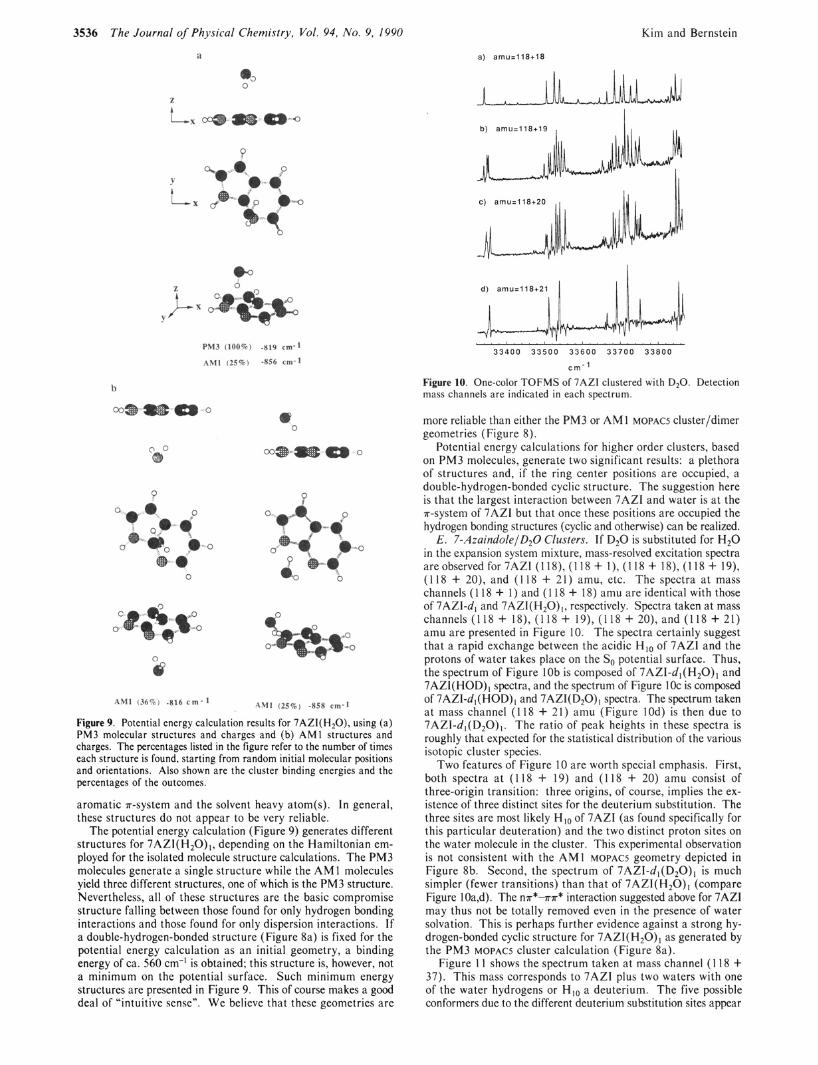
Figure 9. Potential energy calculation results for 7AZI(H20), using (a) PM3 molecular structures and charges and (b) AM1 structures and charges. The percentages listed in the figure refer to the number of times each structure is found, starting from random initial molecular positions and orientations. Also shown are the cluster binding energies and the percentages of the outcomes.
aromatic n-system and the solvent heavy atom(s). In general, these structures do not appear to be very reliable.
The potential energy calculation (Figure 9) generates different structures for 7AZI(H20)1, depending on the Hamiltonian em- ployed for the isolated molecule structure calculations. The PM3 molecules generate a single structure while the AM 1 molecules yield three different structures, one of which is the PM3 structure. Nevertheless, all of these structures are the basic compromise structure falling between those found for only hydrogen bonding interactions and those found for only dispersion interactions. If a double-hydrogen-bonded structure (Figure 8a) is fixed for the potential energy calculation as an initial geometry, a binding energy of ca. 560 cm-’ is obtained; this structure is, however, not a minimum on the potential surface. Such minimum energy structures are presented in Figure 9. This of course makes a good deal of “intuitive sense”. We believe that these geometries are
b) amu=118+19 I I , I 1
d) amu=118+21 I 1
I
3 3 4 0 0 3 3 5 0 0 3 3 6 0 0 3 3 7 0 0 3 3 8 0 0
c m - l
Figure 10. One-color TOFMS of 7AZI clustered with D20. Detection mass channels are indicated in each spectrum.
more reliable than either the PM3 or AM1 MOPACS cluster/dimer geometries (Figure 8).
Potential energy calculations for higher order clusters, based on PM3 molecules, generate two significant results: a plethora of structures and, if the ring center positions are occupied, a double-hydrogen-bonded cyclic structure. The suggestion here is that the largest interaction between 7AZI and water is at the mystem of 7AZI but that once these positions are occupied the hydrogen bonding structures (cyclic and otherwise) can be realized.
E . 7-Azaindole/D20 Clusters. If D 2 0 is substituted for H 2 0 in the expansion system mixture, mass-resolved excitation spectra areobserved for 7AZI (118), (118 + I ) , (118 + 18), (118 + 19), (1 18 + 20), and (1 18 + 21) amu, etc. The spectra at mass channels (1 18 + 1) and (1 18 + 18) amu are identical with those of 7AZI-dl and 7AZI(H20),, respectively. Spectra taken at mass channels (118 + 18), (118 + 19), (118 + 20), and (118 + 21) amu are presented in Figure 10. The spectra certainly suggest that a rapid exchange between the acidic H I o of 7AZI and the protons of water takes place on the So potential surface. Thus, the spectrum of Figure 10b is composed of 7AZI-dl(H20), and 7AZI(HOD), spectra, and the spectrum of Figure 1Oc is composed of 7AZI-dl(HOD), and 7AZI(D20), spectra. The spectrum taken at mass channel (1 18 + 21) amu (Figure 10d) is then due to 7AZI-dl(D20), . The ratio of peak heights in these spectra is roughly that expected for the statistical distribution of the various isotopic cluster species.
Two features of Figure 10 are worth special emphasis. First, both spectra at (1 18 + 19) and (1 18 + 20) amu consist of three-origin transition: three origins, of course, implies the ex- istence of three distinct sites for the deuterium substitution. The three sites are most likely HI, of 7AZI (as found specifically for this particular deuteration) and the two distinct proton sites on the water molecule in the cluster. This experimental observation is not consistent with the AM1 MOPACS geometry depicted in Figure 8b. Second, the spectrum of 7AZI-dl(D20)I is much simpler (fewer transitions) than that of 7AZI(H20), (compare Figure lOa,d). The n r * - m * interaction suggested above for 7AZI may thus not be totally removed even in the presence of water solvation. This is perhaps further evidence against a strong hy- drogen-bonded cyclic structure for 7AZI(H20), as generated by the PM3 MOPACS cluster calculation (Figure 8a).
Figure 1 1 shows the spectrum taken at mass channel (1 18 + 37). This mass corresponds to 7AZI plus two waters with one of the water hydrogens or Hlo a deuterium. The five possible conformers due to the different deuterium substitution sites appear

7-AZI and Its Clusters with Ar, CH4, NH,, and Alcohols The Journal of Physical Chemistry, Vol. 94, No. 9, 1990 3537
TABLE I V Optimum Geometry and Charge Distribution for 7AZI(H20)1 in the Ground State, Results from MOPACS Calculations Using the PM3 and AM1 Hamiltonians"
bond length/A bond angle/deg twist angle/deg charge (e ) a t o m 1 PM3 AM1 PM3 AM1 PM3 AM1 J K L PM3 AM1
1N 2 c 1.409 1.394 3 c 1.381 1.392 109.35 110.57 4 c 1.398 1.396 134.82 135.89 -179.70 179.94 5 c 1.379 1.387 1 17.63 1 18.01 -1 79.86 -179.89 6C 1.416 1.418 120.96 119.89 0.09 0.03 7N 1.338 1.336 123.22 125.30 -0.05 0.00 8C 1.402 1.402 107.88 108.04 0.63 0.01 9 c 1.427 1.460 108.05 107.71 -0.30 0.02 1 OH 0.989 0.993 125.90 126.89 179.34 -1 79.90 11H 1.090 1.092 128.40 129.26 179.98 180.00 12H 1.087 1.085 126.80 126.81 179.80 180.03 13H 1.094 1.099 120.52 120.59 179.97 180.01 14H 1.094 1.097 120.45 120.95 180.02 179.98 15H 1.096 1.106 121.28 119.68 179.89 180.00 1 6 0 3.352 3.083 150.22 156.81 -174.78 179.76 17H 0.953 0.962 33.93 66.66 -44.12 -61.76 18H 0.951 0.962 107.61 103.36 -86.6 1 -49.24
final heat of formation: -7.71 kcal/mol for PM3; 1.04 kcal/mol for AM1
"See footnotes given in Table 11.
1 2 9 4 5 6 1 8 1 2 3 4 5 6 7
16 16
1 3 9 4 5 2 1 2 3 2 9 4 5 6 7
17
32656.5
32640.5
a Z
I . . . I . . . I . . . , .
3 2 6 2 0 3 2 6 4 0 3 2 6 6 0 3 2 6 8 0
c m - l
Figure 11. One-color TOFMS of 7AZ1 clustered with D20, detected at mass channel ( 1 18 + 37). (See text for a discussion of the doublet (A, C) and singlet features.)
a 0 7AZI(CHsOH)1
(33209)
I 177
166 335 332
b o (33204)
7AZI( C2HSOH)i
.._.I.. ~ " " " I . . , . I . . . . 1 . . . 3 3 2 0 0 3 3 3 0 0 3 3 4 0 0 3 3 5 0 0 3 3 6 0 0
cm"
Figure 12. Two-color TOFMS of (a) 7AZI(CH30H), and (b) 7AZI- (C2H50H),. Wavelength of the ionizing laser is 3225 A.
in three distinctive bands of electronic origins. The band B ap- parently represents a single peak and can be tentatively assigned to 7AZI-dl(H20)2, while each of bands A and C is apparently composed of two very close peaks and can tentatively be assigned to 7AZI(H20)(DOH). Attempts to identify the structure of 7AZI plus two waters from Figure 1 1 meet with some difficulty; however, we believe that if the double-hydrogen-bonding structure in Figure 8a were realistic, four distinctive bands would be observed at mass channel ( 1 18 + 37) for the cluster origin.
F. 7-Azaindole/Alcohol Clusters. Figure 12 shows the two- color TOFMS of 7AZI(CH,OH), and 7AZI(C2H50H) , .
Ob*,& b
P
0
z 0 1
Y t-" 0
2 3 9 4 3 2 3 9 1 8 9 4 5 6 7
0.3 152 -0.23 6 8 -0.1505 0.00 14 0.1900
-0.0428 -0.0882 -0.1692 -0.1299
0.0930 0.1410 0.1288 0.1064 0.1 124 0.1 105
-0.385 1 0.2002 0.1835
b
-0.2024 -0.07 10 -0.1988 -0.0441 -0.2133 -0.05 17 -0.1728
0.0232 -0.1 189
0.2809 0.1692 0.1586 0.1391 0.1409 0.1540
-0.4082 0.2075 0.2075
-0
P
0
e 0
Figure 13. Potential energy calculation result for the geometry of 7AZI(CH30H),. PM3 molecules are used.
a 7AZI( N H 3 ) l 0
(3341 7 ) 729
1
b
I 194
J -
0 (32940) 7AZI( NH3)Z I I
I . . . . l . . . . , . . .
3 3 0 0 0 3 3 5 0 0 3 4 0 0 0
c m - l
Figure 14. Two-color TOFMS of (a) 7AZI(NH3), and (b) 7AZI- (NH3)2. Wavelength of the ionizing laser is 3244 A.
7AZI(CH,OH), displays a single origin while 7AZI(C2HSOH), shows multiple origins. The spectra do not display common
3538 The Journal of Physical Chemistry, Vol. 94, No. 9, 1990 Kim and Bernstein
Y
.., 0
Y 0
b
-930 cm-1 (100%)
C
-0
0 0
0
0
0
0' C
0 - 0
-1950 cm-1 ( 2 0 % ) -1850 cm-1 ( 8 0 % )
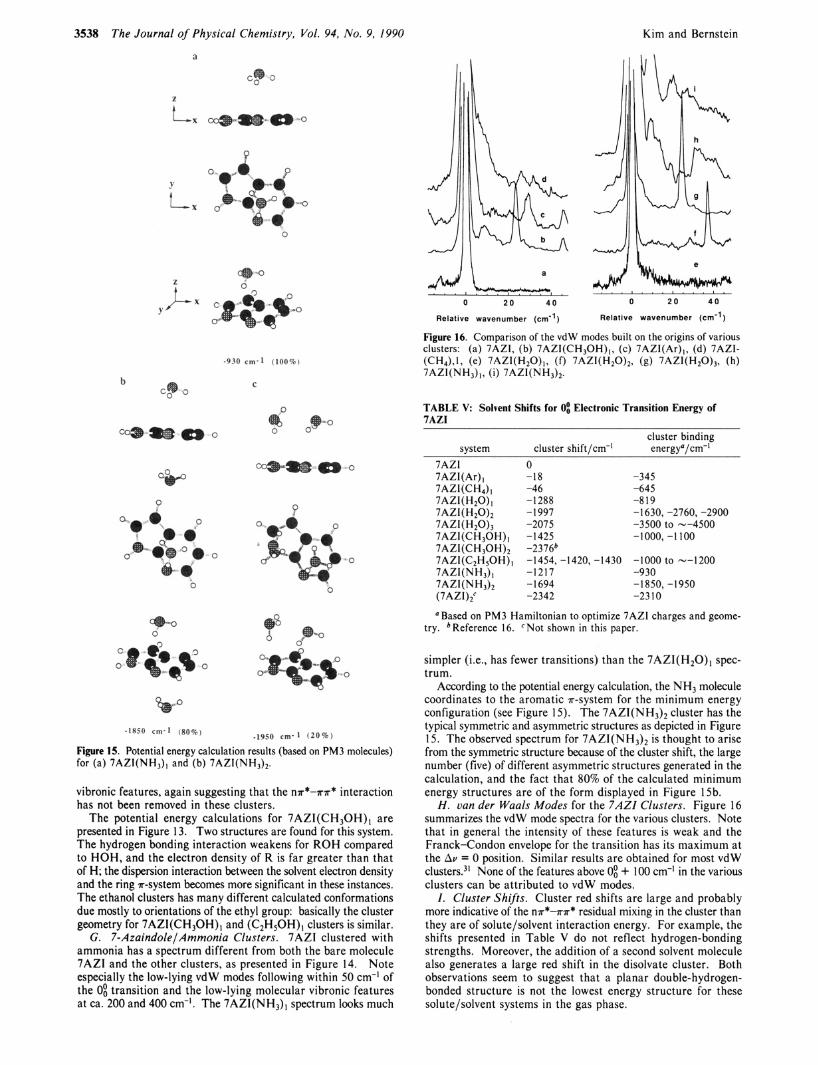
Figure 15. Potential energy calculation results (based on PM3 molecules) for (a) 7AZI(NH3), and (b) 7AZI(NH3)2.
vibronic features, again suggesting that the nn*-nr* interaction has not been removed in these clusters.
The potential energy calculations for 7AZI(CH30H), are presented in Figure 13. Two structures are found for this system. The hydrogen bonding interaction weakens for ROH compared to HOH, and the electron density of R is far greater than that of H; the dispersion interaction between the solvent electron density and the ring n-system becomes more significant in these instances. The ethanol clusters has many different calculated conformations due mostly to orientations of the ethyl group: basically the cluster geometry for 7AZI(CH30H), and (C2H50H), clusters is similar.
G . 7-Azaindole/Ammonia Clusters. 7AZI clustered with ammonia has a spectrum different from both the bare molecule 7AZI and the other clusters, as presented in Figure 14. Note especially the low-lying vdW modes following within 50 cm-I of the 0: transition and the low-lying molecular vibronic features at ca. 200 and 400 cm-I. The 7AZI(NH3)1 spectrum looks much
a
0 2 0 4 0
Relative wavenumber (cm-')
0 2 0 4 0
Relative wavenumber (cm")
Figure 16. Comparison of the vdW modes built on the origins of various clusters: (a) 7AZ1, (b) 7AZI(CH30H),, (c) 7AZI(Ar),, (d) 7AZI- (CH4),I9 (e) 7AZI(H20)1, (0 7AZI(H20)2, (8) 7AZI(H20)3, 0 ) 7AZI( N H,) (i) 7AZI( NH,),.
TABLE V: Solvent Shifts for 0; Electronic Transition Energy of 7AZI
system 7AZI 7AZI(Ar) I 7AZI(CH4)1 7AZI ( H2O) 1
7AZI( H2O)z 7AZI(H20)3 7AZI(CH,OH) I 7AZI(CH3OH),
7 AZI (N H ,) 7AZI(C2HSOH) 1
7AZ1 (N H 3) 2 (7AZI)2'
cluster shift/cm-' 0 -18 -46 -1 288 -1 997 -2075 -1 425 -2376' -1454, -1420, -1430 -1217 -1694 -2342
cluster binding energy"/cm-'
-345 -645 -819 -1630, -2760, -2900 -3500 to --4500 -1000, -1 100
-1000 to --1200 -930 -1850, -1950 -23 10
" Based on PM3 Hamiltonian to optimize 7AZ1 charges and geome- try. 'Reference 16. 'Not shown in this paper.
simpler (Le., has fewer transitions) than the 7AZI(H20), spec- trum.
According to the potential energy calculation, the NH3 molecule coordinates to the aromatic r-system for the minimum energy configuration (see Figure 15). The 7AZI(NH3)2 cluster has the typical symmetric and asymmetric structures as depicted in Figure 15. The observed spectrum for 7AZI(NH3)2 is thought to arise from the symmetric structure because of the cluster shift, the large number (five) of different asymmetric structures generated in the calculation, and the fact that 80% of the calculated minimum energy structures are of the form displayed in Figure 15b.
H . van der Waals Modes for the 7AZI Clusters. Figure 16 summarizes the vdW mode spectra for the various clusters. Note that in general the intensity of these features is weak and the Franck-Condon envelope for the transition has its maximum at the AV = 0 position. Similar results are obtained for most vdW clusters.31 None of the features above 0: + IO0 cm-' in the various clusters can be attributed to vdW modes.
1. Cluster Shifts. Cluster red shifts are large and probably more indicative of the nn*-r1r3 residual mixing in the cluster than they are of solute/solvent interaction energy. For example, the shifts presented in Table V do not reflect hydrogen-bonding strengths. Moreover, the addition of a second solvent molecule also generates a large red shift in the disolvate cluster. Both observations seem to suggest that a planar double-hydrogen- bonded structure is not the lowest energy structure for these solute/solvent systems in the gas phase.

J . Phys. Chem. 1990, 94, 3539-3543 3539
is nonplanar (at Hlo-NI on the pyrrole ring) in the first excited V. Summary and Conclusions
Results of these studies for 7AZI and its clusters with argon, methane, water, alcohols, and ammonia can be summarized as follows: ( I ) the spectrum of the bare molecule is quite congested with many low-energy vibronic features and apparent doublets appearing in the mass-resolved excitation spectrum: ( 2 ) the cluster spectra are also of the same nature but the vibronic structure is quite different for each particular cluster: ( 3 ) the vibronic doublets disappear upon deuteration of 7AZ1 at Hlo; (4) calculations suggest that 7AZI may be nonplanar in SI; (5) potential energy calculations suggest that cyclic hydrogen bonding between water, alcohols, and ammonia and 7AZI is not a stable low-energy structure for the first two solvent molecules in the cluster; and ( 6 ) all cluster spectra are red-shifted from the bare molecule origin, especially for polar solvents as indicated in Table V.
The conclusions we draw from these results are as follows: ( I ) strong nT*-m* vibronic mixing occurs between the ‘Lb T X *
excited state and a lower lying n r* state; (2) this vibronic mixing is only partially removed by clustering; (3) a cyclic hydrogen- bonded structure is not achieved for the 7AZI(H20)I,2, 7AZI- (ROH)l,2, or 7AZI(NH3)1,2 clusters; and (4) the 7AZI molecule
singlet state. The large spectral SI - So red shifts for water, alcohol, and
ammonia 7AZI clusters do not necessarily imply a cyclic hy- drogen-bonded cluster structure because the (supposed) stability of these structures would not correlate with the size of the red shift.
Finally, these results suggest that the double-hydrogen-bonding structures assumed to be intermediates in the 7AZI tautomeri- zation process in condensed phases may only be present in rather high solvent density systems for which solvent molecules occupy the ring-centered solvation sites of 7AZI. Under such conditions, solvent molecules may occupy the lower binding energy hydro- gen-bonded sites at the N, and Nl-Hlo positions (see Figure la).
Acknowledgment. This work is supported in part by grants from NSF and ONR. We thank Professor J. M. Hollas for helpful communications on 7-AZI spectroscopy and for discussion of some of his unpublished results on 7-AZI.
Registry No. 7AZ1, 271-63-6; Ar, 7440-37-1; CH,, 74-82-8; H20 , 7732-1 8-5; D20, 7789-20-0; CH30, 67-56-1; C2H50H, 64-17-5; NH,, 7664-41-7; D2, 7782-39-0; H2, 1333-74-0.
Au( 0)-Ethylene and Au( 0)-Dioxygen Complexes: Gold Nuclear Hyperfine and Quadrupole Coupling Tensors
Paul H. Kasai IBM Almaden Research Center, San Jose, California 951 20 (Received: September 22, 1989)
Powder pattern electron spin resonance spectra of the Au atom complexes of ethylene and oxygen molecules, Au(C2H4) and Au(02), show anomalies due to 1 9 7 A ~ nuclear quadrupole interactions. I n the case of Au(C2H4). owing to an extremely large nuclear hyperfine interaction, the quadrupole interaction is manifested as a subtle intensity variation in the powder pattern of the normal transitions. In the case of Au(02), the hyperfine interaction is small, and the quadrupole term is manifested in the form of forbidden transitions. Both complexes have a side-on structure where the metal atom is situated equidistant from the ligand termini. The following quadrupole coupling tensors were determined through analyses of the powder patterns via simulation: for Au(C2H4) P, = -2Py = -2P, = 100 h 1 5 MHz, and for Au(02) P , = -2P, = -2PY = 45 * 5 MHz, where the z axis is parallel to the C-C or 0-0 bond of the ligand and they axis is perpendicular to the plane of the complex. The electron distributions indicated by the quadrupole tensors are in accord with the structures and the bonding schemes envisaged for the respective complexes.
Introduction Earlier we reported on ESR studies of mono- and bis(ethy1ene)
complexes of Au atoms.’ The complexes were generated by cocondensation of gold atoms and ethylene molecules in argon matrices a t near liquid helium temperature. The ESR spectrum of Au(0)-monoethylene is characterized by an extremely large, essentially isotropic hf (hyperfine) coupling tensor of the 1 9 7 A ~ nucleus (natural abundance = loo%, I = 3/2 , = 0.1439@”). The ESR spectrum of bis(ethylene)gold(O), on the other hand, is characterized by an orthorhombic g tensor of large anisotropy, and a relatively small but highly anisotropic 1 9 7 A ~ hyperfine (hf) coupling tensor. The I9’Au nucleus has an unusually large nuclear quadrupole moment (Q = 0.594 X cm2), and hence when its hyperfine interaction is small, conspicuous anomalies may be seen in the ESR powder pattern due to severe mixing of the nuclear spin states. Such anomalies are observed in the powder pattern of bis(ethylene)gold(O) and have been analyzed in detaiL2
When the hyperfine interaction is extremely large compared to the nuclear quadrupole term, the effect of the latter upon the ESR powder pattern is almost negligible and difficult to discern. During our recent study of Au(0)-monocarbonyl, we noted and
( I ) Kasai, P. H. J . Am. Chem. SOC. 1983, 10.5, 6704. (2) Kasai. P. H. J . Phys. Chem. 1988, 92, 2161.
showed that, even in such a case, the quadrupole term causes a subtle but characteristic deviation in the powder pattern of the normal transitions, and it may be assessed with reasonable ac- curacy by spectrum ~ imula t ion .~
Recently we also reported on the ESR spectrum of Au(0)- dioxygen ~ o m p l e x . ~ Though ethylene and oxygen molecules are nominally “isoelectronic”, and both Au(C2H4) and Au(0,) com- plexes have similar symmetric side-on structures, the interactive schemes and dispositions of the unpaired electron in these com- plexes are totally different as depicted be lo^.^,^*^-'
V
(3) Kasai, P. H.; Jones, P. M. J . Am. Chem. SOC. 1985, 107, 6385. (4) Kasai, P. H.; Jones, P. M. J . Phys. Chem. 1986, 90, 4239. ( 5 ) McIntosh, D.; Ozin, G. A. J . Orgonomet. Chem. 1976, 121, 127. (6) McIntosh, D.; Ozin, G. A. Inorg. Chem. 1976, I S , 2869. (7) Howard, J . A.; Sutcliffe, R.; Mile, B. J . Phys. Chem. 1984, 88, 4351.
0022-3654/90/2094-3539$02SO/O 0 1990 American Chemical Society