Embed Size (px)
Citation preview
6c Mass transport in plants
Root Structure
Epidermis . A single layer of cells often with long extensions called root hairs,
which increase the surface area enormously.
Cortex . A thick layer of packing cells that make up the bulk of the root.
Endodermis . A single layer of tightly-packed cells containing a waterproof layer
mad of suberin called the casparian strip. This prevents the movement of water between
the cells.
Vascular Tissue . This contains xylem and phloem cells, which are continuous with
the stem vascular bundles.
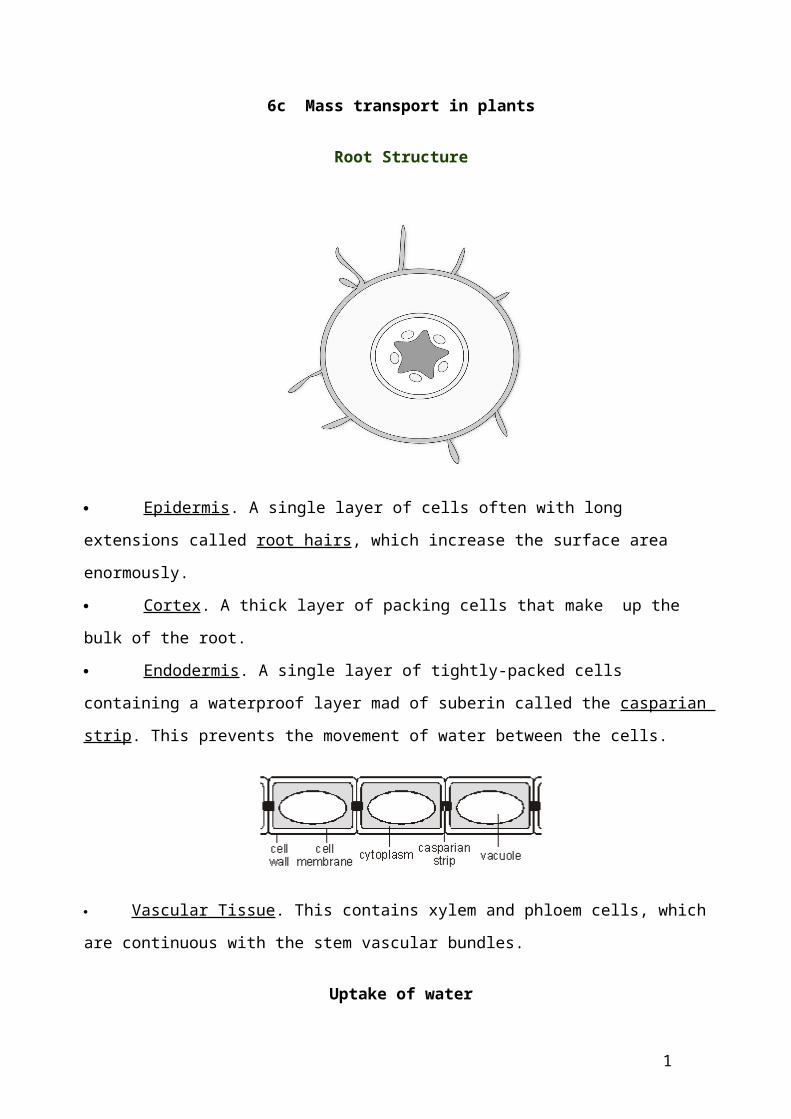
Uptake of water
The water potential of the epidermal cells is lower than the soil solution around them.
This causes water to enter by osmosis. Most mineral ions in the soil are at a lower
concentration than in the plant cells so will enter the root by active transport. This lowers
1
the water potential of the cells in the roots (makingit more negative) and allows water to
enter by osmosis down the concentration gradient.
Water moves through the root in one of two paths
1 Symplast pathway – moves from cytoplasm of one cell to cytoplasm of
adjacent cell
2 Apoplast pathway – water moves through adjacent cell walls in spaces
between fibres of cellulose
2
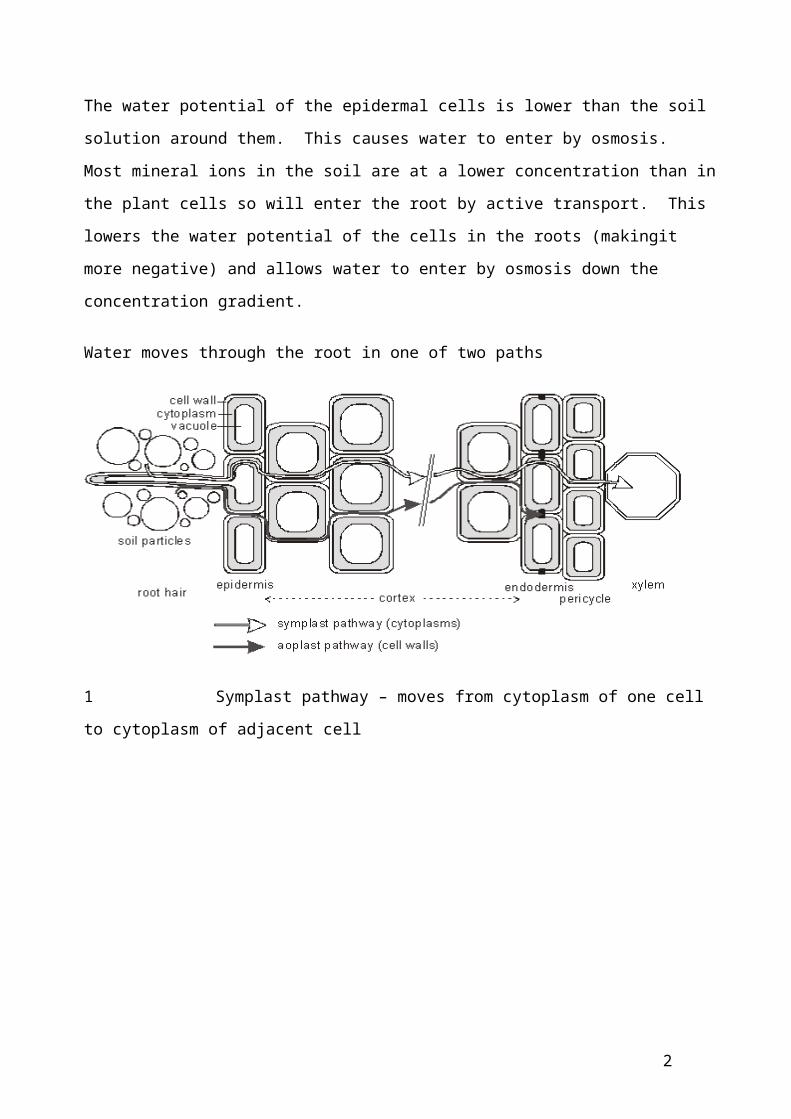
Movement from roots to leaves
Xylem tissue is composed of dead cells
joined together to form long empty tubes.
Before death the cells form thick cell walls
containing lignin, which is often laid down in
rings or helices, giving these cells a very
characteristic appearance under the
microscope. Lignin makes the xylem
vessels very strong, so that they don’t
collapse under pressure, and makes them
waterproof.
The xylem vessels have small pits in their
cell walls – these are regions of cell wall
with no lignin. Since cellulose is permeable
water can move sideways from vessel to
vessel through these pits.
Xylem vessels contain no cytoplasm and the
centre lumen is fluid filled allowing a
continuous column of solution up the length
of each vessel.
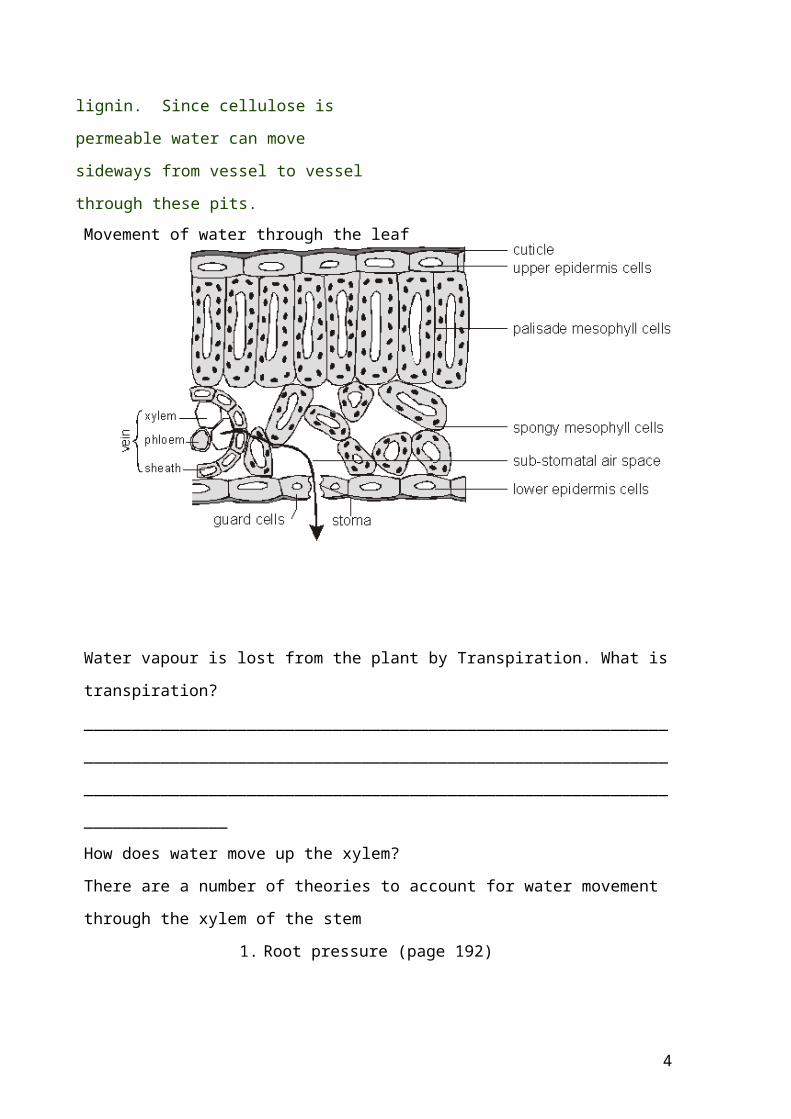
Movement of water through the leaf
3
Water vapour is lost from the plant by Transpiration. What is transpiration?
__________________________________________________________________
__________________________________________________________________
__________________________________________________________________
How does water move up the xylem?
There are a number of theories to account for water movement through the xylem
of the stem
1. Root pressure (page 192)
_______________________________________________________________________
_______________________________________________________________________
_______________________________________________________________________
_______________________________________________________________________
_______________________________________________________________________
_______________________________________________________________________
_______________________________________________________________________
_______________________________________________________________________
_______________________________________________________________________
2. The cohesion-tension theory (Page 193)
_______________________________________________________________________
_______________________________________________________________________
_______________________________________________________________________
_______________________________________________________________________
_______________________________________________________________________
_______________________________________________________________________
_______________________________________________________________________
_______________________________________________________________________
_______________________________________________________________________
_______________________________________________________________________
_______________________________________________________________________
_______________________________________________________________________
4
Stomata and guard cells
The diameter of each stomatal pore is controlled by guard cells.
What happens to cause stomata to open?
What happens to cause stomata to close?
What is transpiration?
___________________________________________________________________
___________________________________________________________________
___________________________________________________________________
As water evaporates from the stomata, the amount of water vapour surrounding the
leaf (and therefore the water potential of the atmosphere) is affected by a number of
factors. These include size, shape, hairiness of leaf and wind speed.
Any factor that reduces the thickness of the water boundary layer or increases the
water potential gradient (less water outside the leaf) will increase the rate of diffusion
– transpiration rate increases.
Make notes on what factors affect the rate of transpiration.
5
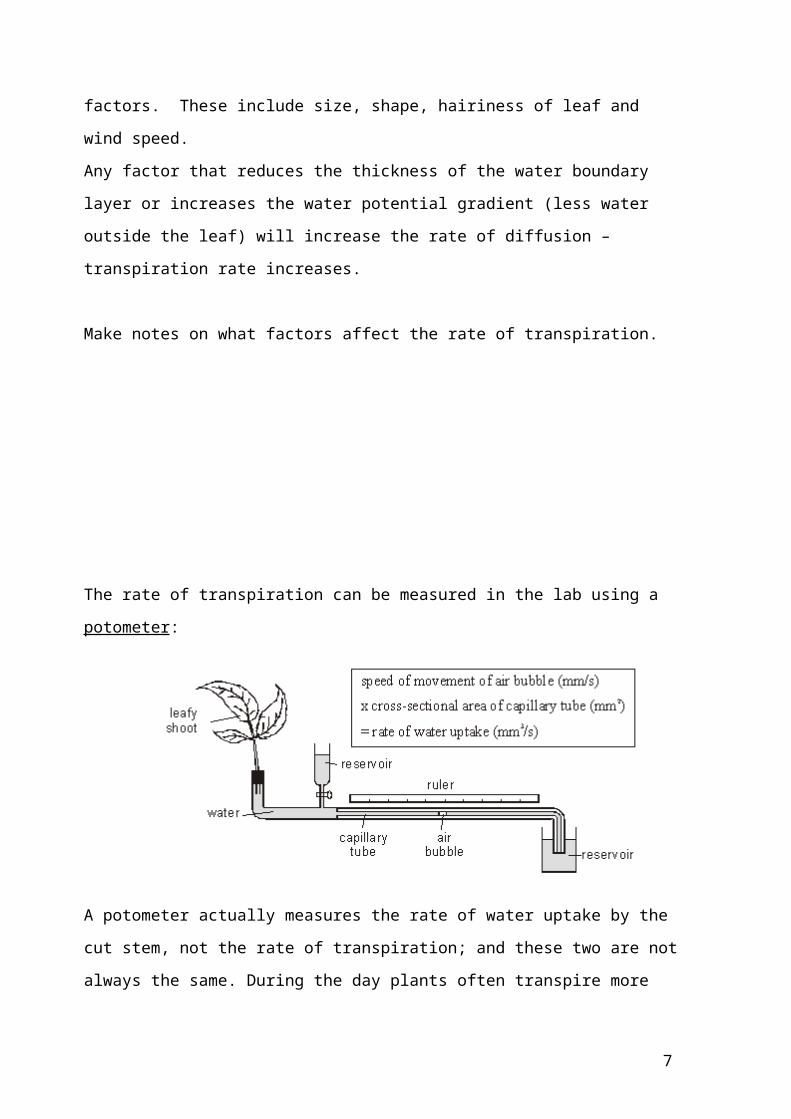
The rate of transpiration can be measured in the lab using a potometer:
A potometer actually measures the rate of water uptake by the cut stem, not the rate
of transpiration; and these two are not always the same. During the day plants often
transpire more water than they take up (i.e. they lose water and may wilt), and during
the night plants may take up more water than they transpire (i.e. they store water
and become turgid). The difference can be important for a large tree, but for a small
shoot in a potometer the difference is usually trivial and can be ignored.
The potometer can be used to investigate how various environmental factors affect
the rate of transpiration.
Read the method involved in using a photometer (page 198-199)
Suggest a reason why each of the following procedures are carried out in
preparation of the photometer
1. The leafy shoot is cut under water rather than in air
__________________________________________________________________
__________________________________________________________________
__________________________________________________________________
__________________________________________________________________
2. All joints are sealed with waterproof jelly
____________________________________________________________________________________________________________________________________________________________________________________________________________________________________________________________________________
6
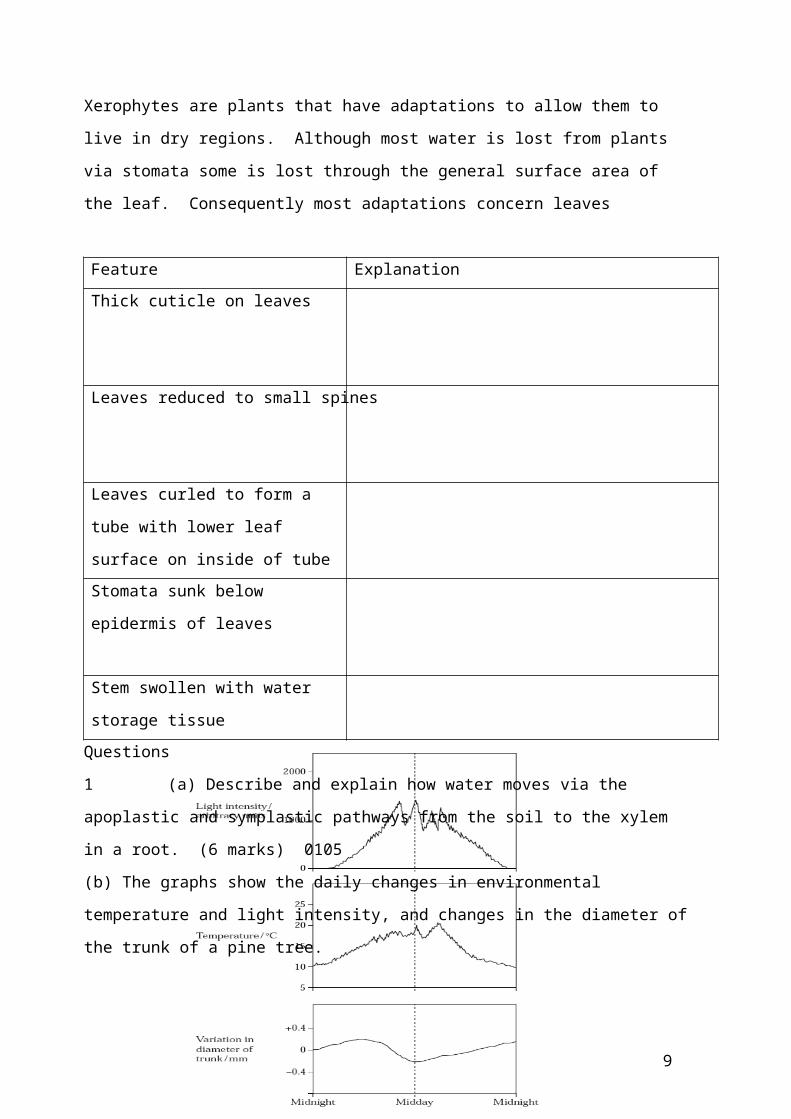
Xerophytes
Xerophytes are plants that have adaptations to allow them to live in dry regions.
Although most water is lost from plants via stomata some is lost through the general
surface area of the leaf. Consequently most adaptations concern leaves
Feature Explanation
Thick cuticle on leaves
Leaves reduced to small spines
Leaves curled to form a tube with
lower leaf surface on inside of tube
Stomata sunk below epidermis of
leaves
Stem swollen with water storage
tissue
Questions
1 (a) Describe and explain how water moves via the apoplastic and
symplastic pathways from the soil to the xylem in a root. (6 marks) 0105
(b) The graphs show the daily changes in environmental temperature and light
intensity, and changes in the diameter of the trunk of a pine tree.
7
Use information from the graphs, and your knowledge of the cohesion-tension theory
of water movement through a plant, to explain why the diameter of the trunk is
smallest at midday.
(6 marks)
(c) Describe and explain three ways in which the leaves of xerophytic plants may be
adapted to reduce water loss. (3 marks) 0105
2 (a) Two plants of a similar height were growing in the same conditions. The table
shows their rate of water uptake and water loss over a 25-hour period in summer.
(i) The patterns of water uptake and patterns of water loss are similar in both plants.
Describe these similarities.
..........................................................................................................................................
............................................................................................................................(1 mark)
(ii) In plant A, water loss starts before water uptake. Explain why. (5
marks)
S (iii) Use your knowledge of Fick’s law to suggest an explanation for the greater rates
of water loss by plant B.
..........................................................................................................................................
..........................................................................................................................................
..........................................................................................................................................
..........................................................................................................................................
(2 marks)
(b) Explain three ways in which xerophytic plants minimise water loss due to
transpiration.
1 .......................................................................................................................................
8
.........................................................................................................................................
2 .......................................................................................................................................
..........................................................................................................................................
3 ......................................................................................................................................
..........................................................................................................................................
(3 marks)0207
3 The chart shows the results obtained from an investigation to determine the effect of light
intensity on the tension in xylem vessels in the leaves of a plant.
(a) Describe and explain the effects of increasing light intensity on the tension in the xylem
vessels in the leaves.
(5 marks)
(b) Explain why it was important to keep the humidity constant during the investigation.
...............................................................................................................................................
...............................................................................................................................................
...............................................................................................................................................
...............................................................................................................................................
(2 marks)
(c) Explain how the negative pressure in the xylem vessels of the leaves causes water to
move up the plant from the xylem in the roots.
...............................................................................................................................................
...............................................................................................................................................
9
...............................................................................................................................................
...............................................................................................................................................
..............................................................................................................................................
...............................................................................................................................................
...............................................................................................................................................
...............................................................................................................................................
(4 marks0205
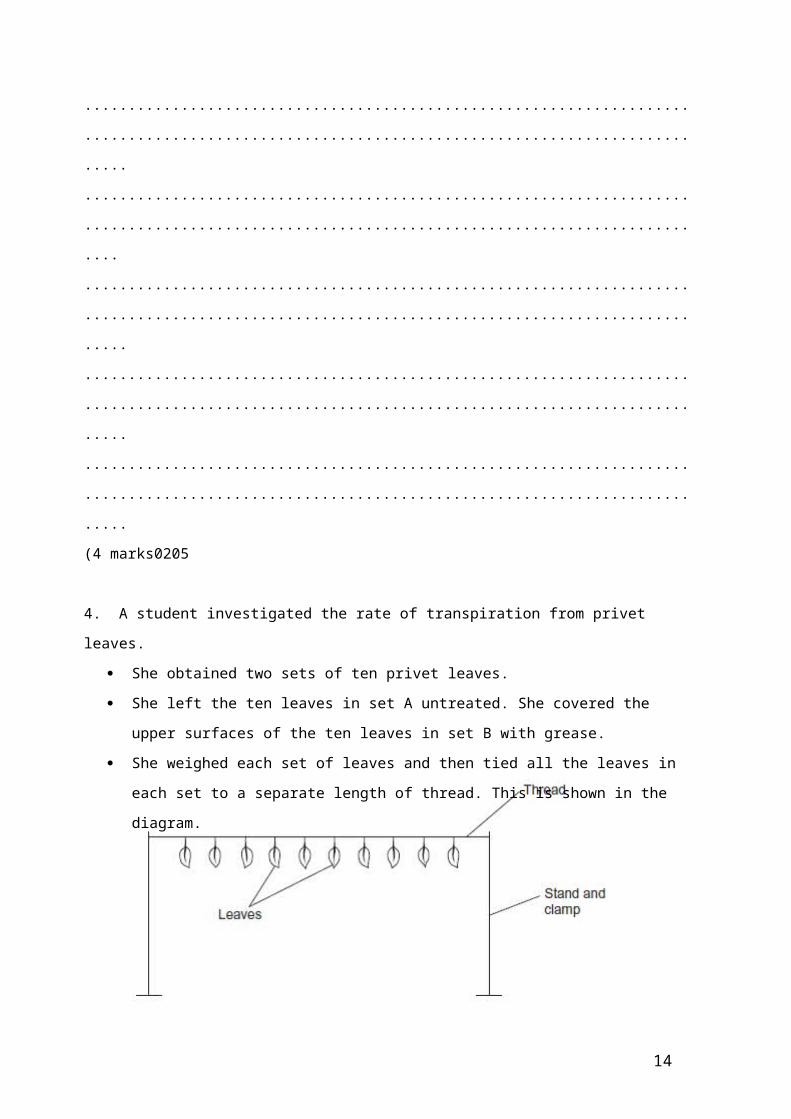
4. A student investigated the rate of transpiration from privet leaves.
She obtained two sets of ten privet leaves.
She left the ten leaves in set A untreated. She covered the upper surfaces of the ten
leaves in set B with grease.
She weighed each set of leaves and then tied all the leaves in each set to a separate
length of thread. This is shown in the diagram.
She then weighed each set of leaves every 20 minutes over a period of 2 hours and plotted a
graph of her results.
10
(a) Give two environmental conditions that the student should have kept constant during
this investigation.
1 .........................................................................................................................................
2 .........................................................................................................................................
(2 marks)
(b) The student measured the water loss in milligrams. Explain the advantage of using
ten leaves when taking measurements in milligrams.
...........................................................................................................................................
...........................................................................................................................................
(1 mark)
(c) Explain the change in mass of untreated leaves in set A shown in the graph.
...........................................................................................................................................
...........................................................................................................................................
...........................................................................................................................................
...........................................................................................................................................
...........................................................................................................................................
...........................................................................................................................................
(3 marks)
(d) The results that the student obtained for the leaves in set B were different from those
for set A. Suggest an explanation for this difference.
...........................................................................................................................................
...........................................................................................................................................
...........................................................................................................................................
...........................................................................................................................................
...........................................................................................................................................
(2 marks)jun11
5 (a) Students measured the rate of transpiration of a plant growing in a pot under different environmental conditions. Their results are shown in the table.
During transpiration, water diffuses from cells to the air surrounding a leaf.(a) (i) Suggest an explanation for the difference in transpiration rate between conditions A and B.
11

........................................................................................................................................
...
........................................................................................................................................
...
........................................................................................................................................
...
........................................................................................................................................
...
........................................................................................................................................
...(2 marks)(a) (ii) Suggest an explanation for the difference in transpiration rate betweenconditions A and C........................................................................................................................................................................................................................................................................................................................................................................................................................................................................................................................................................................................................................................................................................................................(2 marks)(b) Scientists investigated the rate of water movement through the xylem of a twig from atree over 24 hours. The graph shows their results. It also shows the light intensity for
12
the same period of time.
(b) (i) Describe the relationship between the rate of water movement through the xylem andthe light intensity..................................................................................................................................................................................................................................................................................................................................................................................................................................(1 mark)(b) (ii) Explain the change in the rate of water movement through the xylem between 06.00 and 12.00 hours.............................................................................................................................................................................................................................................................................................................................................................................................................................................................................................................................................................................
13
........................................................................................................................................
...(2 marks)(b) (iii) The scientists also measured the diameter of the trunk of the tree on which the twighad been growing. The diameter was less at 12.00 than it was at 03.00 hours.Explain why the diameter was less at 12.00 hours........................................................................................................................................................................................................................................................................................................................................................................................................................................................................................................................................................................................................................................................................................................................(2 marks)Jan 11
14


![FAUj 6c&] ] ]) "] $ ] ] $ ! , ] ]] & $ & $](https://img.dokumen.tips/doc/110x75/60a05042d094992fe853b2f2/-j-6c-.jpg)