Embed Size (px)
Citation preview

Volume II: Project IntroductIon & oVerVIew
Volume III: BIoPhysIcal Valued comPonents
Volume V: addItIonal yesa reQuIrements
Volume IV: socIoeconomIc Valued comPonents
Introduction Terrain Features Employment and Income
Effects of the Environment on the Project
Accidents and Malfunctions
Economic Development and Business Sector
Conceptual Environmental Management Plans
Monitoring Plans
Conclusion
References
Employability
Community Vitality
Community Infrastructure and Services
Cultural Continuity
Land Use and Tenure
Socio-Economic Baseline Report
Stage 1 Archaeological Mitigation
Historic Resource Impact Assessment of the Freegold Road
Land Use and Tenure Baseline Report
Water Quality
Air Quality
Noise
Fish & AquaticResources
Rare Plants &Vegetation Health
12 Wildlife
First Nations and Community Consultation
3 Project Location
4 Project Description
5 Effects Assessment Methodology
2a Consultation Log
2B Consultation Materials
Surficial Geology, Terrain and Soils Baseline
Climate Change Report
Regulatory Setting
Road Use Plan
Wildlife Mitigation and Monitoring Plan
Risk Register
Emergency Response Plan
Cyanide Management Plan
Terrain Hazards Assessment for Proposed Access Roads and Airstrip
Preliminary Geotechnical Study
Terrain Hazards Assessment for Proposed Mine Site
Fluvial Geomorphology Hazard Assessment for Proposed Access Roads
Water and Sediment Quality Baseline
8a Baseline Climate Report
Fish and Aquatic Resources Baseline Report
Vegetation Baseline Report
Wildlife Baseline Report
Bird Baseline Report
7B Baseline Hydrology Report
Met, Dustfall, and Noise Data Summary Report 2011
Freegold Road Fish and Aquatic Baseline
7c 2012 Baseline Hydrogeology Report
Air Quality Baseline 2013
Preliminary Fish Habitat Compensation Plan
Freegold Road Extension S&EC Risk Assessment
7d Geochemistry Reports
Numerical Groundwater Modelling
7F Water Balance Report
Water Quality Model Report
Project Effects on Water Quantity
4a Conceptual Closure and ReclamationPlan
Project Components and Activities List
Cumulative Effects Assessment List
4B Freegold Road Report
Water Management Plan
Volume I: EXECUTIVE SUMMARY
1
2
6 13 20
2115
22
23
24
25
14
16
17
18
19
6a
20a
21a
22a
21B
22B
22c
23a
6B
6c
6d
6e
7
8
9
10
11
7a
13a
18a
18B
19a
7G
7h
7e
4c
5a
5B
8B
8c
10a
10B
10c
10d
11a
12a
12B
VOLUME III: BIOPHYSICAL VALUED COMPONENTS
CASINO PROJECT | Proposal for Executive Committee Review | Jan 2014
APPENDIX 7B: BASELINE HYDROLOGY REPORT
BaselineBaseline
7B 7B Baseline Hydrology ReportBaseline Hydrology Report
77cc 2012 Baseline 2012 Baseline


CASINO MINING CORPORATIONCASINO PROJECT
PREPARED FOR:
Casino Mining Corporation 2050 - 1111 West Georgia St. Vancouver, BC V6E 4M3
VA101-325/14-5 Rev 0 October 10, 2013
BASELINE HYDROLOGY REPORT
Knight Piésold www.knightp ieso ld .com
C O N S U L T I N G
PREPARED BY:
Knight Piésold Ltd.
Suite 1400 – 750 West Pender Street
Vancouver, BC V6C 2T8 Canada
p. +1.604.685.0543 • f. +1.604.685.0147


CASINO MINING CORPORATION
CASINO PROJECT
BASELINE HYDROLOGY REPORT i of iii VA101-325/14-5 Rev 0 October 10, 2013
TABLE OF CONTENTS
PAGE
TABLE OF CONTENTS ......................................................................................................................... i
1 – INTRODUCTION ............................................................................................................................. 1
2 – REGIONAL HYDROLOGY .............................................................................................................. 3 2.1 REGIONAL SETTING ........................................................................................................... 3 2.2 REGIONAL STREAMFLOW ................................................................................................. 3
3 – CASINO HYDROMETRIC SAMPLING PROGRAM ....................................................................... 7 3.1 PROGRAM DESCRIPTION .................................................................................................. 7 3.2 DATA CORRECTION AND STREAMFLOW RECORD DEVELOPMENT ........................... 9
3.2.1 Canadian Creek (W3) ............................................................................................ 10 3.2.2 Middle Casino Creek (H18) .................................................................................... 10
3.3 WINTER SEASON STREAMFLOW APPROXIMATION .................................................... 12 3.4 DISCUSSION OF MEASURED STREAMFLOW RESULTS .............................................. 12
4 – SYNTHETIC FLOW SERIES GENERATION ............................................................................... 20 4.1 METHODOLOGY ................................................................................................................ 20
4.1.1 Ranked Regression Methodology .......................................................................... 20 4.1.2 Ranked Regression Results .................................................................................. 21
4.2 SYNTHETIC FLOW RESULTS ........................................................................................... 27 4.2.1 Britannia Creek Unit Runoff Comparison ............................................................... 27 4.2.2 Dip Creek Unit Runoff Comparison ....................................................................... 30 4.2.3 Casino Creek Unit Runoff Comparison .................................................................. 30
5 – STREAMFLOW STATISTICS ....................................................................................................... 36 5.1 PEAK FLOW ANALYSIS .................................................................................................... 36
5.1.1 Methodology........................................................................................................... 36 5.1.2 Results ................................................................................................................... 36
5.2 10-YEAR, 7-DAY LOW FLOWS ......................................................................................... 39 5.3 WET AND DRY MONTHLY FLOWS .................................................................................. 39
6 – REFERENCES .............................................................................................................................. 43
7 – CERTIFICATION ........................................................................................................................... 44
TABLES
Table 2.2-1 WCS Regional Streamflow Stations ............................................................................... 5 Table 4.2-1 Long-term Unit Runoff Comparison All Stations .......................................................... 28
Table 4.2-2 WSC Stations in Casino Area Mean Monthly Unit Runoff............................................ 29
CASINO MINING CORPORATION
CASINO PROJECT
BASELINE HYDROLOGY REPORT ii of iii VA101-325/14-5 Rev 0 October 10, 2013
Table 5.1-1 Regional Peak Flow Return Period Coefficients .......................................................... 37 Table 5.1-2 Recommended peak Flow Values for Project Streamflow Stations ............................. 38 Table 5.2-1 Low Flow Statistics, 10-year return Period 7-Day Low Flows ...................................... 39 Table 5.3-1 Wet and Dry Runoff, 10-Year Wet and Dry Monthly Unit Runoff (l/s/km2) ................... 41
FIGURES
Figure 1.1-1 Project Location Map ...................................................................................................... 2 Figure 2.2-1 Regional Setting and WSC Streamflow Guaging Stations ............................................. 4 Figure 2.2-2 WSC Stations In Casino Area Mean Monthly Unit Runoff ............................................. 6 Figure 3.1-1 Project Streamflow Guaging Station Locations .............................................................. 8
Figure 3.1-2 Streamflow Gauging Network Schematic ....................................................................... 9 Figure 3.2-1 Canadian Creek Station (W3) Rating Curve ................................................................ 11 Figure 3.2-2 Middle Casino Creek Station (H18) Rating Curve ........................................................ 11 Figure 3.4-1 Canadian Creek Station (W3) Measured Discharge Hydrograph ................................ 13 Figure 3.4-2 Middle Casino Creek Station (H18), Measured Discharge Hydrograph ...................... 14 Figure 3.4-3 All Sub-Watersheds, Measured Unit Runoff Hydrographs ........................................... 15 Figure 3.4-4 Britania Creek Sub-Watersheds, Measured Unit Runoff Hydrographs ........................ 16 Figure 3.4-5 Dip Creek Sub-Watersheds, Measured Unit Runoff Hydrographs ............................... 17 Figure 3.4-6 Casino Creek Sub-Watersheds, Measured Unit Runoff Hydrographs ......................... 18 Figure 3.4-7 Measured Unit Runoff Duration Curve, All Stations ..................................................... 19 Figure 4.1-1 H18 and Big Creek May Ranked Regression Relationship .......................................... 23 Figure 4.1-2 H18 and Big Creek July Ranked Regression Relationship .......................................... 24 Figure 4.1-3 Middle Casino Creek Station (H18) Measured and Synthetic Hydrographs ................ 25
Figure 4.1-4 H18 July Flow Duration Curve ...................................................................................... 26 Figure 4.2-1 Long-term Unit Runoff Comparison, All Stations ......................................................... 31 Figure 4.2-2 WSC Stations in Casino Area Mean Monthly Unit Runoff............................................ 32 Figure 4.2-3 Long-term Unit Runoff Comparison Britannia Creek Sun-Watershed ......................... 33 Figure 4.2-4 Long-term Unit Runoff Comparison Dip Creek Sub-watershed ................................... 34 Figure 4.2-5 Long-term Unit Runoff Comparison Casino Creek Sub-Watershed ............................ 35 Figure 5.3-1 Comparison of Mean Unit Runoff ................................................................................. 42
APPENDICES
Appendix A Stage-Discharge Tables, Rating Curves, and Measured Hydrographs
Appendix B Synthetic Flow Series

CASINO MINING CORPORATION
CASINO PROJECT
BASELINE HYDROLOGY REPORT iii of iii VA101-325/14-5 Rev 0 October 10, 2013
ABBREVIATIONS
HKPL .................................................................................................. Hallam Knight Piésold Ltd KPL ................................................................................................................ Knight Piésold Ltd. Project .................................................................................................................. Casino Project WSC ..................................................................................................... Water Survey of Canada

CASINO MINING CORPORATION
CASINO PROJECT
BASELINE HYDROLOGY REPORT 1 of 44 VA101-325/14-5 Rev 0 October 10, 2013
1 – INTRODUCTION
1.1 PROJECT AND REPORT OVERVIEW
The Casino Project is a proposed copper-gold open pit mining development located within the Dip Creek and Britannia Creek watersheds, approximately 300 km northwest of Whitehorse, Yukon Territory, Canada, as shown on Figure 1.1-1. Dip Creek flows in a southwesterly direction, eventually discharging into the White River, which is a tributary of the Yukon River; while Britannia Creek flows in a northerly direction and discharges directly into the Yukon River.
Streamflow data have been collected at several locations in the Project area to support permitting, design, and future operations. Previous data collection programs and reporting include: Hallam Knight Piésold (HKPL) in 1993 (HKPL, 1993) and 1994 (HKPL, 1997) collected
preliminary data. AECOM initiated new data collection program in 2008 which they continued to operate to 2010. Knight Piésold Ltd. (KPL) completed a review of all data collected up to 2010 (KPL, 2010). KPL began operating the AECOM network in 2011 and continues to operate this streamflow
network to date.
The purpose of this report is to update the Project hydrology dataset and provide long-term streamflow estimates for the Project area. These long-term estimates were developed by comparing the available Project data (2008-2012) with regional streamflow stations operated by the Water Survey of Canada (WSC).
The final products presented in this report are: 1. A set of synthetic (modelled) daily streamflows for a 36-year period for each of nine active
hydrometric monitoring stations in the Project area. 2. Estimates of extreme flow conditions for the Project, including:
a. Peak instantaneous flows for return periods ranging from mean annual to 200 years. b. 10-year, 7-day low flows. c. 10-year wet and dry monthly flows.

CASINO MINING CORPORATION
CASINO PROJECT
BASELINE HYDROLOGY REPORT 2 of 44 VA101-325/14-5 Rev 0 October 10, 2013
Figure 1.1-1 Project Location Map

CASINO MINING CORPORATION
CASINO PROJECT
BASELINE HYDROLOGY REPORT 3 of 44 VA101-325/14-5 Rev 0 October 10, 2013
2 – REGIONAL HYDROLOGY
2.1 REGIONAL SETTING
The Casino Project is located in the Dawson Mountain Range of the Klondike Plateau, approximately 300 km northwest of Whitehorse, Yukon Territory, Canada. The Project is situated in the Dip Creek and Britannia Creek watersheds; Dip Creek drains southwest, eventually flowing into the White River, which is a tributary of the Yukon River; Britannia Creek drains north directly into the Yukon River.
The Project is located within the Boreal Cordillera ecozone, which comprises much of the southern Yukon and a large portion of northern British Columbia, and is more specifically located within the Dawson Range ecoregion (Natural Resources Canada, 1993). The Boreal Cordillera ecozone is characterized by the presence of several mountain ranges, including the Dawson Range, that trend in the north-westerly direction and include extensive plateau regions. The plateaus consist of flat or gently rolling terrain separated by broad valleys and lowlands. The climate is characterized by long, cold, dry winters and short, warm, wet summers, with conditions varying according to altitude and aspect. Average annual precipitation is generally quite low, with values in the range of 300 mm to 450 mm (Smith, Meikle, & Roots, 2004).
2.2 REGIONAL STREAMFLOW
Water Survey of Canada has operated 11 hydrometric monitoring stations within a 150 km radius of the Project site and within the Dawson Range and Klondike Plateau for varying periods of time over the past few decades. All of the regional stations are located in watersheds much larger than the Project watersheds, some of which contain high mountain terrain in the headwaters. Seven of the regional stations are currently active. The locations of the 11 regional WSC stations are presented on Figure 2.2-1, and station details are summarized in Table 2.2-1.
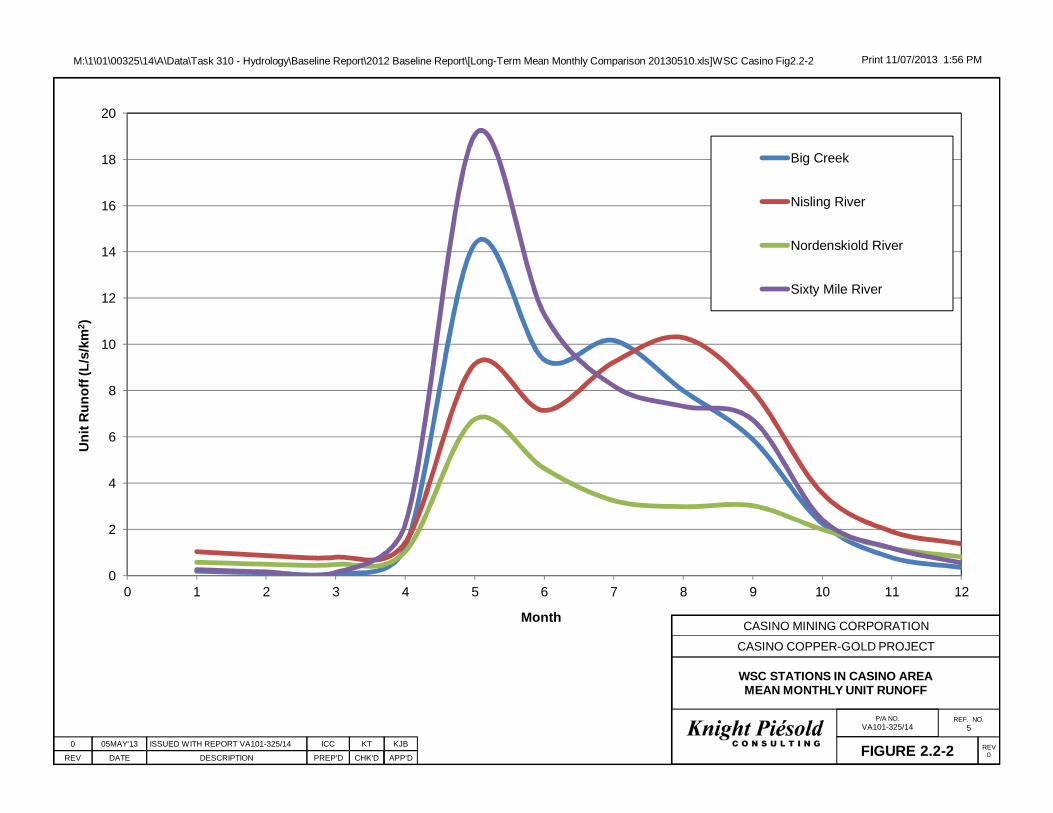
Mean annual unit runoff in the actively monitored regional watersheds ranges between 2.8 l/s/km2 and 9.2 l/s/km2. In two of the smaller regional watersheds that lack high mountain headwaters – Big Creek and Indian River – the mean annual unit runoff rates are 4.5 l/s/km2 and 2.8 l/s/km2, respectively. Streamflow in the region is typically highest in May due to melting of the winter snowpack; flows are usually sustained at moderate to high levels in the summer months due to the influence of rainfall combined with melting permafrost; followed by receding and low flows in the colder fall and winter months, as presented on Figure 2.2-2. Annual peak instantaneous flows commonly occur in the spring snowmelt freshet period on larger rivers, but on smaller streams they may also occur in summer or early autumn due to intense rain or rain-on-snow events. Flows decrease throughout the winter and minimum flows typically occur in March or early April.

PROJECT LOCATIONYukon River
Whi
te R
iver
Big Creek near the mouthBig Creek near the mouth
Stewart River at the mouthStewart River at the mouth
Yukon River at Stewart RiverYukon River at Stewart River
Indian River above the mouthIndian River above the mouth
Yukon River above White RiverYukon River above White River
Nisling River below Onion CreekNisling River below Onion Creek
Sixty Mile River near the mouthSixty Mile River near the mouth
Donjek River below Kluane RiverDonjek River below Kluane River
Snag Creek at Km 1945.6 Alaska HwySnag Creek at Km 1945.6 Alaska Hwy
Klondike River above Bonanza CreekKlondike River above Bonanza Creek Little South Klondike River below Ross CreekLittle South Klondike River below Ross Creek
550,000
550,0
00
600,000
600,0
00
650,000
650,0
00
700,00070
0,000
750,000
750,0
00
800,000
800,0
00
850,000
850,0
00
6,800,000 6,800,000
6,850,000 6,850,000
6,900,000 6,900,000
6,950,000 6,950,000
7,000,000 7,000,000
7,050,000 7,050,000
7,100,000 7,100,000
7,150,000 7,150,000
7,200,000 7,200,000
7,250,000 7,250,000
CASINO MINING CORPORATION
CASINO PROJECT
REGIONAL SETTING AND WSC STREAMFLOW GAUGING STATIONS
P/A NO. REF NO.
REV
VA101-325/14 5
0FIGURE 2.2-1DATEREV
11JULY'13
DESIGNED DRAWN CHK'D APP'D
AMD AMD IC KJB
DESCRIPTION
ISSUED WITH REPORT0
SA
VE
D: M
:\1\0
1\00
325
\14
\A\G
IS\F
igs\
Rep
ort5
_Bas
elin
eHyd
rolo
gyR
epor
t\R
egi
onal
WS
CS
trea
mflo
wG
aug
ingS
tatio
ns.
mxd
; Ju
l 11,
20
13 2
:42
PM
; cc
zem
bor
20 0 20 40 60 80 10010 km
SCALE
NOTES:1. BASE MAP: (C) MICROSOFT BING MAPS.
2. COORDINATE GRID IS IN METRES.COORDINATE SYSTEM: NAD 1983 UTM ZONE 7N.
3. THIS FIGURE IS PRODUCED AT A NOMINAL SCALE OF 1:2,000,000FOR 8.5x11 (LETTER) PAPER. ACTUAL SCALE MAY DIFFER ACCORDING TO CHANGES IN PRINTER SETTINGS ORPRINTED PAPER SIZE.
LEGENDPROJECT LOCATION
WATER SURVEY OF CANADA (WSC) ACTIVE STREAM FLOW STATION
WATER SURVEY OF CANADA (WSC) INACTIVE STREAM FLOW STATION
RIVER/CREEK

WSC Station Name Station IDYears ofRecord
No. of Years of
Complete Record
StartYear
EndYear
Latitude LongitudeDrainage
Area
Mean Annual
Discharge
Average Annual Unit
Runoff
(km2) (m3/s) (l/s/km2)
Klondike River above Bonanza Creek 09EA003 44 42 1965 2012 64°2'34" 139°24'28" 7,800 64.7 8.3
Indian River above the mouth 09EB003 27 25 1982 2012 63°47'6" 139°43'31 2,220 6.3 2.8
Stewart River at the mouth 09DD003 46 44 1963 2012 63°16'56" 139°15'16" 51,000 470 9.2
Nisling River below Onion Creek 09CA006 18 16 1995 2012 62°12'17" 139°2'33" 7,910 36.2 4.6
Sixty Mile River 09EB004 7 6 1995 2012 63°41'21" 140°9'35" 3,060 15.3 5.0
Yukon River above White River 09CD001 53 46 1956 2012 63°4'58" 139°29'54" 150,000 1190 7.9
Big Creek near the mouth 09AH003 34 31 1974 2012 62°34'7" 137°0'58" 1,750 7.8 4.5
Snag Creek at Km 1945.6 Alaska Hwy 09CB002 8 5 1989 1996 62°28'35" 140°52'7" 676 6.17 9.1
Little South Klondike River below Ross Creek 09EA005 12 11 1983 1994 63°59'45" 137°34'20" 860 7.06 8.2
Donjek River below Kluane River 09CA003 15 11 1979 1994 62°4'56" 139°51'35" 12,400 168.0 13.5
Yukon River at Stewart River 09EB002 10 6 1956 1965 63°18'42" 139°25'43" 251,000 2,380 9.5
M:\1\01\00325\14\A\Data\Task 310 - Hydrology\Baseline Report\2012 Baseline Report\[MSC_WSC_stations_Table2.1.xls]WSC stations Table 2.2-1
NOTES: 1. DATA OBTAINED FROM THE WATER SURVEY OF CANADA (WSC), BRANCH OF ENVIRONMENT CANADA.
Act
ive
D
isco
ntin
ue
d
Print 7/10/13 14:08
TABLE 2.2-1
CASINO MINING CORPORATIONCASINO COPPER-GOLD PROJECT
WSC REGIONAL STREAMFLOW STATIONS
0 13May'13 ICC KTISSUED WITH REPORT VA101-325/14-5 KJB
DATE DESCRIPTION PREP'D CHK'D APP'DREV
M:\1\01\00325\14\A\Data\Task 310 - Hydrology\Baseline Report\2012 Baseline Report\[Long-Term Mean Monthly Comparison 20130510.xls]WSC Casino Fig2.2-2 Print 11/07/2013 1:56 PM
0
2
4
6
8
10
12
14
16
18
20
0 1 2 3 4 5 6 7 8 9 10 11 12
Big Creek
Nisling River
Nordenskiold River
Sixty Mile River
0 05MAY'13 ISSUED WITH REPORT VA101-325/14 ICC KT KJB
DATE DESCRIPTION PREP'D CHK'D APP'DREV
WSC STATIONS IN CASINO AREA MEAN MONTHLY UNIT RUNOFF
FIGURE 2.2-2
CASINO MINING CORPORATION
CASINO COPPER-GOLD PROJECT
REV0
P/A NO. VA101-325/14
REF. NO.5
Un
it R
un
off
(L/s
/km
2)
Month
CASINO MINING CORPORATION
CASINO PROJECT
BASELINE HYDROLOGY REPORT 7 of 44 VA101-325/14-5 Rev 0 October 10, 2013
3 – CASINO HYDROMETRIC SAMPLING PROGRAM
3.1 PROGRAM DESCRIPTION
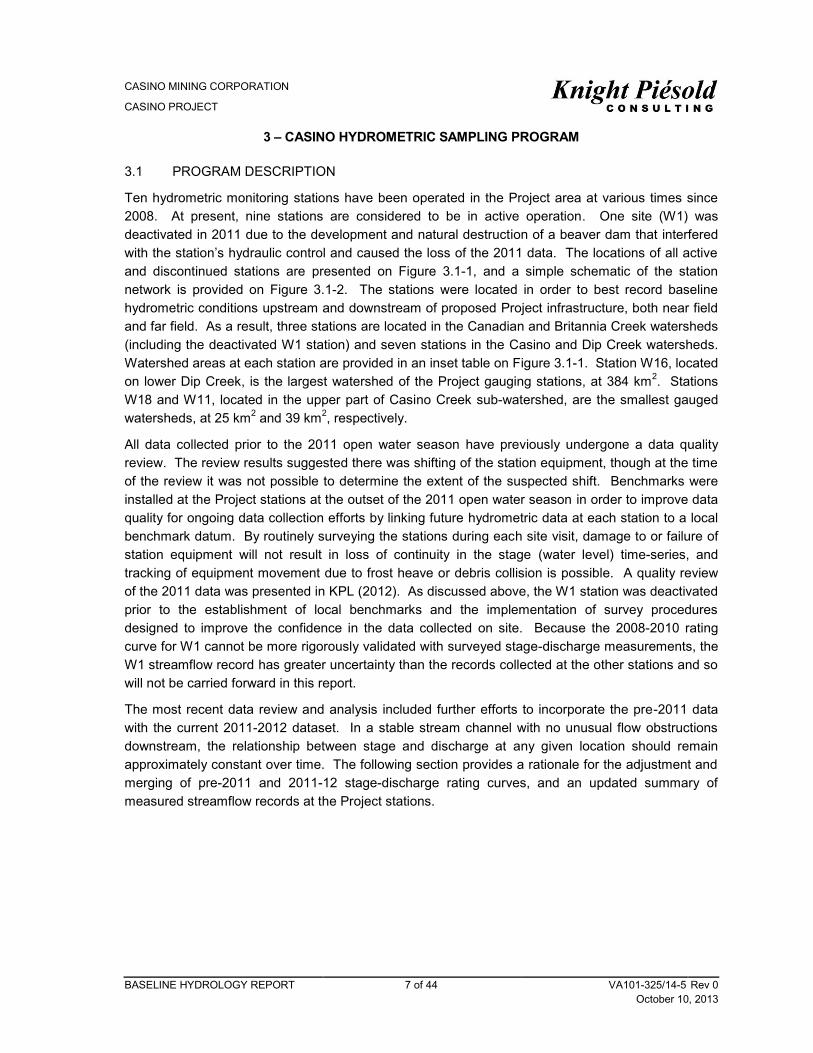
Ten hydrometric monitoring stations have been operated in the Project area at various times since 2008. At present, nine stations are considered to be in active operation. One site (W1) was deactivated in 2011 due to the development and natural destruction of a beaver dam that interfered with the station’s hydraulic control and caused the loss of the 2011 data. The locations of all active and discontinued stations are presented on Figure 3.1-1, and a simple schematic of the station network is provided on Figure 3.1-2. The stations were located in order to best record baseline hydrometric conditions upstream and downstream of proposed Project infrastructure, both near field and far field. As a result, three stations are located in the Canadian and Britannia Creek watersheds (including the deactivated W1 station) and seven stations in the Casino and Dip Creek watersheds. Watershed areas at each station are provided in an inset table on Figure 3.1-1. Station W16, located on lower Dip Creek, is the largest watershed of the Project gauging stations, at 384 km2. Stations W18 and W11, located in the upper part of Casino Creek sub-watershed, are the smallest gauged watersheds, at 25 km2 and 39 km2, respectively.
All data collected prior to the 2011 open water season have previously undergone a data quality review. The review results suggested there was shifting of the station equipment, though at the time of the review it was not possible to determine the extent of the suspected shift. Benchmarks were installed at the Project stations at the outset of the 2011 open water season in order to improve data quality for ongoing data collection efforts by linking future hydrometric data at each station to a local benchmark datum. By routinely surveying the stations during each site visit, damage to or failure of station equipment will not result in loss of continuity in the stage (water level) time-series, and tracking of equipment movement due to frost heave or debris collision is possible. A quality review of the 2011 data was presented in KPL (2012). As discussed above, the W1 station was deactivated prior to the establishment of local benchmarks and the implementation of survey procedures designed to improve the confidence in the data collected on site. Because the 2008-2010 rating curve for W1 cannot be more rigorously validated with surveyed stage-discharge measurements, the W1 streamflow record has greater uncertainty than the records collected at the other stations and so will not be carried forward in this report.
The most recent data review and analysis included further efforts to incorporate the pre-2011 data with the current 2011-2012 dataset. In a stable stream channel with no unusual flow obstructions downstream, the relationship between stage and discharge at any given location should remain approximately constant over time. The following section provides a rationale for the adjustment and merging of pre-2011 and 2011-12 stage-discharge rating curves, and an updated summary of measured streamflow records at the Project stations.

600,000
600,0
00
610,000
610,0
00
620,000
620,0
00
630,000
630,0
00
6,940,000 6,940,000
6,950,000 6,950,000
6,960,000 6,960,000
6,970,000 6,970,000
CASINO MINING CORPORATION
CASINO PROJECT
PROJECT STREAMFLOW GAUGING STATION LOCATIONS
P/A NO. REF NO.
REV
VA101-325/14 5
0FIGURE 3.1-1DATEREV
11JULY'13
DESIGNED DRAWN CHK'D APP'D
AMD AMD IC KJB
DESCRIPTION
ISSUED WITH REPORT0
SA
VE
D: M
:\1\0
1\00
325
\14
\A\G
IS\F
igs\
Rep
ort5
_Bas
elin
eHyd
rolo
gyR
epor
t\S
trea
mflo
wG
augi
ngS
tatio
ns.m
xd; J
ul 1
1, 2
013
2:4
6 P
M; c
cze
mb
or
2 0 2 4 6 8 101 km
SCALE
NOTES:1. BASE MAP: (C) MICROSOFT BING MAPS.
2. COORDINATE GRID IS IN METRES.COORDINATE SYSTEM: NAD 1983 UTM ZONE 7N.
3. THIS FIGURE IS PRODUCED AT A NOMINAL SCALE OF 1:200,000FOR 8.5x11 (LETTER) PAPER. ACTUAL SCALE MAY DIFFER ACCORDING TO CHANGES IN PRINTER SETTINGS ORPRINTED PAPER SIZE.
LEGEND
ACTIVE PROJECT STREAMFLOW GAUGING STATION
DISCONTINUED PROJECT STREAMFLOW GAUGING STATION
RIVER/CREEK
WATERSHED BOUNDARY
PROJECT LOCATION
Station Area (km2)W14 45
W3 64
W16 384
W9 194
R2 85
W4 82
H18 67
W11 39
W18 25

CASINO MINING CORPORATION
CASINO PROJECT
BASELINE HYDROLOGY REPORT 9 of 44 VA101-325/14-5 Rev 0 October 10, 2013
Figure 3.1-2 Streamflow Gauging Network Schematic
3.2 DATA CORRECTION AND STREAMFLOW RECORD DEVELOPMENT
Stage-discharge measurements provided the primary basis for guiding stage adjustments at stations where there was no reason to suspect that the stage-discharge relationship had changed over time due to changes in channel geometry, downstream beaver dam activity, or other similar factors. At each such station, the surveyed stage-discharge measurements collected in 2011 and 2012 were compared to the un-surveyed pre-2011 measurements and an appropriate vertical adjustment was applied to the pre-2011 stage values to bring the points into alignment with the 2011-12 stage-discharge points. The stage-discharge measurements, their corresponding rating curves, and measured hydrographs used in this analysis are provided in tables and figures in Appendix A.
The British Columbia hydrometric guidelines (BC MoE, 2009) specify that a minimum of 10 stage-discharge points are necessary to define a rating curve, and that rating curves should be extrapolated to no greater than twice the maximum measured discharge. While these guidelines are taken from a neighbouring jurisdiction, they are generally applicable to the collection of good-quality hydrometric data and provide a useful basis for assessing the data collected to date in the Project area. Most of the monitoring stations have 10 or more stage-discharge points defining their rating curves, although this has been achieved by subjectively adjusting the pre-2011 stage data, as described above, which introduces some uncertainty. The exceptions are stations W16 and R2 which have eight and nine stage-discharge points, respectively, defining their rating curves.
The rating curves for most of the monitoring stations are not fully developed for high-flow conditions. Therefore, large extrapolations are required to estimate the discharge values associated with the

CASINO MINING CORPORATION
CASINO PROJECT
BASELINE HYDROLOGY REPORT 10 of 44 VA101-325/14-5 Rev 0 October 10, 2013
highest flow events. Only two stations have sufficiently developed rating curves such that the maximum estimated discharge (by rating curve extrapolation) was less than two times the maximum measured discharge. These two stations are W14, and W11. Greater extents of rating curve extrapolation were required at the other stations, making their high-flow estimates generally less certain.
To demonstrate the methodology used, the results obtained, and the challenges faced to combine the pre-2011 and 2011-12 datasets, the stage adjustments and rating curve updates are described below for two stations, W3 and H18.
3.2.1 Canadian Creek (W3)
The W3 hydrometric monitoring station is located on Canadian Creek in the Britannia Creek watershed. Seven stage-discharge measurements were collected prior to 2011, and another six measurements were collected in 2011-12. The six stage measurements that define the 2011-12 rating curve for this station were surveyed to a local benchmark datum. There is no indication of a shift in the hydraulic control recorded in field notes or that is discernible from site photos for the pre-2011 discharge measurements, so the stage values for the seven pre-2011 measurements were shifted to align with the 2011-12 stage-discharge relationship by applying a constant offset (Figure 3.2-1). The pre-2011 points fall generally along the rating curve, though there is a slight discrepancy between the 2011-12 rating curve and the pre-2011 stage-discharge points in the low flow range. The highest recorded stage corresponds to a discharge that is approximately 4.6 times the highest measured discharge. This is much higher than the BC hydrometric standard for maximum extrapolation of 2.0 times the highest measured discharge (BC MoE, 2009), indicating that uncertainty in the high flow extrapolations for this station exceeds the standards.
3.2.2 Middle Casino Creek (H18)
The H18 hydrometric monitoring station is located on Casino Creek in the Dip Creek watershed. Eight stage-discharge measurements were collected prior to 2011, and another six measurements were collected in 2011-12. The six measurements that define the 2011-12 rating curve for this station were surveyed to a local benchmark datum. Photos taken during the highest measured discharge indicate a slight overbank condition, proving some validation for the break point in the curve, although the exact stage at which the break point should be applied could be refined with additional data collection. There is no indication of a shift in the hydraulic control recorded in field notes or that is discernible from site photos for the pre-2011 discharge measurements, so the stages for the eight pre-2011 discharge measurements were shifted to align with the 2011-12 stage-discharge relationship by applying a constant offset (Figure 3.2-2). The eight pre-2011 discharge measurements generally cover a lower range of flows compared to the 2011-12 measurements that form the basis of the rating curve, but the pre-2011 and 2011-12 line up well in the range of overlap. The maximum recorded stage corresponds to a flow that is approximately 2.6 times the highest measured discharge. This is slightly higher than the BC hydrometric standard for maximum extrapolation of 2.0 times the highest measured discharge (BC MoE, 2009), indicating that uncertainty in the high flow extrapolations for this station slightly exceeds the standards.

CASINO MINING CORPORATION
CASINO PROJECT
BASELINE HYDROLOGY REPORT 11 of 44 VA101-325/14-5 Rev 0 October 10, 2013
NOTES:
1. Measurement error determined from visual estimation of measurement quality combined with the error from instrumentation.
2. The maximum recorded stage corresponds to an extrapolation 4.6 times the maximum measured discharge.
Figure 3.2-1 Canadian Creek Station (W3) Rating Curve
NOTES:
1. Measurement error determined from visual estimation of measurement quality combined with the error from instrumentation.
2. The maximum recorded stage corresponds to an extrapolation 2.6 times the maximum measured discharge.
Figure 3.2-2 Middle Casino Creek Station (H18) Rating Curve

CASINO MINING CORPORATION
CASINO PROJECT
BASELINE HYDROLOGY REPORT 12 of 44 VA101-325/14-5 Rev 0 October 10, 2013
3.3 WINTER SEASON STREAMFLOW APPROXIMATION
The presence of ice within a stream channel results in an increase in water level (stage) at a given discharge compared to ice-free conditions. Therefore, the stage-discharge rating curve, which relates water level to discharge during ice-free conditions, cannot be applied to stage recorded during an ice-affected period. This means that a continuous streamflow record cannot be calculated from the stage record during the approximately seven-month winter season when ice is present in the channels (typically late October to mid-May). However, low flow estimates and monthly average flows for the entire year are needed for various modelling and statistical analyses, so an approximation must be made to infill the winter periods. WSC manually corrects the winter streamflow record at Big Creek to compensate for frozen water conditions. Winter flows for the Project stations are based on the flow patterns approximated by WSC for Big Creek. Winter low flow discharge measurements were recorded at the Project monitoring stations in 2010, 2011 and 2012, and these values were used to calibrate winter low flow estimates based on the Big Creek winter flow values and patterns. Details of the low flow calibration are provided in Section 4.1.1.
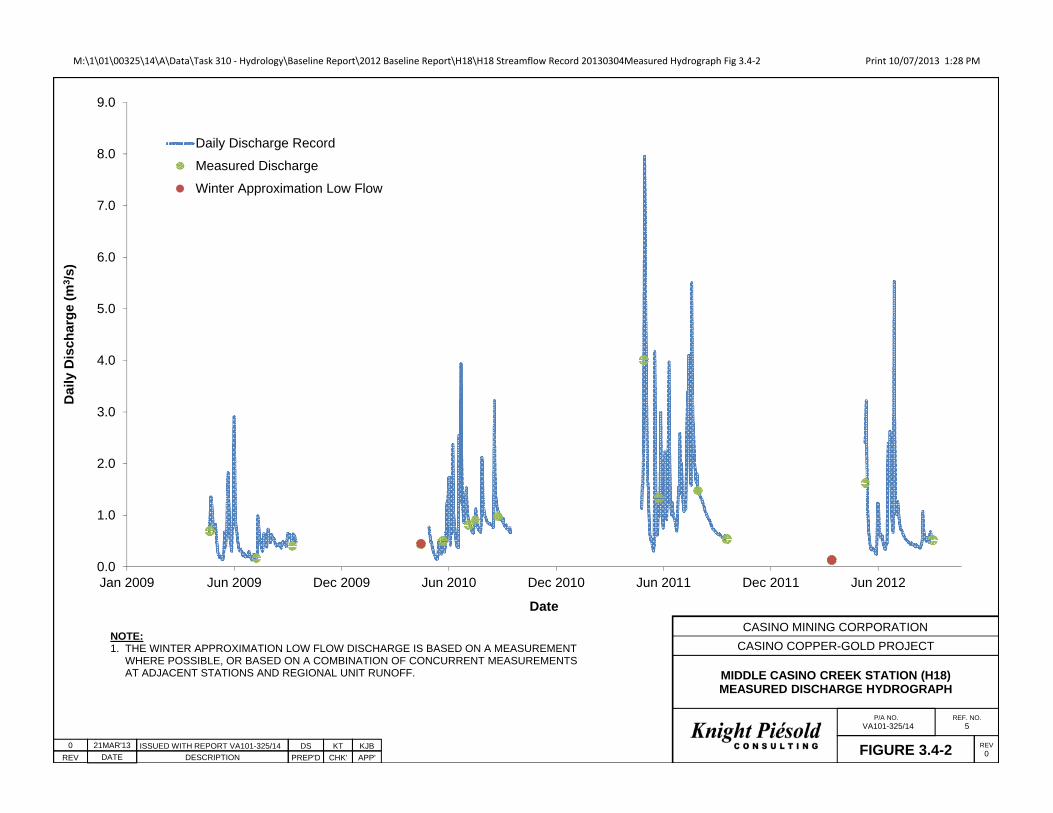
3.4 DISCUSSION OF MEASURED STREAMFLOW RESULTS
The measured streamflow hydrographs, including discharge measurements, for stations W3 and H18 are shown on Figures 3.4-1 and 3.4-2, respectively. The complete set of measured streamflow hydrographs is provided in Appendix A. The Project monitoring network records flows in a nested set of watersheds and sub-watersheds, which provides the opportunity to conduct “reality checks” on individual streamflow series and rating curves. Figures 3.4-3 to 3.4-6 show comparisons of measured unit runoff for the period of record for all stations, and for stations grouped by watershed. Figure 3.4-7 presents a comparison of flow duration curves, normalized by drainage area, for all nine active stations.
As presented on Figure 3.4-3, all of the monitoring stations recorded very consistent streamflow records, both in terms of flow timing and magnitude, with the expected small variability between stations resulting from local groundwater-surface water interactions, upstream watershed characteristics, data uncertainty, etc. This consistency lends strength to the recorded data and the analyses used to derive it. When the streamflow records are divided into individual catchments, as presented on Figures 3.4-4 to 3.4-6, it becomes apparent that in general, Britannia Creek is slightly drier than either Casino or Dip Creek, and the Dip Creek stations typically experience slightly larger rainfall-runoff events. The typically recorded flow pattern for the spring freshet seems somewhat muted in magnitude, and is followed by a brief period of very low flows and then a period of increased baseflow for the remainder of the summer. This pattern is evident even during years of low precipitation. The working hypothesis to explain this flow pattern is that that the freshet runoff gets trapped in the active permafrost layer and is not released to the streams until later in the summer when the active layer melts.

M:\1\01\00325\14\A\Data\Task 310 ‐ Hydrology\Baseline Report\2012 Baseline Report\W3\W3 Streamflow Record 20130305Measured Hydrograph Fig 3.4‐1 Print 10/07/2013 1:32 PM
0
1
2
3
4
5
6
7
8
9
10
11
Jan, 2010 Jun, 2010 Dec, 2010 Jun, 2011 Dec, 2011 Jun, 2012 Dec, 2012
Dai
ly D
isch
arg
e (m
3/s
)
Date
Daily Discharge Record
Measured Discharge
Winter Approximation Low Flow
0
DATE
21MAR'13
DESCRIPTION
ISSUED WITH REPORT VA101-325/14
PREP'D
DS
CHK'
KT
APP'
KJB
REV
CANADIAN CREEK STATION (W3)MEASURED DISCHARGE HYDROGRAPH
FIGURE 3.4-1
CASINO MINING CORPORATION
CASINO COPPER-GOLD PROJECT
REV0
P/A NO.VA101-325/14
REF. NO.5
NOTE:1. THE WINTER APPROXIMATION LOW FLOW DISCHARGE IS BASED ON A MEASUREMENT
WHERE POSSIBLE, OR BASED ON A COMBINATION OF CONCURRENT MEASUREMENTS AT ADJACENT STATIONS AND REGIONAL UNIT RUNOFF.
M:\1\01\00325\14\A\Data\Task 310 ‐ Hydrology\Baseline Report\2012 Baseline Report\H18\H18 Streamflow Record 20130304Measured Hydrograph Fig 3.4‐2 Print 10/07/2013 1:28 PM
0.0
1.0
2.0
3.0
4.0
5.0
6.0
7.0
8.0
9.0
Jan 2009 Jun 2009 Dec 2009 Jun 2010 Dec 2010 Jun 2011 Dec 2011 Jun 2012
Dai
ly D
isch
arg
e (m
3/s
)
Date
Daily Discharge Record
Measured Discharge
Winter Approximation Low Flow
0
DATE
21MAR'13
DESCRIPTION
ISSUED WITH REPORT VA101-325/14
PREP'D
DS
CHK'
KT
APP'
KJB
REV
MIDDLE CASINO CREEK STATION (H18)MEASURED DISCHARGE HYDROGRAPH
FIGURE 3.4-2
CASINO MINING CORPORATION
CASINO COPPER-GOLD PROJECT
REV0
P/A NO.VA101-325/14
REF. NO.5
NOTE:1. THE WINTER APPROXIMATION LOW FLOW DISCHARGE IS BASED ON A MEASUREMENT
WHERE POSSIBLE, OR BASED ON A COMBINATION OF CONCURRENT MEASUREMENTS AT ADJACENT STATIONS AND REGIONAL UNIT RUNOFF.

M:\1\01\00325\14\A\Data\Task 310 ‐ Hydrology\Baseline Report\2012 Baseline Report\Streamflow Record Comparison 20130304ALL Unit RO Fig3.4‐3 Print 10/07/2013 1:42 PM
0
25
50
75
100
125
150
175
200
225
May 2008 Nov 2008 May 2009 Nov 2009 May 2010 Nov 2010 May 2011 Nov 2011 May 2012 Nov 2012
H18
R2
W3
W4
W9
W11
W16
W18
W14
0
DATE
07MAY'13
DESCRIPTION
ISSUED WITH REPORT VA101-325/14
PREP'D
ICC
CHK'
KT
APP'
KJB
REV
ALL SUB-WATERSHEDSMEASURED UNIT RUNOFF HYDROGRAPHS
FIGURE 3.4-3
CASINO MINING CORPORATION
CASINO COPPER-GOLD PROJECT
REV0
P/A NO.VA101-325/14
REF. NO.5
Date
Dai
ly U
nit
Ru
no
ff (
L/s
/km
2)

M:\1\01\00325\14\A\Data\Task 310 ‐ Hydrology\Baseline Report\2012 Baseline Report\Streamflow Record Comparison 20130304Britannia Fig3.4‐4 Print 10/07/2013 1:43 PM
0
25
50
75
100
125
150
175
200
225
May 2008 Nov 2008 May 2009 Nov 2009 May 2010 Nov 2010 May 2011 Nov 2011 May 2012 Nov 2012
W3
W14
0
DATE
07MAY'13
DESCRIPTION
ISSUED WITH REPORT VA101-325/14
PREP'D
ICC
CHK'
KT
APP'
KJB
REV
BRITANNIA CREEK SUB-WATERSHEDSMEASURED UNIT RUNOFF HYDROGRAPHS
FIGURE 3.4-4
CASINO MINING CORPORATION
CASINO COPPER-GOLD PROJECT
REV0
P/A NO.VA101-325/14
REF. NO.5
Date
Dai
ly U
nit
Ru
no
ff (
L/s
/km
2)

M:\1\01\00325\14\A\Data\Task 310 ‐ Hydrology\Baseline Report\2012 Baseline Report\Streamflow Record Comparison 20130304Dip Fig3.4‐5 Print 10/07/2013 1:43 PM
0
25
50
75
100
125
150
175
200
225
May 2008 Nov 2008 May 2009 Nov 2009 May 2010 Nov 2010 May 2011 Nov 2011 May 2012 Nov 2012
R2
W9
W16
0
DATE
07MAY'13
DESCRIPTION
ISSUED WITH REPORT VA101-325/14
PREP'D
ICC
CHK'
KT
APP'
KJB
REV
DIP CREEK SUB-WATERSHEDSMEASURED UNIT RUNOFF HYDROGRAPHS
FIGURE 3.4-5
CASINO MINING CORPORATION
CASINO COPPER-GOLD PROJECT
REV0
P/A NO.VA101-325/14
REF. NO.5
Date
Dai
ly U
nit
Ru
no
ff (
L/s
/km
2)

M:\1\01\00325\14\A\Data\Task 310 ‐ Hydrology\Baseline Report\2012 Baseline Report\Streamflow Record Comparison 20130304Casino All Fig3.4‐6 Print 10/07/2013 1:43 PM
0
25
50
75
100
125
150
175
200
225
May 2008 Nov 2008 May 2009 Nov 2009 May 2010 Nov 2010 May 2011 Nov 2011 May 2012 Nov 2012
H18
W4
W11
W18
0
DATE
07MAY'13
DESCRIPTION
ISSUED WITH REPORT VA101-325/14
PREP'D
ICC
CHK'
KT
APP'
KJB
REV
CASINO CREEK SUB-WATERSHEDSMEASURED UNIT RUNOFF HYDROGRAPHS
FIGURE 3.4-6
CASINO MINING CORPORATION
CASINO COPPER-GOLD PROJECT
REV0
P/A NO.VA101-325/14
REF. NO.5
Date
Dai
ly U
nit
Ru
no
ff (
L/s
/km
2)

M:\1\01\00325\14\A\Data\Task 310 - Hydrology\Baseline Report\2012 Baseline Report\Streamflow Record Comparison 20130304FDC All Sites Fig3.4-7 Print 03/07/20133:44 PM
0
20
40
60
80
100
120
0% 10% 20% 30% 40% 50% 60% 70% 80% 90% 100%
Un
it R
un
off
(L
/s/k
m2 )
Percent of Time Equaled or Exceeded
W3 W14
W18 W11
H18 W4
R2 W16
W9
MEASURED UNIT RUNOFF DURATIONALL STATIONS
FIGURE 3.4-7
CASINO MINING CORPORATION
CASINO COPPER-GOLD PROJECT
REV0
P/A NO. VA101-325/14
REF. NO.5Knight Piésold
C O N S U L T I N G0
DATE
9MAY'13
DESCRIPTION
ISSUED WITH REPORT DS
PREP'DREV
NOTE:1. THE CURVES PRESENTED INCLUDE CONCURRENT MEASURED DATA ONLY.
Casino Creek Sub-Watershed
Dip Creek Watershed
Britannia Creek Watershed
KT
CHK'D
JGC
APP'D

CASINO MINING CORPORATION
CASINO PROJECT
BASELINE HYDROLOGY REPORT 20 of 44 VA101-325/14-5 Rev 0 October 10, 2013
4 – SYNTHETIC FLOW SERIES GENERATION
4.1 METHODOLOGY
4.1.1 Ranked Regression Methodology
A long-term synthetic flow series was developed for each active Project hydrometric station using a ranked regression modelling approach, which involved regressing ranked daily flows recorded at the Project station against ranked daily flows from a regional WSC station for the concurrent period of record. The equations describing the regression trends were then applied to the long-term WSC flow record, in this case the 37-year record for Big Creek, to produce synthetic daily flow series for the Project stations.
Since the concurrent flow records from the Project stations and the WSC station are of equal length, each flow value of equal rank has an equal probability of exceedance in the dataset. The monthly regression equations account for differences in drainage area and other physical characteristics that affect runoff and it is assumed that these parameters are approximately constant within months over a period of several years. The comparison of flow distributions rather than simultaneous daily flows overcomes differences in the timing of rainstorm or snowmelt events between watersheds, and ultimately provides a better model for synthetically generating a likely scenario of future flow patterns. It must be recognized that the ultimate objective of this exercise is not to reproduce the exact historical flow pattern in the Project area so that one can predict what the flow was or will be on any particular day, but to generate a dataset that provides a good representation of the expected future long-term mean annual discharge in the stream and the associated year to year, month to month, and day to day variability of flows.
A detailed description of the methodology used to select an appropriate regional surrogate watershed was undertaken for the 2010 Hydrometeorology Report (ref: VA101-325/3-1), issued on June 15, 2010 (KPL, 2010). Big Creek and the Indian River were identified as the regional flow records most suitable for use in developing long-term synthetic flow series for the Project stations. Both of these WSC stations have considerably larger drainage areas than the Project stations, so they might tend to under-represent the unit runoff generated during convective rainstorm events at the Project stations. Convective storms can cover an entire watershed where drainage areas are small, but this becomes decreasingly common as drainage area increases. The WSC gauging stations on Big Creek and Indian River have drainage areas of 1,750 km2 and 2,200 km2, respectively. The Project gauging stations have drainage areas ranging between 25 km2 and 384 km2, or one to two orders of magnitude smaller than the WSC gauging stations.
The Big Creek station has more data concurrent with the Project stations, and thus provided a larger sample to produce more meaningful correlations. In addition, the Big Creek streamflow record produced better correlations with the Project stations in general than did the Indian River record when regressed against the measured flow data for H18, W14, and W4, which are considered to represent the range of watershed characteristics in the study area. Therefore, the Big Creek streamflow record was selected for use in developing long-term synthetic flow series for all Project stations.
The ranked regression modelling was applied to data from discrete time periods defined by the primary mechanism determining flow patterns: May for rising limb of the spring freshet; June for the

CASINO MINING CORPORATION
CASINO PROJECT
BASELINE HYDROLOGY REPORT 21 of 44 VA101-325/14-5 Rev 0 October 10, 2013
falling limb of the spring freshet; July and August each for the period of elevated baseflow; and September and October combined for the autumn falling limb of the annual hydrograph. For example, if the bulk of runoff is due to snowmelt in May and June in both the subject (Project) watershed and the surrogate (WSC) watershed, the relationship between the two flow patterns is likely different than during drier summer months when runoff is largely driven by convective rainfall and groundwater discharge. A long-term synthetic flow series was produced by applying ranked regression equations to the long-term streamflow record from Big Creek. The synthetic series for each station contains 37 complete years of data spanning 1975 to 2012.
As discussed in Section 3.3, daily streamflow data are not available during the winter months of November through April with which to conduct regression modelling. However, long-term estimates of winter streamflow are required to best evaluate the magnitude of winter low flows, and the variability in these flows. Therefore, in order develop a synthetic winter flow series the regression correlations developed for other months in the year were applied to the period of November through April. These synthetic datasets were then compared to the instantaneous discharge measurements collected during the winters of 2010, 2011 and 2012, and the synthetic series that best matched the recorded data was selected as applicable for the winter season.
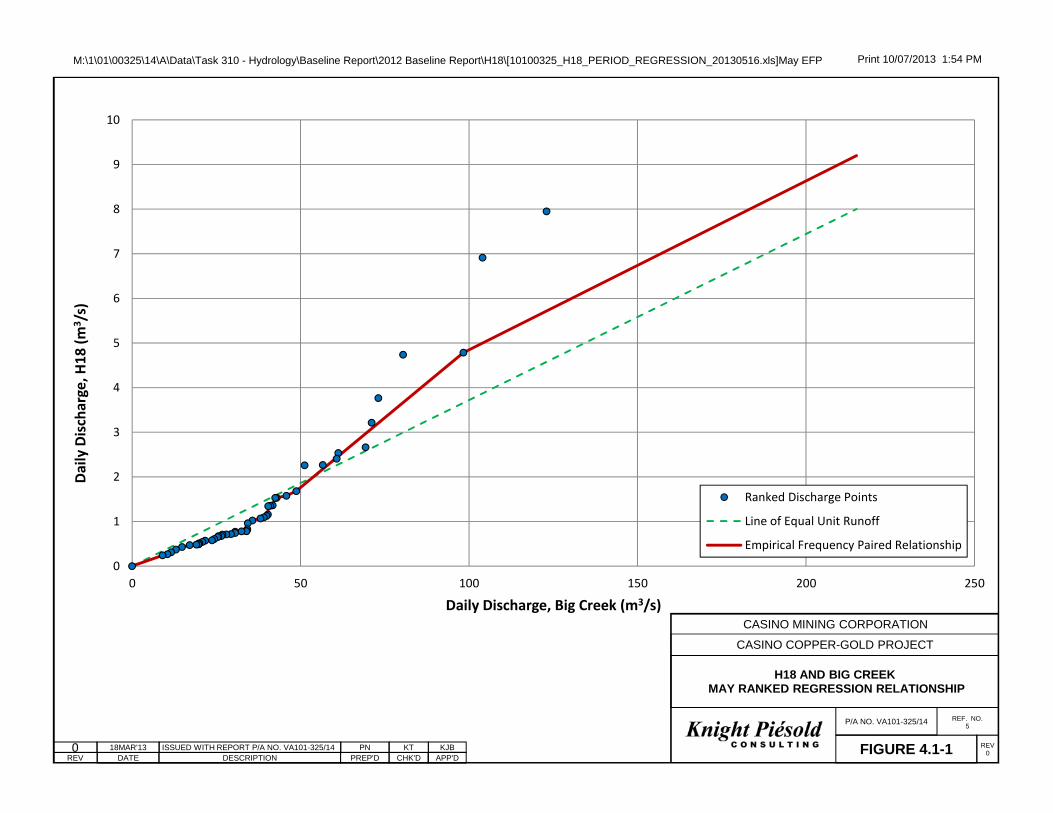
4.1.2 Ranked Regression Results
Representative examples of ranked regression plots for May and July are shown on Figures 4.1-1 and 4.1-2 for the H18 station. The complete set of ranked regression plots used to develop the regression equations and long-term flow series for each of the nine stations are included in Appendix B along with the resulting synthetic hydrographs.
During May, the regression plot shows that there is generally greater snowmelt runoff in Big Creek, however at higher flows the relationship changes and high unit runoff flows are recorded at H18. As mentioned in Section 3.4, the lower freshet runoff at H18 may be a result of proportionally more melt being lost to ground and stored in the active permafrost layer. The higher flows are inferred to be either rainfall or snowmelt derived. Proportionally higher rainfall derived flows at H18 are due to the greater likelihood of having substantial areal coverage of a convective storm system in a small watershed, thereby resulting in higher peak flows. Proportionally higher snowmelt derived flows at H18 are due to its smaller basin with smaller range of elevations and storage, so snowmelt runoff is concentrated in a smaller number of days, compared to attenuation in Big Creek. The higher flow trend is somewhat conservatively fit to the more sparse high flow dataset, in recognition of the greater uncertainty in these flows and in an attempt not to over-estimate long-term mean monthly discharge in May, as these infrequent but large high flows can easily skew the monthly mean. During July, runoff is proportionally higher at H18 over the full range of flows. This is interpreted as resulting from the release of the freshet runoff stored in the active permafrost layer at lower and mid flows, and the effect of greater areal coverage of rainfall events at higher flows. Since the quality of the results of a regression analysis is dependent on the quality of the rating curve, some divergence from these generally observed patterns is expected for stations where the maximum recorded stage corresponds to flows many times greater than the largest measured discharge.
Figure 4.1-3 shows an example comparison of concurrent measured and synthetic flows for H18. There is general agreement of flow event timing between the measured and the synthetic flow series for the measured period of record, with the exception of an August 2012 flow event predicted by the

CASINO MINING CORPORATION
CASINO PROJECT
BASELINE HYDROLOGY REPORT 22 of 44 VA101-325/14-5 Rev 0 October 10, 2013
ranked regressions that was not measured at the H18 station. This discrepancy shows up at other Project stations as well and is likely due to a precipitation event that did not occur in the immediate Project area but did affect the Big Creek watershed. The synthetic flow regression equations for H18 exhibit periods of over-prediction and under-prediction in the daily record, but do not appear to consistently under- or over-predict flows in any given season. This variability is expected, considering the transient nature of the summer storm events and the modelling approach which is to correctly model the magnitude and distribution of flows within each month or season, but is less concerned with actually predicting specific runoff events. The measured and synthetic flow hydrograph comparisons for the remainder of the stations are included in Appendix B.
The measured and synthetic flow duration curves (FDC’s) for the H18 station are shown on Figure 4.1-4 for the period of concurrent data. The plot shows exact agreement between the measured and synthetic flows until the highest flows which are exceeded less than 5% of the time. This exact agreement is a result of the regression model methodology since each flow value is fit during the modelling process, except where extrapolations are developed such as in the May high flow trend, and therefore the FDC’s should be an exact match except where extrapolations were applied. Consequently, the FDC plot is simply a tool used to assess whether the model is performing correctly, and since little other meaningful information can be gleaned from this comparison, no other measured/synthetic flow duration curve comparisons are presented in this report.
M:\1\01\00325\14\A\Data\Task 310 - Hydrology\Baseline Report\2012 Baseline Report\H18\[10100325_H18_PERIOD_REGRESSION_20130516.xls]May EFP Print 10/07/2013 1:54 PM
0
1
2
3
4
5
6
7
8
9
10
0 50 100 150 200 250
Daily D
isch
arge
, H18
(m3 /
s)
Daily Discharge, Big Creek (m3/s)
Ranked Discharge Points
Line of Equal Unit Runoff
Empirical Frequency Paired Relationship
0 18MAR'13 ISSUED WITH REPORT P/A NO. VA101-325/14 PN KT KJBDATE DESCRIPTION PREP'D CHK'D APP'DREV
H18 AND BIG CREEKMAY RANKED REGRESSION RELATIONSHIP
FIGURE 4.1-1
CASINO MINING CORPORATION
CASINO COPPER-GOLD PROJECT
REV0
P/A NO. VA101-325/14 REF. NO.5

M:\1\01\00325\14\A\Data\Task 310 - Hydrology\Baseline Report\2012 Baseline Report\H18\[10100325_H18_PERIOD_REGRESSION_20130516.xls]Jul EFP Print 10/07/2013 1:56 PM
0
2
4
6
8
10
12
0 50 100 150 200 250 300
Daily D
isch
arge
, H18
(m3 /
s)
Daily Discharge, Big Creek (m3/s)
Ranked Discharge Points
Line of Equal Unit Runoff
Empirical Frequency Paired Relationship
0 18MAR'13 ISSUED WITH REPORT P/A NO. VA101-325/14 PN KT KJBDATE DESCRIPTION PREP'D CHK'D APP'DREV
H18 AND BIG CREEKJULY RANKED REGRESSION RELATIONSHIP
FIGURE 4.1-2
CASINO MINING CORPORATION
CASINO COPPER-GOLD PROJECT
REV0
P/A NO. VA101-325/14 REF. NO.5

M:\1\01\00325\14\A\Data\Task 310 - Hydrology\Baseline Report\2012 Baseline Report\H18\[10100325_H18_PERIOD_REGRESSION_20130516.xls]HYDROGRAPH Print 10/07/2013 1:57 PM
0.0
1.0
2.0
3.0
4.0
5.0
6.0
7.0
8.0
9.0
Apr 2009 Jul 2009 Nov 2009 Mar 2010 Jul 2010 Nov 2010 Mar 2011 Jul 2011 Nov 2011 Mar 2012 Jul 2012 Nov 2012
Dai
ly D
isch
arg
e (m
3 /s)
Measured Record
Synthetic Series
0 18MAR'13 ISSUED WITH REPORT P/A NO. VA101-325/14 DS KT KJB
DATE DESCRIPTION PREP'D CHK'D APP'DREV
MIDDLE CASINO CREEK STATION (H18)MEASURED AND SYNTHETIC HYDROGRAPHS
FIGURE 4.1-3
CASINO MINING CORPORATION
CASINO COPPER-GOLD PROJECT
REV0
P/A NO.VA101-325/14
REF. NO.5

M:\1\01\00325\14\A\Data\Task 310 - Hydrology\Baseline Report\2012 Baseline Report\H18\[10100325_H18_PERIOD_REGRESSION_20130516.xls]Jul FDC Fig4.1-4Print 10/07/2013 1:59 PM
0
1
2
3
4
5
6
7
0% 10% 20% 30% 40% 50% 60% 70% 80% 90% 100%
Dis
char
ge
(m3 /
s)
Percent of Time Equalled or Exceeded
Synthetic
Measured
0 18MAR'13 ISSUED WITH REPORT P/A NO. VA101-325/14 DS KT KJB
DATE DESCRIPTION PREP'D CHK'D APP'DREV
H18JULY FLOW DURATION CURVE
FIGURE 4.1-4
CASINO MINING CORPORATION
CASINO COPPER-GOLD PROJECT
REV0
REF. NO.6

CASINO MINING CORPORATION
CASINO PROJECT
BASELINE HYDROLOGY REPORT 27 of 44 VA101-325/14-5 Rev 0 October 10, 2013
4.2 SYNTHETIC FLOW RESULTS
The resulting mean monthly and mean annual long-term synthetic flow estimates for all stations are summarized in Table 4.2-1 (discharge) and Table 4.2-2 and Figure 4.2-1 (unit runoff). The monthly flows for all 37 years in the synthetic flow series are provided in Appendix B.
The unit runoff results presented in Table 4.2-2 and Figure 4.2-1 illustrate the following patterns: Mean annual unit runoff at the nine active Project monitoring stations ranges between 4.3 l/s/km2
and 5.8 l/s/km2, with an average of 5.2 l/s/km2 (~165 mm annual runoff). Maximum monthly unit runoff occurs in May, June, or July depending on the station, with
maximum mean monthly values ranging between 12.0 l/s/km2 and 16.5 l/s/km2.
Similar to the measured flow comparison, the good coverage provided by the overlapping Project station network provides an opportunity to validate the synthetic flow. Useful “reality checks” for individual results can be provided by comparing stations situated in nested watersheds, as discussed below. Furthermore, the overall mean monthly runoff distribution for the Project, developed by averaging all nine long-term synthetic flow series, generally agrees well with the most representative regional flow series as presented on Figure 4.2-2.
4.2.1 Britannia Creek Unit Runoff Comparison
A comparison of long-term synthetic mean monthly unit runoff for the two active monitoring stations in Britannia Creek watershed is shown on Figure 4.2-3. It indicates that the two stations have very similar unit runoff in all months of the year, except May, where the unit runoff at W14 is higher than at W3. Furthermore, both of these stations exhibit lower runoff than in the Casino and Dip Creek watersheds, as shown on Figure 4.2-1. These differences may result from their different watershed aspect on the leeward side of the Casino/Britannia watershed divide. The average long-term mean annual unit runoff at these stations was determined to be 4.4 l/s/km2 (~135 mm annual runoff).

January February March April May June July August September October November December Annual
Britannia Creek (W14) 45 0.01 0.01 0.00 0.05 0.71 0.43 0.43 0.27 0.31 0.12 0.04 0.02 0.20
Canadian Creek (W3) 64 0.01 0.01 0.01 0.06 0.82 0.71 0.64 0.37 0.39 0.15 0.06 0.03 0.27
Lower Dip Creek (W16) 384 0.02 0.01 0.01 0.26 3.90 4.59 4.29 3.49 2.20 0.82 0.29 0.13 1.68
Upper Dip Creek (W9) 194 0.07 0.05 0.04 0.35 2.43 2.34 3.20 2.22 1.68 0.80 0.31 0.14 1.13
Victor Creek (R2) 85 0.02 0.01 0.01 0.18 0.91 1.35 1.39 0.72 0.72 0.23 0.08 0.04 0.47
Lower Casino Creek (W4) 82 0.05 0.03 0.03 0.18 0.99 0.79 1.05 0.80 0.74 0.41 0.20 0.10 0.45
Middle Casino Creek (H18) 67 0.04 0.03 0.02 0.14 0.86 0.68 0.85 0.63 0.67 0.39 0.17 0.08 0.39
Upper Casino Creek (W11) 39 0.02 0.02 0.01 0.08 0.44 0.41 0.53 0.37 0.35 0.21 0.09 0.04 0.22
Brynelsen Creek (W18) 25 0.01 0.01 0.01 0.06 0.35 0.28 0.31 0.22 0.25 0.13 0.06 0.03 0.14
M:\1\01\00325\14\A\Data\Task 310 - Hydrology\Baseline Report\2012 Baseline Report\[Long-Term Mean Monthly Comparison 20130510.xlsx]LT_monthly_Annual_Q Tab4.2-1
NOTES:
StationDrainage Area
(km2)
Mean Monthly Discharge (m3/s)
Print Jul/10/13 14:12:47
TABLE 4.2-1
CASINO MINING CORPORATIONCASINO COPPER-GOLD PROJECT
LONG-TERM MONTHLY AND ANNUAL DISCHARGE AT PROJECT STREAMFLOW STATIONS
0 05MAY'13 ICC KTISSUED WITH REPORT VA101-325/14 KJBDATE DESCRIPTION PREP'D CHK'D APP'DREV

January February March April May June July August September October November December Annual
Britannia Creek (W14) 45 0.19 0.13 0.10 1.1 15.7 9.6 9.6 6.1 6.8 2.6 0.8 0.4 4.4
Canadian Creek (W3) 64 0.23 0.15 0.13 0.9 12.8 11.1 10.0 5.8 6.0 2.3 1.0 0.4 4.3
Lower Dip Creek (W16) 384 0.05 0.03 0.03 0.7 10.1 12.0 11.2 9.1 5.7 2.1 0.8 0.3 4.4
Upper Dip Creek (W9) 194 0.38 0.26 0.21 1.8 12.6 12.1 16.5 11.5 8.6 4.1 1.6 0.7 5.8
Victor Creek (R2) 85 0.22 0.15 0.12 2.2 10.8 15.9 16.3 8.4 8.5 2.7 0.9 0.4 5.6
Lower Casino Creek (W4) 82 0.63 0.43 0.36 2.1 12.1 9.7 12.8 9.8 9.0 5.0 2.5 1.2 5.5
Middle Casino Creek (H18) 67 0.54 0.36 0.30 2.2 13.9 11.0 12.3 8.8 9.9 5.1 2.2 1.1 5.7
Upper Casino Creek (W11) 39 0.59 0.39 0.33 2.1 11.2 10.5 13.7 9.6 9.0 5.4 2.4 1.1 5.6
Brynelsen Creek (W18) 25 0.54 0.36 0.30 2.2 13.9 11.0 12.3 8.8 9.9 5.1 2.2 1.1 5.7
M:\1\01\00325\14\A\Data\Task 310 - Hydrology\Baseline Report\2012 Baseline Report\[Long-Term Mean Monthly Comparison 20130510.xlsx]LT_monthly_Annual_URO Tab4.2-2
StationDrainage Area
(km2)
Mean Monthly Unit Runoff (l/s/km2)
TABLE 4.2-2
CASINO MINING CORPORATIONCASINO COPPER-GOLD PROJECT
LONG-TERM MONTHLY AND ANNUAL UNIT RUNOFF AT PROJECT STREAMFLOW STATIONS
Print Jul/10/13 14:11:59
0 05MAY'13 ICC KTISSUED WITH REPORT VA101-325/14 KJBDATE DESCRIPTION PREP'D CHK'D APP'DREV

CASINO MINING CORPORATION
CASINO PROJECT
BASELINE HYDROLOGY REPORT 30 of 44 VA101-325/14-5 Rev 0 October 10, 2013
4.2.2 Dip Creek Unit Runoff Comparison
A comparison of long-term synthetic mean monthly unit runoff for the Dip Creek watershed is shown on Figure 4.2-4. Monthly unit runoff is fairly variable between these stations during the open water season, and this is likely a result of numerous factors including variability in surface water-ground water interactions, varying effects of permafrost, spatial diversity of massive surface ice formed over the winter and the resulting effect on melt timing (strong influence on flows at R2), and streamflow record uncertainty. However, in general, it can be said that the magnitude of runoff is similar at stations R2 and W9, and is much lower at W16, which is likely a result of its lower average watershed elevation and inferred much larger capacity of the groundwater system to convey flow beneath the channel. The average long-term mean annual unit runoff at these stations, excluding W16, was determined to be 5.7 l/s/km2 (~180 mm annual runoff).
4.2.3 Casino Creek Unit Runoff Comparison
A comparison of long-term synthetic mean monthly unit runoff for the Casino Creek sub-watershed is shown on Figure 4.2-5. All four stations exhibit very similar long-term synthetic mean monthly unit runoff with only minor variation in each month, which again can be primarily attributed to groundwater and permafrost variability and streamflow record uncertainty. Overall, these series strongly support each other and lend strength to the individual flow series. The average long-term mean annual unit runoff at these stations was determined to be 5.6 l/s/km2 (~175 mm annual runoff).

M:\1\01\00325\14\A\Data\Task 310 - Hydrology\Baseline Report\2012 Baseline Report\[Long-Term Mean Monthly Comparison 20130510.xls]All Fig4.2-1 Print 10/07/2013 2:01 PM
0
2
4
6
8
10
12
14
16
18
Jan Feb Mar Apr May Jun Jul Aug Sep Oct Nov Dec Annual
W11
W18
H18
W4
R2
W9
W16
W3
W14
0 05MAY'13 ISSUED WITH REPORT VA101-325/14 ICC KT KJB
DATE DESCRIPTION PREP'D CHK'D APP'DREV
LONG-TERM UNIT RUNOFF COMPARISONALL STATIONS
FIGURE 4.2-1
CASINO MINING CORPORATION
CASINO COPPER-GOLD PROJECT
REV0
P/A NO. VA101-325/14
REF. NO.5
Un
it R
un
off
(L/s
/km
2)

M:\1\01\00325\14\A\Data\Task 310 - Hydrology\Baseline Report\2012 Baseline Report\[Long-Term Mean Monthly Comparison 20130510.xls]WSC Casino Fig4.2-2 Print 10/07/2013 2:03 PM
0
2
4
6
8
10
12
14
16
18
20
0 1 2 3 4 5 6 7 8 9 10 11 12
Big Creek
Nisling River
Nordenskiold River
Sixty Mile River
Project Watershed Average
0 05MAY'13 ISSUED WITH REPORT VA101-325/14 ICC KT KJB
DATE DESCRIPTION PREP'D CHK'D APP'DREV
WSC STATIONS IN CASINO AREA MEAN MONTHLY UNIT RUNOFF
FIGURE 4.2-2
CASINO MINING CORPORATION
CASINO COPPER-GOLD PROJECT
REV0
P/A NO. VA101-325/14
REF. NO.5
Un
it R
un
off
(L/s
/km
2)
Month

M:\1\01\00325\14\A\Data\Task 310 - Hydrology\Baseline Report\2012 Baseline Report\[Long-Term Mean Monthly Comparison 20130510.xls]Britannia Fig4.2-3 Print 10/07/2013 2:04 PM
0
2
4
6
8
10
12
14
16
18
Jan Feb Mar Apr May Jun Jul Aug Sep Oct Nov Dec Annual
W3
W14
0 05MAY'13 ISSUED WITH REPORT VA101-325/14 ICC KT KJB
DATE DESCRIPTION PREP'D CHK'D APP'DREV
LONG-TERM UNIT RUNOFF COMPARISONBRITANNIA CREEK SUB-WATERSHED
FIGURE 4.2-3
CASINO MINING CORPORATION
CASINO COPPER-GOLD PROJECT
REV0
P/A NO. VA101-325/14
REF. NO.5
Un
it R
un
off
(L/s
/km
2)

M:\1\01\00325\14\A\Data\Task 310 - Hydrology\Baseline Report\2012 Baseline Report\[Long-Term Mean Monthly Comparison 20130510.xls]Dip Fig4.2-4 Print 10/07/2013 2:05 PM
0
2
4
6
8
10
12
14
16
18
Jan Feb Mar Apr May Jun Jul Aug Sep Oct Nov Dec Annual
R2
W9
W16
0 05MAY'13 ISSUED WITH REPORT VA101-325/14 ICC KT KJB
DATE DESCRIPTION PREP'D CHK'D APP'DREV
LONG-TERM UNIT RUNOFF COMPARISONDIP CREEK SUB-WATERSHED
FIGURE 4.2-4
CASINO MINING CORPORATION
CASINO COPPER-GOLD PROJECT
REV0
P/A NO. VA101-325/14
REF. NO.5
Un
it R
un
off
(L/s
/km
2)

M:\1\01\00325\14\A\Data\Task 310 - Hydrology\Baseline Report\2012 Baseline Report\[Long-Term Mean Monthly Comparison 20130510.xls]Casino Fig4.2-5 Print 10/07/2013 2:06 PM
0
2
4
6
8
10
12
14
16
Jan Feb Mar Apr May Jun Jul Aug Sep Oct Nov Dec Annual
W11
W18
H18
W4
0 05MAY'13 ISSUED WITH REPORT VA101-325/14 ICC KT KJB
DATE DESCRIPTION PREP'D CHK'D APP'DREV
LONG-TERM UNIT RUNOFF COMPARISONCASINO CREEK SUB-WATERSHED
FIGURE 4.2-5
CASINO MINING CORPORATION
CASINO COPPER-GOLD PROJECT
REV0
P/A NO. VA101-325/14
REF. NO.5
Un
it R
un
off
(L/s
/km
2)

CASINO MINING CORPORATION
CASINO PROJECT
BASELINE HYDROLOGY REPORT 36 of 44 VA101-325/14-5 Rev 0 October 10, 2013
5 – STREAMFLOW STATISTICS
Peak and low flow statistics were estimated for the Project on the basis of the long-term synthetic flow series, and then were compared to regional information for validation. The variability of monthly flows was also quantified in the form of 10-year wet and dry monthly values.
5.1 PEAK FLOW ANALYSIS
5.1.1 Methodology
In the Yukon interior, peak instantaneous flows commonly occur during the spring freshet period on larger rivers. However, on smaller streams such as those in the Project area, peak instantaneous flows may occur either during the freshet or throughout the late summer and early autumn due to intense rain or rain-on-snow events. Return period peak flows were calculated using the 37-year synthetic flow series developed for each station. The annual maximum daily discharge values in the synthetic series were entered into Environment Canada’s CFA flood frequency software, which employs a Generalized Extreme Value distribution to fit the data, returning peak daily discharge estimates for the range of return periods. Peak daily values were then adjusted to peak instantaneous flows by applying an estimated ratio of instantaneous-to-daily peak discharge. The Project wide instantaneous-to-daily peak discharge ratio was determined by identifying several major flow events throughout the measured record for each site, dividing the flow corresponding to the highest stage measurement recorded on those days by the average flow of the same day, and then averaging the results from all stations. The resultant average instantaneous-to-daily peak discharge ratio is 1.6 for the Project area.
In order to support the results of the statistical peak flow analysis using a regional perspective, the methodology presented below provides a means of estimating return-period peak flows for rivers and streams in the Yukon (Janowicz, 1989). This methodology allows for peak flows to be estimated for any known drainage area, based on the following equation:
Q = a (A) b (1)
Where, Q = discharge in m3/s
A = drainage area in km2
a, b = empirical parameters
The empirical parameters “a” and “b” are specified for mean annual, 5-year, 10-year, 20-year, 50-year, and 100-year return periods, and are presented in Table 5.1-1. In addition to calculating flood values using the Janowicz approach, the peak flows recorded at regional WSC stations were reviewed as a final check against the peak flow values derived using the statistical analysis.
5.1.2 Results
The peak flows generated by the two methods described above were fairly similar, although the statistical analysis of the Project station flow series tended to result in larger, and therefore more conservative, peak flow values than the regional method. The results were quite variable between the Project stations, likely owing to the considerable uncertainty in deriving flows of this magnitude from the on-site records, which did not incorporate long return period floods into their development.

CASINO MINING CORPORATION
CASINO PROJECT
BASELINE HYDROLOGY REPORT 37 of 44 VA101-325/14-5 Rev 0 October 10, 2013
It is also understood that the goal of this exercise is to develop return period flood estimates for the overall Project area, and not necessarily for each individual hydrometric monitoring station. Therefore, in order to achieve this goal and to address the uncertainty and variability in the statistical results, a single set of return period flood values, or Project values, was derived for the Project area by selecting the largest discharge per unit area value from all of the monitoring stations, for each return period. The peak flows generated by statistical analysis of the synthetic series, and combined into a single set of peak flow values for the Project area are recommended for Project design. The peak flow values are presented in terms of unit-area discharge in Table 5.1-2. All values have been adjusted to include a 15% safety factor to account for potentially greater weather extremes and permafrost melt due to climate change.
These peak flow values contain considerable uncertainty due to the extent of rating curve extrapolation required to estimate high flows at the Project monitoring stations. Such uncertainty should be considered during project design.
Table 5.1-1 Regional Peak Flow Return Period Coefficients

Mean Annual 2 Year 5 Year 10 Year 20 Year 50 Year 100 Year 200 Year
Britannia Creek (W14) 45 167 162 238 283 322 368 399 425
Canadian Creek (W3) 64 159 141 225 284 345 428 495 564
Lower Dip Creek (W16) 384 183 173 272 331 383 443 484 522
Upper Dip Creek (W9) 194 183 167 264 326 386 461 516 572
Victor Creek (R2) 84.5 199 194 268 314 353 398 431 459
Lower Casino Creek (W4) 82 140 130 201 245 285 334 370 406
Middle Casino Creek (H18) 67 129 124 184 219 250 286 310 332
Upper Casino Creek (W11) 39 144 138 205 243 276 314 339 362
Brynelsen Creek (W18) 25 143 135 199 239 275 318 348 376
Maximum Return Period UR (Recommended) - 199 194 272 331 386 461 516 572
M:\1\01\00325\14\A\Data\Task 310 - Hydrology\Baseline Report\2012 Baseline Report\[PeakFlow_20130521.xlsx]ALL Table 5.2 UR
NOTES:1. THE MAXIMUM RETURN PERIOD VALUES ARE RECOMMENDED FOR APPLICATION WITHIN THE CASINO CREEK, DIP CREEK AND BRITANNIA CREEK WATERSHEDS.
2. RECOMMENDED PEAKFLOW VALUES INCLUDE A 15% SAFETY FACTOR TO ACCOUNT FOR POSSIBLE FLOW CHANGES DUE TO CLIMATE CHANGE.
StationReturn Period Peak Instantaneous Discharge (l/s/km2)Drainage
Area (km2)
TABLE 5.1-2
CASINO MINING CORPORATIONCASINO COPPER-GOLD PROJECT
RECOMMENDED PEAK FLOW VALUES FOR PROJECT STREAMFLOW STATIONS
Print Jul/11/13 9:26:14
0 07MAY'13 ICC KTISSUED WITH REPORT VA101-325/14 KJBDATE DESCRIPTION PREP'D CHK'D APP'DREV

CASINO MINING CORPORATION
CASINO PROJECT
BASELINE HYDROLOGY REPORT 39 of 44 VA101-325/14-5 Rev 0 October 10, 2013
5.2 10-YEAR, 7-DAY LOW FLOWS
Annual low flows in the Yukon Territory typically occur in February, March or April, as groundwater inflows to the creeks diminish through the winter. Watershed area, the extent and thickness of permafrost within the watershed, storage (aquifers, lakes, and wetlands), and channel slope are all factors that influence low flows (Janowicz, 1990). Low flow return period statistics were developed for each Project monitoring station using Environment Canada’s LFA low-flow statistical software package. The results of this analysis are presented in Table 5.2-1. The results exhibit a high degree of consistency between mean annual low flows at stations within the each watershed, with the Casino Creek stations all exhibiting the highest average low flows, the stations in Dip Creek and Britannia Creek exhibiting the lowest average low flows, and station W9 on Dip Creek immediately upstream of Casino Creek exhibiting intermediate low flows. However, the analysis concludes that 7-day low flows are essentially zero at all stations for a 10-year return period. The results are generally consistent with flow observations made on site, and therefore the average Project 7-day low flow values are the watershed averaged (Casino, Dip/Britannia, W9) values presented in Table 5.2-1, and the 10-year return period low flow values are assumed to be zero at all sites.
Table 5.2-1 Low Flow Statistics, 10-year return Period 7-Day Low Flows
5.3 WET AND DRY MONTHLY FLOWS
For each Project station, the variability of monthly average flows was estimated by calculating monthly average flows for a 10-year wet and 10-year dry return period. These monthly average

CASINO MINING CORPORATION
CASINO PROJECT
BASELINE HYDROLOGY REPORT 40 of 44 VA101-325/14-5 Rev 0 October 10, 2013
flows were calculated based on the long-term synthetic flow series for each station using the Palisade Decision Tools @RISK statistical software. For each month, a statistical distribution was fit to the monthly flow values in the synthetic flow series, with the 10th and 90th percentile values of the distribution representing the 10-year dry and 10-year wet monthly flows, respectively. A relatively high degree of consistency in the resultant runoff values was observed within each watershed. Watershed averaged values were developed, and are presented in Table 5.3-1 and on Figure 5.3-1 for each month and return period. It is believed that the development of watershed average values will simplify the application of these results to various Project locations should it be required.

10‐Year Dry Average 10‐Year Wet 10‐Year Dry Average 10‐Year Wet 10‐Year Dry Average 10‐Year WetJan 0.10 0.60 1.3 0.05 0.31 0.69 0.04 0.21 0.47Feb 0.07 0.40 0.86 0.04 0.21 0.44 0.02 0.14 0.30Mar 0.06 0.35 0.76 0.03 0.18 0.39 0.02 0.12 0.27Apr 0.11 2.0 5.4 0.05 1.9 4.2 0.02 0.99 2.2May 3.0 13 31 2.4 12 31 3.2 15 33Jun 3.6 11 19 4.3 14 28 3.8 11 20Jul 4.7 13 23 3.3 16 30 1.8 10 21
Aug 4.2 9.8 17 2.7 11 22 1.3 6.3 14Sep 5.5 9.6 15 3.0 8.1 15 2.4 6.5 12Oct 3.6 5.4 7.2 1.7 3.2 4.7 1.3 2.5 3.6Nov 0.91 2.5 4.5 0.42 1.2 2.2 0.32 0.94 1.7Dec 0.22 1.2 2.6 0.10 0.55 1.2 0.08 0.43 0.92
NOTES:
TABLE 5.3-1
M:\1\01\00325\14\A\Data\Task 310 - Hydrology\Baseline Report\2012 Baseline Report\[Wet&DryMonthlyFlow_20130520.xlsx]average ratio Tab5.3-1
Casino Creek Watershed Dip Creek Watershed Britannia Creek WatershedPrint Oct/10/13 14:10:13
CASINO MINING CORPORATION
CASINO PROJECT
WET AND DRY RUNOFF
10-YEAR WET AND DRY MONTHLY UNIT RUNOFF (l/s/km2)
Month
3. THE DIP CREEK WATERSHED VALUES WERE DERIVED BY AVERAGING THE VALUES CALCULATED FOR STATIONS R2, W9 AND W16.
4. THE BRITANNIA CREEK WATERSHED VALUES WERE DERIVED BY AVERAGING THE VALUES CALCULATED FOR STATIONS W3 AND W14.
1. RETURN PERIOD VALUES WERE GENERATED USING PALISADE DECISION TOOLS @RISK DISTRIBUTION FITTING SOFTWARE AND THE LONG-TERM SYNTHETIC FLOW SERIES
DEVELOPED FOR EACH OF THE CASINO HYDROLOGY STATIONS.
2. THE CASINO CREEK WATERSHED VALUES WERE DERIVED BY AVERAGING THE VALUES CALCULATED FOR STATIONS W4, H18, W18 AND W11.
0 27MAR'13 MH KTISSUED WITH REPORT VA101-325/14 KJBDATE DESCRIPTION PREP'D CHK'D APP'DREV

CASINO MINING CORPORATION
CASINO PROJECT
BASELINE HYDROLOGY REPORT 43 of 44 VA101-325/14-5 Rev 0 October 10, 2013
6 – REFERENCES British Columbia Ministry of Environment (BC MoE) – Science and Information Branch, 2009.
Manual of British Columbia Hydrometric Standards. Resources Information Standards Committee, March 12, 2009.
Hallam Knight Piésold Ltd., 1993. Casino Project, Environmental Monitoring Program, Baseline
Environmental and Socioeconomic Studies. Pacific Sentinel Gold Corporation, November 18, 1993.
Hallam Knight Piésold Ltd., 1997. Casino Project, Data Report 1993-1995. Pacific Sentinel Gold Corporation, March 1997.
Janowicz J.R., 1989. Design Flood Estimating Guidelines for the Yukon Territory. Department of Northern and Indian Affairs Canada, Whitehorse, Yukon.
Janowicz J.R., 1990. Regionalization of Low Flows in Yukon Territory. Northern Hydrology: selected Perspectives. Proceedings of the Northern Hydrology Symposium, July 1990.
Knight Piésold Ltd., 2010. Hydrometric Data Collection Summary Report (ref. no. VA101-325/3-7), issued March 3, 2010.
Knight Piésold Ltd., 2010. Hydrometeorology Report (ref: VA101-325/3-1), issued on June 15, 2010.
Knight Piésold Ltd., 2012. Baseline Hydrology Report (ref. no. VA101-325/12-2), issued on July 17, 2012.
Natural Resources Canada, 1993. Canada Terrestrial Ecoregions. http://atlas.nrcan.gc.ca/site/english/maps/archives/5thedition/environment/ecology/mcr4164, downloaded January 2010.
Smith, C.A.S., Meikle, J.C. and Roots,C.F. (editors), 2004. Ecoregions of the Yukon Territory - Biophysical Properties of Yukon Landscapes. Agriculture and Agri-Food Canada, PARC Technical Bulletin 04-01, Summerland, British Columbia, pages 61 to 148.


CASINO MINING CORPORATION
CASINO PROJECT
BASELINE HYDROLOGY REPORT VA101-325/14-5 Rev 0 October 10, 2013
APPENDIX A
STAGE-DISCHARGE TABLES, RATING CURVES, AND MEASURED HYDROGRAPHS
(Pages A-1 to A-27)

23 May 2008 1 Current Meter - 0.86 - -8 Jul 2008 1 Current Meter - 0.29 - -
10 Sep 2008 1 Current Meter - 0.40 - -10 Oct 2008 1 Current Meter - 0.15 - -19 May 2009 1 Current Meter 3.960 0.47 10% -30 Jun 2009 1 Current Meter 4.037 1.10 10% -8 Aug 2009 1 Current Meter 3.887 0.16 10% -6 Oct 2009 1 Current Meter 3.867 0.12 10% -
21 Apr 2010 1 Current Meter - 0.16 - -8 May 2010 2 Current Meter - 0.53 - -16 Jun 2010 1 Current Meter 3.842 0.07 15% -29 Jul 2010 1 Current Meter 3.952 0.45 15% -8 Aug 2010 1 Current Meter 3.922 0.34 15% -14 Sep 2010 1 Current Meter 3.947 0.50 15% -31 Mar 2011 2 Rhodamine - 0.00 15% -28 Apr 2011 2 Rhodamine - 0.13 15% -19 May 2011 2 Current Meter 4.213 2.77 15% 0.512 Jun 2011 2 Current Meter 3.962 0.57 15% 0.216 Aug 2011 2 Current Meter 4.017 1.28 15% 0.26 Oct 2011 1 Current Meter 3.856 0.07 15% 0.2
27 Mar 2012 2 Rhodamine - 0.10 15% -23 May 2012 1 Current Meter 4.083 2.01 20% -12 Sep 2012 1 Current Meter 3.928 0.30 5% -
M:\1\01\00325\14\A\Data\Task 310 - Hydrology\Baseline Report\2012 Baseline Report\W14\[W14 Rating Curve.xlsx]Table 1
NOTES:
1. NUMBER OF MEASUREMENTS REFERS TO THE NUMBER OF DISCRETE DISCHARGE MEASUREMENTS COLLECTED DURING EACH SITE VISIT.
MULTIPLE MEASUREMENTS WERE AVERAGED TO PRODUCE ONE RATING POINT.
2. DISCHARGE UNCERTAINTY REFERS TO THE IN SITU MEASUREMENT UNCERTAINTY ESTIMATED BY THE FIELD ENGINEER.
3. STAGE UNCERTAINTY IS BASED ON A VISUAL ASSESSMENT OF THE WAVE AMPLITUDE IN THE GAUGE POOL.
Stage Uncertainty
[cm]Date
Number of Measurements
MethodGauge Height
[m]
Discharge
[m3/s]Discharge
Uncertainty
Print Jul/10/13 14:33:39
TABLE 1
CASINO MINING CORPORATIONCASINO COPPER-GOLD PROJECT
BRITANNIA CREEK STATION (W14)SUMMARY OF DISCHARGE MEASUREMENTS
0 21MAR'13 DS KTISSUED WITH REPORT VA101-325/14 KJBDATE DESCRIPTION PREP'D CHK'D APP'DREV
A-1 of 27

23 May 2008 1 Current Meter - 1.60 -8 Jul 2008 1 Current Meter - 0.33 -
10 Sep 2008 1 Current Meter - 1.57 -11 Oct 2008 1 Current Meter - 0.38 -19 May 2009 1 Current Meter - 0.67 -30 Jun 2009 1 Current Meter - 1.54 -8 Aug 2009 1 Current Meter - 1.07 -6 Oct 2009 1 Current Meter - 0.25 -
25 Mar 2010 1 Salt Dilution - 0.02 25%21 Apr 2010 1 Current Meter 3.302 0.19 10% 5.08 May 2010 2 Current Meter 3.327 0.33 10% 1.010 May 2010 1 Current Meter 3.329 0.35 10% 0.516 Jun 2010 1 Current Meter 3.310 0.21 10%29 Jul 2010 1 Current Meter 3.420 0.91 10%9 Aug 2010 1 Current Meter 3.360 0.53 10%14 Sep 2010 1 Current Meter 3.435 1.10 10%31 Mar 2011 2 Rhodamine - 0.04 15%28 Apr 2011 2 Rhodamine - 0.17 10%19 May 2011 2 Current Meter 3.679 4.01 5% 0.512 Jun 2011 2 Current Meter 3.431 0.83 5% 0.216 Aug 2011 2 Current Meter 3.463 1.16 10% 1.06 Oct 2011 1 Current Meter 3.249 0.15 15% 0.5
29 Mar 2012 2 Rhodamine - 0.05 15%23 May 2012 1 Current Meter 3.520 1.75 5% 0.512 Sep 2012 1 Current Meter 3.344 0.44 5% 0.5
M:\1\01\00325\14\A\Data\Task 310 - Hydrology\Baseline Report\2012 Baseline Report\W3\[W3 Rating Curve 20130305.xlsx]Table 1
NOTES:
1. NUMBER OF MEASUREMENTS REFERS TO THE NUMBER OF DISCRETE DISCHARGE MEASUREMENTS COLLECTED DURING EACH SITE VISIT.
MULTIPLE MEASUREMENTS WERE AVERAGED TO PRODUCE ONE RATING POINT.
2. DISCHARGE UNCERTAINTY REFERS TO THE IN SITU MEASUREMENT UNCERTAINTY ESTIMATED BY THE FIELD ENGINEER.
3. STAGE UNCERTAINTY IS BASED ON A VISUAL ASSESSMENT OF THE WAVE AMPLITUDE IN THE GAUGE POOL.
Print Jul/10/13 14:44:14
TABLE 2
CASINO MINING CORPORATIONCASINO COPPER-GOLD PROJECT
CANADIAN CREEK STATION (W3)SUMMARY OF DISCHARGE MEASUREMENTS
Stage Uncertainty
[cm]Date
Number of Measurements
MethodGauge Height
[m]
Discharge
[m3/s]Discharge
Uncertainty
0 21MAR'13 DS KTISSUED WITH REPORT VA101-325 KJBDATE DESCRIPTION PREP'D CHK'D APP'DREV
A-2 of 27

9 May 2010 2 Current Meter - 2.14 - -15 Jun 2010 1 Current Meter 3.869 2.16 15% -28 Jul 2010 1 Current Meter 3.945 3.27 15% -9 Aug 2010 1 Current Meter 4.000 4.80 15% -15 Sep 2010 1 Current Meter 4.025 5.65 15%29 Apr 2011 1 Current Meter - 0.63 15% -18 Aug 2011 4 ADCP 4.147 8.94 15% 0.24 Oct 2011 1 Current Meter 3.845 1.75 15% 0.2
29 Mar 2012 1 Estimation - 0.00 - -25 May 2012 1 Current Meter 4.187 9.25 15% 0.213 Sep 2012 1 Current Meter 3.901 3.08 15% 0.2
M:\1\01\00325\14\A\Data\Task 310 - Hydrology\Baseline Report\2012 Baseline Report\W16\[W16 Rating Curve 20130305.xlsx]Table 1
NOTES:
1. NUMBER OF MEASUREMENTS REFERS TO THE NUMBER OF DISCRETE DISCHARGE MEASUREMENTS COLLECTED DURING EACH
SITE VISIT. MULTIPLE MEASUREMENTS WERE AVERAGED TO PRODUCE ONE RATING POINT.
2. DISCHARGE UNCERTAINTY REFERS TO THE IN SITU MEASUREMENT UNCERTAINTY ESTIMATED BY THE FIELD ENGINEER.
3. STAGE UNCERTAINTY IS BASED ON A VISUAL ASSESSMENT OF THE WAVE AMPLITUDE IN THE GAUGE POOL.
Print Jul/10/13 14:36:26
TABLE 3
CASINO MINING CORPORATIONCASINO COPPER-GOLD PROJECT
LOWER DIP CREEK STATION (W16)SUMMARY OF DISCHARGE MEASUREMENTS
Stage Uncertainty
[cm]Date
Number of Measurements
MethodGauge Height
[m]
Discharge
[m3/s]Discharge
Uncertainty
0 21MAR'13 DS KTISSUED WITH REPORT VA101-325/14 KJBDATE DESCRIPTION PREP'D CHK'D APP'DREV
A-3 of 27

22 May 2008 1 Current Meter 3.539 4.71 20%9 Jul 2008 1 Current Meter 3.514 3.63 20%9 Sep 2008 1 Current Meter 3.520 3.27 20%10 Oct 2008 1 Current Meter 3.359 1.11 20%19 May 2009 1 Current Meter 3.279 0.56 DISCARD5 Aug 2009 1 Current Meter 3.248 0.43 20%5 Oct 2009 1 Current Meter 3.313 0.84 20%
24 Mar 2010 1 Current Meter - 0.04 -22 Apr 2010 1 Current Meter - 0.77 -9 May 2010 2 Current Meter 3.361 1.25 5%10 May 2010 2 Current Meter 3.355 1.21 5%15 Jun 2010 1 Current Meter 3.353 1.21 5%29 Jul 2010 1 Current Meter 3.443 2.00 5%9 Aug 2010 1 Current Meter 3.438 2.14 5%15 Sep 2010 1 Current Meter 3.464 2.62 5%30 Mar 2011 2 Rhodamine - 0.23 15%29 Apr 2011 2 Rhodamine - 0.41 15% -18 Aug 2011 1 ADCP 3.603 4.55 15% -4 Oct 2011 1 Current Meter 3.336 1.08 15% 0.2
28 Mar 2012 2 Rhodamine - 0.26 15% -24 May 2012 2 Current Meter 3.546 5.51 5% -14 Sep 2012 1 Current Meter 3.423 1.68 10% 0.2
M:\1\01\00325\14\A\Data\Task 310 - Hydrology\Baseline Report\2012 Baseline Report\W9\[W9 Rating Curve 20130305.xlsx]Table 1
NOTES:
1. NUMBER OF MEASUREMENTS REFERS TO THE NUMBER OF DISCRETE DISCHARGE MEASUREMENTS COLLECTED DURING EACH SITE VISIT.
MULTIPLE MEASUREMENTS WERE AVERAGED TO PRODUCE ONE RATING POINT.
2. DISCHARGE UNCERTAINTY REFERS TO THE IN SITU MEASUREMENT UNCERTAINTY ESTIMATED BY THE FIELD ENGINEER.
3. STAGE UNCERTAINTY IS BASED ON A VISUAL ASSESSMENT OF THE WAVE AMPLITUDE IN THE GAUGE POOL.
Print Jul/10/13 14:43:28
TABLE 4
CASINO MINING CORPORATIONCASINO COPPER-GOLD PROJECT
UPPER DIP CREEK STATION (W9)SUMMARY OF DISCHARGE MEASUREMENTS
Stage Uncertainty
[cm]Date
Number of Measurements
MethodGauge Height
[m]
Discharge
[m3/s]
Discharge Uncertainty
0 21MAR'13 DS KTISSUED WITH REPORT VA101-325/14 KJBDATE DESCRIPTION PREP'D CHK'D APP'DREV
A-4 of 27

22 Apr 2010 1 Current Meter - 0.30 - -10 May 2010 2 Current Meter - 0.29 - -15 Jun 2010 1 Current Meter 3.190 0.68 10% -28 Jul 2010 1 Current Meter 3.240 0.94 10% -9 Aug 2010 1 Current Meter 3.275 1.23 10% -15 Sep 2010 1 Current Meter 3.275 1.35 10% -30 Mar 2011 2 Rhodamine - 0.09 15% -29 Apr 2011 2 Rhodamine - 0.15 10% -12 Jun 2011 2 Current Meter 3.467 3.57 5% 0.216 Aug 2011 2 Current Meter 3.359 1.91 10% 0.54 Oct 2011 1 Current Meter 3.134 0.32 15% 0.5
28 Mar 2012 Rhodamine - 0.10 15% -24 May 2012 2 Current Meter 3.419 2.88 5% -13 Sep 2012 1 Current Meter 3.198 0.74 5% 0.2
M:\1\01\00325\14\A\Data\Task 310 - Hydrology\Baseline Report\2012 Baseline Report\R2\[R2 Rating Curve 20130307.xlsx]Table 1
NOTES:
1. NUMBER OF MEASUREMENTS REFERS TO THE NUMBER OF DISCRETE DISCHARGE MEASUREMENTS COLLECTED DURING EACH SITE VISIT.
MULTIPLE MEASUREMENTS WERE AVERAGED TO PRODUCE ONE RATING POINT.
2. DISCHARGE UNCERTAINTY REFERS TO THE IN SITU MEASUREMENT UNCERTAINTY ESTIMATED BY THE FIELD ENGINEER.
3. STAGE UNCERTAINTY IS BASED ON A VISUAL ASSESSMENT OF THE WAVE AMPLITUDE IN THE GAUGE POOL.
Stage Uncertainty
[cm]Date
Number of Measurements
MethodGauge Height
[m]
Discharge
[m3/s]Discharge
Uncertainty
Print Jul/10/13 14:44:57
TABLE 5
CASINO MINING CORPORATIONCASINO COPPER-GOLD PROJECT
VICTOR CREEK STATION (R2)SUMMARY OF DISCHARGE MEASUREMENTS
0 21MAR'13 DS KTISSUED WITH REPORT VA101-325 KJBDATE DESCRIPTION PREP'D CHK'D APP'DREV
A-5 of 27

22 May 2008 1 Current Meter - 1.50 - -9 Jul 2008 1 Current Meter 2.521 0.52 20%9 Sep 2008 1 Current Meter 2.777 2.10 20%10 Oct 2008 1 Current Meter 2.614 0.81 20%19 May 2009 1 Current Meter 2.569 0.62 20%5 Aug 2009 1 Current Meter 2.413 0.22 20%5 Oct 2009 1 Current Meter 2.520 0.44 20%
22 Apr 2010 1 Current Meter - 0.29 -9 May 2010 2 Current Meter 2.541 0.53 10%
10 May 2010 2 Current Meter 2.547 0.55 10%15 Jun 2010 1 Current Meter 2.532 0.44 10%29 Jul 2010 1 Current Meter 2.619 0.86 10%9 Aug 2010 1 Current Meter 2.659 1.04 10%15 Sep 2010 1 Current Meter 2.659 1.16 10%30 Mar 2011 2 Rhodamine - 0.12 15%29 Apr 2011 2 Current Meter - 0.39 10% -12 Jun 2011 2 Current Meter 2.765 1.91 10% 0.516 Aug 2011 2 Current Meter 2.792 1.94 10% 0.54 Oct 2011 1 Current Meter 2.460 0.29 10% 0.2
28 Mar 2012 1 Rhodamine - 0.14 15% -23 May 2012 2 Current Meter 2.748 1.79 10% 0.514 Sep 2012 1 Current Meter 2.568 0.63 10% 0.2
M:\1\01\00325\14\A\Data\Task 310 - Hydrology\Baseline Report\2012 Baseline Report\W4\[W4 Rating Curve 20130219.xlsx]Table 1
NOTES:
1. NUMBER OF MEASUREMENTS REFERS TO THE NUMBER OF DISCRETE DISCHARGE MEASUREMENTS COLLECTED DURING EACH SITE VISIT.
MULTIPLE MEASUREMENTS WERE AVERAGED TO PRODUCE ONE RATING POINT.
2. DISCHARGE UNCERTAINTY REFERS TO THE IN SITU MEASUREMENT UNCERTAINTY ESTIMATED BY THE FIELD ENGINEER.
3. STAGE UNCERTAINTY IS BASED ON A VISUAL ASSESSMENT OF THE WAVE AMPLITUDE IN THE GAUGE POOL.
Print Jul/10/13 14:22:40
TABLE 6
CASINO MINING CORPORATIONCASINO COPPER-GOLD PROJECT
LOWER CASINO CREEK STATION (W4)SUMMARY OF DISCHARGE MEASUREMENTS
Stage Uncertainty
[cm]Date
Number of Measurements
MethodGauge Height
[m]
Discharge
[m3/s]Discharge
Uncertainty
0 21MAR'13 DS KTISSUED WITH REPORT VA101-325/14 KJBDATE DESCRIPTION PREP'D CHK'D APP'DREV
A-6 of 27

9 Oct 2008 2 Current Meter 2.990 0.64 20% -19 May 2009 2 Current Meter 3.010 0.70 20% -6 Aug 2009 2 Current Meter 2.900 0.17 20% -5 Oct 2009 2 Current Meter 2.950 0.40 20% -9 May 2010 2 Current Meter - 0.45 - -14 Jun 2010 2 Current Meter 2.970 0.49 10% -28 Jul 2010 2 Current Meter 3.018 0.80 10% -8 Aug 2010 2 Current Meter 3.027 0.91 10% -15 Sep 2010 2 Current Meter 3.040 0.97 10% -18 May 2011 2 Current Meter 3.204 4.01 10% -12 Jun 2011 2 Current Meter 3.065 1.34 15% 0.216 Aug 2011 2 Current Meter 3.099 1.48 15% 0.23 Oct 2011 2 Current Meter 2.975 0.53 15% -
28 Mar 2012 2 Rhodamine - 0.13 15% -23 May 2012 1 Current Meter 3.099 1.63 10% 0.513 Sep 2012 1 Current Meter 2.972 0.53 5% 0.2
M:\1\01\00325\14\A\Data\Task 310 - Hydrology\Baseline Report\2012 Baseline Report\H18\[H18 Rating Curve 20130304.xlsx]Table 1
NOTES:
1. NUMBER OF MEASUREMENTS REFERS TO THE NUMBER OF DISCRETE DISCHARGE MEASUREMENTS COLLECTED DURING EACH SITE VISIT.
MULTIPLE MEASUREMENTS WERE AVERAGED TO PRODUCE ONE RATING POINT.
2. DISCHARGE UNCERTAINTY REFERS TO THE IN SITU MEASUREMENT UNCERTAINTY ESTIMATED BY THE FIELD ENGINEER.
3. STAGE UNCERTAINTY IS BASED ON A VISUAL ASSESSMENT OF THE WAVE AMPLITUDE IN THE GAUGE POOL.
Stage Uncertainty
[cm]Date
Number of Measurements
MethodGauge Height
[m]
Discharge
[m3/s]
Discharge Uncertainty
Print Jul/10/13 14:45:23
TABLE 7
CASINO MINING CORPORATIONCASINO COPPER-GOLD PROJECT
MIDDLE CASINO CREEK STATION (H18)SUMMARY OF DISCHARGE MEASUREMENTS
0 21MAR'13 DS KTISSUED WITH REPORT VA101-325/14 KJBDATE DESCRIPTION PREP'D CHK'D APP'DREV
A-7 of 27

22 May 2008 1 Current Meter - 0.87 - -9 Jul 2008 1 Current Meter - 0.15 - -9 Sep 2008 1 Current Meter - 0.69 - -10 Oct 2008 1 Current Meter - 0.41 - -19 May 2009 1 Current Meter 4.057 0.36 20% -6 Aug 2009 1 Current Meter 3.965 0.12 20% -5 Oct 2009 1 Current Meter 4.021 0.23 20% -9 May 2010 2 Current Meter - 0.18 - -15 Jun 2010 1 Current Meter 3.976 0.14 10% -28 Jul 2010 1 Current Meter 4.085 0.46 10% -9 Aug 2010 1 Current Meter 4.080 0.44 10% -15 Sep 2010 1 Current Meter 4.090 0.53 10% -29 Mar 2011 2 Rhodamine - 0.08 - -30 Apr 2011 2 Rhodamine - 0.11 - -18 May 2011 2 Current Meter 4.198 2.40 15% 0.512 Jun 2011 2 Current Meter 4.105 0.60 15% 0.216 Aug 2011 2 Current Meter 4.163 0.84 15% 0.54 Oct 2011 2 Current Meter - 0.21 - -
28 Mar 2012 3 Rhodamine - 0.08 - -23 May 2012 2 Current Meter 4.122 0.78 15% -13 Sep 2012 1 Current Meter 4.055 0.32 15% 0.2
M:\1\01\00325\14\A\Data\Task 310 - Hydrology\Baseline Report\2012 Baseline Report\W11\[W11 Rating Curve 20130326.xlsx]Table 1
NOTES:
1. NUMBER OF MEASUREMENTS REFERS TO THE NUMBER OF DISCRETE DISCHARGE MEASUREMENTS COLLECTED DURING EACH SITE VISIT.
MULTIPLE MEASUREMENTS WERE AVERAGED TO PRODUCE ONE RATING POINT.
2. DISCHARGE UNCERTAINTY REFERS TO THE IN SITU MEASUREMENT UNCERTAINTY ESTIMATED BY THE FIELD ENGINEER.
3. STAGE UNCERTAINTY IS BASED ON A VISUAL ASSESSMENT OF THE WAVE AMPLITUDE IN THE GAUGE POOL.
Print Jul/10/13 14:39:04
TABLE 8
CASINO MINING CORPORATIONCASINO COPPER-GOLD PROJECT
UPPER CASINO CREEK STATION (W11)SUMMARY OF DISCHARGE MEASUREMENTS
Stage Uncertainty
[cm]Date
Number of Measurements
MethodGauge Height
[m]
Discharge
[m3/s]Discharge
Uncertainty
0 21MAR'13 DS KTISSUED WITH REPORT VA101-325/14 KJBDATE DESCRIPTION PREP'D CHK'D APP'DREV
A-8 of 27

9 May 2010 2 Current Meter - 0.13 15% -14 Jun 2010 1 Current Meter 3.177 0.34 15% -28 Jul 2010 1 Current Meter 3.172 0.32 15% -9 Aug 2010 1 Current Meter 3.208 0.40 15% -15 Sep 2010 1 Current Meter 3.196 0.45 15% -31 Mar 2011 4 Rhodamine - 0.06 15% -30 Apr 2011 2 Rhodamine - 0.09 15% -18 May 2011 1 Current Meter 3.319 1.32 15% 0.212 Jun 2011 2 Current Meter 3.225 0.61 15% 0.216 Aug 2011 2 Current Meter 3.240 0.54 15% 0.53 Oct 2011 2 Current Meter 3.124 0.19 15% 0.2
28 Mar 2012 2 Rhodamine - 0.05 - -23 May 2012 2 Current Meter 3.262 0.77 15% -13 Sep 2012 1 Current Meter 3.131 0.20 15% 0.2
M:\1\01\00325\14\A\Data\Task 310 - Hydrology\Baseline Report\2012 Baseline Report\W18\[W18 Rating Curve 20130305.xlsx]Table 1
NOTES:
1. NUMBER OF MEASUREMENTS REFERS TO THE NUMBER OF DISCRETE DISCHARGE MEASUREMENTS COLLECTED DURING EACH SITE VISIT.
MULTIPLE MEASUREMENTS WERE AVERAGED TO PRODUCE ONE RATING POINT.
2. DISCHARGE UNCERTAINTY REFERS TO THE IN SITU MEASUREMENT UNCERTAINTY ESTIMATED BY THE FIELD ENGINEER.
3. STAGE UNCERTAINTY IS BASED ON A VISUAL ASSESSMENT OF THE WAVE AMPLITUDE IN THE GAUGE POOL.
Stage Uncertainty
[cm]Date
Number of Measurements
MethodGauge Height
[m]
Discharge
[m3/s]Discharge
Uncertainty
Print Jul/10/13 14:38:18
TABLE 9
CASINO MINING CORPORATIONCASINO COPPER-GOLD PROJECT
BRYNELSEN CREEK STATION (W18)SUMMARY OF DISCHARGE MEASUREMENTS
0 21MAR'13 DS KTISSUED WITH REPORT VA101-325/14 KJBDATE DESCRIPTION PREP'D CHK'D APP'DREV
A-9 of 27

M:\1\01\00325\14\A\Data\Task 310 - Hydrology\Baseline Report\2012 Baseline Report\W14\W14 Rating CurveRC Print 10/07/20133:03 PM
3.7
3.8
3.9
4
4.1
4.2
4.3
0.0 0.5 1.0 1.5 2.0 2.5 3.0 3.5 4.0
Sta
ge
(m)
Discharge (m3/s)
Rating Curve
2011-2012 Calibration Points
2011 Discarded Point
Pre-2011 Calibration Points
BRITANNIA CREEK STATION (W14)RATING CURVE
FIGURE 1a
CASINO MINING CORPORATION
CASINO COPPER-GOLD PROJECT
REV0
P/A NO. VA101-325/14
REF. NO.5Knight Piésold
C O N S U L T I N G
Error Bars
NOTES:1. MEASUREMENT ERROR DETERMINED FROM VISUAL ESTIMATION
OF MEASUREMENT QUALITY COMBINED WITH THE ERROR FROM INSTRUMENTATION.
2. THE MAXIMUM RECORDED STAGE CORRESPONDS TO AN EXTRAPOLATION 4.1 TIMES THE MAXIMUM MEASURED DISCHARGE.
Q = 25 (H - 3.75)2.5
0 21MAR'13 ISSUED WITH REPORT P/A NO. VA101-325/14 DS KT KJB
DATE DESCRIPTION PREP'D CHK'D APP'DREV
A-10 of 27

M:\1\01\00325\14\A\Data\Task 310 ‐ Hydrology\Baseline Report\2012 Baseline Report\W14\W14 Streamflow Record 20130306Measured Hydrograph Print 10/07/2013 1:38 PM
0
1
2
3
4
5
6
Jan 2010 Jun 2010 Dec 2010 Jun 2011 Dec 2011 Jun 2012 Dec 2012
Dai
ly D
isch
arg
e (m
3/s
)
Date
Daily Discharge Record
Measured Discharge
Winter Approximation Low Flow
0
DATE
21MAR'13
DESCRIPTION
ISSUED WITH REPORT VA101-325/14
PREP'D
DS
CHK'
KT
APP'
KJB
REV
BRITANNIA CREEK STATION (W14)MEASURED DISCHARGE HYDROGRAPH
FIGURE 1b
CASINO MINING CORPORATION
CASINO COPPER-GOLD PROJECT
REV0
P/A NO.VA101-325/14
REF. NO.5
NOTE:1. THE WINTER APPROXIMATION LOW FLOW DISCHARGE IS BASED ON A MEASUREMENT
WHERE POSSIBLE, OR BASED ON A COMBINATION OF CONCURRENT MEASUREMENTS AT ADJACENT STATIONS AND REGIONAL UNIT RUNOFF.
A-11 of 27

M:\1\01\00325\14\A\Data\Task 310 - Hydrology\Baseline Report\2012 Baseline Report\W3\W3 Rating Curve 20130305RC Print 10/07/20132:58 PM
3
3.1
3.2
3.3
3.4
3.5
3.6
3.7
3.8
0 1 2 3 4 5
Sta
ge
(m)
Discharge (m3/s)
Rating Curve
2011-2012 Calibration Points
Pre-2011 Calibration Points
CANADIAN CREEK STATION (W3)RATING CURVE
FIGURE 2a
CASINO MINING CORPORATION
CASINO COPPER-GOLD PROJECT
REV0
P/A NO. VA101-325/14
REF. NO.5Knight Piésold
C O N S U L T I N G0
DATE
21MAR'13
DESCRIPTION
DS
CHK'D
KT
APP'D
ISSUED WITH REPORT VA101-325
PREP'D
KJB
REV
Error Bars
NOTES:1. MEASUREMENT ERROR DETERMINED FROM VISUAL ESTIMATION
OF MEASUREMENT QUALITY COMBINED WITH THE ERROR FROM INSTRUMENTATION.
2. THE MAXIMUM RECORDED STAGE CORRESPONDS TO AN EXTRAPOLATION 1.4 TIMES THE MAXIMUM MEASURED DISCHARGE.
Q = 15.2 (H - 3.04)3
A-12 of 27

M:\1\01\00325\14\A\Data\Task 310 ‐ Hydrology\Baseline Report\2012 Baseline Report\W3\W3 Streamflow Record 20130305Measured Hydrograph Fig 3.4‐1 Print 10/07/2013 1:32 PM
0
1
2
3
4
5
6
7
8
9
10
11
Jan, 2010 Jun, 2010 Dec, 2010 Jun, 2011 Dec, 2011 Jun, 2012 Dec, 2012
Dai
ly D
isch
arg
e (m
3/s
)
Date
Daily Discharge Record
Measured Discharge
Winter Approximation Low Flow
0
DATE
21MAR'13
DESCRIPTION
ISSUED WITH REPORT VA101-325/14
PREP'D
DS
CHK'
KT
APP'
KJB
REV
CANADIAN CREEK STATION (W3)MEASURED DISCHARGE HYDROGRAPH
FIGURE 2b
CASINO MINING CORPORATION
CASINO COPPER-GOLD PROJECT
REV0
P/A NO.VA101-325/14
REF. NO.5
NOTE:1. THE WINTER APPROXIMATION LOW FLOW DISCHARGE IS BASED ON A MEASUREMENT
WHERE POSSIBLE, OR BASED ON A COMBINATION OF CONCURRENT MEASUREMENTS AT ADJACENT STATIONS AND REGIONAL UNIT RUNOFF.
A-13 of 27

M:\1\01\00325\14\A\Data\Task 310 - Hydrology\Baseline Report\2012 Baseline Report\W16\W16 Rating Curve 20130305RC Print 10/07/20133:04 PM
3.6
3.7
3.8
3.9
4
4.1
4.2
4.3
4.4
0 2 4 6 8 10 12
Sta
ge
(m)
Discharge (m3/s)
Rating Curve
2011-2012 Calibration Points
Pre-2011 Calibration Points
LOWER DIP CREEK STATION (W16)RATING CURVE
FIGURE 3a
CASINO MINING CORPORATION
CASINO COPPER-GOLD PROJECT
REV0
P/A NO. VA101-325/14
REF. NO.5Knight Piésold
C O N S U L T I N G0
DATE
21Mar'13
DESCRIPTION
ISSUED WITH REPORT VA101-325/14 DS
CHK'D
KT
APP'DPREP'D
KJB
REV
Error Bars
NOTES:1. MEASUREMENT ERROR DETERMINED FROM VISUAL ESTIMATION
OF MEASUREMENT QUALITY COMBINED WITH THE ERROR FROM INSTRUMENTATION.
2. THE MAXIMUM RECORDED STAGE CORRESPONDS TO AN EXTRAPOLATION 7.0 TIMES THE MAXIMUM MEASURED DISCHARGE.
Q = 29.5 (H - 3.62)1.9
A-14 of 27

M:\1\01\00325\14\A\Data\Task 310 ‐ Hydrology\Baseline Report\2012 Baseline Report\W16\W16 Streamflow Record 20130305Measured Hydrograph Print 10/07/2013 1:39 PM
0
5
10
15
20
25
30
35
40
45
50
55
Jan 2010 Jun 2010 Dec 2010 Jun 2011 Dec 2011 Jun 2012 Dec 2012
Dai
ly D
isch
arg
e (m
3/s
)
Date
Daily Discharge Record
Measured Discharge
Winter Approximation Low Flow
0
DATE
21MAR'13
DESCRIPTION
ISSUED WITH REPORT VA101-325/14
PREP'D
DS
CHK'
KT
APP'
KJB
REV
LOWER DIP CREEK STATION (W16)MEASURED DISCHARGE HYDROGRAPH
FIGURE 3b
CASINO MINING CORPORATION
CASINO COPPER-GOLD PROJECT
REV0
P/A NO.VA101-325/14
REF. NO.5
NOTE:1. THE WINTER APPROXIMATION LOW FLOW DISCHARGE IS BASED ON A MEASUREMENT
WHERE POSSIBLE, OR BASED ON A COMBINATION OF CONCURRENT MEASUREMENTS AT ADJACENT STATIONS AND REGIONAL UNIT RUNOFF.
A-15 of 27

M:\1\01\00325\14\A\Data\Task 310 - Hydrology\Baseline Report\2012 Baseline Report\W9\W9 Rating Curve 20130305RC Print 10/07/20132:52 PM
3
3.1
3.2
3.3
3.4
3.5
3.6
3.7
3.8
3.9
4
0 1 2 3 4 5 6 7 8
Sta
ge
(m)
Discharge (m3/s)
Rating Curve
2011-2012 Calibration Points
Pre-2011 Calibration Points
Break Point 1
Break Point 2
UPPER DIP CREEK STATION (W9)RATING CURVE
FIGURE 4a
CASINO MINING CORPORATION
CASINO COPPER-GOLD PROJECT
REV0
P/A NO. VA101-325/14
REF. NO.5Knight Piésold
C O N S U L T I N G
Error Bars
NOTES:1. MEASUREMENT ERROR DETERMINED FROM VISUAL ESTIMATION
OF MEASUREMENT QUALITY COMBINED WITH THE ERROR FROM INSTRUMENTATION.
2. THE MAXIMUM RECORDED STAGE CORRESPONDS TO AN EXTRAPOLATION 7.7 TIMES THE MAXIMUM MEASURED DISCHARGE.
Q = 40 (H - 3.17)2.3
Rating Curve Break Point 1 = 3.432 m
Q = 13.5 (H - 3.102)1.8
0 18MAR'13 ISSUED WITH REPORT P/A NO. VA101-325/14 PN KT KJB
DATE DESCRIPTION PREP'D CHK'D APP'DREV
Rating Curve Break Point 2 = 3.618m
Q = 15 (H - 3)1.8
A-16 of 27

M:\1\01\00325\14\A\Data\Task 310 ‐ Hydrology\Baseline Report\2012 Baseline Report\W9\W9 Streamflow Record 20130305Measured Hydrograph Print 10/07/2013 1:36 PM
0
2
4
6
8
10
12
14
16
18
20
22
24
26
28
30
Jan 2010 Jun 2010 Dec 2010 Jun 2011 Dec 2011 Jun 2012 Dec 2012
Dai
ly D
isch
arg
e (m
3/s
)
Date
Daily Discharge Record
Measured Discharge
Winter Approximation Low Flow
0
DATE
21MAR'13
DESCRIPTION
ISSUED WITH REPORT VA101-325/14
PREP'D
DS
CHK'
KT
APP'
KJB
REV
UPPER DIP CREEK STATION (W9)MEASURED DISCHARGE HYDROGRAPH
FIGURE 4b
CASINO MINING CORPORATION
CASINO COPPER-GOLD PROJECT
REV0
P/A NO.VA101-325/14
REF. NO.5
NOTE:1. THE WINTER APPROXIMATION LOW FLOW DISCHARGE IS BASED ON A MEASUREMENT
WHERE POSSIBLE, OR BASED ON A COMBINATION OF CONCURRENT MEASUREMENTS AT ADJACENT STATIONS AND REGIONAL UNIT RUNOFF.
A-17 of 27

M:\1\01\00325\14\A\Data\Task 310 - Hydrology\Baseline Report\2012 Baseline Report\R2\R2 Rating Curve 20130307RC Print 10/07/20132:57 PM
3
3.1
3.2
3.3
3.4
3.5
3.6
0 1 2 3 4 5
Sta
ge
(m)
Discharge (m3/s)
Rating Curve
2011-2012 Calibration Points
Pre-2011 Calibration Points
VICTOR CREEK STATION (R2)RATING CURVE
FIGURE 5a
CASINO MINING CORPORATION
CASINO COPPER-GOLD PROJECT
REV0
P/A NO. VA101-325/12
REF. NO.5Knight Piésold
C O N S U L T I N G0
DATE
21MAR'13
DESCRIPTION
DS
CHK'D
KT
APP'D
ISSUED WITH REPORT VA101-325
PREP'D
KJB
REV
Error Bars
NOTE:1. MEASUREMENT ERROR DETERMINED FROM VISUAL ESTIMATION
OF MEASUREMENT QUALITY COMBINED WITH THE ERROR FROM INSTRUMENTATION.
2. THE MAXIMUM RECORDED STAGE CORRESPONDS TO AN EXTRAPOLATION 6.5 TIMES THE MAXIMUM MEASURED DISCHARGE.
Q = 15 (H - 3)1.9
A-18 of 27

M:\1\01\00325\14\A\Data\Task 310 ‐ Hydrology\Baseline Report\2012 Baseline Report\R2\R2 Streamflow Record 20130307Measured Hydrograph Print 10/07/2013 1:31 PM
0
1
2
3
4
5
6
7
8
9
10
11
12
13
14
15
16
17
18
19
Jan 2010 Jun 2010 Dec 2010 Jun 2011 Dec 2011 Jun 2012 Dec 2012
Dai
ly D
isch
arg
e (m
3/s
)
Date
Daily Discharge Record
Measured Discharge
Winter Approximation Low Flow
0
DATE
21MAR'13
DESCRIPTION
ISSUED WITH REPORT VA101-325/14
PREP'D
DS
CHK'
KT
APP'
KJB
REV
VICTOR CREEK STATION (R2)MEASURED DISCHARGE HYDROGRAPH
FIGURE 5b
CASINO MINING CORPORATION
CASINO COPPER-GOLD PROJECT
REV0
P/A NO.VA101-325/14
REF. NO.5
NOTE:1. THE WINTER APPROXIMATION LOW FLOW DISCHARGE IS BASED ON A MEASUREMENT
WHERE POSSIBLE, OR BASED ON A COMBINATION OF CONCURRENT MEASUREMENTS AT ADJACENT STATIONS AND REGIONAL UNIT RUNOFF.
A-19 of 27

M:\1\01\00325\14\A\Data\Task 310 - Hydrology\Baseline Report\2012 Baseline Report\W4\W4 Rating Curve 20130219RC Print 10/07/201312:59 PM
2.2
2.3
2.4
2.5
2.6
2.7
2.8
2.9
0.0 0.5 1.0 1.5 2.0 2.5 3.0
Sta
ge
(m)
Discharge (m3/s)
Rating Curve
Pre-2011 Calibration Points
2011-2012 Calibration Points
LOWER CASINO CREEK STATION (W4)RATING CURVE
FIGURE 6a
CASINO MINING CORPORATION
CASINO COPPER-GOLD PROJECT
REV0
P/A NO. VA101-325/14
REF. NO.5Knight Piésold
C O N S U L T I N G0
DATE
21MAR'13
DESCRIPTION
DS
CHK'D
KT
APP'D
ISSUED WITH REPORT VA101-325/14
PREP'D
KJB
REV
NOTES:1. MEASUREMENT UNCERTAINTY (ERROR BARS) WAS DETERMINED FROM A VISUAL ESTIMATION OF MEASUREMENT QUALITY BY THE FIELD ENGINEER.2. THE MAXIMUM RECORDED STAGE CORRESPONDS TO AN EXTRAPOLATION 11.9 TIMES THE MAXIMUM MEASURED DISCHARGE.
Q = 6.9 (H - 2.145)2.80
Error Bars
A-20 of 27

M:\1\01\00325\14\A\Data\Task 310 ‐ Hydrology\Baseline Report\2012 Baseline Report\W4\W4 Streamflow Record 20130304Measured Hydrograph Print 10/07/2013 1:33 PM
0
1
2
3
4
5
6
7
8
9
10
11
12
13
14
15
16
17
18
Jan 2010 Jun 2010 Dec 2010 Jun 2011 Dec 2011 Jun 2012 Dec 2012
Dai
ly D
isch
arg
e (m
3/s
)
Date
Daily Discharge Record
Measured Discharge
Winter Approximation Low Flow
0
DATE
21MAR'13
DESCRIPTION
ISSUED WITH REPORT VA101-325/14
PREP'D
DS
CHK'
KT
APP'
KJB
REV
LOWER CASINO CREEK STATION (W4)MEASURED DISCHARGE HYDROGRAPH
FIGURE 6b
CASINO MINING CORPORATION
CASINO COPPER-GOLD PROJECT
REV0
P/A NO.VA101-325/14
REF. NO.5
NOTE:1. THE WINTER APPROXIMATION LOW FLOW DISCHARGE IS BASED ON A MEASUREMENT
WHERE POSSIBLE, OR BASED ON A COMBINATION OF CONCURRENT MEASUREMENTS AT ADJACENT STATIONS AND REGIONAL UNIT RUNOFF.
A-21 of 27

M:\1\01\00325\14\A\Data\Task 310 - Hydrology\Baseline Report\2012 Baseline Report\H18\H18 Rating Curve 20130304RC Print 10/07/20132:54 PM
2.80
2.85
2.90
2.95
3.00
3.05
3.10
3.15
3.20
3.25
3.30
0 1 2 3 4 5 6
Sta
ge
(m)
Discharge (m3/s)
Rating Curve
Break Point
Pre-2011 Calibration Points
2011-2012 Calibration Points
MIDDLE CASINO CREEK STATION (H18)RATING CURVE
FIGURE 7a
CASINO MINING CORPORATION
CASINO COPPER-GOLD PROJECT
REV0
P/A NO. VA101-325/14
REF. NO.5Knight Piésold
C O N S U L T I N G0
DATE
21MAR'13
DESCRIPTION
ISSUED WITH REPORT VA101-325/14 DS
CHK'D
KT
APP'DPREP'D
KJB
REV
Error Bars
NOTES:1. MEASUREMENT ERROR DETERMINED FROM VISUAL ESTIMATION
OF MEASUREMENT QUALITY COMBINED WITH THE ERROR FROM INSTRUMENTATION.
2. THE MAXIMUM RECORDED STAGE CORRESPONDS TO AN EXTRAPOLATION 2.5 TIMES THE MAXIMUM MEASURED DISCHARGE.
Q1 = 18.1 (H - 2.79)2.10
Q2 = 55 (H - 2.918)2.10
Rating Curve Break Point = 3.102 m
A-22 of 27

M:\1\01\00325\14\A\Data\Task 310 ‐ Hydrology\Baseline Report\2012 Baseline Report\H18\H18 Streamflow Record 20130304Measured Hydrograph Fig 3.4‐2 Print 10/07/2013 1:29 PM
0.0
1.0
2.0
3.0
4.0
5.0
6.0
7.0
8.0
9.0
Jan 2009 Jun 2009 Dec 2009 Jun 2010 Dec 2010 Jun 2011 Dec 2011 Jun 2012
Dai
ly D
isch
arg
e (m
3/s
)
Date
Daily Discharge Record
Measured Discharge
Winter Approximation Low Flow
0
DATE
21MAR'13
DESCRIPTION
ISSUED WITH REPORT VA101-325/14
PREP'D
DS
CHK'
KT
APP'
KJB
REV
MIDDLE CASINO CREEK STATION (H18)MEASURED DISCHARGE HYDROGRAPH
FIGURE 7b
CASINO MINING CORPORATION
CASINO COPPER-GOLD PROJECT
REV0
P/A NO.VA101-325/14
REF. NO.5
NOTE:1. THE WINTER APPROXIMATION LOW FLOW DISCHARGE IS BASED ON A MEASUREMENT
WHERE POSSIBLE, OR BASED ON A COMBINATION OF CONCURRENT MEASUREMENTS AT ADJACENT STATIONS AND REGIONAL UNIT RUNOFF.
A-23 of 27

M:\1\01\00325\14\A\Data\Task 310 - Hydrology\Baseline Report\2012 Baseline Report\W11\W11 Rating Curve 20130326RC Print 10/07/20133:02 PM
3.8
3.85
3.9
3.95
4
4.05
4.1
4.15
4.2
4.25
4.3
0.0 0.5 1.0 1.5 2.0 2.5 3.0
Sta
ge
(m)
Discharge (m3/s)
Rating Curve
2011-2012 Calibration Points
2010 Calibration Points
Break Point
UPPER CASINO CREEK STATION (W11)RATING CURVE
FIGURE 8a
CASINO MINING CORPORATION
CASINO COPPER-GOLD PROJECT
REV0
P/A NO. VA101-325/14
REF. NO.5Knight Piésold
C O N S U L T I N G0
DATE
21Mar'13
DESCRIPTION
ISSUED WITH REPORT VA101-325/14 DS
CHK'D
KT
APP'DPREP'D
KJB
REV
Error Bars
NOTES:1. MEASUREMENT ERROR DETERMINED FROM VISUAL ESTIMATION
OF MEASUREMENT QUALITY COMBINED WITH THE ERROR FROM INSTRUMENTATION.
2. THE MAXIMUM RECORDED STAGE CORRESPONDS TO AN EXTRAPOLATION 1.8 TIMES THE MAXIMUM MEASURED DISCHARGE.
Q2 = 33 (H - 3.955)2.1
Q1 = 6.7 (H - 3.82)2.1
Rating Curve Break Point: 4.074 m
A-24 of 27

M:\1\01\00325\14\A\Data\Task 310 ‐ Hydrology\Baseline Report\2012 Baseline Report\W11\W11 Streamflow Record 20130326Measured Hydrograph Print 10/07/2013 1:37 PM
0.0
0.5
1.0
1.5
2.0
2.5
3.0
3.5
Jan 2010 Jun 2010 Dec 2010 Jun 2011 Dec 2011 Jun 2012 Dec 2012
Dai
ly D
isch
arg
e (m
3/s
)
Date
Daily Discharge Record
Measured Discharge
Winter Approximation Low Flow
0
DATE
21MAR'13
DESCRIPTION
ISSUED WITH REPORT VA101-325/14
PREP'D
DS
CHK'
KT
APP'
KJB
REV
UPPER CASINO CREEK STATION (W11)MEASURED DISCHARGE HYDROGRAPH
FIGURE 8b
CASINO MINING CORPORATION
CASINO COPPER-GOLD PROJECT
REV0
P/A NO.VA101-325/14
REF. NO.5
NOTE:1. THE WINTER APPROXIMATION LOW FLOW DISCHARGE IS BASED ON A MEASUREMENT
WHERE POSSIBLE, OR BASED ON A COMBINATION OF CONCURRENT MEASUREMENTS AT ADJACENT STATIONS AND REGIONAL UNIT RUNOFF.
A-25 of 27

M:\1\01\00325\14\A\Data\Task 310 - Hydrology\Baseline Report\2012 Baseline Report\W18\W18 Rating Curve 20130305RC Print 10/07/20133:05 PM
3
3.05
3.1
3.15
3.2
3.25
3.3
3.35
3.4
0.0 0.5 1.0 1.5 2.0 2.5
Sta
ge
(m)
Discharge (m3/s)
Rating Curve
2011-2012 Calibration Points
Pre-2011 Calibration Points
2010 Discarded Point
BRYNELSEN CREEK STATION (W18)RATING CURVE
FIGURE 9a
CASINO MINING CORPORATION
CASINO COPPER-GOLD PROJECT
REV0
P/A NO. VA101-325/14
REF. NO.5Knight Piésold
C O N S U L T I N G0
DATE
21MAR'13
DESCRIPTION
ISSUED WITH REPORT VA101-325/14 DS
CHK'D
KT
APP'DPREP'D
KJB
REV
Error Bars
NOTES:1. MEASUREMENT ERROR DETERMINED FROM VISUAL ESTIMATION
OF MEASUREMENT QUALITY COMBINED WITH THE ERROR FROM INSTRUMENTATION.
2. THE MAXIMUM RECORDED STAGE CORRESPONDS TO AN EXTRAPOLATION 4.8 TIMES THE MAXIMUM MEASURED DISCHARGE.
Q = 18 (H - 2.865)3.4
A-26 of 27

M:\1\01\00325\14\A\Data\Task 310 ‐ Hydrology\Baseline Report\2012 Baseline Report\W18\W18 Streamflow Record 20130305Measured Hydrograph Print 10/07/2013 1:40 PM
0.0
0.5
1.0
1.5
2.0
2.5
3.0
3.5
4.0
4.5
Jan 2010 Jun 2010 Dec 2010 Jun 2011 Dec 2011 Jun 2012 Dec 2012
Dai
ly D
isch
arg
e (m
3/s
)
Date
Daily Discharge Record
Measured Discharge
Winter Approximation Low Flow
0
DATE
21MAR'13
DESCRIPTION
ISSUED WITH REPORT VA101-325/14
PREP'D
DS
CHK'
KT
APP'
KJB
REV
BRYNELSEN CREEK STATION (W18)MEASURED DISCHARGE HYDROGRAPH
FIGURE 9b
CASINO MINING CORPORATION
CASINO COPPER-GOLD PROJECT
REV0
P/A NO.VA101-325/14
REF. NO.1
NOTE:1. THE WINTER APPROXIMATION LOW FLOW DISCHARGE IS BASED ON A MEASUREMENT
WHERE POSSIBLE, OR BASED ON A COMBINATION OF CONCURRENT MEASUREMENTS AT ADJACENT STATIONS AND REGIONAL UNIT RUNOFF.
A-27 of 27

CASINO MINING CORPORATION
CASINO PROJECT
BASELINE HYDROLOGY REPORT VA101-325/14-5 Rev 0 October 10, 2013
APPENDIX B
SYNTHETIC FLOW SERIES
(Pages B-1 to B-63

Year Jan Feb Mar Apr May Jun Jul Aug Sep Oct Nov Dec Annual
1975 0.00 0.00 0.00 0.01 1.21 0.30 0.60 0.43 0.33 0.11 0.01 0.00 0.251976 0.00 0.00 0.00 0.01 0.56 0.67 1.13 0.11 0.07 0.04 0.02 0.01 0.221977 0.01 0.01 0.00 0.01 0.36 0.39 0.35 0.09 0.13 0.08 0.02 0.00 0.121978 0.00 0.00 0.00 0.00 0.12 0.68 1.13 0.55 0.20 0.14 0.04 0.02 0.241979 0.01 0.00 0.00 0.00 0.37 0.41 0.46 0.20 0.26 0.11 0.03 0.01 0.161980 0.00 0.00 0.00 0.00 0.13 0.08 0.41 0.14 0.71 0.20 0.02 0.00 0.141981 0.00 0.00 0.00 0.00 0.24 0.07 0.40 0.23 0.19 0.15 0.04 0.01 0.111982 0.00 0.00 0.00 0.00 0.65 0.53 0.06 0.41 0.07 0.05 0.02 0.01 0.151983 0.00 0.00 0.00 0.00 0.20 0.62 0.43 0.60 0.23 0.10 0.01 0.00 0.181984 0.00 0.00 0.00 0.00 0.06 0.48 0.54 0.09 0.43 0.07 0.01 0.00 0.131985 0.00 0.00 0.00 0.00 0.78 0.59 0.45 0.19 0.26 0.10 0.03 0.02 0.201986 0.01 0.01 0.00 0.00 0.77 0.42 0.40 0.16 0.24 0.11 0.02 0.01 0.181987 0.01 0.01 0.00 0.01 0.68 0.57 0.11 0.21 0.20 0.10 0.03 0.01 0.161988 0.00 0.00 0.01 0.01 0.67 0.20 0.59 0.26 0.19 0.09 0.04 0.02 0.171989 0.01 0.00 0.00 0.00 0.18 0.13 0.09 0.09 0.13 0.06 0.03 0.01 0.061990 0.01 0.00 0.00 0.74 2.84 0.35 0.14 0.06 0.48 0.15 0.02 0.01 0.401991 0.01 0.01 0.01 0.05 1.55 0.57 0.38 0.35 0.64 0.17 0.11 0.05 0.331992 0.03 0.01 0.01 0.02 1.83 0.99 0.97 0.19 0.48 0.13 0.05 0.03 0.401993 0.01 0.01 0.00 0.10 0.96 0.17 0.23 0.21 0.19 0.05 0.05 0.03 0.171994 0.02 0.01 0.00 0.16 0.39 0.15 0.09 0.08 0.09 0.06 0.01 0.01 0.091996 0.01 0.00 0.00 0.00 0.10 0.10 0.57 0.35 0.29 0.09 0.02 0.00 0.131997 0.00 0.00 0.00 0.00 0.82 1.19 0.65 0.53 0.26 0.11 0.04 0.02 0.301998 0.00 0.00 0.00 0.00 0.14 0.14 0.02 0.01 0.06 0.03 0.01 0.00 0.031999 0.00 0.00 0.00 0.00 0.18 0.63 0.09 0.08 0.24 0.10 0.01 0.00 0.112000 0.00 0.00 0.00 0.01 1.78 0.67 0.71 0.69 1.27 0.30 0.13 0.06 0.472001 0.03 0.02 0.01 0.03 0.36 1.24 0.88 0.43 0.35 0.15 0.06 0.03 0.302002 0.01 0.01 0.01 0.01 0.43 0.18 0.18 0.24 0.56 0.15 0.05 0.03 0.152003 0.01 0.01 0.00 0.08 0.21 0.58 0.51 0.18 0.19 0.13 0.04 0.02 0.172004 0.01 0.01 0.01 0.04 1.21 0.10 0.06 0.13 0.19 0.14 0.03 0.02 0.162005 0.01 0.01 0.01 0.16 0.26 0.15 0.20 0.20 0.43 0.16 0.05 0.01 0.142006 0.01 0.00 0.00 0.01 0.50 0.23 0.17 0.10 0.16 0.08 0.03 0.01 0.112007 0.00 - 0.00 0.05 0.51 0.15 0.22 0.11 0.20 0.11 0.02 0.01 0.142008 0.00 0.00 0.00 0.02 1.27 0.22 0.09 0.93 0.41 0.17 0.06 0.03 0.272009 0.02 0.02 0.01 0.03 1.40 0.48 0.03 0.08 0.16 0.07 0.04 0.02 0.202010 0.01 0.01 0.01 0.19 0.34 0.13 1.06 0.46 0.46 0.13 0.06 0.03 0.242011 0.03 0.03 0.02 0.06 1.35 0.93 1.07 0.67 0.28 0.16 0.08 0.04 0.402012 - - - - 1.35 0.59 0.43 0.45 0.38 0.47 1.07 0.59 0.57
Average 0.01 0.01 0.00 0.05 0.72 0.43 0.44 0.28 0.30 0.12 0.05 0.03 0.21
Maximum 0.03 0.03 0.02 0.74 2.84 1.24 1.13 0.93 1.27 0.47 1.07 0.59 0.57
Minimum 0.00 0.00 0.00 0.00 0.06 0.07 0.02 0.01 0.06 0.03 0.01 0.00 0.03
M:\1\01\00325\14\A\Data\Task 310 - Hydrology\Baseline Report\2012 Baseline Report\W14\[10100325_W14_PERIOD_REGRESSION_20130319.xlsm]Av Monthly Flows
NOTES:1. MAY THROUGH OCTOBER VALUES WERE DERIVED BY RANKED REGRESSION WITH BIG CREEK (WSC 09AH003).2. NOVEMBER THROUGH APRIL VALUES WERE DERIVED BY APPLYING THE MOST APPROPRIATE OPEN WATER REGRESSION TO THE BIG CREEK NOVEMBER THROUGH APRIL FLOWS.
Print: 7/10/13 17:15
TABLE 1
CASINO MINING CORPORATIONCASINO PROJECT
BRITANNIA CREEK STATION (W14)SUMMARY OF LONG-TERM SYNTHETIC FLOWS
0 18MAR'13 DS KTISSUED WITH REPORT VA101-325/14-5 KJB
DATE DESCRIPTION PREP'D CHK'D APP'DREV
B-1 of 63

M:\1\01\00325\14\A\Data\Task 310 - Hydrology\Baseline Report\2012 Baseline Report\W14\[10100325_W14_PERIOD_REGRESSION_20130319.xls]HYDROGRAPHPrint 10/07/2013 5:16 PM
0
1
2
3
4
5
6
Dec 2008 Jun 2009 Dec 2009 Jun 2010 Dec 2010 Jun 2011 Dec 2011 Jun 2012 Dec 2012
Dai
ly D
isch
arg
e (m
3 /s)
Measured Record
Synthetic Series
0 19MAR'13 ISSUED WITH REPORT VA101-325/14-5 DS KT KJBDATE DESCRIPTION PREP'D CHK'D APP'DREV
BRITANNIA CREEK STATION (W14)MEASURED AND SYNTHETIC HYDROGRAPHS
FIGURE 1a
CASINO MINING CORPORATION
CASINO PROJECT
REV0
P/A NO. VA103-325/14
REF. NO.5
B-2 of 63

M:\1\01\00325\14\A\Data\Task 310 - Hydrology\Baseline Report\2012 Baseline Report\W14\[10100325_W14_PERIOD_REGRESSION_20130319.xls]May EFP Print 10/07/2013 5:16 PM
0
1
2
3
4
5
6
7
8
9
10
0 50 100 150 200 250
Daily D
isch
arge
, W14
(m3 /
s)
Daily Discharge, Big Creek (m3/s)
Ranked Discharge Points
Line of Equal Unit Runoff
Empirical Frequency Paired Relationship
0 19MAR'13 ISSUED WITH REPORT VA101-325/14-5 PN KT KJBDATE DESCRIPTION PREP'D CHK'D APP'DREV
W14 AND BIG CREEKMAY RANKED REGRESSION RELATIONSHIP
FIGURE 1b
CASINO MINING CORPORATION
CASINO PROJECT
REV0
P/A NO. VA101-325/14 REF. NO.5
B-3 of 63

M:\1\01\00325\14\A\Data\Task 310 - Hydrology\Baseline Report\2012 Baseline Report\W14\[10100325_W14_PERIOD_REGRESSION_20130319.xls]Jun EFP Print 10/07/2013 5:16 PM
0
1
2
3
4
5
6
7
0 20 40 60 80 100 120 140 160
Daily D
isch
arge
, W14
(m3 /
s)
Daily Discharge, Big Creek (m3/s)
Ranked Discharge Points
Line of Equal Unit Runoff
Empirical Frequency Paired Relationship
0 19MAR'13 ISSUED WITH REPORT VA101-325/14-5 PN KT KJB
DATE DESCRIPTION PREP'D CHK'D APP'DREV
W14 AND BIG CREEKJUNE RANKED REGRESSION RELATIONSHIP
FIGURE 1c
CASINO MINING CORPORATION
CASINO PROJECT
REV0
P/A NO. VA101-325/14 REF. NO.5
B-4 of 63

M:\1\01\00325\14\A\Data\Task 310 - Hydrology\Baseline Report\2012 Baseline Report\W14\[10100325_W14_PERIOD_REGRESSION_20130319.xls]July EFP Print 10/07/2013 5:16 PM
0
1
2
3
4
5
6
7
8
0 50 100 150 200 250 300
Daily D
isch
arge
, W14
(m3 /
s)
Daily Discharge, Big Creek (m3/s)
Ranked Discharge Points
Line of Equal Unit Runoff
Empirical Frequency Paired Relationship
0 19MAR'13 ISSUED WITH REPORT VA101-325/14-5 PN KT KJB
DATE DESCRIPTION PREP'D CHK'D APP'DREV
W14 AND BIG CREEKJULY RANKED REGRESSION RELATIONSHIP
FIGURE 1d
CASINO MINING CORPORATION
CASINO PROJECT
REV0
P/A NO. VA101-325/14 REF. NO.5
B-5 of 63

M:\1\01\00325\14\A\Data\Task 310 - Hydrology\Baseline Report\2012 Baseline Report\W14\[10100325_W14_PERIOD_REGRESSION_20130319.xls]Aug EFP Print 10/07/2013 5:16 PM
0
1
2
3
4
5
6
7
8
9
0 50 100 150 200 250 300
Daily D
isch
arge
, W14
(m3 /
s)
Daily Discharge, Big Creek (m3/s)
Ranked Discharge Points
Line of Equal Unit Runoff
Empirical Frequency Paired Relationship
0 19MAR'13 ISSUED WITH REPORT VA101-325/14-5 PN KT KJB
DATE DESCRIPTION PREP'D CHK'D APP'DREV
W14 AND BIG CREEKAUGUST RANKED REGRESSION RELATIONSHIP
FIGURE 1e
CASINO MINING CORPORATION
CASINO PROJECT
REV0
P/A NO. VA101-325/14 REF. NO.5
B-6 of 63

M:\1\01\00325\14\A\Data\Task 310 - Hydrology\Baseline Report\2012 Baseline Report\W14\[10100325_W14_PERIOD_REGRESSION_20130319.xls]Sep-oct EFP Print 10/07/2013 5:16 PM
0
1
2
3
4
5
6
0 20 40 60 80 100 120 140 160
Daily D
isch
arge
, W14
(m3 /
s)
Daily Discharge, Big Creek (m3/s)
Ranked Discharge Points
Line of Equal Unit Runoff
Empirical Frequency Paired Relationship
0 19MAR'13 ISSUED WITH REPORT VA101-325/14-5 PN KT KJB
DATE DESCRIPTION PREP'D CHK'D APP'DREV
W14 AND BIG CREEK SEPTEMBER - OCTOBER RANKED REGRESSION RELATIONSHIP
FIGURE 1f
CASINO MINING CORPORATION
CASINO PROJECT
REV0
P/A NO. VA101-325/14 REF. NO.5
B-7 of 63

Year Jan Feb Mar Apr May Jun Jul Aug Sep Oct Nov Dec Annual
1975 0.00 0.00 0.01 0.01 1.35 0.58 0.89 0.53 0.35 0.14 0.02 0.01 0.331976 0.01 0.00 0.00 0.01 0.68 1.08 1.62 0.07 0.13 0.07 0.03 0.01 0.311977 0.01 0.01 0.01 0.01 0.44 0.70 0.54 0.05 0.17 0.12 0.03 0.00 0.171978 0.00 0.00 0.00 0.00 0.14 0.91 1.59 1.02 0.21 0.17 0.08 0.03 0.351979 0.01 0.01 0.01 0.00 0.45 0.70 0.69 0.20 0.28 0.14 0.05 0.02 0.211980 0.01 0.01 0.01 0.01 0.16 0.29 0.58 0.13 1.05 0.21 0.03 0.01 0.211981 0.01 0.01 0.01 0.00 0.30 0.27 0.62 0.27 0.20 0.18 0.07 0.02 0.161982 0.01 0.01 0.01 0.00 0.83 0.90 0.14 0.81 0.12 0.08 0.04 0.01 0.251983 0.01 0.00 0.00 0.00 0.24 0.90 0.63 1.00 0.23 0.14 0.02 0.00 0.271984 0.00 0.00 0.00 0.00 0.08 0.68 0.75 0.05 0.57 0.11 0.02 0.00 0.181985 0.00 0.00 0.00 0.00 0.94 0.96 0.70 0.18 0.27 0.14 0.06 0.03 0.281986 0.02 0.01 0.00 0.00 0.84 0.73 0.59 0.16 0.25 0.14 0.03 0.03 0.231987 0.02 0.01 0.00 0.01 0.82 0.82 0.21 0.23 0.21 0.13 0.04 0.02 0.211988 0.01 0.01 0.01 0.01 0.84 0.42 0.87 0.28 0.20 0.14 0.07 0.03 0.241989 0.02 0.01 0.00 0.00 0.22 0.35 0.17 0.06 0.17 0.11 0.05 0.02 0.101990 0.01 0.00 0.00 0.80 2.98 0.62 0.25 0.05 0.58 0.18 0.04 0.01 0.461991 0.01 0.01 0.02 0.06 1.84 0.90 0.61 0.47 0.91 0.19 0.15 0.09 0.441992 0.05 0.02 0.02 0.03 1.88 1.43 1.40 0.19 0.63 0.16 0.09 0.05 0.501993 0.02 0.01 0.01 0.13 1.15 0.38 0.38 0.21 0.21 0.09 0.08 0.06 0.231994 0.03 0.01 0.01 0.20 0.48 0.36 0.19 0.04 0.13 0.09 0.02 0.01 0.131996 0.01 0.00 0.00 0.00 0.13 0.29 0.84 0.43 0.31 0.12 0.03 0.01 0.181997 0.00 0.00 0.00 0.00 1.03 1.75 0.97 0.83 0.27 0.14 0.08 0.03 0.431998 0.01 0.01 0.00 0.00 0.17 0.35 0.07 0.02 0.10 0.05 0.01 0.00 0.071999 0.00 0.00 0.00 0.00 0.22 0.88 0.18 0.05 0.26 0.13 0.02 0.00 0.152000 0.00 0.00 0.00 0.01 1.93 1.15 1.05 1.00 2.03 0.32 0.17 0.10 0.652001 0.05 0.03 0.02 0.04 0.44 1.49 1.28 0.69 0.38 0.18 0.11 0.05 0.402002 0.02 0.01 0.01 0.02 0.53 0.42 0.31 0.27 0.83 0.18 0.08 0.04 0.232003 0.02 0.01 0.01 0.10 0.26 0.77 0.73 0.18 0.20 0.17 0.07 0.03 0.212004 0.02 0.02 0.02 0.05 1.44 0.30 0.13 0.10 0.20 0.17 0.05 0.03 0.212005 0.02 0.02 0.01 0.19 0.33 0.37 0.33 0.20 0.53 0.19 0.09 0.02 0.192006 0.01 0.01 0.01 0.01 0.61 0.48 0.29 0.07 0.18 0.12 0.05 0.01 0.162007 0.00 - 0.00 0.06 0.63 0.37 0.35 0.08 0.22 0.14 0.04 0.01 0.192008 0.01 0.01 0.01 0.03 1.53 0.45 0.16 1.82 0.48 0.19 0.10 0.06 0.412009 0.04 0.03 0.03 0.04 1.57 0.78 0.09 0.05 0.18 0.12 0.07 0.03 0.252010 0.02 0.01 0.01 0.23 0.41 0.33 1.48 0.57 0.59 0.16 0.10 0.06 0.332011 0.05 0.05 0.04 0.08 1.55 1.33 1.48 0.96 0.30 0.18 0.13 0.07 0.522012 - - - 0.00 1.65 0.96 0.68 0.70 0.41 0.73 1.70 0.71 0.83
Average 0.01 0.01 0.01 0.06 0.84 0.71 0.65 0.39 0.38 0.16 0.09 0.04 0.28
Maximum 0.05 0.05 0.04 0.80 2.98 1.75 1.62 1.82 2.03 0.73 1.70 0.71 0.83
Minimum 0.00 0.00 0.00 0.00 0.08 0.27 0.07 0.02 0.10 0.05 0.01 0.00 0.07
M:\1\01\00325\14\A\Data\Task 310 - Hydrology\Baseline Report\2012 Baseline Report\W3\[10100325_W3_PERIOD_REGRESSION_20130319.xlsm]Av Monthly Flows
NOTES:1. MAY THROUGH OCTOBER VALUES WERE DERIVED BY RANKED REGRESSION WITH BIG CREEK (WSC 09AH003).2. NOVEMBER THROUGH APRIL VALUES WERE DERIVED BY APPLYING THE MOST APPROPRIATE OPEN WATER REGRESSION TO THE BIG CREEK NOVEMBER THROUGH APRIL FLOWS.
Print: 7/10/13 16:11
TABLE 2
CASINO MINING CORPORATIONCASINO PROJECT
CANADIAN CREEK STATION (W3)SUMMARY OF LONG-TERM SYNTHETIC FLOWS
0 18MAR'13 DS KTISSUED WITH REPORT VA101-325/14-5 KJB
DATE DESCRIPTION PREP'D CHK'D APP'DREV
B-8 of 63

M:\1\01\00325\14\A\Data\Task 310 - Hydrology\Baseline Report\2012 Baseline Report\W3\[10100325_W3_PERIOD_REGRESSION_20130319.xls]HYDROGRAPH Print 10/07/2013 4:13 PM
0
2
4
6
8
10
12
Jan 2010 May 2010 Sep 2010 Jan 2011 May 2011 Sep 2011 Jan 2012 May 2012 Sep 2012 Jan 2013
Dai
ly D
isch
arg
e (m
3 /s)
Measured Record
Synthetic Series
0 19MAR'13 ISSUED WITH REPORT VA101-325/14-5 DS KT KJBDATE DESCRIPTION PREP'D CHK'D APP'DREV
CANADIAN CREEK STATION (W3)MEASURED AND SYNTHETIC HYDROGRAPHS
FIGURE 2a
CASINO MINING CORPORATION
CASINO PROJECT
REV0
P/A NO. VA103-325/14
REF. NO.5
B-9 of 63

M:\1\01\00325\14\A\Data\Task 310 - Hydrology\Baseline Report\2012 Baseline Report\W3\[10100325_W3_PERIOD_REGRESSION_20130319.xls]May EFP Print 10/07/2013 4:13 PM
0
1
2
3
4
5
6
7
8
9
10
0 50 100 150 200 250
Daily D
isch
arge
, W3
(m3 /
s)
Daily Discharge, Big Creek (m3/s)
Ranked Discharge Points
Line of Equal Unit Runoff
Empirical Frequency Paired Relationship
0 19MAR'13 ISSUED WITH REPORT VA101-325/14-5 PN KT KJB
DATE DESCRIPTION PREP'D CHK'D APP'DREV
W3 AND BIG CREEKMAY RANKED REGRESSION RELATIONSHIP
FIGURE 2b
CASINO MINING CORPORATION
CASINO PROJECT
REV0
P/A NO. VA101-325/14 REF. NO.5
B-10 of 63

M:\1\01\00325\14\A\Data\Task 310 - Hydrology\Baseline Report\2012 Baseline Report\W3\[10100325_W3_PERIOD_REGRESSION_20130319.xls]Jun EFP Print 10/07/2013 4:13 PM
0
1
2
3
4
5
6
0 20 40 60 80 100 120 140 160
Daily D
isch
arge
, W3
(m3 /
s)
Daily Discharge, Big Creek (m3/s)
Ranked Discharge Points
Line of Equal Unit Runoff
Empirical Frequency Paired Relationship
0 19MAR'13 ISSUED WITH REPORT VA101-325/14-5 PN KT KJB
DATE DESCRIPTION PREP'D CHK'D APP'DREV
W3 AND BIG CREEKJUNE RANKED REGRESSION RELATIONSHIP
FIGURE 2c
CASINO MINING CORPORATION
CASINO PROJECT
REV0
P/A NO. VA101-325/14 REF. NO.5
B-11 of 63

M:\1\01\00325\14\A\Data\Task 310 - Hydrology\Baseline Report\2012 Baseline Report\W3\[10100325_W3_PERIOD_REGRESSION_20130319.xls]Jul EFP Print 10/07/2013 4:13 PM
0
1
2
3
4
5
6
7
8
9
10
0 50 100 150 200 250 300
Daily D
isch
arge
, W3
(m3 /
s)
Daily Discharge, Big Creek (m3/s)
Ranked Discharge Points
Line of Equal Unit Runoff
Empirical Frequency Paired Relationship
0 19MAR'13 ISSUED WITH REPORT VA101-325/14-5 PN KT KJB
DATE DESCRIPTION PREP'D CHK'D APP'DREV
W3 AND BIG CREEKJULY RANKED REGRESSION RELATIONSHIP
FIGURE 2d
CASINO MINING CORPORATION
CASINO PROJECT
REV0
P/A NO. VA101-325/14 REF. NO.5
B-12 of 63

M:\1\01\00325\14\A\Data\Task 310 - Hydrology\Baseline Report\2012 Baseline Report\W3\[10100325_W3_PERIOD_REGRESSION_20130319.xls]Aug EFP Print 10/07/2013 4:13 PM
0
2
4
6
8
10
12
14
16
18
0 50 100 150 200 250 300
Daily D
isch
arge
, W3
(m3 /
s)
Daily Discharge, Big Creek (m3/s)
Ranked Discharge Points
Line of Equal Unit Runoff
Empirical Frequeny Paired Relationship
0 19MAR'13 ISSUED WITH REPORT VA101-325/14-5 PN KT KJB
DATE DESCRIPTION PREP'D CHK'D APP'DREV
W3 AND BIG CREEKAUGUST RANKED REGRESSION RELATIONSHIP
FIGURE 2e
CASINO MINING CORPORATION
CASINO PROJECT
REV0
P/A NO. VA101-325/14 REF. NO.5
B-13 of 63

M:\1\01\00325\14\A\Data\Task 310 - Hydrology\Baseline Report\2012 Baseline Report\W3\[10100325_W3_PERIOD_REGRESSION_20130319.xls]Sep-oct EFP Print 10/07/2013 4:13 PM
0
1
2
3
4
5
6
7
0 20 40 60 80 100 120
Daily D
isch
arge
, W3
(m3 /
s)
Daily Discharge, Big Creek (m3/s)
Frequency Paired Unit Runoff
Line of Equal Unit Runoff
Empirical Frequency Paired Relationship
0 19MAR'13 ISSUED WITH REPORT VA101-325/14-5 PN KT KJB
DATE DESCRIPTION PREP'D CHK'D APP'DREV
W3 AND BIG CREEK SEPTEMBER ‐ OCTOBER RANKED REGRESSION RELATIONSHIP
FIGURE 2f
CASINO MINING CORPORATION
CASINO PROJECT
REV0
P/A NO. VA101-325/14 REF. NO.5
B-14 of 63

Year Jan Feb Mar Apr May Jun Jul Aug Sep Oct Nov Dec Annual
1975 0.00 0.00 0.01 0.02 8.17 3.64 5.90 5.82 2.82 0.80 0.08 0.04 2.301976 0.01 0.00 0.00 0.02 2.21 7.33 10.44 0.86 0.59 0.34 0.15 0.05 1.841977 0.01 0.01 0.01 0.03 1.28 4.61 3.60 0.57 0.86 0.56 0.14 0.02 0.981978 0.00 0.00 0.00 0.00 0.44 6.35 10.23 7.99 1.50 0.96 0.35 0.13 2.351979 0.02 0.01 0.01 0.01 1.33 4.71 4.64 2.14 2.07 0.69 0.22 0.07 1.331980 0.01 0.01 0.01 0.02 0.47 1.01 4.08 1.63 4.60 1.55 0.16 0.04 1.131981 0.01 0.01 0.01 0.01 0.87 0.90 4.30 3.07 1.17 0.96 0.32 0.09 0.991982 0.01 0.01 0.01 0.01 2.62 5.66 0.93 5.58 0.55 0.38 0.17 0.06 1.341983 0.01 0.00 0.00 0.00 0.74 6.24 4.27 7.87 1.77 0.66 0.09 0.01 1.821984 0.00 0.00 0.00 0.01 0.23 4.65 4.97 0.62 2.84 0.51 0.08 0.01 1.101985 0.00 0.00 0.00 0.00 3.46 6.50 4.81 2.08 2.20 0.70 0.27 0.15 1.691986 0.03 0.02 0.01 0.00 5.30 4.64 4.02 1.80 1.87 0.71 0.13 0.12 1.571987 0.02 0.01 0.00 0.04 2.49 5.62 1.42 2.60 1.52 0.66 0.21 0.09 1.231988 0.01 0.01 0.01 0.03 2.68 2.36 5.78 2.93 1.22 0.64 0.33 0.16 1.361989 0.02 0.01 0.00 0.01 0.67 1.68 1.20 0.69 0.79 0.50 0.23 0.10 0.491990 0.01 0.01 0.00 5.60 23.02 4.17 1.76 0.62 3.95 1.17 0.19 0.06 3.411991 0.01 0.01 0.02 0.18 7.94 6.48 4.11 4.85 4.26 1.13 0.72 0.43 2.531992 0.06 0.02 0.03 0.08 15.58 10.33 9.00 2.14 3.39 0.96 0.41 0.22 3.541993 0.03 0.01 0.01 0.36 3.76 2.09 2.80 2.31 1.41 0.41 0.38 0.27 1.161994 0.04 0.02 0.01 0.59 1.43 1.82 1.28 0.48 0.61 0.46 0.11 0.06 0.531996 0.01 0.00 0.00 0.00 0.38 1.23 5.67 4.81 2.43 0.59 0.14 0.03 1.281997 0.00 0.00 0.00 0.00 3.33 11.99 6.46 7.54 2.21 0.77 0.36 0.13 2.751998 0.01 0.01 0.01 0.01 0.50 1.72 0.44 0.27 0.48 0.24 0.04 0.01 0.311999 0.00 0.00 0.00 0.01 0.64 6.44 1.18 0.60 1.79 0.63 0.07 0.01 0.942000 0.00 0.00 0.00 0.04 12.56 7.48 6.94 11.46 7.20 2.41 0.82 0.49 4.142001 0.07 0.04 0.03 0.10 1.47 11.45 8.26 5.70 3.04 1.06 0.51 0.22 2.672002 0.03 0.02 0.01 0.04 1.57 2.08 1.99 2.80 3.35 0.93 0.38 0.20 1.122003 0.03 0.01 0.01 0.28 0.79 5.45 5.00 1.96 1.38 0.94 0.33 0.13 1.362004 0.02 0.02 0.02 0.14 6.39 1.22 0.86 1.15 1.22 0.96 0.25 0.12 1.042005 0.02 0.02 0.02 0.61 0.97 1.99 2.63 2.16 3.41 1.19 0.43 0.09 1.132006 0.01 0.01 0.01 0.03 1.83 2.56 2.05 0.85 0.99 0.57 0.23 0.06 0.772007 0.00 - 0.00 0.18 1.82 1.96 2.48 0.98 1.49 0.73 0.17 0.06 0.992008 0.01 0.01 0.01 0.07 6.31 2.48 1.21 10.66 3.43 1.18 0.49 0.27 2.192009 0.05 0.04 0.03 0.09 8.43 5.21 0.59 0.63 0.95 0.55 0.33 0.15 1.432010 0.02 0.01 0.01 0.67 1.23 1.57 9.52 6.72 3.45 0.93 0.49 0.27 2.102011 0.07 0.07 0.05 0.21 7.35 9.58 9.60 10.53 2.43 1.07 0.61 0.34 3.522012 - - - - 5.76 6.86 4.78 6.07 3.30 2.45 5.97 5.01 4.88
Average 0.02 0.01 0.01 0.26 3.98 4.65 4.36 3.63 2.20 0.85 0.37 0.21 1.73
Maximum 0.07 0.07 0.05 5.60 23.02 11.99 10.44 11.46 7.20 2.45 5.97 5.01 4.88
Minimum 0.00 0.00 0.00 0.00 0.23 0.90 0.44 0.27 0.48 0.24 0.04 0.01 0.31
M:\1\01\00325\14\A\Data\Task 310 - Hydrology\Baseline Report\2012 Baseline Report\W16\[10100325_W16_PERIOD_REGRESSION_20130319.xlsm]Av Monthly Flows
NOTES:1. MAY THROUGH OCTOBER VALUES WERE DERIVED BY RANKED REGRESSION WITH BIG CREEK (WSC 09AH003).2. NOVEMBER THROUGH APRIL VALUES WERE DERIVED BY APPLYING THE MOST APPROPRIATE OPEN WATER REGRESSION TO THE BIG CREEK NOVEMBER THROUGH APRIL FLOWS.
Print: 7/10/13 17:29
TABLE 3
CASINO MINING CORPORATIONCASINO PROJECT
LOWER DIP CREEK STATION (W16)SUMMARY OF LONG-TERM SYNTHETIC FLOWS
0 18MAR'13 DS KTISSUED WITH REPORT VA101-325/14-5 KJB
DATE DESCRIPTION PREP'D CHK'D APP'DREV
B-15 of 63

M:\1\01\00325\14\A\Data\Task 310 - Hydrology\Baseline Report\2012 Baseline Report\W16\[10100325_W16_PERIOD_REGRESSION_20130319.xls]HYDROGRAPHPrint 10/07/2013 5:30 PM
0
10
20
30
40
50
60
May 2010 Aug 2010 Dec 2010 Apr 2011 Aug 2011 Dec 2011 Apr 2012 Aug 2012
Dai
ly D
isch
arg
e (m
3 /s)
Measured Record
Synthetic Series
0 19MAR'13 ISSUED WITH REPORT VA101-325/14-5 DS KT KJB
DATE DESCRIPTION PREP'D CHK'D APP'DREV
LOWER DIP CREEK STATION (W16)MEASURED AND SYNTHETIC HYDROGRAPHS
FIGURE 3a
CASINO MINING CORPORATION
CASINO PROJECT
REV0
P/A NO. VA103-325/14
REF. NO.5
B-16 of 63

M:\1\01\00325\14\A\Data\Task 310 - Hydrology\Baseline Report\2012 Baseline Report\W16\[10100325_W16_PERIOD_REGRESSION_20130319.xls]May EFP Print 10/07/2013 5:30 PM
0
20
40
60
80
100
120
0 50 100 150 200 250
Daily D
isch
arge
, W16
(m3 /
s)
Daily Discharge, Big Creek (m3/s)
Ranked Discharge Points
Line of Equal Unit Runoff
Empirical Frequency Paired Relationship
0 19MAR'13 ISSUED WITH REPORT VA101-325/14-5 PN KT KJB
DATE DESCRIPTION PREP'D CHK'D APP'DREV
W16 AND BIG CREEKMAY RANKED REGRESSION RELATIONSHIP
FIGURE 3b
CASINO MINING CORPORATION
CASINO PROJECT
REV0
P/A NO. VA101-325/14 REF. NO.5
B-17 of 63

M:\1\01\00325\14\A\Data\Task 310 - Hydrology\Baseline Report\2012 Baseline Report\W16\[10100325_W16_PERIOD_REGRESSION_20130319.xls]Jun EFP Print 10/07/2013 5:30 PM
0
10
20
30
40
50
60
0 20 40 60 80 100 120 140 160
Daily D
isch
arge
, W16
(m3 /
s)
Daily Discharge, Big Creek (m3/s)
Ranked Discharge Points
Line of Equal Unit Runoff
Empirical Frequency Paired Relationship
0 19MAR'13 ISSUED WITH REPORT VA101-325/14-5 PN KT KJBDATE DESCRIPTION PREP'D CHK'D APP'DREV
W16 AND BIG CREEKJUNE RANKED REGRESSION RELATIONSHIP
FIGURE 3c
CASINO MINING CORPORATION
CASINO PROJECT
REV0
P/A NO. VA101-325/14 REF. NO.5
B-18 of 63
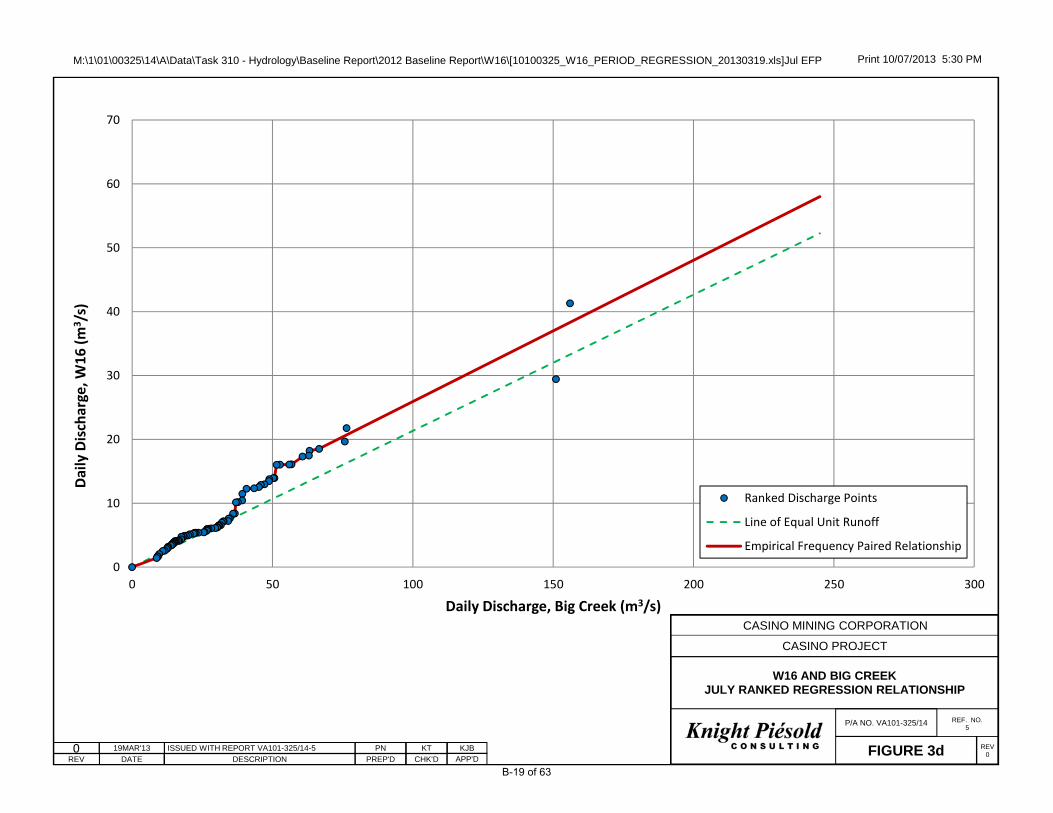
M:\1\01\00325\14\A\Data\Task 310 - Hydrology\Baseline Report\2012 Baseline Report\W16\[10100325_W16_PERIOD_REGRESSION_20130319.xls]Jul EFP Print 10/07/2013 5:30 PM
0
10
20
30
40
50
60
70
0 50 100 150 200 250 300
Daily D
isch
arge
, W16
(m3 /
s)
Daily Discharge, Big Creek (m3/s)
Ranked Discharge Points
Line of Equal Unit Runoff
Empirical Frequency Paired Relationship
0 19MAR'13 ISSUED WITH REPORT VA101-325/14-5 PN KT KJB
DATE DESCRIPTION PREP'D CHK'D APP'DREV
W16 AND BIG CREEKJULY RANKED REGRESSION RELATIONSHIP
FIGURE 3d
CASINO MINING CORPORATION
CASINO PROJECT
REV0
P/A NO. VA101-325/14 REF. NO.5
B-19 of 63

M:\1\01\00325\14\A\Data\Task 310 - Hydrology\Baseline Report\2012 Baseline Report\W16\[10100325_W16_PERIOD_REGRESSION_20130319.xls]Aug EFP Print 10/07/2013 5:30 PM
0
10
20
30
40
50
60
70
80
90
0 50 100 150 200 250 300
Daily D
isch
arge
, W16
(m3 /
s)
Daily Discharge, Big Creek (m3/s)
Ranked Discharge Points
Line of Equal Unit Runoff
Empirical Frequency Paired Relationship
0 19MAR'13 ISSUED WITH REPORT VA101-325/14-5 PN KT KJB
DATE DESCRIPTION PREP'D CHK'D APP'DREV
W16 AND BIG CREEKAUGUST RANKED REGRESSION RELATIONSHIP
FIGURE 3e
CASINO MINING CORPORATION
CASINO PROJECT
REV0
P/A NO. VA101-325/14 REF. NO.5
B-20 of 63

M:\1\01\00325\14\A\Data\Task 310 - Hydrology\Baseline Report\2012 Baseline Report\W16\[10100325_W16_PERIOD_REGRESSION_20130319.xls]Sep-oct EFP Print 10/07/2013 5:30 PM
0
5
10
15
20
25
30
35
0 20 40 60 80 100 120 140 160
Daily D
isch
arge
, W16
(m3 /
s)
Daily Discharge, Big Creek (m3/s)
Ranked Discharge Points
Line of Equal Unit Runoff
Empirical Frequency Paired Relationship
0 19MAR'13 ISSUED WITH REPORT VA101-325/14-5 PN KT KJB
DATE DESCRIPTION PREP'D CHK'D APP'DREV
W16 AND BIG CREEK SEPTEMBER - OCTOBER RANKED REGRESSION RELATIONSHIP
FIGURE 3f
CASINO MINING CORPORATION
CASINO PROJECT
REV0
P/A NO. VA101-325/14 REF. NO.5
B-21 of 63
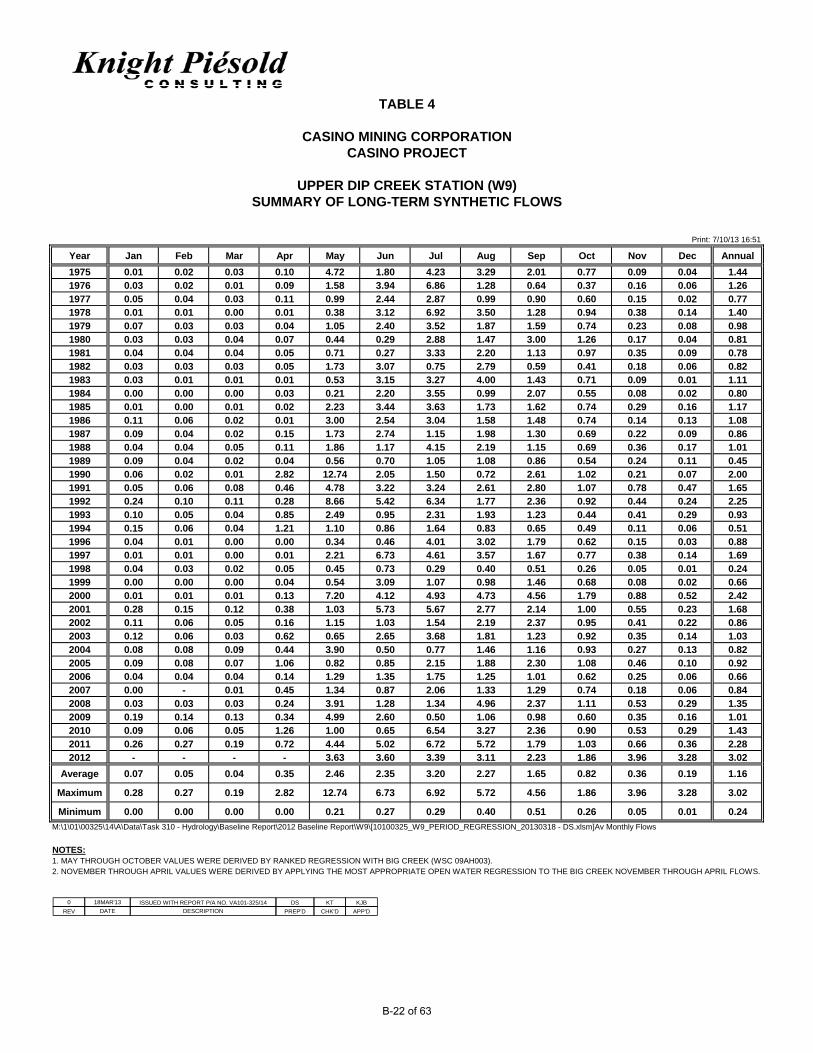
Year Jan Feb Mar Apr May Jun Jul Aug Sep Oct Nov Dec Annual
1975 0.01 0.02 0.03 0.10 4.72 1.80 4.23 3.29 2.01 0.77 0.09 0.04 1.441976 0.03 0.02 0.01 0.09 1.58 3.94 6.86 1.28 0.64 0.37 0.16 0.06 1.261977 0.05 0.04 0.03 0.11 0.99 2.44 2.87 0.99 0.90 0.60 0.15 0.02 0.771978 0.01 0.01 0.00 0.01 0.38 3.12 6.92 3.50 1.28 0.94 0.38 0.14 1.401979 0.07 0.03 0.03 0.04 1.05 2.40 3.52 1.87 1.59 0.74 0.23 0.08 0.981980 0.03 0.03 0.04 0.07 0.44 0.29 2.88 1.47 3.00 1.26 0.17 0.04 0.811981 0.04 0.04 0.04 0.05 0.71 0.27 3.33 2.20 1.13 0.97 0.35 0.09 0.781982 0.03 0.03 0.03 0.05 1.73 3.07 0.75 2.79 0.59 0.41 0.18 0.06 0.821983 0.03 0.01 0.01 0.01 0.53 3.15 3.27 4.00 1.43 0.71 0.09 0.01 1.111984 0.00 0.00 0.00 0.03 0.21 2.20 3.55 0.99 2.07 0.55 0.08 0.02 0.801985 0.01 0.00 0.01 0.02 2.23 3.44 3.63 1.73 1.62 0.74 0.29 0.16 1.171986 0.11 0.06 0.02 0.01 3.00 2.54 3.04 1.58 1.48 0.74 0.14 0.13 1.081987 0.09 0.04 0.02 0.15 1.73 2.74 1.15 1.98 1.30 0.69 0.22 0.09 0.861988 0.04 0.04 0.05 0.11 1.86 1.17 4.15 2.19 1.15 0.69 0.36 0.17 1.011989 0.09 0.04 0.02 0.04 0.56 0.70 1.05 1.08 0.86 0.54 0.24 0.11 0.451990 0.06 0.02 0.01 2.82 12.74 2.05 1.50 0.72 2.61 1.02 0.21 0.07 2.001991 0.05 0.06 0.08 0.46 4.78 3.22 3.24 2.61 2.80 1.07 0.78 0.47 1.651992 0.24 0.10 0.11 0.28 8.66 5.42 6.34 1.77 2.36 0.92 0.44 0.24 2.251993 0.10 0.05 0.04 0.85 2.49 0.95 2.31 1.93 1.23 0.44 0.41 0.29 0.931994 0.15 0.06 0.04 1.21 1.10 0.86 1.64 0.83 0.65 0.49 0.11 0.06 0.511996 0.04 0.01 0.00 0.00 0.34 0.46 4.01 3.02 1.79 0.62 0.15 0.03 0.881997 0.01 0.01 0.00 0.01 2.21 6.73 4.61 3.57 1.67 0.77 0.38 0.14 1.691998 0.04 0.03 0.02 0.05 0.45 0.73 0.29 0.40 0.51 0.26 0.05 0.01 0.241999 0.00 0.00 0.00 0.04 0.54 3.09 1.07 0.98 1.46 0.68 0.08 0.02 0.662000 0.01 0.01 0.01 0.13 7.20 4.12 4.93 4.73 4.56 1.79 0.88 0.52 2.422001 0.28 0.15 0.12 0.38 1.03 5.73 5.67 2.77 2.14 1.00 0.55 0.23 1.682002 0.11 0.06 0.05 0.16 1.15 1.03 1.54 2.19 2.37 0.95 0.41 0.22 0.862003 0.12 0.06 0.03 0.62 0.65 2.65 3.68 1.81 1.23 0.92 0.35 0.14 1.032004 0.08 0.08 0.09 0.44 3.90 0.50 0.77 1.46 1.16 0.93 0.27 0.13 0.822005 0.09 0.08 0.07 1.06 0.82 0.85 2.15 1.88 2.30 1.08 0.46 0.10 0.922006 0.04 0.04 0.04 0.14 1.29 1.35 1.75 1.25 1.01 0.62 0.25 0.06 0.662007 0.00 - 0.01 0.45 1.34 0.87 2.06 1.33 1.29 0.74 0.18 0.06 0.842008 0.03 0.03 0.03 0.24 3.91 1.28 1.34 4.96 2.37 1.11 0.53 0.29 1.352009 0.19 0.14 0.13 0.34 4.99 2.60 0.50 1.06 0.98 0.60 0.35 0.16 1.012010 0.09 0.06 0.05 1.26 1.00 0.65 6.54 3.27 2.36 0.90 0.53 0.29 1.432011 0.26 0.27 0.19 0.72 4.44 5.02 6.72 5.72 1.79 1.03 0.66 0.36 2.282012 - - - - 3.63 3.60 3.39 3.11 2.23 1.86 3.96 3.28 3.02
Average 0.07 0.05 0.04 0.35 2.46 2.35 3.20 2.27 1.65 0.82 0.36 0.19 1.16
Maximum 0.28 0.27 0.19 2.82 12.74 6.73 6.92 5.72 4.56 1.86 3.96 3.28 3.02
Minimum 0.00 0.00 0.00 0.00 0.21 0.27 0.29 0.40 0.51 0.26 0.05 0.01 0.24
M:\1\01\00325\14\A\Data\Task 310 - Hydrology\Baseline Report\2012 Baseline Report\W9\[10100325_W9_PERIOD_REGRESSION_20130318 - DS.xlsm]Av Monthly Flows
NOTES:1. MAY THROUGH OCTOBER VALUES WERE DERIVED BY RANKED REGRESSION WITH BIG CREEK (WSC 09AH003).2. NOVEMBER THROUGH APRIL VALUES WERE DERIVED BY APPLYING THE MOST APPROPRIATE OPEN WATER REGRESSION TO THE BIG CREEK NOVEMBER THROUGH APRIL FLOWS.
Print: 7/10/13 16:51
TABLE 4
CASINO MINING CORPORATIONCASINO PROJECT
UPPER DIP CREEK STATION (W9)SUMMARY OF LONG-TERM SYNTHETIC FLOWS
0 18MAR'13 DS KTISSUED WITH REPORT P/A NO. VA101-325/14 KJB
DATE DESCRIPTION PREP'D CHK'D APP'DREV
B-22 of 63

M:\1\01\00325\14\A\Data\Task 310 - Hydrology\Baseline Report\2012 Baseline Report\W9\[10100325_W9_PERIOD_REGRESSION_20130318 - DS.xls]HYDROGRAPHPrint 10/07/2013 4:52 PM
0
5
10
15
20
25
30
35
Oct 2007 Apr 2008 Oct 2008 Apr 2009 Oct 2009 Apr 2010 Oct 2010 May 2011 Nov 2011 May 2012 Nov 2012
Dai
ly D
isch
arg
e (m
3 /s)
Measured Record
Synthetic Series
0 18MAR'13 ISSUED WITH REPORT VA101-325/14 DS KT KJB
DATE DESCRIPTION PREP'D CHK'D APP'DREV
UPPER DIP CREEK CREEK STATION (W9)MEASURED AND SYNTHETIC HYDROGRAPHS
FIGURE 4a
CASINO MINING CORPORATION
CASINO PROJECT
REV0
P/A NO. VA103-325/14
REF. NO.5
B-23 of 63

M:\1\01\00325\14\A\Data\Task 310 - Hydrology\Baseline Report\2012 Baseline Report\W9\[10100325_W9_PERIOD_REGRESSION_20130318 - DS.xls]May EFP Print 10/07/2013 4:52 PM
0
10
20
30
40
50
60
70
0 50 100 150 200 250
Daily D
isch
arge
, W9
(m3 /
s)
Daily Discharge, Big Creek (m3/s)
Ranked Discharge Points
Line of Equal Unit Runoff
Empirical Frequency Paired Relationship
0 18MAR'13 ISSUED WITH REPORT VA101-325/14 PN KT KJB
DATE DESCRIPTION PREP'D CHK'D APP'DREV
W9 AND BIG CREEKMAY RANKED REGRESSION RELATIONSHIP
FIGURE 4b
CASINO MINING CORPORATION
CASINO PROJECT
REV0
P/A NO. VA101-325/14 REF. NO.5
B-24 of 63

M:\1\01\00325\14\A\Data\Task 310 - Hydrology\Baseline Report\2012 Baseline Report\W9\[10100325_W9_PERIOD_REGRESSION_20130318 - DS.xls]Jun EFP Print 10/07/2013 4:52 PM
0
5
10
15
20
25
30
0 20 40 60 80 100 120 140 160
Daily D
isch
arge
, W9
(m3 /
s)
Daily Discharge, Big Creek (m3/s)
Ranked Discharge Points
Line of Equal Unit Runoff
Empirical Frequency Paired Relationship
0 18MAR'13 ISSUED WITH REPORT VA101-325/14 PN KT KJB
DATE DESCRIPTION PREP'D CHK'D APP'DREV
W9 AND BIG CREEKJUNE RANEKD REGRESSION RELATIONSHIP
FIGURE 4c
CASINO MINING CORPORATION
CASINO PROJECT
REV0
P/A NO. VA101-325/14 REF. NO.5
B-25 of 63

M:\1\01\00325\14\A\Data\Task 310 - Hydrology\Baseline Report\2012 Baseline Report\W9\[10100325_W9_PERIOD_REGRESSION_20130318 - DS.xls]Jul EFP Print 10/07/2013 4:52 PM
0
5
10
15
20
25
30
35
0 50 100 150 200 250 300
Daily D
isch
arge
, W9
(m3 /
s)
Daily Discharge, Big Creek (m3/s)
Ranked Discharge Points
Line of Equal Unit Runoff
Empirical Frequency Paired Relationship
0 18MAR'13 ISSUED WITH REPORT VA101-325/14 PN KT KJB
DATE DESCRIPTION PREP'D CHK'D APP'DREV
W9 AND BIG CREEKJULY RANKED REGRESSION RELATIONSHIP
FIGURE 4d
CASINO MINING CORPORATION
CASINO PROJECT
REV0
P/A NO. VA101-325/14 REF. NO.5
B-26 of 63

M:\1\01\00325\14\A\Data\Task 310 - Hydrology\Baseline Report\2012 Baseline Report\W9\[10100325_W9_PERIOD_REGRESSION_20130318 - DS.xls]Aug EFP Print 10/07/2013 4:52 PM
0
5
10
15
20
25
30
35
0 50 100 150 200 250 300
Daily D
isch
arge
, W9
(m3 /
s)
Daily Discharge, Big Creek (m3/s)
Ranked Discharge Points
Line of Equal Unit Runoff
Empirical Frequency Paired Relationship
0 18MAR'13 ISSUED WITH REPORT VA101-325/14 PN KT KJB
DATE DESCRIPTION PREP'D CHK'D APP'DREV
W9 AND BIG CREEKAUGUST RANKED REGRESSION RELATIONSHIP
FIGURE 4e
CASINO MINING CORPORATION
CASINO PROJECT
REV0
P/A NO. VA101-325/14 REF. NO.5
B-27 of 63

M:\1\01\00325\14\A\Data\Task 310 - Hydrology\Baseline Report\2012 Baseline Report\W9\[10100325_W9_PERIOD_REGRESSION_20130318 - DS.xls]Sep-oct EFPPrint 10/07/2013 4:52 PM
0
2
4
6
8
10
12
14
16
18
0 20 40 60 80 100 120 140 160
Daily D
isch
arge
, W9
(m3 /
s)
Daily Discharge, Big Creek (m3/s)
Ranked Discharge Points
Line of Equal Unit Runoff
Empirical Frequency Paired Relationship
0 18MAR'13 ISSUED WITH REPORT VA101-325/14 PN KT KJB
DATE DESCRIPTION PREP'D CHK'D APP'DREV
W9 AND BIG CREEK SEPTEMBER - OCTOBER RANKED REGRESSION RELATIONSHIP
FIGURE 4f
CASINO MINING CORPORATION
CASINO PROJECT
REV0
P/A NO. VA101-325/14 REF. NO.5
B-28 of 63
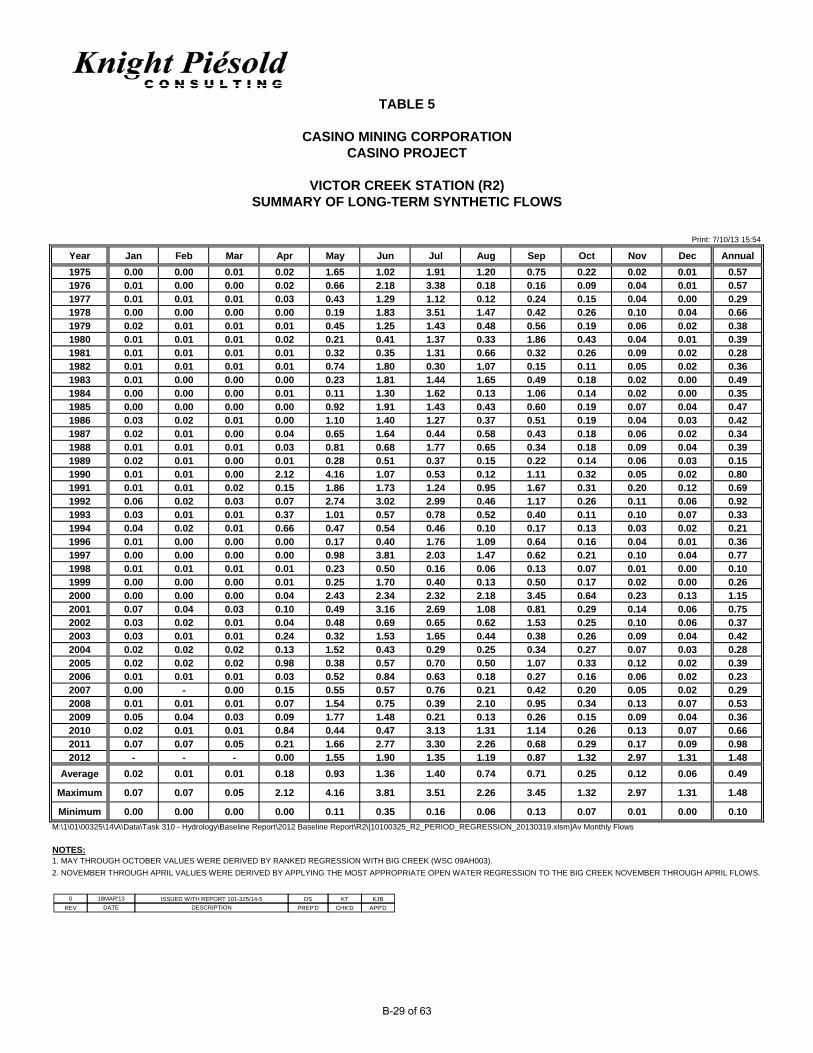
Year Jan Feb Mar Apr May Jun Jul Aug Sep Oct Nov Dec Annual
1975 0.00 0.00 0.01 0.02 1.65 1.02 1.91 1.20 0.75 0.22 0.02 0.01 0.571976 0.01 0.00 0.00 0.02 0.66 2.18 3.38 0.18 0.16 0.09 0.04 0.01 0.571977 0.01 0.01 0.01 0.03 0.43 1.29 1.12 0.12 0.24 0.15 0.04 0.00 0.291978 0.00 0.00 0.00 0.00 0.19 1.83 3.51 1.47 0.42 0.26 0.10 0.04 0.661979 0.02 0.01 0.01 0.01 0.45 1.25 1.43 0.48 0.56 0.19 0.06 0.02 0.381980 0.01 0.01 0.01 0.02 0.21 0.41 1.37 0.33 1.86 0.43 0.04 0.01 0.391981 0.01 0.01 0.01 0.01 0.32 0.35 1.31 0.66 0.32 0.26 0.09 0.02 0.281982 0.01 0.01 0.01 0.01 0.74 1.80 0.30 1.07 0.15 0.11 0.05 0.02 0.361983 0.01 0.00 0.00 0.00 0.23 1.81 1.44 1.65 0.49 0.18 0.02 0.00 0.491984 0.00 0.00 0.00 0.01 0.11 1.30 1.62 0.13 1.06 0.14 0.02 0.00 0.351985 0.00 0.00 0.00 0.00 0.92 1.91 1.43 0.43 0.60 0.19 0.07 0.04 0.471986 0.03 0.02 0.01 0.00 1.10 1.40 1.27 0.37 0.51 0.19 0.04 0.03 0.421987 0.02 0.01 0.00 0.04 0.65 1.64 0.44 0.58 0.43 0.18 0.06 0.02 0.341988 0.01 0.01 0.01 0.03 0.81 0.68 1.77 0.65 0.34 0.18 0.09 0.04 0.391989 0.02 0.01 0.00 0.01 0.28 0.51 0.37 0.15 0.22 0.14 0.06 0.03 0.151990 0.01 0.01 0.00 2.12 4.16 1.07 0.53 0.12 1.11 0.32 0.05 0.02 0.801991 0.01 0.01 0.02 0.15 1.86 1.73 1.24 0.95 1.67 0.31 0.20 0.12 0.691992 0.06 0.02 0.03 0.07 2.74 3.02 2.99 0.46 1.17 0.26 0.11 0.06 0.921993 0.03 0.01 0.01 0.37 1.01 0.57 0.78 0.52 0.40 0.11 0.10 0.07 0.331994 0.04 0.02 0.01 0.66 0.47 0.54 0.46 0.10 0.17 0.13 0.03 0.02 0.211996 0.01 0.00 0.00 0.00 0.17 0.40 1.76 1.09 0.64 0.16 0.04 0.01 0.361997 0.00 0.00 0.00 0.00 0.98 3.81 2.03 1.47 0.62 0.21 0.10 0.04 0.771998 0.01 0.01 0.01 0.01 0.23 0.50 0.16 0.06 0.13 0.07 0.01 0.00 0.101999 0.00 0.00 0.00 0.01 0.25 1.70 0.40 0.13 0.50 0.17 0.02 0.00 0.262000 0.00 0.00 0.00 0.04 2.43 2.34 2.32 2.18 3.45 0.64 0.23 0.13 1.152001 0.07 0.04 0.03 0.10 0.49 3.16 2.69 1.08 0.81 0.29 0.14 0.06 0.752002 0.03 0.02 0.01 0.04 0.48 0.69 0.65 0.62 1.53 0.25 0.10 0.06 0.372003 0.03 0.01 0.01 0.24 0.32 1.53 1.65 0.44 0.38 0.26 0.09 0.04 0.422004 0.02 0.02 0.02 0.13 1.52 0.43 0.29 0.25 0.34 0.27 0.07 0.03 0.282005 0.02 0.02 0.02 0.98 0.38 0.57 0.70 0.50 1.07 0.33 0.12 0.02 0.392006 0.01 0.01 0.01 0.03 0.52 0.84 0.63 0.18 0.27 0.16 0.06 0.02 0.232007 0.00 - 0.00 0.15 0.55 0.57 0.76 0.21 0.42 0.20 0.05 0.02 0.292008 0.01 0.01 0.01 0.07 1.54 0.75 0.39 2.10 0.95 0.34 0.13 0.07 0.532009 0.05 0.04 0.03 0.09 1.77 1.48 0.21 0.13 0.26 0.15 0.09 0.04 0.362010 0.02 0.01 0.01 0.84 0.44 0.47 3.13 1.31 1.14 0.26 0.13 0.07 0.662011 0.07 0.07 0.05 0.21 1.66 2.77 3.30 2.26 0.68 0.29 0.17 0.09 0.982012 - - - 0.00 1.55 1.90 1.35 1.19 0.87 1.32 2.97 1.31 1.48
Average 0.02 0.01 0.01 0.18 0.93 1.36 1.40 0.74 0.71 0.25 0.12 0.06 0.49
Maximum 0.07 0.07 0.05 2.12 4.16 3.81 3.51 2.26 3.45 1.32 2.97 1.31 1.48
Minimum 0.00 0.00 0.00 0.00 0.11 0.35 0.16 0.06 0.13 0.07 0.01 0.00 0.10
M:\1\01\00325\14\A\Data\Task 310 - Hydrology\Baseline Report\2012 Baseline Report\R2\[10100325_R2_PERIOD_REGRESSION_20130319.xlsm]Av Monthly Flows
NOTES:1. MAY THROUGH OCTOBER VALUES WERE DERIVED BY RANKED REGRESSION WITH BIG CREEK (WSC 09AH003).
2. NOVEMBER THROUGH APRIL VALUES WERE DERIVED BY APPLYING THE MOST APPROPRIATE OPEN WATER REGRESSION TO THE BIG CREEK NOVEMBER THROUGH APRIL FLOWS.
Print: 7/10/13 15:54
TABLE 5
CASINO MINING CORPORATIONCASINO PROJECT
VICTOR CREEK STATION (R2)SUMMARY OF LONG-TERM SYNTHETIC FLOWS
0 18MAR'13 DS KTISSUED WITH REPORT 101-325/14-5 KJB
DATE DESCRIPTION PREP'D CHK'D APP'DREV
B-29 of 63

M:\1\01\00325\14\A\Data\Task 310 - Hydrology\Baseline Report\2012 Baseline Report\R2\[10100325_R2_PERIOD_REGRESSION_20130319.xls]HYDROGRAPH Print 10/07/2013 5:45 PM
0
2
4
6
8
10
12
14
16
18
20
Jan 2010 May 2010 Sep 2010 Jan 2011 May 2011 Sep 2011 Jan 2012 May 2012 Sep 2012 Jan 2013
Dai
ly D
isch
arg
e (m
3 /s)
Measured Record
Synthetic Series
0 19MAR'13 ISSUED WITH REPORT VA101-325/14 DS KT KJB
DATE DESCRIPTION PREP'D CHK'D APP'DREV
VICTOR CREEK STATION (R2)MEASURED AND SYNTHETIC HYDROGRAPHS
FIGURE 5a
CASINO MINING CORPORATION
CASINO PROJECT
REV0
P/A NO. VA103-325/14
REF. NO.5
B-30 of 63

M:\1\01\00325\14\A\Data\Task 310 - Hydrology\Baseline Report\2012 Baseline Report\R2\[10100325_R2_PERIOD_REGRESSION_20130319.xls]May EFP Print 10/07/2013 5:45 PM
0
2
4
6
8
10
12
14
16
18
0 50 100 150 200 250
Daily D
isch
arge
, R2
(m3 /
s)
Daily Discharge, Big Creek (m3/s)
Ranked Discharge Points
Line of Equal Unit Runoff
Empirical Frequency Paired Relationship
0 19MAR'13 ISSUED WITH REPORT VA101-325/14 PN KT KJB
DATE DESCRIPTION PREP'D CHK'D APP'DREV
R2 AND BIG CREEKMAY RANKED REGRESSION RELATIONSHIP
FIGURE 5b
CASINO MINING CORPORATION
CASINO PROJECT
REV0
P/A NO. VA101-325/14 REF. NO.5
B-31 of 63

M:\1\01\00325\14\A\Data\Task 310 - Hydrology\Baseline Report\2012 Baseline Report\R2\[10100325_R2_PERIOD_REGRESSION_20130319.xls]Jun EFP Print 10/07/2013 5:45 PM
0
2
4
6
8
10
12
14
16
18
20
0 20 40 60 80 100 120 140 160
Daily D
isch
arge
, R2
(m3 /
s)
Daily Discharge, Big Creek (m3/s)
Ranked Discharge Points
Line of Equal Unit Runoff
Empirical Frequency Paired Relationship
0 19MAR'13 ISSUED WITH REPORT VA101-325/14 PN KT KJB
DATE DESCRIPTION PREP'D CHK'D APP'DREV
R2 AND BIG CREEKJUNE RANKED REGRESSION RELATIONSHIP
FIGURE 5c
CASINO MINING CORPORATION
CASINO PROJECT
REV0
P/A NO. VA101-325/14 REF. NO.5
B-32 of 63

M:\1\01\00325\14\A\Data\Task 310 - Hydrology\Baseline Report\2012 Baseline Report\R2\[10100325_R2_PERIOD_REGRESSION_20130319.xls]Jul EFP Print 10/07/2013 5:45 PM
0
2
4
6
8
10
12
14
16
18
0 50 100 150 200 250 300
Daily D
isch
arge
, R2
(m3 /
s)
Daily Discharge, Big Creek (m3/s)
Ranked Discharge Points
Line of Equal Unit Runoff
Empirical Frequency Paired Relationship
0 19MAR'13 ISSUED WITH REPORT VA101-325/14 PN KT KJBDATE DESCRIPTION PREP'D CHK'D APP'DREV
R2 AND BIG CREEKJULY RANKED REGRESSION RELATIONSHIP
FIGURE 5d
CASINO MINING CORPORATION
CASINO PROJECT
REV0
P/A NO. VA101-325/14 REF. NO.5
B-33 of 63

M:\1\01\00325\14\A\Data\Task 310 - Hydrology\Baseline Report\2012 Baseline Report\R2\[10100325_R2_PERIOD_REGRESSION_20130319.xls]Aug EFP Print 10/07/2013 5:45 PM
0
2
4
6
8
10
12
14
16
18
0 50 100 150 200 250 300
Daily D
isch
arge
, R2
(m3 /
s)
Daily Discharge, Big Creek (m3/s)
Ranked Discharge Points
Line of Equal Unit Runoff
Empirical Frequency Paired Relationship
0 19MAR'13 ISSUED WITH REPORT VA101-325/14 PN KT KJB
DATE DESCRIPTION PREP'D CHK'D APP'DREV
R2 AND BIG CREEKAUGUST RANKED REGRESSION RELATIONSHIP
FIGURE 5e
CASINO MINING CORPORATION
CASINO PROJECT
REV0
P/A NO. VA101-325/14 REF. NO.5
B-34 of 63

M:\1\01\00325\14\A\Data\Task 310 - Hydrology\Baseline Report\2012 Baseline Report\R2\[10100325_R2_PERIOD_REGRESSION_20130319.xls]Sep-oct EFP Print 10/07/2013 5:45 PM
0
2
4
6
8
10
12
14
0 20 40 60 80 100 120 140 160
Daily D
isch
arge
, R2
(m3 /
s)
Daily Discharge, Big Creek (m3/s)
Ranked Discharge Points
Line of Equal Unit Runoff
Empirical Frequency Paired Relationship
0 19MAR'13 ISSUED WITH REPORT VA101-325/14 PN KT KJBDATE DESCRIPTION PREP'D CHK'D APP'DREV
R2 AND BIG CREEK SEPTEMBER‐OCTOBER DAILY DISCHARGE RELATIONSHIP
FIGURE 5f
CASINO MINING CORPORATION
CASINO PROJECT
REV0
P/A NO. VA101-325/14 REF. NO.5
B-35 of 63

Year Jan Feb Mar Apr May Jun Jul Aug Sep Oct Nov Dec Annual
1975 0.01 0.01 0.02 0.07 1.71 0.58 1.36 1.12 0.86 0.38 0.06 0.03 0.521976 0.02 0.01 0.01 0.06 0.74 1.31 2.28 0.52 0.39 0.25 0.12 0.04 0.481977 0.03 0.03 0.02 0.08 0.48 0.78 0.94 0.40 0.44 0.36 0.11 0.01 0.311978 0.01 0.00 0.00 0.00 0.19 1.09 2.16 1.20 0.54 0.45 0.26 0.10 0.501979 0.05 0.02 0.02 0.03 0.51 0.75 1.11 0.72 0.68 0.39 0.17 0.05 0.381980 0.02 0.02 0.03 0.05 0.21 0.18 0.99 0.64 1.31 0.58 0.12 0.03 0.351981 0.03 0.03 0.03 0.03 0.35 0.17 1.07 0.81 0.49 0.46 0.24 0.07 0.311982 0.02 0.02 0.02 0.03 0.83 1.07 0.34 0.93 0.38 0.28 0.13 0.05 0.341983 0.02 0.01 0.01 0.01 0.26 1.06 1.07 1.30 0.62 0.38 0.07 0.00 0.401984 0.00 0.00 0.00 0.02 0.11 0.75 1.13 0.41 0.89 0.32 0.06 0.01 0.311985 0.00 0.00 0.01 0.01 1.00 1.13 1.14 0.70 0.71 0.40 0.20 0.12 0.451986 0.08 0.05 0.02 0.01 1.10 0.82 1.07 0.67 0.64 0.38 0.10 0.09 0.421987 0.06 0.03 0.01 0.11 0.81 0.97 0.48 0.72 0.55 0.38 0.16 0.07 0.361988 0.03 0.03 0.03 0.08 0.89 0.35 1.28 0.82 0.49 0.40 0.25 0.12 0.401989 0.06 0.03 0.01 0.03 0.30 0.25 0.45 0.44 0.43 0.34 0.17 0.08 0.221990 0.04 0.02 0.01 1.25 4.20 0.62 0.57 0.28 1.10 0.49 0.15 0.05 0.731991 0.03 0.04 0.06 0.23 2.02 1.06 1.06 0.95 1.22 0.48 0.41 0.32 0.661992 0.17 0.07 0.07 0.17 2.77 1.82 1.93 0.72 1.02 0.45 0.30 0.17 0.801993 0.07 0.04 0.03 0.40 1.15 0.30 0.83 0.75 0.54 0.29 0.29 0.20 0.411994 0.10 0.05 0.02 0.56 0.53 0.27 0.65 0.35 0.39 0.30 0.08 0.04 0.281996 0.03 0.01 0.00 0.00 0.17 0.21 1.29 1.04 0.76 0.32 0.11 0.02 0.331997 0.01 0.00 0.00 0.01 1.07 2.29 1.47 1.22 0.72 0.41 0.27 0.10 0.631998 0.03 0.02 0.02 0.03 0.23 0.25 0.20 0.14 0.35 0.18 0.03 0.01 0.121999 0.00 0.00 0.00 0.03 0.27 1.04 0.45 0.40 0.61 0.35 0.05 0.01 0.272000 0.01 0.00 0.00 0.07 2.53 1.35 1.56 1.51 1.97 0.76 0.44 0.35 0.882001 0.20 0.11 0.09 0.22 0.51 1.94 1.83 1.00 0.91 0.47 0.35 0.17 0.652002 0.08 0.04 0.03 0.11 0.55 0.37 0.57 0.82 1.02 0.45 0.29 0.15 0.372003 0.08 0.04 0.02 0.28 0.33 0.89 1.20 0.70 0.52 0.44 0.25 0.10 0.402004 0.06 0.06 0.07 0.24 1.62 0.21 0.36 0.57 0.50 0.45 0.19 0.10 0.372005 0.07 0.05 0.05 0.50 0.41 0.29 0.80 0.74 1.00 0.50 0.29 0.07 0.402006 0.03 0.03 0.03 0.10 0.60 0.49 0.65 0.50 0.46 0.36 0.18 0.04 0.292007 0.00 - 0.01 0.21 0.65 0.30 0.72 0.54 0.56 0.39 0.13 0.04 0.322008 0.02 0.02 0.02 0.13 1.67 0.40 0.54 1.67 1.00 0.50 0.34 0.20 0.542009 0.13 0.10 0.09 0.19 1.90 0.85 0.28 0.41 0.46 0.36 0.25 0.12 0.432010 0.06 0.04 0.04 0.59 0.49 0.24 2.03 1.13 1.01 0.45 0.35 0.21 0.552011 0.19 0.19 0.14 0.37 1.77 1.70 1.97 1.72 0.77 0.47 0.38 0.26 0.832012 - - - - 1.71 1.20 1.11 1.09 0.96 - - - -
Average 0.05 0.03 0.03 0.18 0.99 0.79 1.05 0.80 0.74 0.41 0.20 0.10 0.44
Maximum 0.20 0.19 0.14 1.25 4.20 2.29 2.28 1.72 1.97 0.76 0.44 0.35 0.88
Minimum 0.00 0.00 0.00 0.00 0.11 0.17 0.20 0.14 0.35 0.18 0.03 0.00 0.12
M:\1\01\00325\14\A\Data\Task 310 - Hydrology\Baseline Report\2012 Baseline Report\W4\[10100325_W4_PERIOD_REGRESSION_20130315.xlsm]Av Monthly Flows
NOTES:1. MAY THROUGH OCTOBER VALUES WERE DERIVED BY RANKED REGRESSION WITH BIG CREEK (WSC 09AH003).2. NOVEMBER THROUGH APRIL VALUES WERE DERIVED BY APPLYING THE MOST APPROPRIATE OPEN WATER REGRESSION TO THE BIG CREEK NOVEMBER THROUGH APRIL FLOWS.
Print: 7/10/13 16:23
TABLE 6
CASINO MINING CORPORATIONCASINO PROJECT
LOWER CASINO CREEK STATION (W4)SUMMARY OF LONG-TERM SYNTHETIC FLOWS
0 18MAR'13 DS KTISSUED WITH REPORT VA101-325/14-5 KJB
DATE DESCRIPTION PREP'D CHK'D APP'DREV
B-36 of 63

M:\1\01\00325\14\A\Data\Task 310 - Hydrology\Baseline Report\2012 Baseline Report\W4\[10100325_W4_PERIOD_REGRESSION_20130315.xls]HYDROGRAPH Print 10/07/2013 4:42 PM
0
2
4
6
8
10
12
14
16
18
May 2008 Nov 2008 May 2009 Nov 2009 May 2010 Nov 2010 May 2011 Nov 2011 May 2012 Nov 2012 May 2013
Dai
ly D
isch
arg
e (m
3 /s)
Measured Record
Synthetic Series
0 15MAR'13 ISSUED WITH REPORT VA101-325/14 DS KT KJB
DATE DESCRIPTION PREP'D CHK'D APP'DREV
LOWER CASINO CREEK STATION (W4)MEASURED AND SYNTHETIC HYDROGRAPHS
FIGURE 6a
CASINO MINING CORPORATION
CASINO PROJECT
REV0
P/A NO. VA103-325/14
REF. NO.5
B-37 of 63

M:\1\01\00325\14\A\Data\Task 310 - Hydrology\Baseline Report\2012 Baseline Report\W4\[10100325_W4_PERIOD_REGRESSION_20130315.xls]May EFP Print 10/07/2013 4:42 PM
0
2
4
6
8
10
12
14
16
18
0 50 100 150 200 250
Dai
ly D
isch
arg
e, W
4 (m
3 /s)
Daily Discharge, Big Creek (m3/s)
Ranked Discharge Points
Line of Equal Unit Runoff
Empirical Frequency Paired Relationship
0 15MAR'13 ISSUED WITH REPORT VA101-325/14 DS KT KJB
DATE DESCRIPTION PREP'D CHK'D APP'DREV
W4 AND BIG CREEKMAY RANKED REGRESSION RELATIONSHIP
FIGURE 6b
CASINO MINING CORPORATION
CASINO PROJECT
REV0
P/A NO. VA101-325/14 REF. NO.5
B-38 of 63

M:\1\01\00325\14\A\Data\Task 310 - Hydrology\Baseline Report\2012 Baseline Report\W4\[10100325_W4_PERIOD_REGRESSION_20130315.xls]Jun EFP Print 10/07/2013 4:42 PM
0
1
2
3
4
5
6
7
8
9
0 20 40 60 80 100 120 140 160
Dai
ly D
isch
arg
e, W
4 (m
3 /s)
Daily Discharge, Big Creek (m3/s)
Ranked Discharge Points
Line of Equal Unit Runoff
Empirical Frequency Paired Relationship
0 15MAR'13 ISSUED WITH REPORT VA101-325/14 DS KT KJB
DATE DESCRIPTION PREP'D CHK'D APP'DREV
W4 AND BIG CREEKJUNE RANKED REGRESSION RELATIONSHIP
FIGURE 6c
CASINO MINING CORPORATION
CASINO PROJECT
REV0
P/A NO. VA101-325/14 REF. NO.5
B-39 of 63

M:\1\01\00325\14\A\Data\Task 310 - Hydrology\Baseline Report\2012 Baseline Report\W4\[10100325_W4_PERIOD_REGRESSION_20130315.xls]Jul EFP Print 10/07/2013 4:42 PM
0
2
4
6
8
10
12
14
0 50 100 150 200 250 300
Dai
ly D
isch
arg
e, W
4 (m
3 /s)
Daily Discharge, Big Creek (m3/s)
Ranked Regression Points
Line of Equal Unit Runoff
Empirical Frequency Paired Relationship
0 15MAR'13 ISSUED WITH REPORT VA101-325/14 DS KT KJB
DATE DESCRIPTION PREP'D CHK'D APP'DREV
W4 AND BIG CREEKJULY RANKED REGRESSION RELATIONSHIP
FIGURE 6d
CASINO MINING CORPORATION
CASINO PROJECT
REV0
P/A NO. VA101-325/14 REF. NO.5
B-40 of 63

M:\1\01\00325\14\A\Data\Task 310 - Hydrology\Baseline Report\2012 Baseline Report\W4\[10100325_W4_PERIOD_REGRESSION_20130315.xls]Aug EFP Print 10/07/2013 4:42 PM
0
2
4
6
8
10
12
14
0 50 100 150 200 250 300
Dai
ly D
isch
arg
e, W
4 (m
3 /s)
Daily Discharge, Big Creek (m3/s)
Ranked Discharge Points
Line of Equal Unit Runoff
Empirical Frequency Paired Relationship
0 15MAR'13 ISSUED WITH REPORT VA101-325/14 DS KT KJB
DATE DESCRIPTION PREP'D CHK'D APP'DREV
W4 AND BIG CREEKAUGUST RANKED REGRESSION RELATIONSHIP
FIGURE 6e
CASINO MINING CORPORATION
CASINO PROJECT
REV0
P/A NO. VA101-325/14 REF. NO.5
B-41 of 63

M:\1\01\00325\14\A\Data\Task 310 - Hydrology\Baseline Report\2012 Baseline Report\W4\[10100325_W4_PERIOD_REGRESSION_20130315.xls]Sep-oct EFP Print 10/07/2013 4:42 PM
0
1
2
3
4
5
6
7
8
0 20 40 60 80 100 120 140 160
Dai
ly D
isch
arg
e, W
4 (m
3 /s)
Daily Discharge, Big Creek (m3/s)
Ranked Discharge Points
Line of Equal Unit Runoff
Empirical Frequency Paired Relationship
0 15MAR'13 ISSUED WITH REPORT VA101-325/14 DS KT KJB
DATE DESCRIPTION PREP'D CHK'D APP'DREV
W4 AND BIG CREEK SEPTEMBER AND OCTOBER RANKED REGRESSION RELATIONSHIP
FIGURE 6f
CASINO MINING CORPORATION
CASINO PROJECT
REV0
P/A NO. VA101-325/14 REF. NO.5
B-42 of 63

Year Jan Feb Mar Apr May Jun Jul Aug Sep Oct Nov Dec Annual
1975 0.01 0.01 0.02 0.05 1.41 0.53 1.09 0.90 0.76 0.37 0.05 0.02 0.441976 0.01 0.01 0.01 0.05 0.70 1.06 1.81 0.41 0.34 0.20 0.09 0.03 0.401977 0.03 0.02 0.02 0.06 0.45 0.69 0.76 0.36 0.46 0.32 0.08 0.01 0.271978 0.01 0.00 0.00 0.00 0.19 0.93 1.72 0.93 0.57 0.47 0.20 0.07 0.431979 0.04 0.01 0.01 0.02 0.49 0.67 0.89 0.57 0.65 0.38 0.12 0.04 0.331980 0.02 0.02 0.02 0.04 0.21 0.21 0.83 0.45 1.06 0.55 0.09 0.02 0.291981 0.02 0.02 0.02 0.03 0.33 0.20 0.87 0.63 0.55 0.49 0.19 0.05 0.281982 0.02 0.02 0.02 0.03 0.80 0.87 0.31 0.75 0.32 0.22 0.10 0.03 0.291983 0.01 0.01 0.01 0.01 0.24 0.89 0.86 1.06 0.61 0.38 0.05 0.00 0.351984 0.00 0.00 0.00 0.01 0.11 0.69 0.93 0.36 0.77 0.30 0.04 0.01 0.271985 0.00 0.00 0.01 0.01 0.94 0.94 0.93 0.54 0.67 0.39 0.16 0.09 0.391986 0.06 0.03 0.01 0.01 0.95 0.71 0.85 0.49 0.63 0.38 0.08 0.07 0.361987 0.05 0.02 0.01 0.08 0.76 0.83 0.43 0.59 0.57 0.36 0.12 0.05 0.321988 0.02 0.02 0.02 0.06 0.87 0.38 1.03 0.64 0.54 0.37 0.19 0.09 0.361989 0.05 0.02 0.01 0.02 0.29 0.29 0.39 0.38 0.47 0.29 0.13 0.06 0.201990 0.03 0.01 0.01 0.96 3.28 0.58 0.50 0.26 0.93 0.47 0.11 0.04 0.601991 0.02 0.03 0.04 0.20 1.87 0.90 0.86 0.74 1.00 0.52 0.42 0.25 0.581992 0.13 0.05 0.06 0.15 2.03 1.45 1.54 0.54 0.85 0.45 0.23 0.13 0.641993 0.06 0.03 0.02 0.34 1.09 0.33 0.66 0.57 0.55 0.24 0.22 0.15 0.361994 0.08 0.03 0.02 0.47 0.51 0.32 0.48 0.34 0.35 0.26 0.06 0.03 0.221996 0.02 0.00 0.00 0.00 0.17 0.23 1.03 0.84 0.70 0.32 0.08 0.02 0.291997 0.01 0.00 0.00 0.01 1.02 1.76 1.18 0.98 0.67 0.39 0.21 0.08 0.531998 0.02 0.01 0.01 0.03 0.23 0.29 0.20 0.13 0.27 0.14 0.03 0.00 0.121999 0.00 0.00 0.00 0.02 0.25 0.88 0.40 0.35 0.62 0.36 0.04 0.01 0.252000 0.00 0.00 0.00 0.06 2.04 1.08 1.23 1.21 1.48 0.71 0.46 0.28 0.722001 0.15 0.08 0.07 0.20 0.49 1.57 1.45 0.77 0.79 0.48 0.30 0.13 0.542002 0.06 0.03 0.03 0.08 0.52 0.36 0.51 0.64 0.86 0.48 0.22 0.12 0.332003 0.06 0.03 0.02 0.24 0.33 0.77 0.94 0.53 0.56 0.46 0.19 0.08 0.352004 0.04 0.04 0.05 0.21 1.48 0.24 0.34 0.46 0.55 0.46 0.14 0.07 0.342005 0.05 0.04 0.04 0.38 0.40 0.32 0.63 0.56 0.85 0.50 0.25 0.05 0.342006 0.02 0.02 0.02 0.07 0.57 0.43 0.54 0.41 0.51 0.33 0.13 0.03 0.262007 0.00 - 0.01 0.19 0.59 0.33 0.60 0.42 0.57 0.37 0.10 0.03 0.322008 0.02 0.01 0.02 0.12 1.54 0.41 0.45 1.34 0.86 0.52 0.28 0.15 0.482009 0.10 0.08 0.07 0.17 1.63 0.76 0.28 0.35 0.50 0.32 0.19 0.09 0.382010 0.05 0.03 0.03 0.47 0.47 0.27 1.61 0.90 0.86 0.44 0.28 0.16 0.472011 0.14 0.15 0.10 0.36 1.58 1.36 1.59 1.41 0.70 0.50 0.35 0.19 0.712012 - - - - 1.61 0.98 0.91 0.88 0.83 0.71 1.26 1.09 0.95
Average 0.04 0.03 0.02 0.14 0.88 0.69 0.86 0.65 0.67 0.40 0.18 0.09 0.39
Maximum 0.15 0.15 0.10 0.96 3.28 1.76 1.81 1.41 1.48 0.71 1.26 1.09 0.95
Minimum 0.00 0.00 0.00 0.00 0.11 0.20 0.20 0.13 0.27 0.14 0.03 0.00 0.12
M:\1\01\00325\14\A\Data\Task 310 - Hydrology\Baseline Report\2012 Baseline Report\H18\[10100325_H18_PERIOD_REGRESSION_20130516.xlsm]Av Monthly Flows
NOTES:1. MAY THROUGH OCTOBER VALUES WERE DERIVED BY RANKED REGRESSION WITH BIG CREEK (WSC 09AH003).
2. NOVEMBER THROUGH APRIL VALUES WERE DERIVED BY APPLYING THE MOST APPROPRIATE OPEN WATER REGRESSION TO THE BIG CREEK NOVEMBER THROUGH APRIL FLOWS
Print: 7/10/13 15:42
TABLE 7
CASINO MINING CORPORATIONCASINO PROJECT
MIDDLE CASINO CREEK STATION (H18)SUMMARY OF LONG-TERM SYNTHETIC FLOWS
0 18MAR'13 DS KTISSUED WITH REPORT VA101-325/14-5 KJB
DATE DESCRIPTION PREP'D CHK'D APP'DREV
B-43 of 63
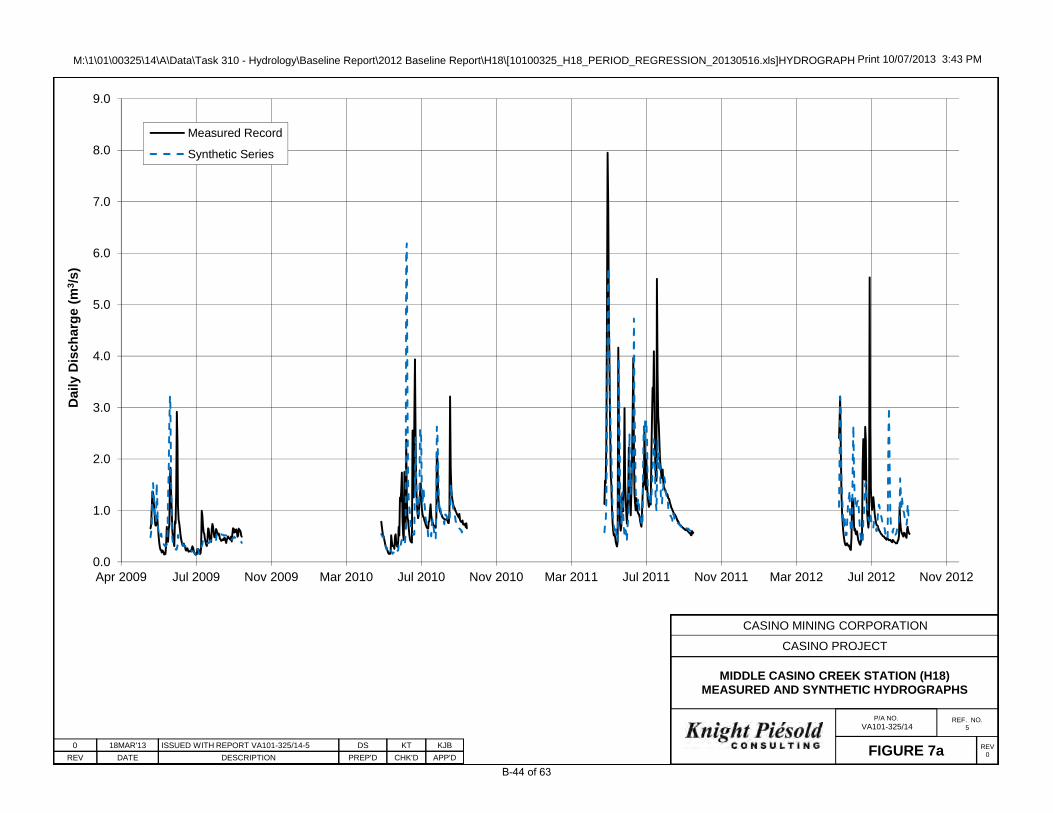
M:\1\01\00325\14\A\Data\Task 310 - Hydrology\Baseline Report\2012 Baseline Report\H18\[10100325_H18_PERIOD_REGRESSION_20130516.xls]HYDROGRAPH Print 10/07/2013 3:43 PM
0.0
1.0
2.0
3.0
4.0
5.0
6.0
7.0
8.0
9.0
Apr 2009 Jul 2009 Nov 2009 Mar 2010 Jul 2010 Nov 2010 Mar 2011 Jul 2011 Nov 2011 Mar 2012 Jul 2012 Nov 2012
Dai
ly D
isch
arg
e (m
3 /s)
Measured Record
Synthetic Series
0 18MAR'13 ISSUED WITH REPORT VA101-325/14-5 DS KT KJB
DATE DESCRIPTION PREP'D CHK'D APP'DREV
MIDDLE CASINO CREEK STATION (H18)MEASURED AND SYNTHETIC HYDROGRAPHS
FIGURE 7a
CASINO MINING CORPORATION
CASINO PROJECT
REV0
P/A NO.VA101-325/14
REF. NO.5
B-44 of 63

M:\1\01\00325\14\A\Data\Task 310 - Hydrology\Baseline Report\2012 Baseline Report\H18\[10100325_H18_PERIOD_REGRESSION_20130516.xls]May EFP Print 10/07/2013 3:43 PM
0
1
2
3
4
5
6
7
8
9
10
0 50 100 150 200 250
Daily D
isch
arge
, H18
(m3 /
s)
Daily Discharge, Big Creek (m3/s)
Ranked Discharge Points
Line of Equal Unit Runoff
Empirical Frequency Paired Relationship
0 18MAR'13 ISSUED WITH REPORT VA101-325/14-5 PN KT KJBDATE DESCRIPTION PREP'D CHK'D APP'DREV
H18 AND BIG CREEKMAY RANKED REGRESSION RELATIONSHIP
FIGURE 7b
CASINO MINING CORPORATION
CASINO PROJECT
REV0
P/A NO. VA101-325/14 REF. NO.5
B-45 of 63

M:\1\01\00325\14\A\Data\Task 310 - Hydrology\Baseline Report\2012 Baseline Report\H18\[10100325_H18_PERIOD_REGRESSION_20130516.xls]Jun EFP Print 10/07/2013 3:43 PM
0
1
2
3
4
5
6
7
0 20 40 60 80 100 120 140 160
Daily D
isch
arge
, H18
(m3 /
s)
Daily Discharge, Big Creek (m3/s)
Ranked Discharge Points
Line of Equal Unit Runoff
Empirical Frequency Paired Relationship
0 18MAR'13 ISSUED WITH REPORT VA101-325/14-5 PN KT KJBDATE DESCRIPTION PREP'D CHK'D APP'DREV
H18 AND BIG CREEKJUNE RANKED REGRESSION RELATIONSHIP
FIGURE 7c
CASINO MINING CORPORATION
CASINO PROJECT
REV0
P/A NO. VA101-325/14 REF. NO.5
B-46 of 63

M:\1\01\00325\14\A\Data\Task 310 - Hydrology\Baseline Report\2012 Baseline Report\H18\[10100325_H18_PERIOD_REGRESSION_20130516.xls]Jul EFP Print 10/07/2013 3:43 PM
0
2
4
6
8
10
12
0 50 100 150 200 250 300
Daily D
isch
arge
, H18
(m3 /
s)
Daily Discharge, Big Creek (m3/s)
Ranked Discharge Points
Line of Equal Unit Runoff
Empirical Frequency Paired Relationship
0 18MAR'13 ISSUED WITH REPORT VA101-325/14-5 PN KT KJBDATE DESCRIPTION PREP'D CHK'D APP'DREV
H18 AND BIG CREEKJULY RANKED REGRESSION RELATIONSHIP
FIGURE 7d
CASINO MINING CORPORATION
CASINO PROJECT
REV0
P/A NO. VA101-325/14 REF. NO.5
B-47 of 63

M:\1\01\00325\14\A\Data\Task 310 - Hydrology\Baseline Report\2012 Baseline Report\H18\[10100325_H18_PERIOD_REGRESSION_20130516.xls]Aug EFP Print 10/07/2013 3:43 PM
0
1
2
3
4
5
6
7
8
9
10
0 50 100 150 200 250 300
Daily D
isch
arge
, H18
(m3 /
s)
Daily Discharge, Big Creek (m3/s)
Ranked Discharge Points
Line of Equal Unit Runoff
Empirical Frequency Paired Relationship
0 18MAR'13 ISSUED WITH REPORT VA101-325/14-5 PN KT KJBDATE DESCRIPTION PREP'D CHK'D APP'DREV
H18 AND BIG CREEKAUGUST RANKED REGRESSION RELATIONSHIP
FIGURE 7e
CASINO MINING CORPORATION
CASINO PROJECT
REV0
P/A NO. VA101-325/14 REF. NO.5
B-48 of 63

M:\1\01\00325\14\A\Data\Task 310 - Hydrology\Baseline Report\2012 Baseline Report\H18\[10100325_H18_PERIOD_REGRESSION_20130516.xls]Sep-oct EFP Print 10/07/2013 3:43 PM
0
1
2
3
4
5
6
0 20 40 60 80 100 120 140 160
Daily D
isch
arge
, H18
(m3 /
s)
Daily Discharge, Big Creek (m3/s)
Ranked Discharge Points
Line of Equal Unit Runoff
Empirical Frequency Paired Relationship
0 18MAR'13 ISSUED WITH REPORT VA101-325/14-5 PN KT KJBDATE DESCRIPTION PREP'D CHK'D APP'DREV
H18 AND BIG CREEKSEPTEMBER - OCTOBER RANKED REGRESSION
RELATIONSHIP
FIGURE 7f
CASINO MINING CORPORATION
CASINO PROJECT
REV0
P/A NO. VA101-325/14 REF. NO.5
B-49 of 63

Year Jan Feb Mar Apr May Jun Jul Aug Sep Oct Nov Dec Annual
1975 0.00 0.01 0.01 0.03 0.80 0.30 0.68 0.50 0.38 0.20 0.03 0.01 0.251976 0.01 0.01 0.00 0.03 0.30 0.69 1.10 0.26 0.19 0.11 0.05 0.02 0.231977 0.02 0.01 0.01 0.03 0.18 0.38 0.49 0.22 0.24 0.18 0.05 0.01 0.151978 0.00 0.00 0.00 0.00 0.07 0.58 1.08 0.56 0.29 0.25 0.12 0.04 0.251979 0.02 0.01 0.01 0.01 0.20 0.40 0.58 0.31 0.33 0.20 0.07 0.02 0.181980 0.01 0.01 0.01 0.02 0.08 0.10 0.49 0.28 0.59 0.28 0.05 0.01 0.161981 0.01 0.01 0.01 0.02 0.13 0.10 0.55 0.38 0.28 0.25 0.11 0.03 0.161982 0.01 0.01 0.01 0.01 0.37 0.58 0.19 0.47 0.18 0.13 0.06 0.02 0.171983 0.01 0.00 0.00 0.00 0.10 0.55 0.54 0.59 0.31 0.20 0.03 0.00 0.201984 0.00 0.00 0.00 0.01 0.04 0.40 0.59 0.22 0.42 0.16 0.03 0.00 0.161985 0.00 0.00 0.00 0.01 0.45 0.59 0.61 0.30 0.33 0.21 0.09 0.05 0.221986 0.03 0.02 0.01 0.00 0.54 0.42 0.51 0.29 0.31 0.20 0.04 0.04 0.201987 0.03 0.01 0.01 0.05 0.35 0.49 0.26 0.35 0.29 0.19 0.07 0.03 0.181988 0.01 0.01 0.01 0.03 0.37 0.19 0.67 0.35 0.28 0.20 0.11 0.05 0.191989 0.03 0.01 0.01 0.01 0.11 0.14 0.23 0.23 0.24 0.16 0.08 0.03 0.111990 0.02 0.01 0.00 0.59 2.09 0.31 0.30 0.15 0.47 0.25 0.06 0.02 0.361991 0.01 0.02 0.02 0.11 0.96 0.54 0.56 0.42 0.54 0.27 0.22 0.14 0.321992 0.07 0.03 0.03 0.08 1.24 0.93 1.00 0.30 0.46 0.24 0.14 0.07 0.391993 0.03 0.02 0.01 0.19 0.48 0.16 0.39 0.32 0.28 0.13 0.13 0.09 0.191994 0.05 0.02 0.01 0.26 0.20 0.15 0.26 0.20 0.20 0.14 0.04 0.02 0.111996 0.01 0.00 0.00 0.00 0.06 0.11 0.65 0.45 0.35 0.17 0.05 0.01 0.161997 0.00 0.00 0.00 0.00 0.47 1.21 0.75 0.53 0.33 0.21 0.12 0.04 0.311998 0.01 0.01 0.01 0.02 0.09 0.14 0.13 0.09 0.16 0.08 0.01 0.00 0.061999 0.00 0.00 0.00 0.01 0.10 0.53 0.24 0.22 0.32 0.19 0.02 0.00 0.142000 0.00 0.00 0.00 0.03 1.22 0.69 0.77 0.77 0.90 0.36 0.24 0.16 0.432001 0.09 0.05 0.04 0.11 0.21 1.01 0.92 0.45 0.39 0.25 0.17 0.07 0.312002 0.03 0.02 0.02 0.05 0.22 0.21 0.32 0.36 0.48 0.25 0.13 0.07 0.182003 0.04 0.02 0.01 0.13 0.13 0.46 0.58 0.32 0.29 0.24 0.11 0.04 0.202004 0.02 0.03 0.03 0.12 0.75 0.12 0.20 0.28 0.28 0.24 0.08 0.04 0.182005 0.03 0.02 0.02 0.24 0.15 0.15 0.36 0.31 0.43 0.26 0.14 0.03 0.182006 0.01 0.01 0.01 0.04 0.26 0.26 0.32 0.26 0.26 0.18 0.08 0.02 0.142007 0.00 - 0.00 0.10 0.25 0.16 0.36 0.27 0.29 0.20 0.06 0.02 0.172008 0.01 0.01 0.01 0.06 0.78 0.22 0.25 0.84 0.44 0.27 0.16 0.09 0.262009 0.06 0.04 0.04 0.09 0.90 0.46 0.16 0.22 0.26 0.18 0.11 0.05 0.222010 0.03 0.02 0.02 0.27 0.18 0.13 1.05 0.51 0.45 0.23 0.16 0.09 0.262011 0.08 0.08 0.06 0.19 0.83 0.86 1.04 0.87 0.35 0.26 0.19 0.11 0.412012 - - - - 0.78 0.58 0.57 0.51 0.41 0.41 0.75 0.55 0.54
Average 0.02 0.02 0.01 0.08 0.45 0.41 0.54 0.38 0.35 0.21 0.10 0.05 0.22
Maximum 0.09 0.08 0.06 0.59 2.09 1.21 1.10 0.87 0.90 0.41 0.75 0.55 0.54
Minimum 0.00 0.00 0.00 0.00 0.04 0.10 0.13 0.09 0.16 0.08 0.01 0.00 0.06
M:\1\01\00325\14\A\Data\Task 310 - Hydrology\Baseline Report\2012 Baseline Report\W11\[10100325_W11_PERIOD_REGRESSION_20130326.xlsm]Av Monthly Flows
NOTES:1. MAY THROUGH OCTOBER VALUES WERE DERIVED BY RANKED REGRESSION WITH BIG CREEK (WSC 09AH003).2. NOVEMBER THROUGH APRIL VALUES WERE DERIVED BY APPLYING THE MOST APPROPRIATE OPEN WATER REGRESSION TO THE BIG CREEK NOVEMBER THROUGH APRIL FLOWS.
Print: 7/10/13 17:05
TABLE 8
CASINO MINING CORPORATIONCASINO PROJECT
UPPER CASINO CREEK STATION (W11)SUMMARY OF LONG-TERM SYNTHETIC FLOWS
0 18MAR'13 DS KTISSUED WITH REPORT VA101-325/14-5 KJB
DATE DESCRIPTION PREP'D CHK'D APP'DREV
B-50 of 63

M:\1\01\00325\14\A\Data\Task 310 - Hydrology\Baseline Report\2012 Baseline Report\W11\[10100325_W11_PERIOD_REGRESSION_20130326.xls]HYDROGRAPHPrint 10/07/2013 5:06 PM
0
1
2
3
4
5
6
7
03-Dec-08 03-Jun-09 03-Dec-09 03-Jun-10 03-Dec-10 03-Jun-11 03-Dec-11 02-Jun-12 02-Dec-12
Dai
ly D
isch
arg
e (m
3 /s)
Measured Record
Synthetic Series
0 18MAR'13 ISSUED WITH REPORT VA101-325/14-5 DS KT KJB
DATE DESCRIPTION PREP'D CHK'D APP'DREV
UPPER CASINO CREEK STATION (W11)MEASURED AND SYNTHETIC HYDROGRAPHS
FIGURE 8a
CASINO MINING CORPORATION
CASINO PROJECT
REV0
P/A NO. VA103-325/14
REF. NO.5
B-51 of 63

M:\1\01\00325\14\A\Data\Task 310 - Hydrology\Baseline Report\2012 Baseline Report\W11\[10100325_W11_PERIOD_REGRESSION_20130326.xls]May EFP Print 10/07/2013 5:06 PM
0
1
2
3
4
5
6
7
0 50 100 150 200 250
Daily D
isch
arge
, W11
(m3 /
s)
Daily Discharge, Big Creek (m3/s)
Ranked Discharge Points
Line of Equal Unit Runoff
Empirical Frequency Paired Relationship
0 18MAR'13 ISSUED WITH REPORT VA101-325/14-5 PN KT KJB
DATE DESCRIPTION PREP'D CHK'D APP'DREV
W11 AND BIG CREEKMAY RANKED REGRESSION RELATIONSHIP
FIGURE 8b
CASINO MINING CORPORATION
CASINO PROJECT
REV0
P/A NO. VA101-325/14 REF. NO.5
B-52 of 63
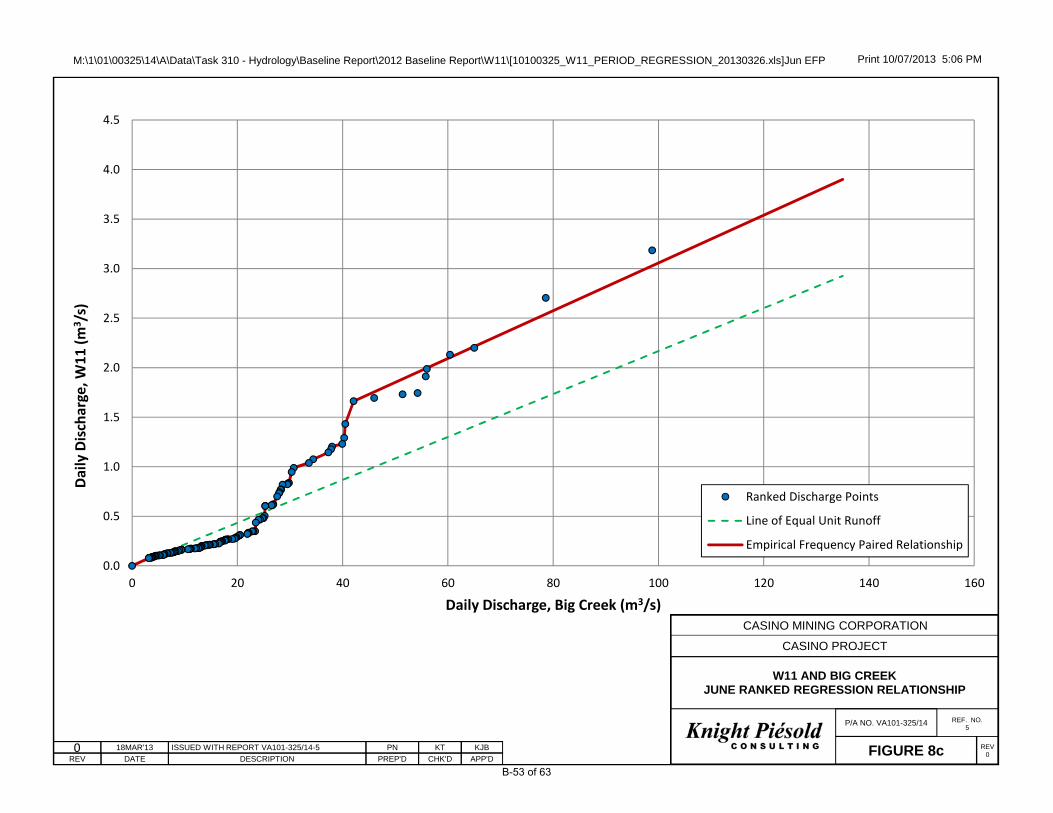
M:\1\01\00325\14\A\Data\Task 310 - Hydrology\Baseline Report\2012 Baseline Report\W11\[10100325_W11_PERIOD_REGRESSION_20130326.xls]Jun EFP Print 10/07/2013 5:06 PM
0.0
0.5
1.0
1.5
2.0
2.5
3.0
3.5
4.0
4.5
0 20 40 60 80 100 120 140 160
Daily D
isch
arge
, W11
(m3 /
s)
Daily Discharge, Big Creek (m3/s)
Ranked Discharge Points
Line of Equal Unit Runoff
Empirical Frequency Paired Relationship
0 18MAR'13 ISSUED WITH REPORT VA101-325/14-5 PN KT KJB
DATE DESCRIPTION PREP'D CHK'D APP'DREV
W11 AND BIG CREEKJUNE RANKED REGRESSION RELATIONSHIP
FIGURE 8c
CASINO MINING CORPORATION
CASINO PROJECT
REV0
P/A NO. VA101-325/14 REF. NO.5
B-53 of 63

M:\1\01\00325\14\A\Data\Task 310 - Hydrology\Baseline Report\2012 Baseline Report\W11\[10100325_W11_PERIOD_REGRESSION_20130326.xls]Jul EFP Print 10/07/2013 5:06 PM
0
1
2
3
4
5
6
7
0 50 100 150 200 250 300
Daily D
isch
arge
, W11
(m3 /
s)
Daily Discharge, Big Creek (m3/s)
Ranked Discharge Points
Line of Equal Unit Runoff
Empirical Frequency Paired Relationship
0 18MAR'13 ISSUED WITH REPORT VA101-325/14-5 PN KT KJB
DATE DESCRIPTION PREP'D CHK'D APP'DREV
W11 AND BIG CREEKJULY RANKED REGRESSION RELATIONSHIP
FIGURE 8d
CASINO MINING CORPORATION
CASINO PROJECT
REV0
P/A NO. VA101-325/14 REF. NO.5
B-54 of 63

M:\1\01\00325\14\A\Data\Task 310 - Hydrology\Baseline Report\2012 Baseline Report\W11\[10100325_W11_PERIOD_REGRESSION_20130326.xls]Aug EFP Print 10/07/2013 5:06 PM
0
1
2
3
4
5
6
7
0 50 100 150 200 250 300
Daily D
isch
arge
, W11
(m3 /
s)
Daily Discharge, Big Creek (m3/s)
Ranked Discharge Points
Line of Equal Unit Runoff
Empirical Frequency Paired Relationship
0 18MAR'13 ISSUED WITH REPORT VA101-325/14-5 PN KT KJB
DATE DESCRIPTION PREP'D CHK'D APP'DREV
W11 AND BIG CREEKAUGUST RANKED REGRESSION RELATIONSHIP
FIGURE 8e
CASINO MINING CORPORATION
CASINO PROJECT
REV0
P/A NO. VA101-325/14 REF. NO.5
B-55 of 63

M:\1\01\00325\14\A\Data\Task 310 - Hydrology\Baseline Report\2012 Baseline Report\W11\[10100325_W11_PERIOD_REGRESSION_20130326.xls]Sep-oct EFP Print 10/07/2013 5:06 PM
0.0
0.5
1.0
1.5
2.0
2.5
3.0
3.5
4.0
0 20 40 60 80 100 120 140 160
Daily D
isch
arge
, W11
(m3 /
s)
Daily Discharge, Big Creek (m3/s)
Ranked Discharge Points
Line of Equal Unit Runoff
Empirical Frequency Paired Relationship
0 18MAR'13 ISSUED WITH REPORT VA101-325/14-5 PN KT KJB
DATE DESCRIPTION PREP'D CHK'D APP'DREV
W11 AND BIG CREEK SEPTEMBER - OCTOBER RANKED REGRESSION RELATIONSHIP
FIGURE 8f
CASINO MINING CORPORATION
CASINO PROJECT
REV0
P/A NO. VA101-325/14 REF. NO.5
B-56 of 63

Year Jan Feb Mar Apr May Jun Jul Aug Sep Oct Nov Dec Annual
1975 0.00 0.00 0.01 0.02 0.59 0.23 0.40 0.36 0.28 0.12 0.02 0.01 0.171976 0.00 0.00 0.00 0.02 0.27 0.42 0.69 0.08 0.11 0.07 0.03 0.01 0.141977 0.01 0.01 0.01 0.02 0.15 0.29 0.27 0.05 0.14 0.10 0.03 0.00 0.091978 0.00 0.00 0.00 0.00 0.05 0.34 0.65 0.41 0.19 0.15 0.07 0.03 0.161979 0.01 0.00 0.00 0.01 0.16 0.28 0.33 0.17 0.23 0.12 0.04 0.01 0.121980 0.01 0.01 0.01 0.01 0.06 0.09 0.29 0.14 0.45 0.19 0.03 0.01 0.111981 0.01 0.01 0.01 0.01 0.11 0.09 0.31 0.21 0.16 0.15 0.06 0.02 0.101982 0.01 0.01 0.01 0.01 0.35 0.34 0.09 0.29 0.11 0.08 0.03 0.01 0.111983 0.00 0.00 0.00 0.00 0.09 0.35 0.31 0.46 0.21 0.11 0.02 0.00 0.131984 0.00 0.00 0.00 0.00 0.03 0.27 0.33 0.06 0.31 0.09 0.02 0.00 0.091985 0.00 0.00 0.00 0.00 0.43 0.38 0.34 0.16 0.23 0.12 0.05 0.03 0.151986 0.02 0.01 0.00 0.00 0.41 0.30 0.30 0.15 0.21 0.12 0.03 0.02 0.131987 0.02 0.01 0.00 0.03 0.33 0.31 0.13 0.18 0.19 0.11 0.04 0.02 0.111988 0.01 0.01 0.01 0.02 0.35 0.18 0.39 0.22 0.17 0.12 0.07 0.03 0.131989 0.02 0.01 0.00 0.01 0.08 0.13 0.12 0.06 0.13 0.10 0.05 0.02 0.061990 0.01 0.00 0.00 0.42 1.37 0.26 0.16 0.05 0.38 0.16 0.04 0.01 0.241991 0.01 0.01 0.01 0.07 0.84 0.36 0.31 0.29 0.42 0.16 0.13 0.09 0.231992 0.04 0.02 0.02 0.05 0.82 0.55 0.58 0.17 0.36 0.15 0.08 0.04 0.241993 0.02 0.01 0.01 0.13 0.49 0.16 0.23 0.19 0.18 0.08 0.08 0.05 0.141994 0.03 0.01 0.01 0.19 0.17 0.15 0.16 0.04 0.11 0.08 0.02 0.01 0.081996 0.01 0.00 0.00 0.00 0.05 0.10 0.38 0.32 0.26 0.10 0.03 0.01 0.101997 0.00 0.00 0.00 0.00 0.46 0.66 0.44 0.42 0.24 0.13 0.07 0.03 0.211998 0.01 0.01 0.00 0.01 0.06 0.14 0.06 0.03 0.09 0.05 0.01 0.00 0.041999 0.00 0.00 0.00 0.01 0.07 0.34 0.12 0.06 0.21 0.11 0.01 0.00 0.082000 0.00 0.00 0.00 0.02 0.86 0.45 0.46 0.56 0.70 0.26 0.14 0.10 0.302001 0.05 0.03 0.02 0.06 0.19 0.57 0.55 0.33 0.30 0.16 0.10 0.04 0.202002 0.02 0.01 0.01 0.03 0.19 0.16 0.17 0.21 0.36 0.14 0.08 0.04 0.122003 0.02 0.01 0.01 0.09 0.10 0.30 0.34 0.16 0.18 0.15 0.07 0.03 0.122004 0.01 0.02 0.02 0.07 0.64 0.11 0.10 0.10 0.17 0.14 0.05 0.02 0.122005 0.02 0.01 0.01 0.18 0.11 0.14 0.22 0.18 0.34 0.17 0.08 0.02 0.122006 0.01 0.01 0.01 0.03 0.24 0.18 0.18 0.08 0.15 0.11 0.05 0.01 0.092007 0.00 - 0.00 0.07 0.21 0.15 0.20 0.09 0.19 0.12 0.03 0.01 0.112008 0.01 0.00 0.01 0.04 0.67 0.19 0.14 0.58 0.34 0.16 0.10 0.05 0.192009 0.03 0.03 0.02 0.06 0.70 0.31 0.07 0.06 0.15 0.11 0.07 0.03 0.142010 0.02 0.01 0.01 0.20 0.14 0.13 0.61 0.38 0.35 0.14 0.10 0.05 0.182011 0.05 0.05 0.04 0.11 0.69 0.51 0.61 0.59 0.25 0.16 0.11 0.07 0.272012 - - - - 0.76 0.39 0.33 0.35 0.32 0.30 0.62 0.47 0.39
Average 0.01 0.01 0.01 0.06 0.36 0.28 0.31 0.23 0.25 0.13 0.06 0.03 0.15
Maximum 0.05 0.05 0.04 0.42 1.37 0.66 0.69 0.59 0.70 0.30 0.62 0.47 0.39
Minimum 0.00 0.00 0.00 0.00 0.03 0.09 0.06 0.03 0.09 0.05 0.01 0.00 0.04
M:\1\01\00325\14\A\Data\Task 310 - Hydrology\Baseline Report\2012 Baseline Report\W18\[10100325_W18_PERIOD_REGRESSION_20130516.xlsm]Av Monthly Flows
NOTES:1. MAY THROUGH OCTOBER VALUES WERE DERIVED BY RANKED REGRESSION WITH BIG CREEK (WSC 09AH003).2. NOVEMBER THROUGH APRIL VALUES WERE DERIVED BY APPLYING THE MOST APPROPRIATE OPEN WATER REGRESSION TO THE BIG CREEK NOVEMBER THROUGH APRIL FLOWS.
Print: 7/10/13 17:38
TABLE 9
CASINO MINING CORPORATIONCASINO PROJECT
BRYNELSEN CREEK STATION (W18)SUMMARY OF LONG-TERM SYNTHETIC FLOWS
0 18MAR'13 DS KTISSUED WITH REPORT VA101-325/14-5 KJB
DATE DESCRIPTION PREP'D CHK'D APP'DREV
B-57 of 63

M:\1\01\00325\14\A\Data\Task 310 - Hydrology\Baseline Report\2012 Baseline Report\W18\[10100325_W18_PERIOD_REGRESSION_20130516.xls]HYDROGRAPHPrint 10/07/2013 5:40 PM
0
1
1
2
2
3
3
4
4
5
May 2010 Aug 2010 Dec 2010 Apr 2011 Aug 2011 Dec 2011 Apr 2012 Aug 2012 Dec 2012
Dai
ly D
isch
arg
e (m
3 /s)
Measured Record
Synthetic Series
0 18MAR'13 ISSUED WITH REPORT VA101-325/14-5 DS KT KJBDATE DESCRIPTION PREP'D CHK'D APP'DREV
BRYNELSEN CREEK STATION (W18)MEASURED AND SYNTHETIC HYDROGRAPHS
FIGURE 9a
CASINO MINING CORPORATION
CASINO PROJECT
REV0
P/A NO. VA103-325/14
REF. NO.5
B-58 of 63

M:\1\01\00325\14\A\Data\Task 310 - Hydrology\Baseline Report\2012 Baseline Report\W18\[10100325_W18_PERIOD_REGRESSION_20130516.xls]May EFP Print 10/07/2013 5:40 PM
0.0
0.5
1.0
1.5
2.0
2.5
3.0
3.5
4.0
0 50 100 150 200 250
Daily D
isch
arge
, W18
(m3 /
s)
Daily Discharge, Big Creek (m3/s)
Ranked Discharge Points
Line of Equal Unit Runoff
Empirical Frequency Paired Relationship
0 18MAR'13 ISSUED WITH REPORT VA101-325/14-5 PN KT KJB
DATE DESCRIPTION PREP'D CHK'D APP'DREV
W18 AND BIG CREEKMAY RANKED REGRESSION RELATIONSHIP
FIGURE 9b
CASINO MINING CORPORATION
CASINO PROJECT
REV0
P/A NO. VA101-325/14 REF. NO.5
B-59 of 63

M:\1\01\00325\14\A\Data\Task 310 - Hydrology\Baseline Report\2012 Baseline Report\W18\[10100325_W18_PERIOD_REGRESSION_20130516.xls]Jun EFP Print 10/07/2013 5:40 PM
0.0
0.5
1.0
1.5
2.0
2.5
0 20 40 60 80 100 120 140 160
Daily D
isch
arge
, W18
(m3 /
s)
Daily Discharge, Big Creek (m3/s)
Ranked Discharge Points
Line of Equal Unit Runoff
Empirical Frequency Paired Relationship
0 18MAR'13 ISSUED WITH REPORT VA101-325/14-5 PN KT KJB
DATE DESCRIPTION PREP'D CHK'D APP'DREV
W18 AND BIG CREEKJUNE RANKED REGRESSION RELATIONSHIP
FIGURE 9c
CASINO MINING CORPORATION
CASINO PROJECT
REV0
P/A NO. VA101-325/14 REF. NO.5
B-60 of 63

M:\1\01\00325\14\A\Data\Task 310 - Hydrology\Baseline Report\2012 Baseline Report\W18\[10100325_W18_PERIOD_REGRESSION_20130516.xls]Jul EFP Print 10/07/2013 5:40 PM
0.0
0.5
1.0
1.5
2.0
2.5
3.0
3.5
4.0
0 50 100 150 200 250 300
Daily D
isch
arge
, W18
(m3 /
s)
Daily Discharge, Big Creek (m3/s)
Ranked Discharge Points
Line of Equal Unit Runoff
Empirical Frequency Paired Relationship
0 18MAR'13 ISSUED WITH REPORT VA101-325/14-5 PN KT KJB
DATE DESCRIPTION PREP'D CHK'D APP'DREV
W18 AND BIG CREEKJULY RANKED REGRESSION RELATIONSHIP
FIGURE 9d
CASINO MINING CORPORATION
CASINO PROJECT
REV0
P/A NO. VA101-325/14 REF. NO.5
B-61 of 63

M:\1\01\00325\14\A\Data\Task 310 - Hydrology\Baseline Report\2012 Baseline Report\W18\[10100325_W18_PERIOD_REGRESSION_20130516.xls]Aug EFP Print 10/07/2013 5:40 PM
0.0
0.5
1.0
1.5
2.0
2.5
3.0
3.5
4.0
4.5
5.0
0 50 100 150 200 250 300
Daily D
isch
arge
, W18
(m3 /
s)
Daily Discharge, Big Creek (m3/s)
Ranked Discharge Points
Line of Equal Unit Runoff
Empirical Frequency Paired Relationship
0 18MAR'13 ISSUED WITH REPORT VA101-325/14-5 PN KT KJBDATE DESCRIPTION PREP'D CHK'D APP'DREV
W18 AND BIG CREEKAUGUST RANKED REGRESSION RELATIONSHIP
FIGURE 9e
CASINO MINING CORPORATION
CASINO PROJECT
REV0
P/A NO. VA101-325/14 REF. NO.5
B-62 of 63

M:\1\01\00325\14\A\Data\Task 310 - Hydrology\Baseline Report\2012 Baseline Report\W18\[10100325_W18_PERIOD_REGRESSION_20130516.xls]Sep-oct EFP Print 10/07/2013 5:40 PM
0.0
0.5
1.0
1.5
2.0
2.5
3.0
0 20 40 60 80 100 120 140 160
Daily D
isch
arge
, W18
(m3 /
s)
Daily Discharge, Big Creek (m3/s)
Ranked Discharge Points
Line of Equal Unit Runoff
Empirical Frequency Paired Relationship
0 18MAR'13 ISSUED WITH REPORT VA101-325/14-5 PN KT KJB
DATE DESCRIPTION PREP'D CHK'D APP'DREV
W18 AND BIG CREEK SEPTEMBER - OCTOBER RANKED REGRESSION RELATIONSHIP
FIGURE 9f
CASINO MINING CORPORATION
CASINO PROJECT
REV0
P/A NO. VA101-325/14 REF. NO.5
B-63 of 63


![Hydrographs[Date] Today I will: - Be able to construct and understand flood hydrographs](https://img.dokumen.tips/doc/110x75/56813b43550346895da41aa0/hydrographsdate-today-i-will-be-able-to-construct-and-understand-flood.jpg)