Embed Size (px)
Citation preview

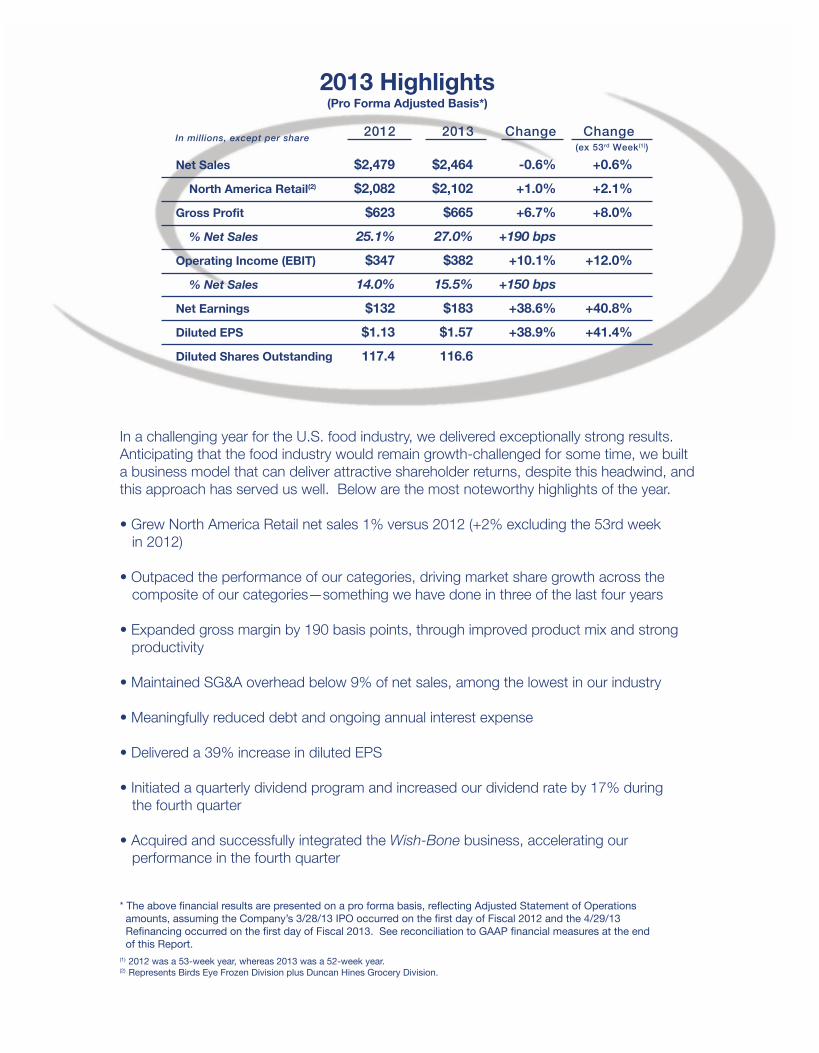
* The above financial results are presented on a pro forma basis, reflecting Adjusted Statement of Operations amounts, assuming the Company’s 3/28/13 IPO occurred on the first day of Fiscal 2012 and the 4/29/13 Refinancing occurred on the first day of Fiscal 2013. See reconciliation to GAAP financial measures at the end of this Report.(1) 2012 was a 53-week year, whereas 2013 was a 52-week year.(2) Represents Birds Eye Frozen Division plus Duncan Hines Grocery Division.
In a challenging year for the U.S. food industry, we delivered exceptionally strong results. Anticipating that the food industry would remain growth-challenged for some time, we built a business model that can deliver attractive shareholder returns, despite this headwind, and this approach has served us well. Below are the most noteworthy highlights of the year.
composite of our categories—something we have done in three of the last four years
productivity
Wish-Bone business, accelerating our
Net Sales
North America Retail(2)
Gross Profit
% Net Sales
Operating Income (EBIT)
% Net Sales
Net Earnings
Diluted EPS
Diluted Shares Outstanding
2013 Highlights
+0.6%
+2.1%
+8.0%
+12.0%
+40.8%
+41.4%
-0.6%
+1.0%
+6.7%
+190 bps
+10.1%
+150 bps
+38.6%
+38.9%
Change Change (ex 53rd Week(1))
$2,479
$2,082
$623
25.1%
$347
14.0%
$132
$1.13
117.4
2012
$2,464
$2,102
$665
27.0%
$382
15.5%
$183
$1.57
116.6
2013
(Pro Forma Adjusted Basis*)
In millions, except per share
EXECUTIVE MANAGEMENT TEAM
Tony Fernandez, Mark Schiller, Mary Beth DeNooyer, Craig Steeneck, Bob Gamgort, Chris Slager, Kelley Maggs and Chris Boever
Antonio F. FernandezExecutive Vice President and Chief Supply Chain Officer
M. Kelley MaggsExecutive Vice President, Secretary and General Counsel
Mark L. SchillerExecutive Vice President and Division President Birds Eye Frozen Division
Christopher SlagerExecutive Vice President and Division President Duncan Hines Grocery Division
Craig D. SteeneckExecutive Vice President and Chief Financial Officer
Robert J. GamgortChief Executive Officer
Christopher J. BoeverExecutive Vice President and Chief Customer Officer
Mary Beth DeNooyerExecutive Vice President and Chief Human Resources Officer
87886_InsideCover.indd 187886_InsideCover.indd 1 5/1/14 3:12 PM5/1/14 3:12 PM

Attractive Value Creation Potential
Net Sales
Operating Income
EPS
Dividend Yield
Outpaced Categories
2013Actual Results
39%
3%
10%
42%
In Linewith Categories
Long -TermGrowth Targets
3 - 4%
10 - 12%
4 - 5%
7 - 8%
Note: Excludes items affecting comparability. See reconciliation to GAAP financial measures at the end of this Report.
Future Accretive Acquisitions Would Accelerate Growth
1
By virtually any measure, our Company had a strong year in 2013—our first year as a public company. We successfully navigated the challenging food industry environment, delivering business and financial results that exceeded our long-term targets. We also continued to strengthen our business model, which is focused on creating value by Reinvigorating Iconic Brands.
“While our mission is simple to explain, it requires discipline and rigor to deliver.”
While our mission is simple to explain, it requires discipline and rigor to deliver. We create value by Reinvigorating Iconic Brands. We take brands that other companies have determined are no longer a strategic fit with their future direction and, through investment in consumer marketing, innovation and renovation, make them contemporary and relevant again. We generate investments for brand building by running an efficient organization that doesn't "tax" our brands with overhead costs and by reducing waste and eliminating non-value-added activities from the supply chain.
HOW WE CREATE VALUE
DEAR SHAREHOLDERS
Bob GamgortChief Executive Officer
87886_Text.indd 187886_Text.indd 1 5/1/14 3:09 PM5/1/14 3:09 PM

LEADERSHIPBRANDS
FOUNDATIONBRANDS
We know that individual brands respond differently to marketing and promotion investment. Our portfolio management strategy recognizes this and, therefore, segments our brands into Leadership and Foundation categories. Leadership Brands are higher growth and higher margin and they are more responsive to marketing and innovation. Foundation Brands are managed for long-term stability and cash flow. As such, we invest differentially, with the majority of our spending focused on advertising and innovation for our Leadership Brands. Spending for our Foundation Brands, on the other hand, is focused on renovation and in-market execution.
In addition to being a driver of growth, we’ve targeted all of our innovation to be margin accretive. By enhancing the convenience, nutritional profile and taste experience consumers receive from our brands, we are redefining the concept of value as meaning more than just the lowest price.
PORTFOLIO MANAGEMENT STRATEGY
Key to Reinvigorating Iconic Brands is understanding the evolving needs and expectations of our consumers and translating them into new innovative products. Recent examples of new products that tap into consumer trends include our Duncan Hines Decadent baking mixes, Vlasic Farmer’s Garden pickles and Birds Eye Recipe Ready vegetables.
INNOVATION AND RENOVATION
2
Over the past few years, we've increased the renewal rate of our portfolio, which measures sales in the current year from products introduced in the previous three years.
“...we'vetargeted all ofour innovation to be margin accretive.”
87886_Text.indd 287886_Text.indd 2 5/1/14 3:09 PM5/1/14 3:09 PM

Total Productivity Savings% of Cost of Products Sold
3.5%2010
3.5%2011
4.0%2012
4.1%2013
A significant focus of our organization is productivity generation, which is primarily targeted to offset the impact of inflation. Over the past five years, we have generated substantial savings through a holistic program we call Maximizing Value through Productivity, or MVP. In 2013, our MVP savings totaled approximately 4% of cost of products sold, which places us among the leaders in our industry. We target productivity savings in the 3% to 4% range annually and believe MVP enables us to deliver solid earnings growth in what, at times, can be a challenging top-line environment.
PRODUCTIVITY & ORGANIZATIONAL EFFICIENCY
“...we consistently maintain our overheadas a percentage of net sales
below 9%, placing us among the most efficient players in our industry.”
In addition, we consistently maintain our overhead as a percentage of net sales below 9%, placing us among the most efficient players in our industry. For us, maintaining a lean structure is not only a cost benefit, but also a more effective way of operating. We pride ourselves on being closer to our consumers and our retail partners. To enable our success, we hire experienced leaders with the insights and judgment necessary to be successful in a fast-paced, highly-empowered environment.
3
“A significant focus of our organization
is productivity generation...”
87886_Text.indd 387886_Text.indd 3 5/1/14 3:09 PM5/1/14 3:09 PM

Unleveraged Free Cash Flow(1)
$395m
2010
$380m
2013 PF(2)
$324m
2011
$325m
2013
$345m
2012(1) See reconciliation to GAAP financial measures at the end of this Report.(2) Includes full run-rate Wish-Bone Unleveraged FCF before one-time CAPEX.
74%71%81%
72%
88%AdjustedEBITDA
Conversion(1)
4
Among the most distinguishing characteristics of Pinnacle is our exceptionally strong free cash flow. We maintain one of the highest free cash flow conversion rates in our industry, due to disciplined capital spending, tight management of working capital and significant tax assets. This strong cash flow enables us to return value to our shareholders in the form of attractive dividends, in addition to
reducing debt and reinvesting in the business. Over the past five years, our free cash flow conversion has averaged approximately 80% of Adjusted EBITDA, placing us among the leaders in our industry.
We believe our business model for creating value in today’s growth-challenged food industry is both realistic and prudent, and it puts many of the factors for delivering attractive returns to you within our control.
INDUSTRY-LEADING FREE CASH FLOW
“Among the most distinguishing characteristics
of Pinnacle is ourexceptionally strong free cash flow.”
While we are committed to delivering long-term organic growth, we believe that we can accelerate value creation by adding new brands to our portfolio. We utilize a disciplined process to identify opportunities that align with our mission of Reinvigorating Iconic Brands. We target brands in existing or adjacent categories in North America where we can leverage our infrastructure and management expertise. We seek businesses with leadership positions or those in which we have line of sight to drive to leadership by utilizing our business model. We prioritize opportunities with significant synergy potential, and we pride ourselves on our demonstrated ability to realize those synergies through our effective integration process.
A perfect fit against all of these criteria is Wish-Bone salad dressings. We acquired Wish-Bone on October 1, 2013 and fully integrated the business by year-end. Start-up of our new, high-speed manufacturing lines is targeted for the first quarter of 2015.
ACQUISITIONS
87886_Text.indd 487886_Text.indd 4 5/1/14 3:09 PM5/1/14 3:09 PM

5
Our entire team is encouraged to think and act like owners. Our culture is built on the tenets of Trust, Candor and Ownership—three key values that set the tone for open and constructive collaboration that minimizes bureaucracy, increases speed and enhances decision-making. We view our people and our culture as critical enablers to our success, and we have created an operating environment that emphasizes egalitarianism, minimizes management layers and encourages everyone to operate at full potential. I am proud of the culture we have built, and I am grateful to all of our employees for their tireless dedication and hard work on behalf of the Company.
ENGAGED TEAM OPERATING IN A UNIQUE CULTURE
OUTLOOK FOR THE FUTURE
While pleased with our performance last year, we're squarely focused on the future. We understand that creating shareholder value is a long-term journey, not a one-year trip, and we recognize the challenges we face in the difficult food industry environment. While hopeful for an industry turnaround, we've created a unique business model that can deliver value today by focusing on the factors within our control. We value the trust you have placed in us and are mindful of your interests, as we take the necessary steps to position our Company for continued success.
Sincerely,
Robert J. GamgortChief Executive OfficerApril 30, 2014
87886_Text.indd 587886_Text.indd 5 5/1/14 3:09 PM5/1/14 3:09 PM

CHAIRMAN’S MESSAGE
6
As you know, this past year was quite eventful for Pinnacle, the highlight of which was the successful completion of the Company’s initial public offering. Beyond the IPO and additional capital structure enhancements made during the year, the Company also executed well to deliver business and financial results that significantly exceeded its long-term targets. All of this was accomplished in an industry environment that proved to be challenging.
As Bob outlined in his report to you, the Company is executing a business model designed to create value in both good industry environments and more difficult
ones, by Reinvigorating Iconic Brands. The newest iconic brand addition to the Pinnacle family is Wish-Bone, acquired in the fourth quarter of 2013. This acquisition accelerated the Company’s results in 2013 and is expected to do so again in 2014.
On behalf of the Board, I want to congratulate Bob and the entire Pinnacle team on the Company’s strong performance in 2013. We are confident that Pinnacle has the brands, the leadership, the business model and the organizational talent to continue to create value for you in the years ahead.
Finally, the Board was pleased to welcome Jane Nielsen, Executive Vice President and Chief Financial Officer of Coach, Inc., to the Pinnacle Foods Board of Directors in March 2014. I am thankful to all of the members of our Board for their dedicated service on behalf of our shareholders.
Sincerely,
Roger K. Deromedi Chairman of the BoardApril 30, 2014
87886_Text.indd 687886_Text.indd 6 5/1/14 3:09 PM5/1/14 3:09 PM

7
BOARD OF DIRECTORS
Jason GiordanoManaging DirectorThe Blackstone Group
Prakash A. MelwaniSenior Managing Directorand Chief Investment Officer The Blackstone Group
Jane Nielsen*Executive Vice President and Chief Financial Officer Coach, Inc.
Roger K. Deromedi Chairman of the BoardFormer Chief Executive OfficerKraft Foods Inc.
Ann FandozziPresident and CEOvRide
Robert J. GamgortChief Executive Officer Pinnacle Foods Inc.
Jeff OverlyOperating Partner The Blackstone Group
Raymond P. SilcockExecutive Vice Presidentand Chief Financial OfficerDiamond Foods, Inc.
*Appointed to Board of Directors on March 10, 2014.
March 28, 2013
87886_Text.indd 787886_Text.indd 7 5/1/14 3:09 PM5/1/14 3:09 PM

2012 2013 2012 2013
$1,091 $1,097
Birds Eye Frozen(1) - $mNet Sales EBIT
$208$190
BIRDS EYE FROZEN DIVISION
The Birds Eye Frozen Division is anchored by the Birds Eye brand. Taken together with our Birds Eye Voila! skillet meals business, Birds Eye represents almost two-thirds of
our Frozen Division sales. It is a $1 billion brand at retail poised to capitalize on growing health and wellness needs in the United States.
In 2012, we joined the Partnership for a Healthier America, an initiative chaired by the First Lady to make the healthy choice the
easy choice for kids and families. We also pioneered advertising vegetables directly to kids in a fun and engaging way. This year, we are launching our Step Up to the Plate with Birds Eye campaign. We believe we have significant opportunity ahead of us in making Birds Eye a more important part of increasing vegetable consumption in the U.S. with both children and adults.
(1) Net sales and EBIT metrics exclude impact of 53rd week in 2012 and are adjusted for items affecting comparability. See reconciliation to GAAP financial measures at the end of this Report.
2013 Net Sales
Our Birds Eye Frozen Division had a good year in 2013, registering modest sales growth and high single-digit EBIT growth on the strength of Leadership Brand performance.(1) We gained overall market share for the 4th consecutive year, as our retail dollar consumption outpaced the composite performance of our categories.
8
87886_Text.indd 887886_Text.indd 8 5/1/14 3:09 PM5/1/14 3:09 PM

Birds Eye Voila!$ Market Share
21.1%
2011
23.7%
2012
28.0%
20132010
17.2%
2009
15.7%
Source: IRI Multi-Outlet data; IRI Custom Pinnacle database
Tapping into the need for convenience and value, in 2013 we launched Birds Eye Recipe Ready, a line of pre-chopped and blended vegetables designed to enable faster preparation of the top main meal dishes served in America. When combined with a protein and a few simple ingredients, Birds Eye Recipe Ready makes a family meal in less than 30 minutes with no waste. We continue to tap into evolving consumer and demographic trends and have introduced on-trend varieties of Birds Eye Steamfresh vegetables, Birds Eye Steamfresh Chef’s Favorites restaurant-quality side dishes and Birds Eye Voila! skillet meals. Birds Eye Voila! is the leading brand in the multi-serve skillet meals category and has registered significant sales and market share growth since 2009, due to its great taste, convenience and value.
These are just a few of the exciting initiatives we have underway to continue to provide our consumers with high-quality, convenient products that are a great value to them and margin accretive to us.
Other brands in our portfolio operate in attractive segments within frozen, and we continue to invest in our portfolio to address evolving consumerneeds. We transitioned our Mrs. Paul’s and Van de Kamp’s seafood offerings to be made from whole fish fillets, and we launched Hungry-Man Selects, a new premium offering in the single-serve meals category. In 2014, we are introducing resealable packaging for Aunt Jemima frozen pancakes and waffles—the first packaging of its kind in the category.
9
87886_Text.indd 987886_Text.indd 9 5/1/14 3:09 PM5/1/14 3:09 PM
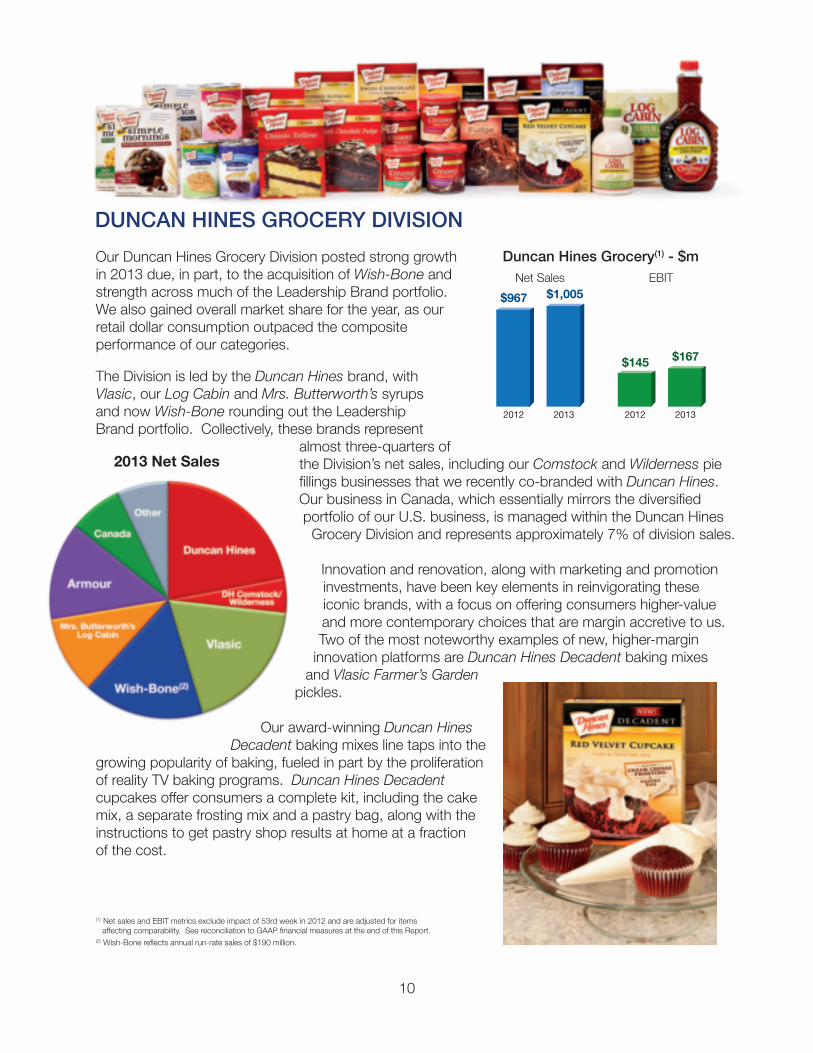
2012 2013 2012 2013
$967 $1,005
Duncan Hines Grocery(1) - $mNet Sales EBIT
$167$145
Our Duncan Hines Grocery Division posted strong growth in 2013 due, in part, to the acquisition of Wish-Bone and strength across much of the Leadership Brand portfolio. We also gained overall market share for the year, as our retail dollar consumption outpaced the composite performance of our categories.
DUNCAN HINES GROCERY DIVISION
The Division is led by the Duncan Hines brand, with Vlasic, our Log Cabin and Mrs. Butterworth’s syrups and now Wish-Bone rounding out the Leadership Brand portfolio. Collectively, these brands represent
almost three-quarters of the Division’s net sales, including our Comstock and Wilderness pie fillings businesses that we recently co-branded with Duncan Hines. Our business in Canada, which essentially mirrors the diversified portfolio of our U.S. business, is managed within the Duncan Hines
Grocery Division and represents approximately 7% of division sales.
Innovation and renovation, along with marketing and promotion investments, have been key elements in reinvigorating these iconic brands, with a focus on offering consumers higher-value and more contemporary choices that are margin accretive to us. Two of the most noteworthy examples of new, higher-margin
innovation platforms are Duncan Hines Decadent baking mixes and Vlasic Farmer’s Garden
pickles.
Our award-winning Duncan Hines Decadent baking mixes line taps into the
growing popularity of baking, fueled in part by the proliferation of reality TV baking programs. Duncan Hines Decadent cupcakes offer consumers a complete kit, including the cake mix, a separate frosting mix and a pastry bag, along with the instructions to get pastry shop results at home at a fraction of the cost.
(1) Net sales and EBIT metrics exclude impact of 53rd week in 2012 and are adjusted for items affecting comparability. See reconciliation to GAAP financial measures at the end of this Report.(2) Wish-Bone reflects annual run-rate sales of $190 million.
2013 Net Sales
10
87886_Text.indd 1087886_Text.indd 10 5/1/14 3:09 PM5/1/14 3:09 PM

Duncan Hines Decadent Cake Mix$ Market Share
3.6%
2011
3.7%
2012
4.4%
2013
Source: IRI Multi-Outlet cake mix data; IRI Custom Pinnacle database
2010
2.4%
In the fourth quarter of 2013, we acquired the iconic Wish-Bone brand, adding a new, higher-margin Leadership Brand to the Duncan Hines Grocery Division family. Wish-Bone is the #3 brand in the $2 billion salad dressings category and the #1 brand in the large Italian segment. Wish-Bone enhances our ability to offer consumers meal solutions and recipe ideas across our broad portfolio. It fits perfectly with our mission of Reinvigorating Iconic Brands, and we are excited about the plans we are developing to unlock Wish-Bone’s potential.
Vlasic Farmer’s Garden pickles, another award-winning innovation, taps into the healthy ingredient trend and growing consumer desire for real, simple ingredients. Sold in Mason jars, Vlasic Farmer’s Garden is an artisan-quality pickle that you would expect to find in a farmer’s market. It is made with simple, natural ingredients and, while higher-priced than our core Vlasic pickles, is still priced significantly below similar products sold at farmer’s markets or specialty stores.
Market share for Duncan Hines Decadent continues to advance, and we continue to expand the line with new, on-trend cake, cupcake and brownie varieties. We recently stepped up our investment behind the Duncan Hines business, acquiring the primary manufacturing operation in Centralia, Illinois, from our co-packer. This acquisition will enhance our innovation capabilities and enable future productivity improvements for Duncan Hines.
11
87886_Text.indd 1187886_Text.indd 11 5/1/14 3:09 PM5/1/14 3:09 PM

2012 2013 2013
$392$362
Net Sales EBIT
$31
2012
$31
Specialty Foods(1) - $m
Our Specialty Foods Division is comprised of a small and growing regional snacks business, as well as private label and foodservice businesses that we have been selectively pruning over the past two years to focus on higher-margin branded businesses.
In 2013, Specialty Foods net sales were down approximately 8%, reflecting this pruning, while EBIT was even with 2012 and EBIT margin advanced 70 basis points.(1) The growth in EBIT margin reflects the low-margin characteristics of the exited businesses and the productivity savings we generated through supply chain consolidation.
Looking ahead, our remaining foodservice and private label businesses are largely limited to a few strategic relationships that we have maintained over the years, while our snacks business will continue to be managed for regional distribution expansion and margin enhancement.
SPECIALTY FOODS DIVISION
12
(1) Net sales and EBIT metrics exclude impact of 53rd week in 2012 and are adjusted for items affecting comparability. See reconciliation to GAAP financial measures at the end of this Report.
87886_Text.indd 1287886_Text.indd 12 5/1/14 3:09 PM5/1/14 3:09 PM

UNITED STATESSECURITIES AND EXCHANGE COMMISSION
Washington, D.C. 20549_____________________
FORM 10-K_____________________
ANNUAL REPORT PURSUANT TO SECTION 13 OR 15(d) OF THE SECURITIESEXCHANGE ACT OF 1934
For the fiscal year ended December 29, 2013
or
TRANSITION REPORT PURSUANT TO SECTION 13 OR 15(d) OF THE SECURITIESEXCHANGE ACT OF 1934
For the transition period from ____________to _____________.
Commission File Number 001-35844___________________________________
Pinnacle Foods Inc.(Exact name of registrant as specified in its charter)
___________________________________
Delaware 35-2215019(State or other jurisdiction of incorporation or organization) (I.R.S. Employer Identification No.)
399 Jefferson RoadParsippany, New Jersey 07054
(Address of Principal Executive Offices) (Zip Code)
Registrant’s telephone number, including area code: (973) 541-6620Securities registered pursuant to Section 12(b) of the Act:
Title of each class Name of the exchange on which registeredCommon Stock, par value $0.01 per share New York Stock Exchange
Securities registered pursuant to Section 12(g) of the Act: None.___________________________________
Indicate by check mark if the registrant is a well-known seasoned issuer (as defined in Rule 405 of the Securities Act). Yes No
Indicate by check mark if the registrant is not required to file reports pursuant to Section 13 or 15(d) of the Act. Yes ? No ?
Indicate by check mark whether the registrant: (1) has filed all reports required to be filed by Section 13 or 15(d) of the Securities Exchange Act of 1934 during the preceding 12 months (or for such shorter period that the registrant was required to file such reports), and (2) has been subject to such filing requirements for the past 90 days. Yes No

Indicate by check mark whether the registrant has submitted electronically and posted on its corporate Web site, if any, every Interactive Data File required to be submitted and posted pursuant to Rule 405 of Regulation S-T during the preceding 12 months (or for such shorter period that the registrant was required to submit and post such files). Yes No
Indicate by check mark if disclosure of delinquent filers pursuant to Item 405 of Regulation S-K (§229.405 of this chapter) is not contained herein, and will not be contained, to the best of the registrant’s knowledge, in definitive proxy or information statements incorporated by reference in Part III of this Form 10-K or any amendment to this Form 10-K. ?
Indicate by check mark whether the registrant is a large accelerated filer, an accelerated filer, a non-accelerated filer, or a smaller reporting company. See definitions of “large accelerated filer," “accelerated filer” and “smaller reporting company” in Rule 12b-2 of the Exchange Act (Check One):
Large accelerated filer Accelerated filer
Non-accelerated filer (Do not check if a smaller reporting company) Smaller Reporting Company
Indicate by check mark whether the registrant is a shell company (as defined in Rule 12b-2 of the Exchange Act)Yes No
As of June 28, 2013 (the last business day of the registrant's most recently completed second fiscal quarter), the aggregate market value of common stock held by non-affiliates of the registrant was approximately $836,388,810. For purposes of this calculation, the Registrant has assumed that its directors and executive officers are affiliates.
There were 117,229,317 shares of common stock, $0.01 par value, outstanding at March 3, 2014.
DOCUMENTS INCORPORATED BY REFERENCE
Portions of the definitive proxy statement for the annual meeting of shareholders scheduled to be held on June 10, 2014 are incorporated by reference into Part III of this Form 10-K.

TABLE OF CONTENTS
FORM 10-KPageNo.
ITEM 1:ITEM 1A:ITEM 1B:ITEM 2:ITEM 3:ITEM 4:
ITEM 5:
ITEM 6:ITEM 7:
ITEM 7A:ITEM 8:
1.2.3.4.5.6.7.8.9.10.11.12.13.14.15.16.17.18.19.
ITEM 9:
ITEM 9A:ITEM 9B:
ITEM 10:ITEM 11:ITEM 12:
ITEM 13:ITEM 14:
ITEM 15:
PART I 5BUSINESS 5RISK FACTORS 15UNRESOLVED STAFF COMMENTS 22PROPERTIES 22LEGAL PROCEEDINGS 23MINE SAFETY DISCLOSURES 23
PART II 25MARKET FOR REGISTRANT'S COMMON EQUITY, RELATED STOCKHOLDER MATTERS AND ISSUER PURCHASES OF EQUITY SECURITIES 25SELECTED FINANCIAL DATA 27MANAGEMENT’S DISCUSSION AND ANALYSIS OF FINANCIAL CONDITION AND RESULTS OF OPERATIONS 28QUANTITATIVE AND QUALITATIVE DISCLOSURE ABOUT MARKET RISK 55FINANCIAL STATEMENTS AND SUPPLEMENTARY DATA 56
CONSOLIDATED STATEMENTS OF OPERATIONS 58CONSOLIDATED STATEMENTS OF COMPREHENSIVE EARNINGS 59CONSOLIDATED BALANCE SHEETS 60CONSOLIDATED STATEMENTS OF CASH FLOWS 61CONSOLIDATED STATEMENTS OF SHAREHOLDERS' EQUITY 62NOTES TO CONSOLIDATED FINANCIAL STATEMENTS 63
Summary of Business Activities 63Summary of Significant Accounting Policies 64Acquisitions 68Fair Value Measurements 69Shareholder's Equity and Equity-Based Compensation Expense 71Other Expense (Income), net 76Balance Sheet Information 77Goodwill, Tradenames and Other Assets 79Restructuring and Impairment Charges 81Debt and Interest Expense 83Pension and Retirement Plans 87Financial Instruments 96Commitments and Contingencies 100Related Party Transactions 101Segments 102Taxes on Earnings 105Quarterly Results (Unaudited) 109Guarantor and Nonguarantor Statements 111Subsequent Events 119
CHANGES IN AND DISAGREEMENTS WITH ACCOUNTANTS ON ACCOUNTING AND FINANCIAL DISCLOSURE 120CONTROLS AND PROCEDURES 120OTHER INFORMATION 121
PART III 121DIRECTORS, EXECUTIVE OFFICERS AND CORPORATE GOVERNANCE 121EXECUTIVE COMPENSATION 121SECURITY OWNERSHIP OF CERTAIN BENEFICIAL OWNERS AND MANAGMENT AND RELATED STOCKHOLDER MATTERS 121CERTAIN RELATIONSHIPS AND RELATED TRANSACTIONS AND DIRECTOR INDEPENDENCE 121PRINCIPAL ACCCOUNTANT FEES AND SERVICES 121
PART IV 122EXHIBITS, FINANCIAL STATEMENT SCHEDULES 122
SIGNATURES 128
4
DISCLOSURE REGARDING FORWARD-LOOKING STATEMENTS
This annual report on Form 10-K contains “forward-looking statements” within the meaning of Section 27A of the Securities Act of 1933 (the "Securities Act") and section 21E of the Securities Exchange Act of 1934 (the "Exchange Act"). Forward-looking statements include statements concerning our plans, objectives, goals, strategies, future events, future revenues or performance, financing needs, plans or intentions relating to acquisitions, business trends and other information that is not historical information. When used in this annual report on Form 10-K, the words “estimates,” “expects,” “contemplates,” “anticipates,” “projects,” “plans,” “intends,” “believes,” “forecasts,” “may,” “should” and variations of such words or similar expressions are intended to identify forward-looking statements. All forward-looking statements, including, without limitation, management's examination of historical facts and operating trends, are based upon our current expectations and various assumptions. Our expectations, beliefs and projections are expressed in good faith and we believe there is a reasonable basis for them. However, there can be no assurance that management's expectations, beliefs and projections will result or be achieved and actual results may vary materially from what is expressed in or indicated by the forward-looking statements.
There are a number of risks and uncertainties that could cause our actual results to differ materially from the forward-looking statements contained in this annual report. Such risks, uncertainties and other important factors include, among other things:
competition;our ability to predict, identify, interpret and respond to changes in consumer preferences;the loss of any of our major customers;our reliance on single source provider for the manufacturing, co-packing and distribution of many of our products;fluctuations in price and supply of food ingredients, packaging materials and freight;volatility in commodity prices and our failure to mitigate the risks related to commodity price fluctuation and foreign exchange risk through the use of derivative instruments;costs and timeliness of integrating future acquisitions or our failure to realize anticipated cost savings, revenue enhancements or other synergies therefrom;our substantial leverage;litigation or claims regarding our intellectual property rights or termination of our material licenses;our inability to drive revenue growth in our key product categories or to add products that are in faster growing and more profitable categories;potential product liability claims;seasonality;the funding of our defined benefit pension plans;changes in our collective bargaining agreements or shifts in union policy;changes in the cost of compliance with laws and regulations, including environmental, worker health and workplace safety laws and regulations;our failure to comply with FDA, USDA or FTC regulations and the impact of governmental budget cuts;disruptions in our information technology systems;future impairments of our goodwill and intangible assets;difficulty in the hiring or the retention of key management personnel;changes in tax statutes, tax rates, or case laws which impact tax positions we have taken; andAffiliates of Blackstone beneficially own approximately 51% of our common stock
There may be other factors that may cause our actual results to differ materially from the forward-looking statements, including factors disclosed under the sections entitled “Risk Factors” and “Management's Discussion and Analysis of Financial Condition and Results of Operations” in this Form 10-K. You should evaluate all forward-looking statements made in this Form 10-K in the context of these risks and uncertainties.
We caution you that the risks, uncertainties and other factors referenced above may not contain all of the risks, uncertainties and other factors that are important to you. In addition, we cannot assure you that we will realize the results, benefits or developments that we expect or anticipate or, even if substantially realized, that they will result in the consequences or affect us or our business in the way expected. All forward-looking statements in this annual report on Form 10-K apply only as of the date made and are expressly qualified in their entirety by the cautionary statements included in this annual report on Form 10-K. We undertake no obligation to publicly update or revise any forward-looking statements to reflect subsequent events or circumstances.

5
EXPLANATORY NOTE
Unless the context requires otherwise, in this Form 10-K, “Pinnacle,” the “Company,” “we,” “us” and “our” refers to Pinnacle Foods Inc.”, and the entities that are its consolidated subsidiaries (including Pinnacle Foods Group LLC, or “PFG LLC”, formerly known as Pinnacle Foods Group Inc. or “PFGI”), which includes all of Pinnacle's existing operations.
PART I
ITEM 1. BUSINESS
Company Overview
We are a leading manufacturer, marketer and distributor of high-quality, branded food products in North America, with annual net sales of $2.5 billion in fiscal 2013. Our brands are leaders in many of their respective categories, and we hold the #1 or #2 market share position in 10 of the 13 major product categories in which we compete. Our brand portfolio enjoys strong household penetration in the United States, where our products can be found in over 85% of U.S. households. Our products are sold through supermarkets, grocery wholesalers and distributors, mass merchandisers, super centers, convenience stores, dollar stores, drug stores and warehouse clubs in the United States and Canada, as well as in military channels and foodservice locations. Given our diverse portfolio of iconic brands with attractive market positions, our business generates significant and stable cash flows that we believe will enable us to pay regular dividends to our shareholders, reduce our debt and drive value creation through both reinvestment in our existing brands and periodic strategic acquisitions.
On October 1, 2013, we acquired the Wish-Bone salad dressings business, which had sales of approximately $190 million in 2012, adding a 13th major product category to our portfolio and which is expected to enhance our margins. As of December 30, 2013, exclusive of the ongoing co-manufacturing agreement (described later), the Wish-Bone business was fully integrated into Pinnacle.
In addition to reinvestment in our brands and making periodic strategic acquisitions, we have also deployed our significant cash flows to reduce our debt. Our cash flow generation, combined with proceeds from our IPO, has enabled us to pay down approximately $1.0 billion of the $3.0 billion of debt we incurred in connection with the acquisition of the Company by affiliates of Blackstone in April 2007, and the Birds Eye Acquisition in December 2009. Our October 1, 2013 acquisition of Wish-Bone added $525.0 million of new debt to our capital structure.
Throughout this Form 10-K, we use data provided by Information Resources Inc. (“IRI”), previously Symphony IRI Group, Inc. Unless we indicate otherwise, retail sales, market share, category and other industry data used throughout this 10-K for all categories and segments are for U.S. brands and for the 52-week period ended December 29, 2013. This data includes retail sales for food (grocery stores with at least $2.0 million in annual sales), drug (all chain and independent drug retailers, excluding prescription sales), mass merchandisers (Target, Kmart and Shopko), Walmart (Supercenters, Division 1 and Neighborhood Market), club stores (BJ’s and Sam’s Club), dollar stores (Dollar General, Family Dollar and Fred’s) and military (Defense Commissary Agency commissaries in the continental United States). Retail sales are dollar sales estimated by IRI and represent the value of units sold through cash registers for the relevant period. Market share is the Company’s percentage of the overall category and is calculated using dollar retail sales of U.S. brands.
We view our business as comprised of 13 major product categories in which our annualized net sales approximate or exceed $50.0 million and which collectively comprised in excess of 90% of our North America Retail net sales in fiscal 2013.
We view shelf-stable pickles, table syrup, frozen and refrigerated bagels, frozen pancakes/waffles/French toast and pie/pastry fruit fillings as distinct categories. We view the cake/brownie mixes and frostings category as consisting of cake and cupcake mixes, brownie mixes and frostings. We view the frozen vegetables category as consisting of frozen plain vegetables, frozen prepared vegetables and select frozen side dishes including vegetables. We view the frozen complete bagged meals category as consisting of frozen full-calorie multi-serve dinners, excluding non-bag items. We view the frozen prepared seafood category as consisting of frozen prepared fish/seafood and frozen prepared shrimp. We view the single-serve frozen dinners and entrées category as consisting of full-calorie single-serve frozen dinners and entrées and select frozen handheld entrees. We view the frozen pizza-for-one category as consisting of total frozen pizza of 12 ounces per unit or less (for single serve packages, or individual units within multi-serve packages), excluding French bread crust and diet-positioned varieties. We view the canned meat category as consisting of shelf-stable prepared chili, shelf-stable lunch meats, shelf-stable Vienna Sausage and shelf-stable potted meats. We view the shelf-stable salad dressings category as consisting of shelf-stable pourable dressings and salad dressing mixes.

6
Although we believe that this information is reliable, we cannot guarantee its accuracy and completeness, nor have we independently verified it. Although we are not aware of any misstatements regarding the industry data that we present in this Form 10-K, our estimates involve risks and uncertainties and are subject to change based on various factors, including those discussed under “Disclosure regarding forward-looking statements” and “Item 1A: Risk Factors.”
Our operations are managed and reported in three operating segments: the Birds Eye Frozen Division, the Duncan Hines Grocery Division and the Specialty Foods Division. The Birds Eye Frozen Division and the Duncan Hines Grocery Division, which collectively represent our North America Retail operations, include the following brands:
Birds Eye Frozen Division
Major Pinnacle Brands Industry Category
Market Share52 Weeks Ended
December 29, 2013 (4)CategoryRank (1)
Birds Eye Frozen vegetables 25.7% #1
Birds Eye Voila! (2) Frozen complete bagged meals 28.0% #2
Van de Kamp'sMrs. Paul's
Frozen prepared seafood 14.8% #2
Lender's Frozen and refrigerated bagels 60.4% #1
Celeste Frozen pizza for one 7.6% #4
Hungry-Man Full-calorie single-serve frozen dinnersand entrées
8.0% #4
Aunt Jemima Frozen pancakes / waffles / French toast 5.7% #2
Duncan Hines Grocery Division
Major Pinnacle Brands Industry Category
Market Share52 Weeks Ended
December 29, 2013 (4)CategoryRank (1)
Duncan Hines Cake / brownie mixes and frostings 23.7% #2Vlasic Shelf-stable pickles 35.0% #1Wish-Bone (3)Western
Shelf-stable salad dressings 12.4% #3
Mrs. Butterworth'sLog Cabin
Table syrup 21.1% #1
ArmourBrooksNalley
Canned meat
21.3% #2
ComstockWilderness
Pie / pastry fruit fillings 38.0% #1
(1) Rank among branded manufacturers, excluding Private Label.(2) Pinnacle is the number 2 competitor in the category and Birds Eye Voila! is the number one brand.(3) Pinnacle is the number 3 competitor in the category and Wish-Bone is the number one brand in the Italian segment.(4) Based on IRI custom Pinnacle databases for all categories except for Shelf Stable Salad Dressings that are based on a
syndicated view.
In addition to our North America Retail operations, the Specialty Foods Division consists of a regional presence in snack products (including Tim’s Cascade and Snyder of Berlin), as well as our Foodservice and Private Label businesses. As part of our ongoing strategic focus over the last several years, we have deemphasized certain low-margin Foodservice businesses particularly Foodservice pickles in fiscal 2012 and Private Label businesses for the benefit of our higher-margin branded food products. This effort was substantially completed in 2013.
7
Within our divisions, we actively manage our portfolio by segregating our business into Leadership Brands and Foundation Brands. Our Leadership Brands enjoy a combination of higher growth and margins, greater potential for value-added innovation and enhanced responsiveness to consumer marketing than do our Foundation Brands. As a result, we focus our investment spending and brand-building activities on our Leadership Brands. By contrast, we manage our Foundation Brands for revenue and market share stability and for cash flow generation to support investment in our Leadership Brands, reduce our debt and fund other corporate priorities. As a result, we focus spending for our Foundation Brands on brand renovation and targeted consumer and trade programs.
Our Leadership Brands are comprised of Birds Eye, Birds Eye Voila!, Duncan Hines, Vlasic, Van de Kamp’s, Mrs. Paul’s, Mrs. Butterworth’s, Log Cabin, Wish-Bone, and Western. Historically, our Leadership Brands have received approximately 80% of our marketing investment and the majority of our innovation investment. Our Birds Eye and Birds Eye Voila! brands combined had annual retail revenue in excess of $1.0 billion in 2013, and our remaining Leadership Brands collectively had annual retail revenue in excess of $1.1 billion in 2013. In fiscal 2013, our Leadership Brands accounted for approximately 57% and 68% of our consolidated net sales and gross profit, respectively, and approximately 66% and 72% of our North America Retail net sales and gross profit, respectively.
Competitive Strengths
We believe the following competitive strengths differentiate us from our competitors and contribute to our ongoing success:
Actively Managed Portfolio of Iconic Food Brands with Leading Market Positions
We actively manage our diverse portfolio of iconic food brands that participate in attractive product categories. Our well-recognized brand portfolio enjoys strong household penetration in the United States, where our products can be found in over 85% of U.S. households. Our brands are leaders in their respective categories, holding the #1 or #2 market share position in 10 of the 13 major product categories in which we compete.
We have prioritized our investment spending and brand-building activities behind our Leadership Brands, given their higher growth and margins, greater potential for value-added innovation and enhanced responsiveness to consumer marketing, as compared to that of our Foundation Brands. We manage our Foundation Brands for stability in sales, market share and cash flow, with a focus on ongoing quality upgrades, competitive pricing and strong merchandising and trade programs. Our brand prioritization strategy is focused on ensuring that the strong, stable cash flows from our Foundation Brands are deployed for reinvestment in marketing and on-trend innovation for our higher-margin Leadership Brands, as well as for debt reduction and other corporate priorities. From fiscal 2009 through fiscal 2013, net sales of our Leadership Brands grew at a compounded annual growth rate, or CAGR, of 1.5%, compared to our Foundation Brands, which declined by 0.8%. Gross profit margin for our Leadership Brands was 32% of net sales in fiscal 2013, compared to 25% of net sales for our Foundation Brands in fiscal 2013.
Strong Innovation and Marketing Capabilities Focused on Leadership Brands
Since 2009, we have substantially enhanced our organizational capabilities in the areas of new product innovation and consumer marketing. We have improved our in-house innovation capabilities by augmenting and upgrading our innovation team, with the construction of a new state-of-the-art Research and Development (“R&D”) facility in our Parsippany, New Jersey headquarters. This facility co-locates our sales, marketing and operations teams with our entire company-wide R&D team, and better enables us to leverage the innovation experience of senior management. Additionally, we have increased investment in consumer insights and employee innovation training. Our Renewal Rate, which we define as gross sales from products introduced within the last three years as a percentage of current year gross sales, has increased substantially since the Birds Eye Acquisition to 8.5% in fiscal 2013, compared to 5.0% in fiscal 2009 for Pinnacle before the Birds Eye Acquisition. Gross sales represents net sales before returns, discounts, trade, slotting and coupon redemption expenses and other allowances. Recent examples of successfully launched innovations include Duncan Hines Decadent cake mixes, Vlasic Farmer’s Garden farmers market quality pickles, Birds Eye Chef’s Favorites enhanced vegetable side dishes, Birds Eye Voila! family size complete bagged meals and Birds Eye Recipe Ready pre-cut vegetables. We intend to continue to invest in innovation that enables us to further differentiate our brands in the marketplace.
To complement our accelerated innovation efforts, we have also focused and enhanced our marketing investments behind our Leadership Brands. We have partnered with best-in-class branded consumer advertising, digital and media agencies to develop high impact marketing programs implemented across television, print, social and digital media. We intend to increase marketing investments behind our Leadership Brands over time, as the volume trends and promotional environment in the broader food industry normalize.

8
Operational Excellence Driving Continued Gross Margin Improvement
Our operational excellence program is a holistic, company-wide productivity initiative designed to generate annual productivity savings in procurement, manufacturing and logistics, as well as supply chain consolidation efforts, in the range of 3% to 4% of our annual Cost of products sold. In fiscal 2013, our operational excellence initiative drove productivity savings of 4%. These productivity savings, combined with selective retail price increases and our active commodity hedging program, have been instrumental in mitigating input cost inflation in periods of significant inflationary pressure, such as fiscal 2012, and driving gross margin expansion in periods of more modest inflation. We also pursue other initiatives to drive incremental improvement in our gross margin, including improving our product mix by focusing growth in Leadership brands and through new product innovation and low-margin SKU rationalization, increasing the effectiveness of our trade promotional spending and realizing synergies from acquisitions. Furthermore, our gross margin benefits from our diversified input cost basket in which no single commodity accounted for more than 5% of our total Cost of products sold in fiscal 2013. From fiscal 2011 through 2013, we completed three manufacturing plant consolidations designed to optimize our manufacturing footprint and reduce our supply chain costs.
Strong Free Cash Flow Conversion
Our business generates an attractive Adjusted EBITDA margin and also benefits from modest capital expenditure and working capital requirements and approximately $1 billion in net operating loss carryovers (“NOLCs”), which combined have resulted in strong and stable unlevered free cash flows. Our Adjusted EBITDA margin benefits from the quality of our brand portfolio and our lean and nimble organization structure, with selling, general and administrative expenses, excluding marketing investment and one-time items, representing approximately 8.5% of net sales in fiscal 2013. Our well-maintained manufacturing facilities and strategic use of co-packers limit our maintenance and capital expenditure requirements, and our significant NOLCs and other tax attributes minimize our cash taxes.
We believe our strong free cash flows will enable us to continue to maximize shareholder value through paying a regular dividend, reducing our indebtedness, strategically deploying our capital to fund innovation and organic growth opportunities and financing value-enhancing acquisitions.
Proven M&A Expertise with Significant Opportunity
We have substantial experience in sourcing, executing and integrating value-enhancing acquisitions. We maintain a highly-disciplined approach to M&A, focusing on opportunities that add new iconic brands to our portfolio and/or allow for strong synergy realization.
On October 1, 2013, we acquired Wish-Bone, which had sales of approximately $190 million in 2012, for a purchase price of $575 million. Wish-Bone, excluding one-time acquisition-related expenses, was approximately 2 cents accretive to pro forma earnings per share in the fourth quarter of 2013. The Wish-Bone products acquired by us will continue to be manufactured by Unilever for approximately eighteen months following the consummation of the Wish-Bone acquisition (with an option to extend for an additional six months) to enable us to transition manufacturing of Wish-Bone into our St. Elmo, Illinois location. As of December 30, 2013, exclusive of the ongoing co-manufacturing agreement, the Wish-Bone business was fully integrated into Pinnacle.
In December 2009, we completed the $1.3 billion purchase of Birds Eye. The Birds Eye Acquisition added approximately $1 billion in net sales, including the Birds Eye and Birds Eye Voila! brands, enhanced our operating margins, and added critical scale to our frozen food business. The integration of Birds Eye was largely completed within six months of the acquisition, and the synergies we achieved exceeded our original estimates.
Our strong existing platforms in the Birds Eye Frozen and Duncan Hines Grocery segments facilitate a large addressable market and broad set of potential acquisition targets. We believe our scale, management depth, integration expertise and access to capital will allow us to consider both small and large acquisitions in the future and to seamlessly integrate them to drive maximum value creation.
Experienced, Hands-On Management Team and Board of Directors
Our management team has a demonstrated history of delivering strong operating results, has been strengthened with the recent addition of several highly-experienced executives, has extensive food industry experience and includes several executives who have managed significantly larger businesses and have led numerous acquisition integrations. Our management team is complimented by an experienced Board of Directors, which includes several individuals with a proven track record of successfully managing and acquiring consumer businesses.

9
Our Strategy
We intend to profitably grow our business and create shareholder value through the following strategic initiatives:
Drive Growth Through Focus on Leadership Brands
Our Leadership Brands are among our highest-growth and highest-margin businesses and enjoy greater potential for value-added innovation and enhanced responsiveness to consumer marketing. Our brand prioritization strategy is focused on ensuring that the strong, stable cash flows from our Foundation Brands are, among other uses, reinvested in marketing and on-trend innovation for our higher-margin Leadership Brands. We believe our formalized innovation processes, upgraded R&D capabilities, increased investments in consumer insights, and partnership with best-in-class branded consumer advertising, digital and media agencies will enable us to continue to introduce successful new products and drive brand growth through high-impact marketing programs. We believe this strategy, which will focus the majority of our consumer marketing investments and new product innovation efforts on our Leadership Brands, will drive higher-margin revenue growth across our portfolio.
Expand Margins By Leveraging Productivity and Efficient Organization Structure
We believe we are well-positioned to continue to expand our margins. Our company-wide focus on productivity, along with selective pricing actions and our active commodity hedging program, are intended to mitigate input cost inflation in periods of significant inflationary pressure and more than offset input cost inflation in periods of modest input cost inflation. In addition, our focus on improving our product mix, enhancing the effectiveness of our trade promotions, realizing synergies from acquisitions and leveraging our efficient organizational structure are expected to further drive margin expansion over time. We believe our lean, nimble structure and efficient internal processes will continue to enhance our decision-making and speed of execution. Our flat structure, which has enabled us to hold our overhead costs (i.e., selling, general and administrative expenses, excluding marketing investment and one-time items) at approximately 8.5% of net sales, allows for a high level of connectivity between senior management and our operations and customers, ensuring senior management engagement in key business decisions.
Deliver Strong Free Cash Flow Through Tight Working Capital Management, Focused Capital Spending and Minimal Cash Taxes
We believe we are well-positioned to profitably grow our business and generate strong free cash flow through our combination of attractive Adjusted EBITDA margins, modest working capital requirements, limited maintenance capital expenditures and low cash taxes that result from our approximately $1 billion in NOLCs and other tax attributes, which we believe will reduce the majority of our federal and state cash taxes through 2015 and generate modest annual cash tax savings beyond 2015. Our well-maintained manufacturing facilities and strategic use of co-packers limit our capital expenditure requirements, and our ongoing focused management of working capital also benefits our free cash flow.
Acquire Value-Enhancing Food Brands
We intend to continue to proactively pursue value-enhancing acquisitions in the packaged food industry, utilizing a disciplined approach to identify and evaluate attractive acquisition candidates. We believe we can leverage our scale, management depth and integration expertise, along with our access to capital, to continue our track record of making value-accretive acquisitions. We believe the combination of consolidating selling, general and administrative functions, leveraging our scale in procurement, optimizing supply chain and manufacturing operations, cross-marketing brands across categories and further developing retailer relationships will continue to enable us to drive acquisition synergies in future transactions we may pursue. On October 1, 2013, we acquired Wish-Bone, a leading salad dressing brand, with a broad range of liquid and dry-mix salad dressing flavors under the Wish-Bone and Western brand names.
Return Value to Shareholders Through Debt Reduction and Regular Dividend Payments
We believe our capital structure and strong free cash flow enable us not only to invest in our Leadership Brands to drive organic growth, make capital expenditures to drive productivity and fund value-enhancing acquisitions, but also to continue to strengthen our balance sheet through debt reduction and to return capital to our shareholders through regular dividend payments. We have paid a quarterly cash dividend of $0.18 per share since our IPO and, on November 18, 2013, reflecting the accretion we expect from the Wish-Bone acquisition and our strong operating cash flow since the consummation of our IPO, we announced an increase in our quarterly cash dividend to $0.21 per share beginning with our fourth quarter dividend that was paid in January 2014 to shareholders of record on December 2, 2013. Additionally, in the future, we will give consideration to implementing a share buy back program.

10
Reportable Segments
Birds Eye Frozen Division
Birds Eye is the largest brand in the $3.3 billion frozen vegetables category. Collectively, our steamed and non-steamed product offerings hold the #1 position among branded products, with a 25.7% market share. New government programs, such as the USDA’s My Plate program, and nutrition and health professionals continue to identify increased vegetable consumption as a key to better health. We believe that enhancing the taste of vegetables and making them exceptionally convenient are keys to driving more vegetable consumption. Birds Eye has taken a leadership role in increasing vegetable consumption, with a specific focus on children. We are sponsors of the USDA’s My Plate program, partners in Partnership for Healthy America, and are engaged in a breakthrough marketing effort with a major television network to encourage children to eat more vegetables. We also compete in the frozen complete bagged meals category with our Birds Eye Voila! brand. We are the second largest competitor in the frozen complete bagged meal category, and our Birds Eye Voila! brand is the #1 brand in the category, with a 28.0% market share. Birds Eye Voila! frozen bagged meals provide consumers with a high quality complete meal, including protein, starch, and vegetables, that they can prepare in a skillet in just minutes.
In fiscal 2013, our product launches included the Birds Eye Recipe Ready line of convenient and time saving pre-cut and sliced vegetables, expansion of the Birds Eye Voila! line with Chipotle Chicken and expansion of Birds Eye Chefs Favorites line with new flavors such as Cheese and Bacon.
Our Birds Eye Frozen Division also includes Van de Kamp’s and Mrs. Paul’s frozen seafood, Hungry-Man frozen dinners and entrées, Aunt Jemima frozen pancakes / waffles / French Toast, Lender’s refrigerated bagels and Celeste frozen pizza for one.
Duncan Hines Grocery Division
Duncan Hines is the division’s largest brand and includes cake mixes, ready-to-serve frostings, brownie mixes, muffin mixes, and cookie mixes. Over the past 3 years, Duncan Hines has established a successful line of Decadent products, which offer premium quality cakes, cupcakes and brownie mixes including the Duncan Hines Decadent Strawberry Cheesecake and other limited edition flavors launched in 2013. Duncan Hines is the #2 brand with a 23.7% market share of the $1.4 billion cake/brownie mixes and frostings category.
We also offer a complete line of shelf-stable pickle products that we market and distribute nationally, primarily under the Vlasic brand, and regionally under the Milwaukee’s and Wiejske Wyroby brands. Our Vlasic brand, represented by its trademark Vlasic stork, and including Vlasic Farmers Garden farmer's market quality pickles has the highest consumer awareness and quality ratings in the pickle category. Vlasic is the #1 brand in the $751.0 million shelf-stable pickle category and Pinnacle brands collectively hold a 35.0% market share.
On October 1, 2013, we acquired the Wish-Bone salad dressings business, which is comprised of the Wish-Bone and Western shelf-stable salad dressings brands. The acquisition adds a 13th major product category to our portfolio.
Our Duncan Hines Grocery Division also includes Mrs. Butterworth’s and Log Cabin table syrups, Armour, Nalley and Brooks canned meat, Comstock and Wilderness pie and pastry fillings, Open Pit barbecue sauce as well as all Canadian operations.
Specialty Foods Division
Snack Products. Our snack products primarily consist of Tim’s Cascade, Snyder of Berlin and Husman’s. These direct store delivery brands have strong local awareness and hold leading market share positions in their regional markets.
Foodservice and Private Label. We also manufacture and distribute certain products, mainly in the frozen breakfast, canned meat, and pie and pastry fruit filling categories, through foodservice channels. We also manufacture and distribute certain Private Label products in the canned meat, shelf-stable pickles and frozen prepared seafood categories. As part of our ongoing strategic focus over the last several years, we have deemphasized certain low-margin Foodservice and Private Label businesses for the benefit of our higher margin branded food products. This effort was substantially completed in 2013.
Financial information about our business segments is discussed in greater detail in Note 15 to the consolidated financial statements included elsewhere in this Form 10-K.

11
Customers
We have several large customers that account for a significant portion of our sales. Wal-Mart and its affiliates are our largest customers and represented approximately 26% of net sales in fiscal year 2013 and 25% of net sales in each of the fiscal years 2012 and 2011, respectively. Cumulatively, including Wal-Mart, our top ten customers accounted for approximately 60% of net sales in each of the fiscal years 2013, 2012 and 2011.
Marketing
Our marketing programs consist of consumer advertising, consumer promotions, trade promotions, direct marketing, cause related marketing and public relations. Our advertising consists of television, newspaper, magazine, digital, mobile and social advertising aimed at increasing consumer preference and usage of our brands. Consumer promotions include free trial offers, targeted coupons and on-package offers to generate trial usage and increase purchase frequency. Our trade promotions focus on obtaining retail feature and display support, achieving optimum retail product prices and securing retail shelf space. Over the long term, we continue to focus on shifting our marketing efforts toward building long-term brand equity through increased consumer marketing.
Research and Development
Our Product Development and Technical Services teams focus on new product development, product-quality improvements, productivity improvements, regulatory compliance, package development, quality assurance, consumer affairs and brand extensions for our Duncan Hines Grocery, Birds Eye Frozen and Specialty Food products. In fiscal 2012, we consolidated all of our R&D functions in our new state-of-the-art facility in our Parsippany, New Jersey headquarters and closed our Green Bay, Wisconsin location. The consolidation provides for seamless collaboration among our marketing, sales, operations and R&D functions. The relocation resulted in $3.0 million of one-time expenses in fiscal 2012. Our research and development expenditures totaled $10.5 million, $12.0 million, and $8.0 million for fiscal years 2013, 2012 and 2011, respectively. Our level of research and development expenditures reflects our focus on product development in comparison to basic research.
Intellectual Property
We own a number of registered and common law trademarks in the United States, Canada and other countries, including Amazing Glazes®, Appian Way®, Birds Eye®, Bernstein’s®, Brooks®, C&W®, CasaRegina®, Celeste®, Chocolate Lovers®, Comstock®, Country Kitchen®, Duncan Hines®, Erin’s Gourmet Popcorn®, Farmer’s Garden®, Freshlike®, Fun Frosters™, Frosting Creations®, Hartford House®, Hawaiian Style Bowls®, Hearty Bowls™, Hearty Hero®, Hungry-Man®, Hungry-Man Sports Grill®, Hungry-Man Steakhouse™, Husman’s®, It’s Good to be Full®, Lender’s®, Lil’ Griddles®, Log Cabin®, Lunch Bucket®, Magic Minis®, McKenzie’s®, Milwaukee’s®, Moist Deluxe®, Mrs. Butterworth’s®, Mrs. Paul’s®, Nalley®, Nobody Brings the Bite Like Vlasic®, Open Pit®, Ovals®, Riviera®, Satisfy Your Craving®, Signature Desserts®, Simple Mornings®, Simply Classic™, Snack’mms®, So Moist. So Delicious. And So Much More.®, Stackers®, Snyder of Berlin®, Steamfresh®, Taste the Juicy Crunch®, That’s the Tastiest Crunch I’ve Ever Heard!®, Thick N Rich®, Tim’s Cascade Snacks®, Treet®, Van de Kamp’s®, Vlasic®, Western®, Wilderness® and Wish-Bone®. We also have applications pending with the United States Patent and Trademark Office for a number of trademarks, including Discover the Wonder of Vegetables™, Holiday Velvets™, It’s Always Vegetable Season™, Simply Erin’s™, Simply Tim’s™ and Spring Velvets™. We own the trademark Snyder of Berlin while an unrelated third party owns the trademark Snyder of Hanover. Per a court order, the use of the trademark must include the word “Snyder” in combination with the words “of Berlin.” We protect our trademarks by obtaining registrations where appropriate and opposing any infringement in key markets. We also own a design trademark registration in the United States, Canada, and other countries on the Vlasic stork.
We manufacture and market certain of our frozen food products under the Swanson brand pursuant to two royalty-free, exclusive and perpetual trademark licenses granted by Campbell Soup Company. The licenses give us the right to use certain Swanson trademarks both inside and outside of the United States in connection with the manufacture, distribution, marketing, advertising, and promotion and sale of frozen foods and beverages of any type except for frozen soup or broth. The licenses require us to obtain the prior written approval of Campbell Soup Company for the visual appearance and labeling of all packaging, advertising material, and promotions bearing the Swanson trademark. The licenses contain standard provisions, including those dealing with quality control and termination by Campbell Soup Company as well as assignment and consent. If we were to breach any material term of the licenses and not timely cure such breach, Campbell Soup Company could terminate the licenses.
We manufacture and market certain of our frozen breakfast products under the Aunt Jemima brand pursuant to a royalty-free, exclusive (as to frozen breakfast products only) and perpetual license granted by The Quaker Oats Company, a subsidiary of PepsiCo Inc. The license gives us the right to use certain Aunt Jemima trademarks both inside and outside the United States in connection with the manufacture and sale of waffles, pancakes, French toast, pancake batter, biscuits, muffins, strudel, croissants,
12
and all other frozen breakfast products, excluding frozen cereal. The license requires us to obtain the approval of The Quaker Oats Company for any labels, packaging, advertising, and promotional materials bearing the Aunt Jemima trademark. The license contains standard provisions, including those dealing with quality control and termination by The Quaker Oats Company as well as assignment and consent. If we were to breach any material term of the license and not timely cure such breach, The Quaker Oats Company could terminate the license.
We have a license agreement granting us an exclusive, royalty bearing, perpetual license to use certain Armour trademarks in the United States. Under the license agreement, Smithfield Foods, Inc., as successor to ConAgra, Inc., the licensor, grants us a license for the use of various Armour trademarks in conjunction with shelf-stable products within the United States. The shelf-stable products must be manufactured according to approved formulas and specifications, and new specifications must be approved by the licensor, with such approval not to be unreasonably withheld or delayed. Proposed labels, packaging, advertising, and promotional materials must first be submitted to the licensor for approval, with such approval not to be unreasonably withheld or delayed. We are required to make annual royalty payments to the licensor based upon our annual net sales of the approved shelf-stable products. If we were to materially breach the license agreement, Smithfield Foods, Inc. could terminate the license. We own and maintain Armour registrations in many other countries.
We have an exclusive license agreement whereby we receive $0.8 million per year in royalties from the Dean Pickle and Specialty Products Company, a subsidiary of TreeHouse Foods, Inc., for the use of Nalley® and other trademarks in the production of the Nalley’s Pickle brand.
We also manufacture and market frozen complete bagged meals under the Voila! trademark pursuant to a royalty-free exclusive and perpetual license granted by Voila Bakeries, Inc. This license gives us the right to use Voila! in the United States in connection with products containing both meat and vegetable items. The license contains standard provisions, including those dealing with quality control and termination by Voila Bakeries, Inc. as well as assignment and consent. If we were to breach any material term of the license and not timely cure such breach, Voila Bakeries, Inc. could terminate the license.
Although we own a number of patents covering manufacturing processes, we do not believe that our business depends on any one of these patents to a material extent. In 2011, we applied for a patent for our new Duncan Hines Frosting Creations™ products.
Sales and Distribution
We sell and distribute a majority of our products in the United States and Canada through a combined network of broker and internal sales teams. We employ other brokers for the foodservice and club channels. Through this combination network, our products reach all traditional classes of trade, including supermarkets, grocery wholesalers and distributors, mass merchandisers, super centers, convenience stores, drug stores, warehouse clubs, foodservice, and other alternative channels. In 2013, we expanded direct sales coverage for retailer headquarters to more than 50% of our U.S. retail business, which included building internal capabilities to best meet the needs of our customers while continuing to leverage the services of our national broker.
Due to the different demands of distribution for frozen and shelf-stable products, we maintain separate distribution systems. Our Birds Eye Frozen Division’s and Duncan Hines Grocery Division’s product warehouse and distribution network consists of 13 locations and 12 locations, respectively. In addition to these locations, our snack products are primarily distributed through a direct store delivery network in the Midwest, Mid-Atlantic, and Pacific Northwest, a portion of which we own and operate and a portion of which utilizes third-party providers. We believe that our sales and distribution network is scalable and has the capacity to support substantial increases in volume.
Ingredients and Packaging
We believe that the ingredients and packaging used to produce our products are readily available through multiple sources. Our ingredients typically account for approximately 54% of our annual Cost of products sold, excluding logistics and depreciation, and primarily include sugar, cucumbers, flour (wheat), vegetables, fruits, poultry, seafood, proteins, vegetable oils, shortening, meat, corn syrup and other agricultural products. Certain vegetables and fruits are purchased under dedicated acreage supply contracts from a number of growers prior to each growing season, while a smaller portion is sourced directly from third parties. Our packaging costs, primarily for aluminum, glass jars, plastic trays, corrugated fiberboard, polyfilm and plastic packaging materials, typically account for approximately 21% of our annual Cost of products sold, excluding logistics and depreciation.

13
Manufacturing
Owned and Operated Manufacturing Facilities. We own and operate ten manufacturing facilities for our products. See "Item 2, - Properties" for a listing of our manufacturing facilities.
Co-Packing Arrangements. In addition to our own manufacturing facilities, we source a portion of our products under “co-packing” agreements, a common industry practice in which manufacturing is outsourced to other companies. We regularly evaluate our co-packing arrangements to ensure the most cost-effective manufacturing of our products and to utilize company-owned manufacturing facilities most effectively. Third-parties currently produce our Duncan Hines product line, as well as various other products. On January 29, 2014, we entered into a definitive agreement to acquire the largest Duncan Hines co-manufacturing business located in Centralia, Illinois from Gilster Mary Lee Corporation. The transaction is expected to close in the second quarter of 2014. In addition, in connection with the Wish-Bone acquisition, Unilever has agreed to continue to manufacture certain products for approximately eighteen months following the acquisition (with an option to extend for an additional six months) to enable us to transition the manufacturing of Wish-Bone into our St. Elmo, Illinois location.
Seasonality
Our sales and cash flows are affected by seasonal cyclicality. In general, our sales are higher in the first and fourth quarter. In addition, since many of our raw materials are agricultural crops, production of these products is predominantly seasonal. As a result our inventory levels tend to be higher in the third quarter, requiring more working capital at that time.
Competition
We face competition in each of our respective product lines. Although we operate in a highly competitive industry, we believe that the strength of our brands has resulted in strong respective competitive positions. We compete with producers of similar products on the basis of, among other things, product quality, brand recognition and loyalty, price, customer service, effective consumer marketing and promotional activities, and the ability to identify and satisfy emerging consumer preferences.
Employees
We employed approximately 3,700 people as of December 29, 2013, with approximately 52% of our hourly employees unionized. Due to the seasonality of our pickle and vegetable businesses, our employment fluctuates throughout the year, and thus our average number of employees was approximately 4,200 throughout fiscal 2013. In October 2013, negotiations with the union began on the collective bargaining agreement for approximately 480 employees at our Darien, Wisconsin plant. Those negotiations are ongoing and we continue to operate under the existing contract. Our other unionized employees are covered under collective bargaining agreements expiring between April 2014 and October 2022. See “Item 1A— Risk Factors— Our financial well-being could be jeopardized by unforeseen changes in our employees’ collective bargaining agreements or shifts in union policy.”
Financial Information About Geographical Areas
For information about our geographic segments, see Note 15 to the consolidated financial statements in this Form 10-K.
Governmental, Legal and Regulatory Matters
Food Safety and Labeling
We are subject to extensive regulation, including, among other things, the Food, Drug and Cosmetic Act, as amended by the Food Safety Modernization Act, the Public Health Security and Bioterrorism Preparedness and Response Act of 2002, and the rules and regulations promulgated thereunder by the U.S. Food and Drug Administration. This comprehensive and evolving regulatory program governs, among other things, the manufacturing, composition and ingredients, labeling, packaging, and safety of food, including compliance with current Good Manufacturing Practices. In addition, the Nutrition Labeling and Education Act of 1990 prescribes the format and content of certain information required to appear on the labels of food products. We are also subject to regulation by certain other governmental agencies, including the U.S. Department of Agriculture.
Our operations and products are also subject to state and local regulation, including the registration and licensing of plants, enforcement by state health agencies of various state standards, and the registration and inspection of facilities. Compliance with federal, state and local regulation is costly and time-consuming. Enforcement actions for violations of federal, state, and local regulations may include seizure and condemnation of products, cease and desist orders, injunctions or monetary penalties. We believe that our practices are sufficient to maintain compliance with applicable government regulations.

14
Federal Trade Commission
We are subject to certain regulations by the Federal Trade Commission. Advertising of our products is subject to such regulation pursuant to the Federal Trade Commission Act and the regulations promulgated thereunder.
Employee Safety Regulations
We are subject to certain health and safety regulations, including regulations issued pursuant to the Occupational Safety and Health Act. These regulations require us to comply with certain manufacturing, health, and safety standards to protect our employees from accidents.
Environmental Regulation
We are subject to a number of federal, state, and local laws and other requirements relating to the protection of the environment and the safety and health of personnel and the public. These requirements relate to a broad range of our activities, including: the discharge of pollutants into the air and water; the identification, generation, storage, handling, transportation, disposal, record-keeping, labeling, and reporting of, and emergency response in connection with, hazardous materials (including asbestos) associated with our operations; noise emissions from our facilities; and safety and health standards, practices, and procedures that apply to the workplace and the operation of our facilities.
In order to comply with these requirements, we may need to spend substantial amounts of money and other resources from time to time to (i) construct or acquire new equipment, (ii) acquire or amend permits to authorize facility operations, (iii) modify, upgrade, or replace existing and proposed equipment and (iv) clean up or decommission our facilities or other locations to which our wastes have been sent. For example, some of our baking facilities are required to obtain air emissions permits and to install bag filters. Many of our facilities discharge wastewater into municipal treatment works, and may be required to pre-treat the wastewater and/or to pay surcharges. Some of our facilities use and store in tanks large quantities of materials, such as sodium chloride and ammonia, that could cause environmental damage if accidentally released. We use some hazardous materials in our operations, and we generate and dispose of hazardous wastes as a conditionally exempt small quantity generator. Our capital and operating budgets include costs and expenses associated with complying with these laws. If we do not comply with environmental requirements that apply to our operations, regulatory agencies could seek to impose civil, administrative, and/or criminal liabilities, as well as seek to curtail our operations. Under some circumstances, private parties could also seek to impose civil fines or penalties for violations of environmental laws or recover monetary damages, including those relating to property damage or personal injury.
Many of our plants were in operation before current environmental laws and regulations were enacted. Our predecessors have in the past had to remediate soil and/or groundwater contamination at a number of locations, including petroleum contamination caused by leaking underground storage tanks which they removed, and we may be required to do so again in the future. We have sold a number of plants where we have ceased operations, and it is possible that future renovations or redevelopment at these facilities might reveal additional contamination that may need to be addressed. Although remediation costs in the past have not been material, future remediation costs may be. The presence of hazardous materials at our facilities or at other locations to which we have sent hazardous wastes for treatment or disposal, may expose us to potential liabilities associated with the cleanup of contaminated soil and groundwater under federal or state “Superfund” statutes. Under the federal Comprehensive Environmental Response, Compensation, and Liability Act of 1980, as amended (“CERCLA”), owners and operators of facilities from which there has been a release or threatened release of hazardous materials, together with those who have transported or arranged for the transportation or disposal of those materials, are liable for (i) the costs of responding to and remediating that release and (ii) the restoration of natural resources damaged by any such release. Under CERCLA and similar state statutes, liability for the entire cost of cleaning up the contaminated site can, subject to certain exceptions, be imposed upon any such party regardless of the lawfulness of the activities that led to the contamination.
In working to resolve an environmental wastewater investigation by the State of Michigan Department of Natural Resources and Environment (“MDNRE”) at our Birds Eye Fennville, Michigan production facility, on July 20, 2010, we and the MDNRE reached an agreement (“Administrative Consent Order” or “ACO”). Pursuant to the terms of the ACO, we have installed a new wastewater treatment system at the facility at a cost of approximately $6.2 million and are contributing the funds required to extend the City’s water supply to the affected residents.

15
Insurance
We maintain general liability and product liability, property, worker’s compensation, business interruption, director and officer and other insurance in amounts and on terms that we believe are customary for companies similarly situated. In addition, we maintain excess insurance where we believe it is reasonably cost effective.
Additional information
Pinnacle Foods Inc. was incorporated in Delaware on July 28, 2008 under the name "Crunch Holding Corp".
Additional information pertaining to our businesses, including operating segments, is set forth under the caption “Management's Discussion and Analysis of Financial Condition and Results of Operations-Results of Operations and Related Information” under Item 7 of this Form 10-K and in Note 15 to the Consolidated Financial Statements, “Segments”, which is included under Item 8 of this Form 10-K.
Our reports on Form 10-K, along with all other reports and amendments, are filed with or furnished to the U.S. Securities and Exchange Commission (the "SEC"). You may read and copy any materials we file with the SEC at the SEC's Public Reference Room at 100 F Street, NE, Washington, D.C., 20549. Please call 1-800-SEC-0330 for further information on the operation of the Public Reference Room. Our filings are also available free of charge to the public from commercial document retrieval services and at the web site maintained by the SEC at http://www.sec.gov. We also make available through our internet website at http://www.pinnaclefoods.com under the heading “Investor Relations,” our annual report on Form 10-K, quarterly reports on Form 10-Q, current reports on Form 8-K and amendments to those reports after we electronically file any such materials with the SEC.
ITEM 1A. RISK FACTORS
RISK FACTORS
Risks Related to Our Business
We face significant competition in our industry, which could cause us to lose market share, lower prices, or increase advertising and promotional expenditures. Our success also depends on our ability to predict, identify and interpret changes in consumer preferences and develop and offer new products rapidly enough to meet those changes.
The food products business is highly competitive. Numerous brands and products compete for shelf space and sales, with competition based primarily on product quality, brand recognition and loyalty, price, trade promotion, consumer promotion, customer service, and the ability to identify and satisfy emerging consumer preferences. We compete with a significant number of companies of varying sizes, including divisions, subdivisions, or subsidiaries of larger companies. Many of these competitors have multiple product lines, substantially greater financial and other resources available to them, and may be substantially less leveraged than Pinnacle. In addition, Private Label is a significant competitor, particularly in the frozen vegetables, shelf-stable pickles, table syrup, frozen and refrigerated bagels, and pie/pastry fruit fillings categories. We may not be able to compete successfully with these companies and Private Label. Competitive pressures or other factors could cause us to lose market share, which may require us to lower prices, increase marketing and advertising expenditures, or increase the use of discounting or promotional campaigns, each of which would materially and adversely affect our margins and could result in a decrease in our operating results and profitability.
Our success depends on our ability to predict, identify, and interpret the tastes and dietary habits of consumers and to offer products that appeal to those preferences. There are inherent marketplace risks associated with new product or packaging introductions, including uncertainties about trade and consumer acceptance. If we do not succeed in offering products that consumers want to buy, our sales and market share will decrease, resulting in reduced profitability. If we are unable to accurately predict which shifts in consumer preferences will be long-lasting, or are unable to introduce new and improved products to satisfy those preferences, our sales will decline. In addition, given the variety of backgrounds and identities of consumers in our consumer base, we must offer a sufficient array of products to satisfy the broad spectrum of consumer preferences. As such, we must be successful in developing innovative products across a multitude of product categories. Finally, if we fail to rapidly develop products in faster-growing and more profitable categories, we could experience reduced demand for our products, or fail to expand margins.
We are also subject to the effect that the overall economic conditions have upon consumer sentiment and retail sales.

16
If we lose one or more of our major customers, or if any of our major customers experience significant business interruption, our results of operations could be adversely affected.
We have several large customers that account for a significant portion of our sales. Wal-Mart and its affiliates are our largest customers and represented approximately 26% of net sales in fiscal year 2013 and 25% of net sales in each of the fiscal years 2012 and 2011, respectively. Cumulatively, including Wal-Mart, our top ten customers accounted for approximately 60% of net sales in each of fiscal years 2013, 2012 and 2011.
We do not have long-term supply contracts with any of our major customers. The loss of one or more major customers, a material reduction in sales to these customers as a result of competition from other food manufacturers, or the occurrence of a significant business interruption of our customers’ operations would result in a decrease in our revenues, operating results, and earnings and could adversely affect the market price of our common stock.
In addition, as the retail grocery trade continues to consolidate and our retail customers grow larger and become more sophisticated, our retail customers may demand lower pricing and increased promotional programs. If we fail to use our sales and marketing expertise to maintain our category leadership positions to respond to these trends, or if we lower our prices or increase promotional support of our products and are unable to increase the volume of our products sold, our profitability and financial condition may be adversely affected.
For the manufacturing, co-packing and distribution of many of our products, we primarily rely on single source providers where a significant disruption in a facility or loss of arrangements could affect our business, financial condition, and results of operations.
With the exception of our Birds Eye frozen vegetable products which are produced in two facilities (Waseca, Minnesota and Darien, Wisconsin, which has approximately three times the production capacity of the Waseca location), none of our products are produced in significant amounts at multiple manufacturing facilities or co-packers. In addition, in connection with the Wish-Bone acquisition, Unilever has agreed to continue to manufacture certain products for approximately eighteen months following the consummation of the acquisition (with an option to extend for an additional six months) to enable us to transition the manufacturing of Wish-Bone into an existing Pinnacle facility. Significant unscheduled downtime at any of our facilities or co-packers due to equipment breakdowns, power failures, natural disasters, or any other cause could materially adversely affect our ability to provide products to our customers, which would have a material adverse effect on our business, financial condition and results of operations.
We rely upon co-packers for our Duncan Hines cake mixes, brownie mixes, specialty mixes, frosting products and a limited portion of our other manufacturing needs. We believe that there are a limited number of competent, high-quality co-packers in the industry, and if we were required to obtain additional or alternative co-packing agreements or arrangements in the future, we may not be able to do so on satisfactory terms or in a timely manner. On January 29, 2014, we entered into a definitive agreement to acquire the largest Duncan Hines co-manufacturing business located in Centralia, Illinois from Gilster Mary Lee Corporation. The transaction is expected to close in the second quarter of 2014.
We sell a majority of our products in the United States and Canada through a combination of a direct and broker network. Our business could suffer disruption if either of our major United States or Canada brokers were to default in the performance of their obligations to perform brokerage services or fail to effectively represent us to the retail grocery trade.
We are vulnerable to fluctuations in the price and supply of food ingredients, packaging materials, and freight.
The prices of the food ingredients, packaging materials and freight are subject to fluctuations in price attributable to, among other things, changes in supply and demand of crops or other commodities, fuel prices and government-sponsored agricultural and livestock programs. The sales prices to our customers are a delivered price. Therefore, changes in our input costs could impact our gross margins. Our ability to pass along higher costs through price increases to our customers is dependent upon competitive conditions and pricing methodologies employed in the various markets in which we compete. To the extent competitors do not also increase their prices, customers and consumers may choose to purchase competing products or may shift purchases to lower-priced Private Label or other value offerings which may adversely affect our results of operations.
We use significant quantities of sugar, cucumbers, broccoli, corn, peas, green beans, flour (wheat), poultry, seafood, vegetable oils, shortening, meat, corn syrup and other agricultural products as well as aluminum, glass jars, plastic trays, corrugated fiberboard and plastic packaging materials provided by third-party suppliers. We buy from a variety of producers and manufacturers, and alternate sources of supply are generally available. However, the supply and price are subject to market conditions and are influenced by other factors beyond our control, such as general economic conditions, unanticipated demand, problems in production or distribution, natural disasters, weather conditions during the growing and harvesting seasons, insects, plant diseases, and fungi. Adverse weather conditions may occur more frequently as a result of climate change and other factors. Adverse weather conditions

17
and natural disasters can reduce crop size and crop quality, which in turn could reduce our supplies of raw materials, lower recoveries of usable raw materials, increase the prices of our raw materials, increase our cost of storing raw materials if harvests are accelerated and processing capacity is unavailable, or interrupt or delay our production schedules if harvests are delayed.
We do not have long-term contracts with many of our suppliers, and, as a result, they could increase prices or fail to deliver. The occurrence of any of the foregoing could increase our costs and disrupt our operations.
If our assessments and assumptions about commodity prices, as well as ingredient and other prices and currency exchange rates, prove to be incorrect in connection with our hedging or forward-buy efforts or planning cycles, our costs may be greater than anticipated and our financial results could be adversely affected. Volatility in commodity prices will impact our results of operations.
From time to time, we enter into commodity forward contracts to fix the price of natural gas, diesel fuel, corn, soybean oil and other commodity purchases at a future delivery date. However, such strategies do not fully address commodity price risk. Adverse movements in commodity prices over the terms of the contracts or instruments could decrease the economic benefits we derive from these strategies. Additionally, changes in the value of our commodities derivatives are recorded in the Cost of products sold line in our Consolidated Statements of Operations. Accordingly, volatility in commodities could result in volatility in our results of operations. As of December 29, 2013, the potential change in fair value of commodity derivative instruments, assuming a 10% adverse movement in the underlying commodity prices, would have resulted in an unrealized net loss of $2.1 million.
In addition, certain parts of our foreign operations in Canada expose us to fluctuations in foreign exchange rates. Net sales in Canada accounted for 3.4% of Consolidated Net Sales for fiscal 2013. We seek to reduce our exposure to such foreign exchange risks primarily through the use of foreign exchange-related derivative financial instruments. We enter into derivative financial instruments to protect the value or fix the amount of certain obligations in terms of our functional currency. As of December 29, 2013, a 10% decline in the U.S. dollar relative to the Canadian dollar would have decreased the fair value of our foreign exchange forward contracts by $4.5 million.
We may cease any of our current programs or use other hedging or derivative programs in the future. The extent of our hedges at any given time depends on our assessment of the markets for these commodities, natural gas and diesel fuel, including our assumptions about future prices and currency exchange rates. For example, if we believe market prices for the commodities we use are unusually high, we may choose to hedge less, or even none, of our upcoming requirements. If we fail to hedge and prices or currency exchange rates subsequently increase, or if we institute a hedge and prices or currency exchange rates subsequently decrease, our costs may be greater than anticipated or greater than our competitors’ costs and our financial results could be adversely affected. See “Item 7 - Management’s Discussion and Analysis of Financial Condition and Results of Operations-Quantitative and Qualitative Disclosures About Market Risk” for a discussion of our current hedging and derivatives programs.
We may not be able to successfully identify, evaluate and integrate businesses we may acquire in the future and we may not be able to realize anticipated cost savings, revenue enhancements, or other synergies from such acquisitions.
We may not be able to identify and complete acquisitions in the future, and our failure to identify and complete acquisitions could limit our ability to grow our business beyond our existing brands.
Our acquisition strategy involves a number of risks, including the following:
• we may not be able to find suitable businesses to acquire at affordable valuations or on other acceptable terms;• our acquisition of suitable businesses could be prohibited by U.S. or foreign antitrust laws; and• we may have to obtain additional equity financing or incur additional debt to finance future acquisitions, and such financing
may not be available on terms acceptable to us or at all.
The process of integrating an acquired business, involves risks. These risks include, but are not limited to:
• demands on management related to the significant increase in the size of our business;• diversion of management’s attention from the management of daily operations;• difficulties in the assimilation of different corporate cultures and business practices;• difficulties in conforming the acquired company’s accounting policies to ours;• retaining the loyalty and business of the customers of acquired businesses;• retaining employees that may be vital to the integration of acquired businesses or to the future prospects of the combined
businesses;

18
• difficulties and unanticipated expenses related to the integration of departments, information technology systems, including accounting systems, technologies, books and records, and procedures, and maintaining uniform standards, such as internal accounting controls, procedures, and policies;
• costs and expenses associated with any undisclosed or potential liabilities;• the use of more cash or other financial resources on integration and implementation activities than we expect;• our ability to avoid labor disruptions in connection with any integration, particularly in connection with any headcount
reduction; and• the incurrence of additional debt and related interest expense, contingent liabilities and amortization expenses related to
intangible assets.
Failure to successfully integrate acquired businesses may result in reduced levels of revenue, earnings or operating efficiency than might have been achieved if we had not acquired such businesses.
Our substantial leverage could adversely affect our ability to raise additional capital to fund our operations, limit our ability to react to changes in the economy or our industry, expose us to rising interest rate risk and prevent us from meeting our obligations under our indebtedness.
We are highly leveraged. As of December 29, 2013, our total indebtedness was $2.5 billion. Our high degree of leverage could have important consequences, including:
• requiring a substantial portion of cash flow from operations to be dedicated to the payment of principal and interest on our indebtedness, thereby reducing our ability to use our cash flow to fund our operations, capital expenditures, and future business opportunities or to pay dividends;
• exposing us to the risk of rising interest rates to the extent of borrowings under our senior secured credit facility that are not hedged;
• making it more difficult for us to make payments on our indebtedness;• increasing our vulnerability to general economic and industry conditions;• restricting us from making strategic acquisitions or causing us to make non-strategic divestitures;• subjecting us to restrictive covenants that may limit our flexibility in operating our business;• limiting our ability to obtain additional financing for working capital, capital expenditures, product development, debt
service requirements, acquisitions, and general corporate or other purposes; and• placing us at a competitive disadvantage compared to our competitors who are less highly leveraged.
Despite our significant leverage, we may be able to incur significant additional amounts of debt, which could further exacerbate the risks associated with our significant leverage.
Litigation or claims regarding our trademarks and any other proprietary rights or termination of our material licenses may have a significant, negative impact on our business.
We attempt to protect our intellectual property rights through a combination of trademark, patent, copyright and trade secret laws. We consider our trademarks to be of significant importance to our business and devote resources to the establishment and protection of our trademarks and other intellectual property rights. However, our trademark or other intellectual property applications are not always approved. Third parties may also oppose our intellectual property applications, or otherwise challenge our use of our trademark or other intellectual property. The actions we have taken or will take in the future may not be adequate to prevent violation of our trademark or other proprietary rights by others or prevent others from seeking to block sales of our products as an alleged violation of their trademark or other proprietary rights. We may need to initiate future claims or litigation or defend claims or litigation against us to enforce our trademark or other proprietary rights or to defend ourselves against claimed infringement of the trademark or other proprietary rights of others. Any future claims or litigation of this type, even without merit, could result in a material adverse effect on our business, financial condition or results of operations. Any such future claims or litigation may: (a) be expensive and time consuming to defend; (b) cause us to cease making, licensing or using products that incorporate the challenged intellectual property; (c) require us to rebrand our products or redesign our packaging, if feasible; (d) divert management’s attention and resources; or (e) require us to enter into royalty or licensing agreements in order to obtain the right to use a third party’s intellectual property, which, if required, may not be available to us on acceptable terms or at all. Any inability to use our trademarks or other proprietary rights could harm our business and sales through reduced demand for our products and reduced revenues.
As described in greater detail under “Item 1 - Business-Intellectual Property,” we manufacture our Aunt Jemima, Armour, Swanson and Voila! brands under license agreements from various third parties. The loss of these licenses could have a material adverse effect on our business.

19
We may be unable to drive revenue growth in our key product categories or add products that are in faster growing and more profitable categories.
The food and beverage industry’s overall growth is linked to population growth. Our future results will depend on our ability to drive revenue growth in our key product categories. Because our operations are concentrated in North America, where growth in the food and beverage industry has been moderate, our success also depends in part on our ability to enhance our portfolio by adding innovative new products in faster growing and more profitable categories. Our failure to drive revenue growth in our key product categories or develop innovative products for new and existing categories could materially and adversely affect our profitability, financial condition and results of operations.
We may be subject to product liability claims should the consumption of any of our products cause injury, illness, or death.
We sell food products for human consumption, which involves risks such as product contamination or spoilage, misbranding, product tampering, and other adulteration of food products. Consumption of a misbranded, adulterated, contaminated, or spoiled product may result in personal illness or injury. We could be subject to claims or lawsuits relating to an actual or alleged illness or injury, and we could incur liabilities that are not insured or exceed our insurance coverage. Even if product liability claims against us are not successful or fully pursued, these claims could be costly and time consuming and may require our management to spend time defending the claims rather than operating our business.
A product that has been actually or allegedly misbranded or becomes adulterated could result in product withdrawals or recalls, destruction of product inventory, negative publicity, temporary plant closings, and substantial costs of compliance or remediation. Any of these events, including a significant product liability judgment against us, could result in a loss of demand for our food products, which could have a material adverse effect on our financial condition, results of operations or cash flows.
Due to the seasonality of the business, our revenue and operating results may vary from quarter to quarter.
Our sales and cash flows are affected by seasonal cyclicality. Sales of frozen foods, including frozen vegetables and frozen complete bagged meals, tend to be marginally higher during the winter months. Seafood sales peak during Lent, in advance of the Easter holiday. Sales of pickles, relishes, barbecue sauces, potato chips and salad dressings tend to be higher in the spring and summer months, and demand for Duncan Hines products, Birds Eye vegetables and our pie and pastry fruit fillings tend to be higher around the Easter, Thanksgiving, and Christmas holidays. Since many of the raw materials we process under the Birds Eye and Vlasic brands are agricultural crops, production of these products is predominantly seasonal, occurring during and immediately following the purchase of such crops. We also increase our Duncan Hines inventories in advance of the peak fall selling season. As a result, our inventory levels tend to be higher during August, September, and October, and thus we require more working capital during these months. We are typically a seasonal net user of cash in the third quarter of the calendar year.
For these reasons, sequential quarterly comparisons are not a good indication of our performance or how we may perform in the future. If we are unable to obtain access to working capital or if seasonal fluctuations are greater than anticipated, there could be a material adverse effect on our financial condition, results of operations or cash flows.
We face risks associated with certain pension obligations.
We hold investments in equity and debt securities in our qualified defined benefit pension plans. Deterioration in the value of plan assets, resulting from a general financial downturn or otherwise, could cause an increase in the underfunded status of our defined benefit pension plans, thereby increasing our obligation to make contributions to the plans. The underfunding in our pension plans totaled $47.2 million as of December 29, 2013. The decrease in discount rates from approximately 6% in 2008 to approximately 4.8% as of December 29, 2013 has had a significant impact to our funding status. We have contributed cash significantly in excess of expense for the last three years to improve the funded status of the plans and intend to continue to do so. Changes in interest rates in the future could have a significant effect on our funded status.
Our obligation to make contributions to the pension plans could reduce the cash available for working capital and other corporate uses and may have a material adverse impact on our operations, financial condition and liquidity.
Our financial well-being could be jeopardized by unforeseen changes in our employees’ collective bargaining agreements or shifts in union policy.
We employed approximately 3,700 people as of December 29, 2013, with approximately 52% of our hourly employees unionized. Due to the seasonality of our pickle and vegetable businesses, our employment fluctuates throughout the year, and thus our average number of employees was approximately 4,200 throughout fiscal 2013.

20
In October 2013, negotiations with the union began on the collective bargaining agreement for approximately 480 employees at our Darien, Wisconsin plant. Those negotiations are ongoing and we continue to operate under the existing contract. Our other unionized employees are covered under collective bargaining agreements expiring between April 2014 and October 2022.
Failure to extend or renew our collective bargaining agreements or a prolonged work stoppage or strike at any facility with union employees could have a material adverse effect on our business, financial condition, or results of operations. In addition, we may not be able to reach new agreements upon the expiration of our existing collective bargaining agreements and if we do reach new agreements, such agreements may not be on terms that we consider favorable. Furthermore, labor organizing activities could result in additional employees becoming unionized.
We and our third-party co-packers and suppliers are subject to laws and regulations relating to protection of the environment, worker health, and workplace safety. Costs to comply with these laws and regulations, or claims with respect to environmental, health and safety matters, could have a significant negative impact on our business.
Our operations are subject to various federal, state and local laws and regulations relating to the protection of the environment, including those governing the discharge of pollutants into the air and water, the management and disposal of solid and hazardous materials and wastes, employee exposure to hazards in the workplace and the cleanup of contaminated sites. We are required to obtain and comply with environmental permits for many of our operations, and sometimes we are required to install pollution control equipment or to implement operational changes to limit air emissions or wastewater discharges and/or decrease the likelihood of accidental releases of hazardous materials. We could incur substantial costs, including cleanup costs, civil or criminal fines or penalties, and third-party claims for property damage or personal injury as a result of any violations of environmental laws and regulations, noncompliance with environmental permit conditions or contamination for which we may be responsible that is identified or that may occur in the future. Such costs may be material.
Under federal and state environmental laws, we may be liable for the costs of investigation, removal or remediation of certain hazardous or toxic substances, as well as related costs of investigation and damage to natural resources, at various properties, including our current and former properties and the former properties of our predecessors, as well as offsite waste handling or disposal sites that we or our predecessors have used. Liability may be imposed upon us without regard to whether we knew of or caused the presence of such hazardous or toxic substances. Any such locations, or locations that we may acquire in the future, may result in liability to us under such laws or expose us to third party actions such as tort suits based on alleged conduct or environmental conditions. In addition, we may be liable if hazardous or toxic substances migrate from properties for which we may be responsible to other properties.
In addition to regulations applicable to our operations, failure by any of our co-packers or other suppliers to comply with regulations, or allegations of compliance failure, may disrupt their operations and could result in potential liability. Even if we were able to obtain insurance coverage or compensation for any losses or damages resulting from the non-compliance of a co-packer or supplier with applicable regulations, our brands and reputation may be adversely affected by negative perceptions of our brands stemming from such compliance failures.
We cannot predict what environmental or health and safety legislation or regulations will be enacted in the future or how existing or future laws or regulations will be enforced, administered or interpreted. We also cannot predict the amount of future expenditures that may be required in order to comply with such environmental or health and safety laws or regulations or to respond to environmental claims.
Our operations are subject to regulation by the U.S. Food and Drug Administration (“FDA”), U.S. Department of Agriculture (“USDA”), Federal Trade Commission (“FTC”) and other governmental entities and such regulations are subject to change from time to time which could impact how we manage our production and sale of products. Federal budget cuts could result in furloughs for government employees, including inspectors and reviewers for our plants and products and for our suppliers’ plants and products, which could materially impact our ability to manufacture regulated products.
Our operations are subject to extensive regulation by the FDA, the USDA and other national, state, and local authorities. For example, we are subject to the Food, Drug and Cosmetic Act and regulations promulgated thereunder by the FDA. This comprehensive regulatory program governs, among other things, the manufacturing, composition and ingredients, packaging, and safety of food. Under this program, the FDA regulates manufacturing practices for foods through, among other things, its current “good manufacturing practices” regulations, or cGMPs, and specifies the recipes for certain foods. Our processing facilities and products are subject to periodic inspection by federal, state, and local authorities. In addition, we must comply with similar laws in Canada. In January 2011, the FDA’s Food Safety Modernization Act was signed into law. The law will increase the number of inspections at food facilities in the U.S. in an effort to enhance the detection of food borne illness outbreaks and order recalls of tainted food products. The FTC and other authorities regulate how we market and advertise our products, and we could be the

21
target of claims relating to alleged false or deceptive advertising under federal, state, and foreign laws and regulations. Changes in these laws or regulations or the introduction of new laws or regulations could increase the costs of doing business for us or our customers or suppliers or restrict our actions, causing our results of operations to be adversely affected.
We seek to comply with applicable regulations through a combination of employing internal personnel to ensure quality-assurance compliance (for example, assuring that food packages contain only ingredients as specified on the package labeling) and contracting with third-party laboratories that conduct analysis of products for the nutritional-labeling requirements. Compliance with federal, state and local regulations is costly and time-consuming. Failure to comply with applicable laws and regulations or maintain permits and licenses relating to our operations could subject us to civil remedies, including fines, injunctions, recalls or seizures, as well as potential criminal sanctions, which could result in increased operating costs resulting in a material adverse effect on our operating results and business.
In addition, current budget cuts proposed by the federal government could result in furloughs for government employees, including inspectors and reviewers for our plants and products and for our suppliers’ plants and products. Such furloughs could materially impact our ability to manufacture regulated products, which could have a material adverse effect on our business.
Our business operations could be disrupted if our information technology systems fail to perform adequately.
The efficient operation of our business depends on our information technology systems, some of which are managed by third-party service providers. We rely on our information technology systems to effectively manage our business data, communications, supply chain, order entry and fulfillment, and other business processes. The failure of our information technology systems to perform as we anticipate could disrupt our business and could result in transaction errors, processing inefficiencies, and the loss of sales and customers, causing our business and results of operations to suffer. In addition, our information technology systems may be vulnerable to damage or interruption from circumstances beyond our control, including fire, natural disasters, power outages, systems failures, security breaches, cyber attacks and viruses. Any such damage or interruption could have a material adverse effect on our business.
We have a significant amount of goodwill and intangible assets on our Consolidated Balance Sheets that are subject to impairment based upon future adverse changes in our business and the overall economic environment.
At December 29, 2013, the carrying value of goodwill and tradenames was $1,628.1 million and $1,951.4 million, respectively. We evaluate the carrying amount of goodwill and indefinite-lived intangible assets for impairment on an annual basis, in December, or more frequently if an event occurs or circumstances change that would more likely than not reduce the fair value below its carrying amount. We have recorded impairment charges in recent years, including a $0.5 million tradename impairment in fiscal 2012 and $148.2 million of goodwill and tradename impairments in fiscal 2011. The value of goodwill and intangible assets will be derived from our business operating plans and is susceptible to an adverse change in demand, input costs, general changes in the business, or changes in the overall economic environment and could require an impairment charge in the future.
If we are unable to retain our key management personnel, our future performance may be impaired and our financial condition could suffer as a result.
Our success depends to a significant degree upon the continued contributions of senior management, certain of whom would be difficult to replace. Departure by certain of our executive officers could have a material adverse effect on our business, financial condition, or results of operations. We do not maintain key-man life insurance on any of our executive officers. The services of such personnel may not continue to be available to us.
We may not be able to utilize all of our net operating loss carryovers.
If there is an unfavorable adjustment from an United States Internal Revenue Service (“IRS”) examination (whether as a result of a change in law or IRS policy or otherwise) that reduces any of our NOLCs, cash taxes may increase and impact our ability to pay dividends or make interest payments on our indebtedness. As of December 29, 2013, we had NOLCs for U.S. federal income tax purposes of approximately $1.0 billion. In general, under Section 382 of the Internal Revenue Code of 1986, as amended (the “Code”), a corporation that undergoes an “ownership change” is subject to annual limitations on its ability to utilize its pre-change NOLCs to offset future taxable income. Certain of our existing NOLCs are subject to annual limitations under Section 382 of the Code. In addition, if we undergo an ownership change in the future, our ability to utilize NOLCs could be further limited by Section 382 of the Code. The IPO and our secondary offering in December 2013 may have increased the risk of an ownership change. Moreover, future shifts in ownership of our common stock (including future sales by Blackstone) may cause an ownership change. These limitations and/or our failure to generate sufficient taxable income may result in the expiration of the NOLCs before they are utilized. For further detail on our NOLCs, see Note 16 “Taxes on Earnings” to our consolidated financial statements.

22
Affiliates of Blackstone control us and their interests may conflict with ours or yours in the future.
Affiliates of Blackstone beneficially own approximately 51% of our common stock. As a result, affiliates of Blackstone have the ability to control the vote in any election of directors and thereby control our policies and operations, including the appointment of management, future issuances of our common stock or other securities, the payment of dividends, if any, on our common stock, the incurrence of debt by us, amendments to our amended and restated certificate of incorporation and amended and restated bylaws and the entering into of extraordinary transactions, and their interests may not in all cases be aligned with your interests. In addition, Blackstone may have an interest in pursuing acquisitions, divestitures and other transactions that, in its judgment, could enhance its investment, even though such transactions might involve risks to you. For example, Blackstone could cause us to make acquisitions that increase our indebtedness or cause us to sell revenue-generating assets. Blackstone is in the business of making investments in companies and may from time to time acquire and hold interests in businesses that compete directly or indirectly with us. Blackstone also may pursue acquisition opportunities that may be complementary to our business, and, as a result, those acquisition opportunities may not be available to us. So long as investment funds associated with or designated by affiliates of Blackstone collectively continue to control us, even if such amount is less than 50%, Blackstone will continue to be able to influence or effectively control our decisions and, so long as Blackstone and its affiliates collectively own at least 5% of our outstanding common stock, appoint individuals to our Board of Directors under our stockholders agreement. In addition, Blackstone may determine the outcome of all matters requiring stockholder approval and may cause or prevent a change of control of our Company or a change in the composition of our Board of Directors and may preclude any unsolicited acquisition of our Company. The concentration of ownership could deprive you of an opportunity to receive a premium for your shares of common stock as part of a sale of our Company and ultimately might affect the market price of our common stock.
ITEM 1B. UNRESOLVED STAFF COMMENTS
None.
ITEM 2. PROPERTIES
We own and operate the following 10 manufacturing and warehouse facilities:
Facility location Principal products Principal segment (1) Facility size Darien, Wisconsin Frozen vegetables and complete bagged meals Birds Eye Frozen 747,900 square feetFt. Madison, Iowa Canned meat Duncan Hines Grocery 478,000 square feetImlay City, Michigan Pickles, peppers, relish Duncan Hines Grocery 461,000 square feetFayetteville, Arkansas Frozen dinners and entrées Birds Eye Frozen 390,000 square feetFennville, Michigan Fruit toppings and fillings Duncan Hines Grocery 328,000 square feetJackson, Tennessee Frozen breakfast, frozen pizza, frozen prepared seafood Birds Eye Frozen 324,300 square feetWaseca, Minnesota Frozen vegetables Birds Eye Frozen 290,000 square feetSt. Elmo, Illinois Syrup, barbecue sauce Duncan Hines Grocery 252,000 square feetMattoon, Illinois Bagels, frozen breakfast Birds Eye Frozen 212,000 square feetBerlin, Pennsylvania Snack foods - Snyder of Berlin Specialty Foods 180,000 square feet
(1)We manufacture private label and foodservice products which are included in the Specialty Foods segment, in many of our plants.
Our properties are 100% encumbered under our Senior Secured Credit Facility. Our Senior Secured Credit Facility is described in more detail in Note 10 to the Consolidated Financial Statements.
We also lease a manufacturing plant, warehouse and distribution center in Algona, Washington (Snack foods - Tim's Cascade). In addition, we lease warehouses in Darien, Wisconsin, Waseca, Minnesota and Effingham, Illinois.
We have entered into co-packing (third-party manufacturing) agreements with several manufacturers for certain of our finished products, most significantly our Duncan Hines product line. All of our Duncan Hines cake mix, brownie mix, specialty mix and frosting production equipment, including co-milling, blending and packaging equipment, is located at the contract manufacturers' facilities. On January 29, 2014, we entered into a definitive agreement to acquire the largest Duncan Hines co-manufacturing business located in Centralia, Illinois from Gilster Mary Lee Corporation. See Note 19 to the consolidated financial statements

23
for further details. We believe that our manufacturing facilities, together with our co-packing agreements, provide us with sufficient capacity to accommodate our planned internal growth. The Wish-Bone products acquired by us will continue to be manufactured by Unilever for approximately eighteen months following the consummation of the Wish-Bone acquisition (with an option to extend for an additional six months) to enable us to transition manufacturing of Wish-Bone into our St. Elmo, Illinois location.
In 2011, we made changes in our manufacturing footprint by consolidating our canning operations from our Tacoma, Washington facility into our Ft. Madison, Iowa facility. In 2011, we also consolidated our vegetable processing and packaging operations from our Fulton, New York facility into our Darien, Wisconsin and Waseca, Minnesota facilities. In fiscal 2012, we announced plans to further improve the efficiency of our supply chain by consolidating our Vlasic pickle production into one plant in Imlay City, Michigan. Our other pickle production plant, located in Millsboro, Delaware, ended production in December 2012. In January 2013, we sold our Fulton, New York facility. In July 2013, we sold our Tacoma, Washington facility. On March 14, 2013, we entered into an agreement to sell our Millsboro, Delaware facility for approximately $5 million, subject to completion of due diligence and customary closing conditions. We expect the transaction to close in 2014.
We also lease office space under operating leases (expiring) in Parsippany, New Jersey (April 2023), Cherry Hill, New Jersey (October 2021); Lewisburg, Pennsylvania (Month to Month); Fayetteville, Arkansas (Month to Month); and Mississauga, Ontario (August 2015). We are also obligated on a lease for our former Green Bay, Wisconsin, R&D location (June 2014).
ITEM 3. LEGAL PROCEEDINGS
General
From time to time, we and our operations are parties to, or targets of, lawsuits, claims, investigations, and proceedings, which are being handled and defended in the ordinary course of business. Although the outcome of such items cannot be determined with certainty, our general counsel and management are of the opinion that the final outcome of these matters individually or in the aggregate will not have a material effect on our financial condition, results of operations or cash flows.
ITEM 4. MINE SAFETY DISCLOSURES Not Applicable.
Executive Officers
The following is a list of our executive officers as of December 29, 2013.
Name Age PositionYear First Appointed
Executive OfficerRobert J. Gamgort 51 Chief Executive Officer and Director 2009Craig Steeneck 56 Executive Vice President and Chief Financial Officer 2005Christopher J. Boever 46 Executive Vice President and Chief Customer Officer 2011Mary Beth DeNooyer 43 Executive Vice President and Chief Human Resources Officer 2013Antonio F. Fernandez 54 Executive Vice President and Chief Supply Chain Officer 2011M. Kelley Maggs 62 Executive Vice President, Secretary and General Counsel 2001
Mark L. Schiller 52Executive Vice President and Division President-Birds Eye FrozenDivision 2010
Christopher Slager 44Executive Vice President and Division President-Duncan HinesGrocery Division 2013
John F. Kroeger 58Senior Vice President, Deputy General Counsel and AssistantSecretary 2001
Lynne M. Misericordia 50 Senior Vice President, Treasurer and Assistant Secretary 2001

24
Robert J. Gamgort was appointed Chief Executive Officer effective July 13, 2009. From September 2002 to April 2009, Mr. Gamgort served as North American President for Mars Incorporated, where he managed the company’s portfolio of confectionery, main meal, pet food and retail businesses in North America. Mr. Gamgort joined Mars in 1998, initially serving as Vice President of Marketing for M&M / Mars and then as General Manager of its Chocolate Unit. Prior to joining Mars, Mr. Gamgort served as President of Major League Baseball Properties. Mr. Gamgort began his career at General Foods, which later merged with and became Kraft Foods, where he served in key marketing, sales, corporate strategy, and general management roles. Mr. Gamgort holds an MBA from the Kellogg Graduate School of Management at Northwestern University and a BA in Economics from Bucknell University and studied at the London School of Economics. Mr. Gamgort serves on the Board of Trustees for Bucknell University and the Board of Directors of the Grocery Manufacturers Association.
Craig Steeneck was named Executive Vice President and Chief Financial Officer in July 2007. Mr. Steeneck oversees our financial operations, treasury, tax and information technology. From June 2005 to July 2007, Mr. Steeneck served as Executive Vice President, Supply Chain Finance and IT, where he helped redesign the supply chain to generate savings and improved financial performance. From April 2003 to June 2005, Mr. Steeneck served as Executive Vice President, Chief Financial Officer and Chief Administrative Officer of Cendant Timeshare Resort Group (now Wyndham Worldwide), playing key roles in wide-scale organization of internal processes and staff management. From March 2001 to April 2003, Mr. Steeneck served as Executive Vice President and Chief Financial Officer of Resorts Condominiums International, a subsidiary of Cendant. From October 1999 to February 2001, he was the Chief Financial Officer of International Home Foods Inc. Mr. Steeneck is also a Certified Public Accountant in the State of New Jersey and an honors graduate of the University of Rhode Island.
Christopher J. Boever was named Executive Vice President and Chief Customer Officer in December, 2011. As Sales and Chief Customer Officer, Mr. Boever leads customer relations and sales across our entire Pinnacle Foods brand portfolio. Mr. Boever oversees the sales force and broker organization for Pinnacle’s U.S. organization. From June 2007 to December 2011, Mr. Boever worked at ConAgra Foods, Inc., most recently serving as Senior Vice President Sales, leading the direct and broker sales organization for the Consumer Division. At ConAgra he advanced through positions of increasing responsibility including strategy, planning and operations across a portfolio of frozen, grocery, refrigerated and snack food brands. From January 1991 to June 2007, Mr. Boever worked in various headquarters and field positions at Hormel Foods. Mr. Boever holds a Bachelor of Business Administration degree from the University of Wisconsin.
Mary Beth DeNooyer was named Executive Vice President and Chief Human Resources Officer in May 2013. As Chief Human Resources Officer, Ms. DeNooyer leads all human resources responsibilities throughout the company including organizational development, recruitment and talent management, training, compensation and benefits, employee relations and diversity. From April 2011 through June 2012. Ms. DeNooyer served as Senior Vice President and Chief Human Resources Officer for the division of Sara Lee which was spun-off as Hillshire Brands. From March 2010 to June 2012. Ms. DeNooyer served as Senior Vice President, Compensation and Benefits at Sara Lee. Ms. DeNooyer held Human Resources leadership positions at The Pepsi Bottling Group from 1998 to 2010 and General Mills from 1994 to 1998. Ms. DeNooyer holds a Bachelor’s Degree in Business Administration from Drexel University and a Master’s Degree in Industrial and Labor Relations from Cornell University.
Antonio F. Fernandez was named Executive Vice President and Chief Supply Chain Officer in February 2011. In his role, Mr. Fernandez has overall corporate responsibility for the end-to-end supply chain, including procurement, manufacturing, customer service, warehousing and distribution. Additionally, he oversees Pinnacle’s food quality and safety programs. Prior to joining our Company, Mr. Fernandez was most recently employed with Kraft Foods Inc. as Senior Vice President, Operations Excellence from 2010 to 2011, following the acquisition of Cadbury, plc. Mr. Fernandez worked at Cadbury from 1998 to 2010 in a series of senior management positions, the last being Chief Supply Chain Officer where he was responsible for all aspects of the confectionery company’s global supply chain. Mr. Fernandez’s early career includes positions in manufacturing, procurement, engineering and consulting with Procter & Gamble Co., PepsiCo, Inc. and the Canaan Group, a general management-consulting firm. He holds a Bachelor of Science degree in Chemical Engineering from Lafayette College.
M. Kelley Maggs was named our Executive Vice President and General Counsel in March 2013. Previously, Mr. Maggs served as Senior Vice President, General Counsel and Secretary since Pinnacle’s inception in 2001. Mr. Maggs oversees all legal and corporate secretary activities at Pinnacle. He was associated with affiliates of CDM Investor Group LLC from 1993 until 2007. Prior to his involvement with Pinnacle, Mr. Maggs held the same position with International Home Foods Inc. from November 1996 to December 2000. From 1993 to 1996, Mr. Maggs was employed with Stella Foods, Inc. as Vice President and General Counsel. Prior to that time, he was engaged in the private practice of law in Virginia and New York. Mr. Maggs is a graduate of Niagara University and received his Juris Doctor from George Mason University Law School.
Mark L. Schiller was named Executive Vice President and Division President-Birds Eye Frozen Division in May 2013. In this role, Mr. Schiller manages our frozen portfolio which includes brands such as Birds Eye frozen vegetables, Birds Eye Voila! and

25
Hungry-Man frozen dinners and entrées, Van de Kamp’s and Mrs. Paul’s frozen prepared seafood, and Aunt Jemima frozen breakfasts. From June 2010 to May 2013, Mr. Schiller served as Executive Vice President and Division President-Duncan Hines Grocery. From March 2002 to April 2010, Mr. Schiller worked at PepsiCo as Senior Vice President of Frito Lay New Ventures, President of Quaker Foods and Snacks North America, and Senior Vice President and General Manager of Frito Lay Convenience Foods Division. From 1998 to 2002, Mr. Schiller was Chief Operating Officer and Co-President of Tutor Time Learning Systems, Inc. From 1996 to 1998, Mr. Schiller served as president of Valley Recreation Products, Inc. Mr. Schiller began his career at the Quaker Oats Company in 1985 where he progressed through a number of marketing, sales and supply chain roles. Mr. Schiller holds a Bachelor of Arts degree from Tulane University and an MBA from Columbia University Graduate School of Business.
Christopher B. Slager was named Executive Vice President and Division President Duncan Hines Grocery Division in November 2013. In this role, Mr. Slager leads our grocery portfolio which includes brands such as Duncan Hines cake/brownie mixes and frostings, Vlasic pickles, peppers and relish, Wish-Bone and Western salad dressings, Log Cabin and Mrs. Butterworth’s syrups, Armour canned meats, Brooks and Nalley chili, and Open Pit barbecue sauces. From August 2002 through August 2013, Mr. Slager worked at Campbell Soup Company in a variety of leadership positions, including Vice President and General Manager of North America Foodservice, Vice President of Marketing for Soups and Business Director on a variety of brands. From 2001 to 2002, Mr. Slager was Director of Marketing at Aurora Foods. From 2000 to 2001, Mr. Slager was Director of Marketing at CyberCrop.com. Mr. Slager began his career in 1991 at The Procter & Gamble Company where he held brand management positions on Folgers Coffee and Jif Peanut Butter, in addition to leading new business development teams responsible for developing and launching business propositions for multiple Procter & Gamble brands. Mr. Slager holds a Bachelor of Science degree in Electrical Engineering from Tulane University and an MBA from the A.B. Freeman School of Business at Tulane University.
John F. Kroeger was named our Senior Vice President and Deputy General Counsel in March 2013. Mr. Kroeger joined our Company in 2001 as our Vice President and Deputy General Counsel. In addition, Mr. Kroeger was also the Vice President of Human Resources from 2004 through 2006. Prior to Pinnacle Foods, Mr. Kroeger was the Vice President and General Counsel of Anadigics, Inc. From August 1998 until December 2000, Mr. Kroeger was Vice President and Assistant General Counsel at International Home Foods Inc. Mr. Kroeger has also held legal and general management positions with leading companies in the chemical, pharmaceutical and petroleum-refining industries. Mr. Kroeger is licensed to practice law in the States of New Jersey and Virginia. He is a graduate of the College of William and Mary with the following degrees: BA (Economics), J.D., and a Masters of Law and Taxation.
Lynne M. Misericordia has been Senior Vice President and Treasurer since Pinnacle’s inception in 2001. Ms. Misericordia previously held the position of Treasurer with International Home Foods Inc. from November 1996 to December 2000. Before that, Ms. Misericordia was employed by Wyeth from August 1985 to November 1996 and held various financial positions. Ms. Misericordia received her Bachelor of Arts from Babson College.
PART II
ITEM 5. MARKET FOR REGISTRANT'S COMMON EQUITY, RELATED STOCKHOLDER MATTERS AND ISSUER PURCHASES OF EQUITY SECURITIES
The Company's common stock is listed and principally traded on the New York Stock Exchange under the symbol "PF". The number of holders of record, including individual owners, of the Company's common stock was 93 as of March 3, 2014. This is not the actual number of beneficial owners of the Company's common stock, as shares are held in "street name" by brokers and others on behalf of individual owners. The following graph compares the cumulative total return on our common stock with the cumulative total return of the Standard & Poor’s ("S&P" ) 500 Index and the S&P 500 Packaged Foods and Meats index, which represents our peer group. This graph covers the period from March 28, 2013 (the first day our common stock began trading on the NYSE) through December 27, 2013 (the last trading day of our fiscal year). The graph shows total shareholder return assuming $100 was invested on March 28, 2013 and dividends were reinvested.
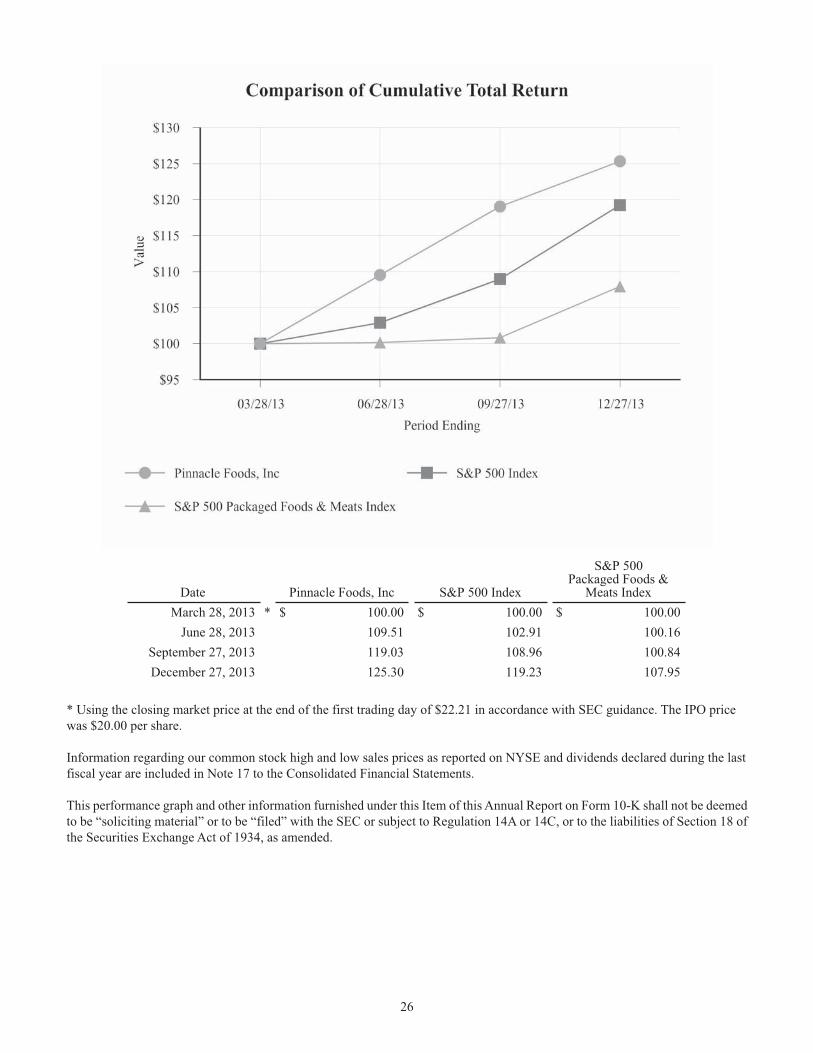
26
Date Pinnacle Foods, Inc S&P 500 Index
S&P 500Packaged Foods &
Meats IndexMarch 28, 2013 * $ 100.00 $ 100.00 $ 100.00
June 28, 2013 109.51 102.91 100.16September 27, 2013 119.03 108.96 100.84December 27, 2013 125.30 119.23 107.95
* Using the closing market price at the end of the first trading day of $22.21 in accordance with SEC guidance. The IPO price was $20.00 per share.
Information regarding our common stock high and low sales prices as reported on NYSE and dividends declared during the last fiscal year are included in Note 17 to the Consolidated Financial Statements.
This performance graph and other information furnished under this Item of this Annual Report on Form 10-K shall not be deemed to be “soliciting material” or to be “filed” with the SEC or subject to Regulation 14A or 14C, or to the liabilities of Section 18 of the Securities Exchange Act of 1934, as amended.

27
ITEM 6. SELECTED FINANCIAL DATA
The following table sets forth selected historical consolidated financial and other operating data for the fiscal years ended December 29, 2013, December 30, 2012, December 25, 2011, December 26, 2010 and December 27, 2009.
The selected financial data as of December 29, 2013 and December 30, 2012 and for the fiscal years ended December 29, 2013, December 30, 2012 and December 25, 2011 have been derived from the audited consolidated financial statements included elsewhere in this Form 10-K. The selected financial data as of December 25, 2011, December 26, 2010 and December 27, 2009 and for the fiscal years ended December 26, 2010 and December 27, 2009 have been derived from audited financial statements not included in this form 10-K.
The selected financial data presented below should be read in conjunction with our Consolidated Financial Statements and the notes to those statements and “Item 7: Management's Discussion and Analysis of Financial Condition and Results of Operations” included elsewhere in this Form 10-K.
($ in millions, other than per share and share data)Fiscal Year
endedFiscal Year
endedFiscal Year
endedFiscal Year
endedFiscal Year
endedDecember 29,
2013December 30,
2012December 25,
2011December 26,
2010December 27,
2009
52 weeks 53 weeks 52 weeks 52 weeks 52 weeks
Statement of operations data:
Net sales $ 2,463.8 $ 2,478.5 $ 2,469.6 $ 2,436.7 $ 1,642.9
Gross profit 654.2 584.5 614.9 602.3 379.3
Earnings before interest and taxes 293.0 283.6 183.3 265.1 146.0
Earnings (loss) before income taxes 160.8 85.2 (24.8) 29.4 24.9
Provision (benefit) for income taxes 71.5 32.7 22.1 7.4 (277.7) (1)
Net earnings (loss) $ 89.3 $ 52.5 $ (46.9) $ 22.0 $ 302.6 (1)
Net earnings (loss) per share:
Basic $ 0.84 $ 0.65 $ (0.58) $ 0.32 $ 6.09 (1)
Diluted $ 0.82 $ 0.61 $ (0.58) $ 0.30 $ 5.51 (1)
Weighted average shares outstanding:
Basic 106,841,198 81,230,630 81,315,848 68,434,982 49,709,367
Diluted 108,618,740 86,494,546 81,315,848 73,638,195 54,902,353
Dividends declared $ 0.57 $ — $ — $ — $ —
Cash flow:
Net cash provided by (used in):
Operating activities $ 262.2 $ 202.9 $ 204.2 $ 257.0 $ 116.2
Investing activities (652.4) (77.7) (109.4) (81.3) (1,366.8)
Financing activities 414.4 (184.1) (59.0) (134.3) 1,319.8
Balance sheet data (at end of period):
Cash and cash equivalents $ 116.7 $ 92.3 $ 151.0 $ 115.3 $ 73.9
Working capital (2) 488.0 404.1 408.7 344.4 364.6
Total assets 5,081.2 4,400.0 4,451.6 4,491.6 4,538.5
Total debt (3) 2,503.2 2,608.9 2,756.0 2,803.5 2,888.7
Total liabilities 3,483.2 3,511.3 3,606.3 3,596.5 3,664.1
Shareholders' equity 1,598.0 888.7 845.4 895.1 874.4

28
($ in millions, other than per share and share data)Fiscal Year
endedFiscal Year
endedFiscal Year
endedFiscal Year
endedFiscal Year
endedDecember 29,
2013December 30,
2012December 25,
2011December 26,
2010December 27,
2009
52 weeks 53 weeks 52 weeks 52 weeks 52 weeks
Other financial data:
Net Sales - North America Retail $ 2,101.9 $ 2,081.7 $ 2,066.9 $ 2,023.9 N/A
Adjusted gross profit (4) 665.0 622.9 643.2 645.7 627.0
Adjusted EBITDA (5) 515.0 426.1 449.7 446.9 390.8
Capital expenditures 84.1 78.3 117.3 81.3 52.0
The selected financial data presented above is impacted by our acquisition of Birds Eye in December 2009
(1) Fiscal 2009 includes a $315.6 million benefit ($6.34 per basic share outstanding and $5.74 per diluted share outstanding) to income taxes related to the reversal of the valuation allowance, as we concluded that it is more likely than not that certain of our US deferred tax assets would be recognized in future years.
(2) Working capital excludes notes payable, revolving debt facility and current portion of long term debt.(3) Total debt includes notes payable, revolving debt facility and current portion of long term debt.(4) Adjusted gross profit is defined and explained in more detail in the section titled "Adjusted Gross Profit" in "Item 7 -
Management’s Discussion and Analysis of Financial Condition and Results of Operations." Our management uses Adjusted gross profit as an operating performance measure. We believe that the presentation of Adjusted gross profit is useful to investors because it is consistent with our definition of Adjusted EBITDA (defined below), a measure frequently used by securities analysts, investors and other interested parties in their evaluation of the operating performance of companies in industries similar to ours. In addition, we also use targets based on Adjusted gross profit as one of the components used to evaluate our management’s performance. Adjusted gross profit is not defined under GAAP, should not be considered in isolation or as substitutes for measures of our performance prepared in accordance with GAAP and is not indicative of gross profit as determined under GAAP.
(5) Adjusted EBITDA is defined and explained in more detail in the section titled "Covenant Compliance" in "Item 7 - Management’s Discussion and Analysis of Financial Condition and Results of Operations." In accordance with the covenant compliance calculation under our debt agreements, Adjusted EBITDA in 2013 includes $54.7 million, which represents preacquisition EBITDA and anticipated synergies from the Wish-Bone Acquisition. Our management uses Adjusted EBITDA as an operating performance measure. We believe that the presentation of Adjusted EBITDA is useful to investors because it is frequently used by securities analysts, investors and other interested parties in their evaluation of the operating performance of companies in industries similar to ours. In addition, targets for Adjusted EBITDA are among the measures we use to evaluate our management’s performance for purposes of determining their compensation under our incentive plans.
ITEM 7: MANAGEMENT’S DISCUSSION AND ANALYSIS OF FINANCIAL CONDITION AND RESULTS OF OPERATIONS
(dollars in millions, except where noted)
You should read the following discussion of our results of operations and financial condition with the “Selected Financial Data” and the audited Consolidated Financial Statements appearing elsewhere in this Form 10-K. This discussion contains forward-looking statements and involves numerous risks and uncertainties, including, but not limited to, those described in the “Item 1A - Risk Factors” section of this Form 10-K. Actual results may differ materially from those contained in any forward-looking statements. See "Disclosure Regarding Forward Looking Statements".
Overview
We are a leading manufacturer, marketer and distributor of high quality, branded food products in North America. We manage the business in three operating segments: Birds Eye Frozen, Duncan Hines Grocery and Specialty Foods. Our Birds Eye Frozen Division manages our Leadership Brands in the United States retail frozen vegetables (Birds Eye), frozen complete bagged meals (Birds Eye Voila!), and frozen prepared seafood (Van de Kamp’s and Mrs. Paul’s) categories, as well as our Foundation Brands in the full-calorie single-serve frozen dinners and entrées (Hungry-Man), frozen pancakes / waffles / French Toast (Aunt Jemima),

29
frozen and refrigerated bagels (Lender’s) and frozen pizza for one (Celeste) categories. Our Duncan Hines Grocery Division manages our Leadership Brands in the baking mixes and frostings (Duncan Hines), liquid and dry-mix salad dressings (Wish-Bone and Western), shelf-stable pickles (Vlasic), and table syrups (Mrs. Butterworth’s and Log Cabin) categories, and our Foundation Brands in the canned meat (Armour, Nalley and Brooks), pie and pastry fillings (Comstock and Wilderness), barbecue sauces (Open Pit) and salad dressing (Bernstein’s) categories as well as all Canadian operations. We refer to the sum of our Birds Eye Frozen Division and our Duncan Hines Grocery Division as our North America Retail businesses. Our Specialty Foods Division consists of snack products (Tim’s Cascade and Snyder of Berlin) and our Foodservice and Private Label businesses.
Within our divisions, we actively manage our portfolio by segregating our business into Leadership Brands and Foundation Brands. Our Leadership Brands enjoy a combination of higher growth, greater potential for value-added innovation and enhanced responsiveness to consumer marketing than do our Foundation Brands. As a result, we focus our brand-building activities on our Leadership Brands. By contrast, we manage our Foundation Brands for revenue and market share stability and for cash flow generation to support investment in our Leadership Brands, reduce our debt and fund other corporate priorities. As a result, we focus spending for our Foundation Brands on brand renovation and targeted consumer and trade programs.
Segment performance is evaluated by the Company’s Chief Operating Decision Maker and is based on earnings before interest and taxes. Transfers between segments and geographic areas are recorded at cost plus markup or at market. Identifiable assets are those assets, including goodwill, which are identified with the operations in each segment or geographic region. Corporate assets consist of prepaid and deferred tax assets. Unallocated corporate expenses consist of corporate overhead such as executive management and finance and legal functions. Product contribution is defined as gross profit less direct to consumer advertising and marketing expenses, selling commission and direct brand marketing overhead expenses.
Business Drivers and Measures
In operating our business and monitoring its performance, we pay attention to trends in the food manufacturing industry and a number of performance measures and operational factors. The industry has experienced volatility in overall commodity prices over the past three years. The industry has managed this commodity inflation by increasing retail prices, which has affected consumer buying patterns and led to lower volumes in many categories. The overall food industry continues to face top line challenges, with overall volume softness and a more challenging environment to fully pass on price increases due to weak consumer demand.
Industry Trends
Growth in our industry is driven primarily by population growth, changes in product selling prices and changes in consumption between out-of-home and in-home eating. In the current economic environment, consumers are looking for value alternatives, which has caused an increase in the percentage of products sold on promotion and a shift from traditional retail grocery to mass merchandisers, club stores and the dollar store channel. We are well positioned in grocery and alternative channels, maintaining strong customer relationships across key retailers in each division.
In order to maintain and grow our business, we must successfully react to, and offer products that respond to, evolving consumer trends, such as changing health trends and focus on convenience and products tailored for busy lifestyles. Incremental growth in the industry is principally driven by product and packaging innovation.
Revenue Factors
Our net sales are driven principally by the following factors:
• Gross sales, which change as a function of changes in volume and list price; and• the costs that we deduct from gross sales to reach net sales, which consist of:
• Cash discounts, returns and other allowances.• Trade marketing expenses, which include the cost of temporary price reductions (“on sale” prices), promotional
displays and advertising space in store circulars.• New product distribution (slotting) expenses, which are the costs of having certain retailers stock a new product,
including amounts retailers charge for updating their warehousing systems, allocating shelf space and in-store systems set-up, among other things.
• Consumer coupon redemption expenses, which are costs from the redemption of coupons we circulate as part of our marketing efforts.
30
Cost Factors
• Costs recorded in Cost of products sold in the consolidated statement of operations include:• Raw materials, such as sugar, cucumbers, broccoli, corn, peas, green beans, carrots, flour (wheat), poultry, seafood,
vegetable oils, shortening, meat and corn syrup, among others, are available from numerous independent suppliers but are subject to price fluctuations due to a number of factors, including changes in crop size, federal and state agricultural programs, export demand, weather conditions and insects, among others.
• Packaging costs. Our broad array of products entails significant costs for packaging and is subject to fluctuations in the price of aluminum, glass jars, plastic trays, corrugated fiberboard, and plastic packaging materials.
• Conversion costs, which include all costs necessary to convert raw materials into finished product. Key components of this cost include direct labor, and plant overhead such as salaries, benefits, utilities and depreciation.
• Freight and distribution. We use a combination of common carriers and inter-modal rail to transport our products from our manufacturing facilities to distribution centers and to deliver products to our customers from both those centers and directly from our manufacturing plants. Our freight and distribution costs are influenced by fuel costs as well as capacity within the industry.
• Costs recorded in marketing and selling expenses in the consolidated statement of operations include:• Advertising and other marketing expenses. These expenses represent advertising and other consumer and trade-
oriented marketing programs. A key strategy is to continue to invest in marketing and public relations that build brand affinity for our Leadership Brands.
• Brokerage commissions and other overhead expenses.
• Costs recorded in administrative and research and development expenses in the consolidated statement of operations include:• Administrative expenses. These expenses consist of personnel and facility charges and also include third party
professional and other services. Our lean, nimble structure and efficient internal processes has enabled us to hold our overhead costs (i.e., selling, general and administrative expenses, excluding marketing investment and one-time items) at approximately 8.5% of net sales.
• Research and Development. These expenses consist of personnel and facility charges and include expenditures on new products and the improvement and maintenance of existing products and processes.
Working Capital
Our working capital is primarily driven by accounts receivable and inventories, which fluctuate throughout the year due to seasonality in both sales and production. See “-Seasonality.” We will continue to focus on reducing our working capital requirements while simultaneously maintaining our customer service levels and fulfilling our production requirements. We have historically relied on internally generated cash flows and temporary borrowings under our revolving credit facility to satisfy our working capital requirements.
Other Factors
Other factors that have influenced our results of operations and may do so in the future include:
• Interest Expense. Our recent IPO and debt refinancings (the “April 2013 Refinancing”) have significantly reduced our leverage and our expected future interest expense. See Note 1 and Note 9 to the consolidated financial statements included elsewhere in this 10-K for further details. However, as a result of the Blackstone Transaction, the Birds Eye Acquisition and the Wish-Bone acquisition, we still have significant indebtedness. Although we expect to continue to reduce our leverage over time, we expect interest expense to continue to be a significant, although much less than before, component of our expenses. See “Liquidity and Capital Resources” below.
• Cash Taxes. We have significant tax-deductible intangible asset amortization and federal and state NOLCs, which resulted in minimal federal and state cash taxes in recent years. We expect continued amortization and utilization of our NOLCs will reduce the majority of our federal and state income tax through 2015 and generate modest annual cash tax savings beyond 2015.
• Acquisitions and Consolidations. We believe we have the expertise to identify and integrate value-enhancing acquisitions to further grow our business. We have successfully integrated acquisitions in the past. We have, however, incurred significant costs in connection with integrating these businesses and streamlining our operations. On October 1, 2013 we acquired Wish-Bone from Unilever PLC for cash consideration of $575.2 million and expect to incur $40.0 to $50.0 million in capital expenditures and $5.0 to $10.0 million of additional expenditures to integrate the business and drive significant

31
synergies and cost efficiencies. As of December 30, 2013, exclusive of the ongoing co-manufacturing agreement, the Wish-Bone business was fully integrated into Pinnacle.
• Impairment of Goodwill, Tradenames and Long-Lived Assets. We test our goodwill and intangible assets annually or more frequently (if necessary) for impairment and have recorded impairment charges in recent years. The value of goodwill and intangibles from the allocation of purchase price from the Blackstone Transaction and the Wish-Bone and Birds Eye acquisitions is derived from our business operating plans at that time and is therefore susceptible to an adverse change that could require an impairment charge. We incurred no impairment charges in the fiscal year ended December 29, 2013. However, we incurred impairment charges in both of the fiscal years ended on December 30, 2012 and December 25, 2011, the amounts of which are discussed in greater detail in "-Impairment of Goodwill and Other Long-Lived Assets" below.
Seasonality
Our sales and cash flows are affected by seasonal cyclicality. Sales of frozen foods, including frozen vegetables and frozen complete bagged meals, tend to be marginally higher during the winter months. Seafood sales peak during Lent, in advance of the Easter holiday. Sales of pickles, relishes, barbecue sauces, potato chips and salad dressings tend to be higher in the spring and summer months, and demand for Duncan Hines products, Birds Eye vegetables and our pie and pastry fruit fillings tend to be higher around the Easter, Thanksgiving, and Christmas holidays. Since many of the raw materials we process under the Birds Eye, Vlasic, Comstock and Wilderness brands are agricultural crops, production of these products is predominantly seasonal, occurring during and immediately following the purchase of such crops. We also increase our Duncan Hines inventories in advance of the peak fall selling season. As a result, our inventory levels tend to be higher during August, September, and October, and thus we require more working capital during these months. Typically, we are a seasonal net user of cash in the third quarter of the calendar year.
Inflation
Historically, inflation did not have a significant effect on us as we had been successful in mitigating the effects of inflation with cost reduction and productivity programs. However inflation became more pronounced in 2011 and 2012, particularly in ingredient costs such as vegetables, flours, shortening/oils, beef, dairy, cocoa, corn sweeteners and energy. In the first half of 2013 the impact of inflation was lower than a year ago but was higher in the second half of 2013, the impact of which will flow through in the first half of 2014. To the extent possible, we offset inflation with productivity programs. However, we spend approximately $1.1 billion each year on ingredients, therefore each 1% change in our weighted average ingredient costs would increase our Cost of products sold by approximately $11.0 million. If we experience significant inflation, price increases may be necessary in order to preserve our margins and returns. Severe increases in inflation could have an adverse impact on our business, financial condition and results of operations.
Restructuring Charges
From time to time, we voluntarily undertake consolidation and restructuring activities in order to optimize our manufacturing footprint, reduce our supply chain costs and increase organizational effectiveness. Refer to Note 9 to the Consolidated Financial Statements for further details.
Impairment of Goodwill and Other Long-Lived Assets
In fiscal 2013 all of our reporting units and tradenames had fair values in excess of their carrying amount and therefore, no impairment charges were recorded.
In fiscal 2012, as a result of reassessing long-term sales projections, we recognized an impairment of $0.5 million on the Bernstein’s tradename. This charge is recorded in Other expense (income), net in the Consolidated Statements of Operations and is reported in the Duncan Hines Grocery Division.
In fiscal year 2011, we recognized goodwill impairments totaling $122.9 million in our Frozen Breakfast, Private Label, and Foodservice reporting units. This impairment represented approximately 8% of our consolidated goodwill balance. The impairment of $51.7 million in our Frozen Breakfast reporting unit was driven by our strategic decision during the fourth quarter to discontinue substantial portions of our low margin products on a prospective basis and the aggressive re-entry of a key competitor. This impairment is reported in the Birds Eye Frozen Division. The impairments of $49.7 million and $21.5 million in our Private Label and Foodservice reporting units, respectively, were driven by the loss of a large customer account during the fourth quarter, our strategic decision to discontinue various lower margin products, as well as compressed operating margins resulting from higher ingredient costs. These impairments are reported in the Specialty Foods Division. All goodwill impairments are recorded in the

32
Goodwill impairment charge line in the Consolidated Statements of Operations. We also recognized an impairment of $23.7 million on the Aunt Jemima tradename, and charges of $1.2 million on other tradenames, which are reported in the Birds Eye Frozen Division and an impairment of $0.4 million on the Bernstein’s tradename that is reported in the Duncan Hines Grocery Division. These impairments are the result of our reassessing the long-term sales projections for the underlying products, which we decreased during our 2011 strategic planning cycle in the fourth quarter as a result of a strategic decision to exit certain products. The charges for tradename impairment are recorded in Other expense (income), net in the Consolidated Statements of Operations.
Items Affecting Year Over Year Results
During fiscal 2013, our earnings before interest and taxes were impacted by certain items. These items included:
• We recorded a redemption premium of $34.2 million related to the early extinguishment of our debt. This is explained in greater detail in Note 6 to the Consolidated Financial Statements and is recorded in Other expense (income), net in the Consolidated Statements of Operations.
• We recorded $18.5 million in charges from the termination at the IPO date of the advisory agreement previously in place with Blackstone. This is explained in greater detail in Note 14 to the Consolidated Financial Statements and is recorded in Administrative expense in the Consolidated Statements of Operations.
• We recorded $13.8 million of Wish-Bone acquisition and integration costs, which included the $6.3 million of charges recorded in Cost of Products sold, resulting from the step-up of inventories acquired and sold during 2013, $6.1 million of merger, acquisition and advisory fees recorded in Other expense (income), net and $1.4 million of integration costs recorded primarily in Administrative expense. This is explained in greater detail in Note 3 to the Consolidated Financial Statements.
• We recorded $7.9 million of equity based compensation, an increase of $7.2 million from fiscal year 2012. This is explained in greater detail in Note 5 to the Consolidated Financial Statements and is primarily recorded in Administration expense.
During fiscal 2013, our net earnings were also impacted by certain items which included the following:
• Our 2013 refinancing resulted in the recognition of approximately $22.5 million of charges to interest expense during fiscal 2013 primarily related to the write-off of deferred financing costs and original issue discount. See Note 10 to the Consolidated Financial Statements for further details.
• Third party interest expense was $102.3 million in 2013, a decrease of $56.3 million from the prior year, as a result of our IPO and 2013 refinancing, which reduced debt balances and lowered interest rates.
• Our 2013 IPO and subsequent refinancing resulted in discontinuation of hedge accounting for certain interest rate swaps in place at the time resulting in a $2.8 million charge to interest expense ($1.7 million, net of tax benefits) and a $9.1 million non-cash charge to the provision for income tax expenses. See Note 12 to the Consolidated Financial Statements for further details.

33
During fiscal 2012, our earnings before interest and taxes were impacted by certain items. These items included:
• We recorded restructuring charges totaling $32.0 million related to the closure of manufacturing facilities in Millsboro, Delaware ($26.3 million), Fulton, New York ($2.6 million) and Tacoma, Washington ($0.3 million), and the Green Bay, Wisconsin research facility ($2.8 million). Restructuring charges include severance, depreciation and facility closure costs which are explained in greater detail in Note 9 to the Consolidated Financial Statements. In addition, we recorded $8.0 million of restructuring related expenses, which include plant enhancement expenses, removal and transfer of equipment and consulting and engineering costs for restructuring projects. These costs are primarily recorded in Cost of products sold in the Consolidated Statements of Operations.
• We recorded charges, net of insurance recoveries, of $2.1 million, related to the voluntary recall of certain Aunt Jemima frozen pancakes due to potential cross contamination with soy protein which may cause an allergic reaction in people who have a soy allergy. This is explained in greater detail in Note 13 to the Consolidated Financial Statements. The charges are primarily recorded as a reduction of Net Sales in the Consolidated Statements of Operations.
• We recorded a redemption premium of $14.3 million related to the early extinguishment of our debt. This is explained in greater detail in Note 6 to the Consolidated Financial Statements and is recorded in Other expense (income), net in the Consolidated Statements of Operations.
• As described earlier, during fiscal 2012, we recognized a trade name impairment of $0.5 million which is recorded in Other expense (income), net in the Consolidated Statements of Operations.
During fiscal 2012, our net earnings were impacted by certain items which included the following:
• Our refinancings resulted in the recognition of approximately $17.4 million of charges to interest expense during fiscal 2012. See Note 10 to the Consolidated Financial Statements for further details.
During fiscal 2011, our earnings before interest and taxes were impacted by certain items. These items included:
• As described earlier, during 2011, we recognized $122.9 million of goodwill impairment and $25.3 million of trade name impairment, totaling $148.2 million. These charges are recorded in Goodwill impairment charge and in Other expense (income), net in the Consolidated Statements of Operations.
• We recorded costs of $11.0 million and $6.6 million, respectively, related to the closure of the Fulton, New York and Tacoma, Washington plants. These costs are recorded in Cost of products sold in the Consolidated Statements of Operations.
• In June 2010, Lehman Brothers Special Financing (LBSF) initiated a claim against us in LBSF’s bankruptcy proceeding related to certain derivative contracts which we had earlier terminated due to LBSF’s default as a result of its bankruptcy filing in 2008. In May 2011, we and LBSF agreed in principle to a settlement of LBSF’s claim. Under the terms of the settlement, we made a payment of $8.5 million during the third quarter of 2011 in return for LBSF’s full release of its claim. This charge is recorded in Other expense (income), net in the Consolidated Statements of Operations.
• We recorded expenses of $1.1 million related to the voluntary recall of certain Aunt Jemima frozen pancakes due to potential cross contamination with soy protein which may cause an allergic reaction in people who have a soy allergy. This is explained in greater detail in Note 13 to the Consolidated Financial Statements.
During fiscal 2011, our net loss was impacted by certain items. These items included:
• As described earlier, during 2011, we recognized goodwill and trade name impairments totaling $148.2 million. Of these impairments, $100.2 million are not deductible for income tax purposes. Therefore, we realized a very high effective tax rate of (89.1%) during 2011.
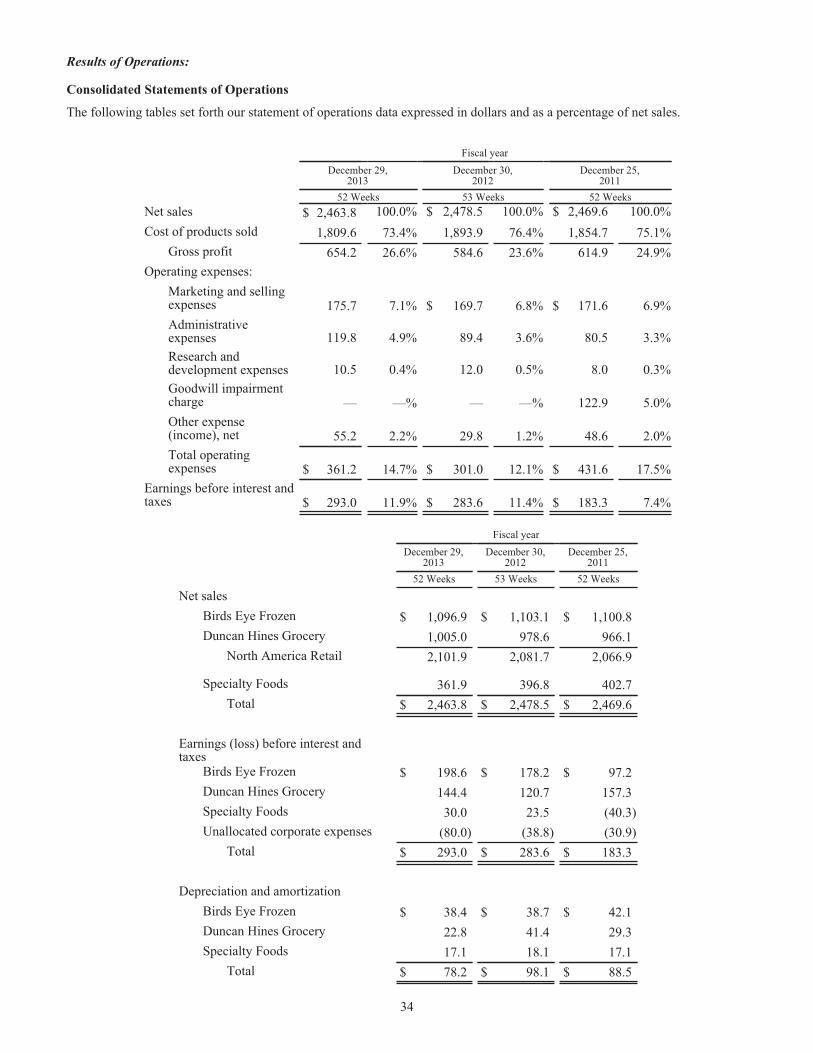
34
Results of Operations:
Consolidated Statements of Operations
The following tables set forth our statement of operations data expressed in dollars and as a percentage of net sales.
Fiscal yearDecember 29,
2013December 30,
2012December 25,
201152 Weeks 53 Weeks 52 Weeks
Net sales $ 2,463.8 100.0% $ 2,478.5 100.0% $ 2,469.6 100.0%Cost of products sold 1,809.6 73.4% 1,893.9 76.4% 1,854.7 75.1%
Gross profit 654.2 26.6% 584.6 23.6% 614.9 24.9%Operating expenses:
Marketing and sellingexpenses 175.7 7.1% $ 169.7 6.8% $ 171.6 6.9%Administrativeexpenses 119.8 4.9% 89.4 3.6% 80.5 3.3%Research anddevelopment expenses 10.5 0.4% 12.0 0.5% 8.0 0.3%Goodwill impairmentcharge — —% — —% 122.9 5.0%Other expense(income), net 55.2 2.2% 29.8 1.2% 48.6 2.0%Total operatingexpenses $ 361.2 14.7% $ 301.0 12.1% $ 431.6 17.5%
Earnings before interest andtaxes $ 293.0 11.9% $ 283.6 11.4% $ 183.3 7.4%
Fiscal yearDecember 29,
2013December 30,
2012December 25,
201152 Weeks 53 Weeks 52 Weeks
Net salesBirds Eye Frozen $ 1,096.9 $ 1,103.1 $ 1,100.8Duncan Hines Grocery 1,005.0 978.6 966.1
North America Retail 2,101.9 2,081.7 2,066.9
Specialty Foods 361.9 396.8 402.7Total $ 2,463.8 $ 2,478.5 $ 2,469.6
Earnings (loss) before interest andtaxes
Birds Eye Frozen $ 198.6 $ 178.2 $ 97.2Duncan Hines Grocery 144.4 120.7 157.3Specialty Foods 30.0 23.5 (40.3)Unallocated corporate expenses (80.0) (38.8) (30.9)
Total $ 293.0 $ 283.6 $ 183.3
Depreciation and amortizationBirds Eye Frozen $ 38.4 $ 38.7 $ 42.1Duncan Hines Grocery 22.8 41.4 29.3Specialty Foods 17.1 18.1 17.1
Total $ 78.2 $ 98.1 $ 88.5

35
Adjustments to Earnings (loss) before Interest and Taxes and Depreciation and Amortization used in the calculation of Adjusted EBITDA as described below in the "Covenant Compliance" section, by Segment, are as follows:
Fiscal yearDecember 29,
2013December 30,
2012December 25,
2011
52 Weeks 53 Weeks 52 Weeks
Adjustments to Earnings (loss) before interest and taxesBirds Eye Frozen $ 9.1 $ 11.2 $ 86.7Duncan Hines Grocery 23.0 10.4 10.6Specialty Foods 0.9 7.0 72.2Unallocated corporate expenses 56.1 15.8 8.5
Adjustments to Depreciation and amortizationBirds Eye Frozen $ — $ 3.4 9.3Duncan Hines Grocery — 16.8 4.8Specialty Foods — 1.6 —
The following summarizes the benefit the 53rd week had on key performance metrics in 2012.
Impact of 53rd Week in 2012 (in millions except per share amount)
$ Net Sales EBITNet Sales $ 28.4 Birds Eye Frozen $ 11.5 $ 2.6EBIT $ 5.5 Duncan Hines Grocery $ 11.7 $ 2.7Net Earnings $ 2.1 North America Retail $ 23.2 $ 5.3Diluted EPS $ 0.02 Specialty Foods 5.2 1.2
Corporate — (1.0) Total $ 28.4 $ 5.5
Fiscal year ended December 29, 2013 compared to the fiscal year ended December 30, 2012
Net sales
Net sales were $2.46 billion for the fiscal year ended December 29, 2013, a decline of 0.6% compared to net sales of $2.48 billion in the comparable prior-year period. Impacting the comparison of fiscal 2013 to fiscal 2012 was a 1.1% decline in net sales resulting from the 2013 fiscal year being a fifty-two week year as compared to the fifty-three weeks in the 2012 fiscal year. Excluding the impact of the fifty-third week, net sales increased 0.6% primarily reflecting the benefit from the Wish-Bone acquisition partially offset by a decline in our Specialty Division attributable to planned lower sales of private label canned meat in addition to our 2012 exit of the lower margin un-branded pickle business. This increase reflected a 1.6% increase in net sales from the acquisition, a 0.9% decline from volume/mix, lower net pricing of 0.2%, a 0.1% decrease from foreign exchange, and a 0.2% benefit from the previously anticipated insurance recovery of rehabilitation expenses incurred after last year's Aunt Jemima voluntary product recall which was mostly recorded as a reduction of trade promotions.
Net sales in our North American Retail businesses increased $20.2 million, or 1.0% from the prior year. Excluding the impact of the 53rd week in the prior-year period, net sales in fiscal 2013 increased 2.1% as compared to fiscal 2012, reflecting a 1.8% increase in sales from the acquisition, a 0.5% increase from volume/mix, lower net pricing of 0.3%, a 0.1% decrease from foreign exchange and a 0.2% benefit from the aforementioned recovery.

36
Birds Eye Frozen Division:
Net sales in the fifty-two week fiscal year ended December 29, 2013 were $1,096.9 million, a decline of $6.2 million, or 0.6% compared to net sales of $1,103.1 million in the comparable prior-year period. Excluding the impact of the 53rd week in the prior-year period, net sales increased 0.5% as compared to the prior year, reflecting a 0.1% increase from volume/mix and a 0.4% benefit from the aforementioned recovery. During the period we realized strong sales of our Birds Eye Voila! complete bagged meals. Sales for the period were also impacted by gains in sales in our Birds Eye frozen vegetables, which included our new Recipe Ready line as well as increased sales of Lender's bagels. These increases were partially offset by lower sales in our Aunt Jemima breakfast products, Hungry Man frozen meals and Celeste pizza.
Duncan Hines Grocery Division:
Net sales in the fifty-two week fiscal year ended December 29, 2013 were $1,005.0 million, an increase of $26.4 million, or 2.7% from the prior year. Excluding the impact of the 53rd week in the prior-year period, net sales increased 3.9% as compared to the prior year period, reflecting a 3.8% increase in sales from the Wish-Bone acquisition, a 0.9% increase from volume/mix partially offset by lower net pricing of 0.5% and a 0.3% decrease from foreign exchange. During the year we realized strong sales from our Mrs. Butterworth's and Log Cabin syrups. Also positively impacting net sales for the year were increased sales of Vlasic pickles and our Comstock and Wilderness pie/pastry fruit fillings in addition to increased sales from our Canadian business. These increases were partially offset by lower sales of Duncan Hines frostings due to heightened competitive activity and comparison against last year's introduction of Duncan Hines Frosting Creations and lower sales of our Nalley chili.
Specialty Foods Division:
Net sales in the fifty-two week fiscal year ended December 29, 2013 were $361.9 million, a decline of $34.9 million, or 8.8%, from the prior year. Excluding the impact of the 53rd week in the prior-year period, net sales decreased 7.5% as compared to the prior year period, reflecting a 8.1% decrease from volume/mix partially offset by higher net pricing of 0.6%. The decrease was primarily attributable to planned lower sales of private label canned meat in addition to our exit of the lower margin un-branded pickle business.
Gross profit
Gross profit for the year ended December 29, 2013 was $654.2 million, or 26.6% of net sales, compared to $584.6 million, or 23.6% of net sales, in the comparable prior-year period. The increase in gross profit as a percentage of net sales was largely driven by improved productivity, favorable product mix and lower restructuring charges and restructuring-related expenses.
The following table outlines the factors resulting in the increase in gross profit in fiscal 2013 of $69.6 million and the 3.0 percentage-point increase in gross margin percentage.
$ % net salesProductivity including footprint consolidation $ 71.0 2.9%Favorable product mix 21.6 0.8Lower restructuring and restructuring related costs 33.7 1.4Inflation (principally higher commodity costs) (47.0) (1.7)Lower net price realization, net of slotting (0.3) —Other (7.0) (0.4)
Subtotal 72.0 3.0%Impact of the 53rd week (7.1)Higher sales volume, including Wish-Bone 4.7
$ 69.6
Marketing and selling expenses
Marketing and selling expenses were $175.7 million, or 7.1% of net sales, for the fiscal year ended December 29, 2013, compared to $169.7 million, or 6.8% of net sales, for fiscal 2012. We continue to focus our marketing, which includes advertising, on our Leadership Brands, such as Birds Eye frozen vegetables and Duncan Hines. The fiscal year ended December 29, 2013 was also
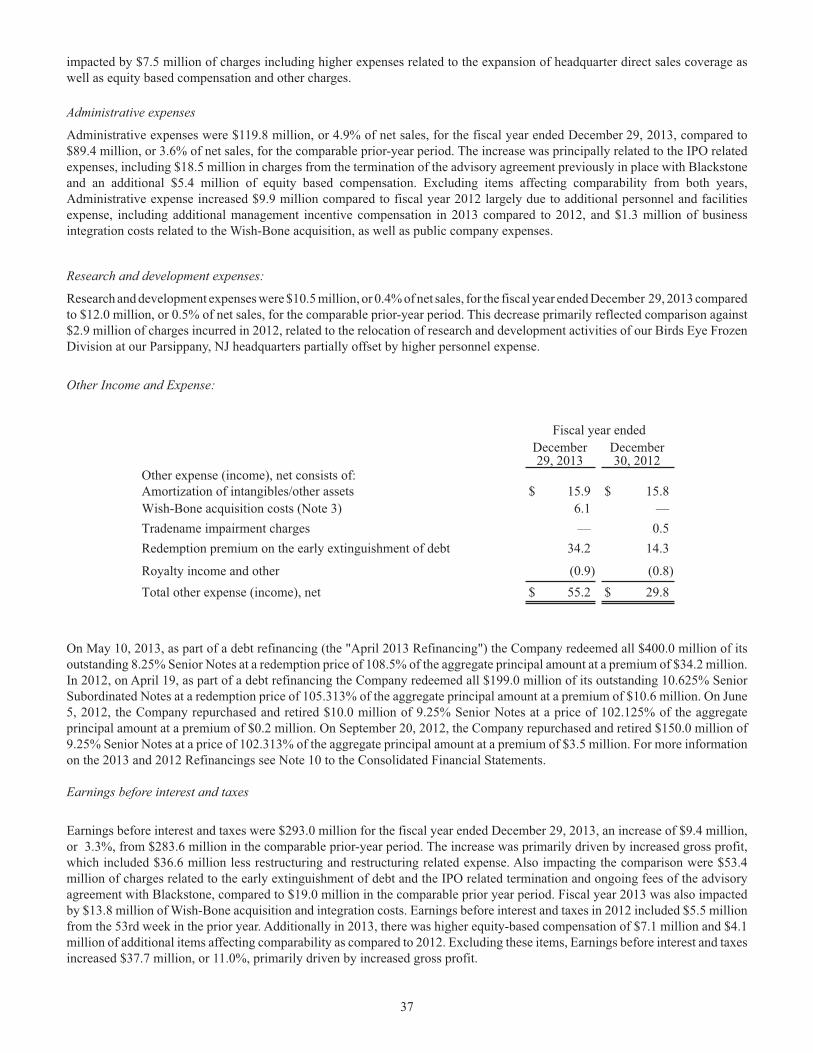
37
impacted by $7.5 million of charges including higher expenses related to the expansion of headquarter direct sales coverage as well as equity based compensation and other charges.
Administrative expenses
Administrative expenses were $119.8 million, or 4.9% of net sales, for the fiscal year ended December 29, 2013, compared to $89.4 million, or 3.6% of net sales, for the comparable prior-year period. The increase was principally related to the IPO related expenses, including $18.5 million in charges from the termination of the advisory agreement previously in place with Blackstone and an additional $5.4 million of equity based compensation. Excluding items affecting comparability from both years, Administrative expense increased $9.9 million compared to fiscal year 2012 largely due to additional personnel and facilities expense, including additional management incentive compensation in 2013 compared to 2012, and $1.3 million of business integration costs related to the Wish-Bone acquisition, as well as public company expenses.
Research and development expenses:
Research and development expenses were $10.5 million, or 0.4% of net sales, for the fiscal year ended December 29, 2013 compared to $12.0 million, or 0.5% of net sales, for the comparable prior-year period. This decrease primarily reflected comparison against $2.9 million of charges incurred in 2012, related to the relocation of research and development activities of our Birds Eye Frozen Division at our Parsippany, NJ headquarters partially offset by higher personnel expense.
Other Income and Expense:
Fiscal year ended
December29, 2013
December30, 2012
Other expense (income), net consists of:Amortization of intangibles/other assets $ 15.9 $ 15.8Wish-Bone acquisition costs (Note 3) 6.1 —Tradename impairment charges — 0.5Redemption premium on the early extinguishment of debt 34.2 14.3
Royalty income and other (0.9) (0.8)Total other expense (income), net $ 55.2 $ 29.8
On May 10, 2013, as part of a debt refinancing (the "April 2013 Refinancing") the Company redeemed all $400.0 million of its outstanding 8.25% Senior Notes at a redemption price of 108.5% of the aggregate principal amount at a premium of $34.2 million. In 2012, on April 19, as part of a debt refinancing the Company redeemed all $199.0 million of its outstanding 10.625% Senior Subordinated Notes at a redemption price of 105.313% of the aggregate principal amount at a premium of $10.6 million. On June 5, 2012, the Company repurchased and retired $10.0 million of 9.25% Senior Notes at a price of 102.125% of the aggregate principal amount at a premium of $0.2 million. On September 20, 2012, the Company repurchased and retired $150.0 million of 9.25% Senior Notes at a price of 102.313% of the aggregate principal amount at a premium of $3.5 million. For more information on the 2013 and 2012 Refinancings see Note 10 to the Consolidated Financial Statements.
Earnings before interest and taxes
Earnings before interest and taxes were $293.0 million for the fiscal year ended December 29, 2013, an increase of $9.4 million, or 3.3%, from $283.6 million in the comparable prior-year period. The increase was primarily driven by increased gross profit, which included $36.6 million less restructuring and restructuring related expense. Also impacting the comparison were $53.4 million of charges related to the early extinguishment of debt and the IPO related termination and ongoing fees of the advisory agreement with Blackstone, compared to $19.0 million in the comparable prior year period. Fiscal year 2013 was also impacted by $13.8 million of Wish-Bone acquisition and integration costs. Earnings before interest and taxes in 2012 included $5.5 million from the 53rd week in the prior year. Additionally in 2013, there was higher equity-based compensation of $7.1 million and $4.1 million of additional items affecting comparability as compared to 2012. Excluding these items, Earnings before interest and taxes increased $37.7 million, or 11.0%, primarily driven by increased gross profit.

38
Birds Eye Frozen Division:
Earnings before interest and taxes increased $20.5 million, or 11.5%, to $198.6 million for the fiscal year ended December 29, 2013, primarily reflecting higher gross profit, driven by higher productivity including the benefit from our plant consolidation projects and the benefit of the aforementioned recovery and related charges in 2012. Earnings before interest and taxes were also impacted by lower charges of $7.5 million in fiscal year 2013 related to our plant consolidation projects and relocating research and development activities to our Parsippany, NJ location. Earnings before interest and taxes in 2012 included $2.6 million from the 53rd week in the prior year. The results also included an additional $1.9 million of other items affecting comparability, largely comprised of higher expenses related to the expansion of headquarter direct sales coverage, increased equity-based compensation expense and employee severance. Excluding these items that affected comparability, Earnings before interest and taxes for fiscal 2013 increased by $17.5 million, or 9.2%, compared to the prior year period.
Duncan Hines Grocery Division:
Earnings before interest and taxes increased $23.7 million, or 19.6%, to $144.4 million primarily reflecting strong productivity, lower plant consolidation charges partially offset by Wish-Bone acquisition and integration costs. Charges of $2.6 million and $23.6 million in fiscal years 2013 and 2012, respectively, related to our plant consolidation projects. Partially offsetting these lower plant consolidation project charges were $13.8 million of Wish-Bone transaction and integration costs. Earnings before interest and taxes in 2012 included $2.7 million from the 53rd week in the prior year. Also impacting Earnings before interest and taxes in fiscal 2013 were an additional $3.0 million of other items affecting comparability, largely comprised of higher expenses related to the expansion of headquarter direct sales coverage, increased equity-based compensation expense and employee severance. Excluding these items that affected comparability, Earnings before interest and taxes for fiscal 2013 increased by $22.1 million, or 15.2%, compared to the prior year period, including a positive contribution from the Wish-Bone acquisition excluding transaction and integration costs.
Specialty Foods Division:
Earnings before interest and taxes increased $6.5 million, or 27.5%, to $30.0 million, primarily reflecting charges of $8.1 million recognized in the fiscal year 2012 resulting from the exit of the lower-margin un-branded pickle business. Earnings before interest and taxes in 2012 included $1.2 million from the 53rd week in the prior year. Excluding items that affected comparability, Earnings before interest and taxes for fiscal 2013 remained flat as compared to the prior year period, as lower sales were offset by improved mix.
Unallocated corporate expenses:
Unallocated corporate expenses increased $41.2 million, or 106.2%, to $80.0 million, primarily reflecting $34.2 million of charges related to the early extinguishment of debt and $5.4 million of additional equity based compensation.
Interest Expense, net
Net interest expense declined 33.4% or $66.2 million from $198.4 million in the fiscal year ended December 30, 2012 to $132.2 million in the fiscal year ended December 29, 2013. Included in net interest expense in both periods are charges associated with our 2013 refinancing and our 2012 refinancing. These items which total $22.5 million in 2013 and $17.5 million in 2012 are described below. Excluding these items from both periods, net interest expense declined by $71.2 million principally related to lower interest expense of $61.9 million related to lower outstanding balances as well as lower interest rates on our Notes and $9.3 million lower expense on interest rate swap agreements. These lower balances during fiscal 2013 were partially offset by the addition of Term Loan H in the fourth quarter of 2013, which partially financed the Wish-Bone acquisition.
Our 2013 refinancing included using the net proceeds of $623.9 million ($667.0 million of gross proceeds net of $43.1 million of underwriting discounts) from our April 3, 2013 IPO along with cash on hand to pay down $667.0 million of debt, which included all $465.0 million of our 9.25% Senior Notes on April 15, 2013 and $202.0 million of Tranche B Term Loans. In addition, on April 29, 2013, the Company entered into the Second Amended and Restated Credit Agreement which provided for the issuance of $1.63 billion of Tranche G Term Loans due 2020 and the extension of the due date of our revolving credit facility to 2018. The proceeds were used to repay all previous outstanding borrowings under the Senior Secured Credit Facility. This refinancing resulted in our recognizing approximately $22.5 million of charges to interest expense during the second quarter of 2013. The charges recognized consisted of $14.9 million of existing deferred financing costs and original issue discounts as well as $4.8 million of new costs incurred in connection with the transaction that were recorded directly to interest expense and a $2.8 million charge resulting from the dedesignation and termination of interest rate swaps.
In 2012, on April 17 we entered into an amended and restated credit agreement, which provided for the extension of certain of our Tranche B Term Loans and our Revolving Credit facility, the repayment of our Tranche D term loans and the issuance of new

39
Tranche E term loans. In connection with this refinancing, we also redeemed all of our outstanding 10.625% Senior Subordinated Notes. This refinancing resulted in the recognition of approximately $14.8 million of charges to interest expense during fiscal 2012. The charges recognized consisted of $7.3 million of write downs of existing deferred financing costs as well as $7.5 million of new costs incurred in connection with the transaction that were recorded directly to interest expense.
In 2012, on August 30 the Company entered into the first amendment to the amended and restated credit agreement, which provided for the issuance of new Tranche F term loans. In connection with this refinancing, on September 20, 2012 we also redeemed $150 million aggregate principal of our 9.25% senior notes. This refinancing resulted in the recognition of approximately $2.6 million of charges to interest expense during the third quarter for write downs of existing deferred financing costs.
We utilize interest rate swap agreements to reduce the potential exposure to interest rate movements and to achieve a desired proportion of variable versus fixed rate debt. Any gains or losses realized on the interest rate swap agreements, excluding the Accumulated other comprehensive (loss) earnings ("AOCL") portion, are recorded as an adjustment to interest expense. Included in net interest expense was $1.3 million and $10.5 million for the fiscal years 2013 and 2012, respectively, recorded from losses on interest rate swap agreements.
Provision (benefit) for income taxes
The effective tax rate was 44.4% for the fiscal year ended December 29, 2013 compared to 38.4% for the fiscal year ended December 30, 2012. The effective rate difference is primarily driven by the Company discontinuing hedge accounting at the time of the April 2013 refinancing for interest rate swaps in effect at that time (Note 12). Accordingly, changes to the fair value and associated tax effects accumulated in other comprehensive income were recognized to the statement of operations during the second quarter of 2013, resulting in a $9.1 million non-cash deferred tax charge to the provision for income taxes. Excluding the impact of the charge, the effective tax rate would be 38.8%.
Under Section 382 of the Code, the Company is a loss corporation. Section 382 of the Code places limitations on our ability to use certain Net operating loss carryforward ("NOLC") to offset income. The annual NOL limitation is approximately $17.0 million to $23.0 million, subject to other rules and restrictions. Our NOLCs and certain other tax attributes generated prior to December 23, 2009 may not be utilized to offset Birds Eye income from recognized built in gains through December 2014 pursuant to Section 384 of the Code. See Note 16 to the Consolidated Financial Statements.
Fiscal year ended December 30, 2012 compared to fiscal year ended December 25, 2011
Net sales
Net sales were $2.48 billion for the fiscal year ended December 30, 2012, an increase of 0.4% compared to net sales of $2.47 billion in the comparable prior-year period. This performance reflected higher net pricing of 1.6%, stemming from pricing actions that were previously initiated which were more than offset by a 2.3% decline from volume/mix. Also impacting fiscal 2012 performance was a 1.1% increase in net sales resulting from the 2012 fiscal year being a fifty-three week year compared to the fifty-two weeks in the 2011 fiscal year.
Net sales in our North American Retail businesses increased 0.7% from the prior year, reflecting increases in Birds Eye Steamfresh vegetables, seafood, Hungry Man frozen meals, Lender's bagels, Duncan Hines products and Armour canned meats which were offset by lower sales in Vlasic pickles, Aunt Jemima frozen breakfast products and Celeste pizza. The overall food industry continues to face top line challenges, with overall volume softness and a more challenging environment to fully pass on price increases due to weak consumer demand. Partially offsetting these factors was the benefit of innovative new products launched during fiscal 2012, such as Duncan Hines Frosting Creations and Vlasic Farmer's Garden shelf stable farmers market quality pickles. Despite the challenging consumer environment, we held or grew market share, as previously defined, on brands representing approximately 64% of our product contribution.
Birds Eye Frozen Division:
Net sales in the fifty-three week fiscal year ended December 30, 2012 were $1,103.1 million, an increase of $2.3 million, or 0.2% from the prior year, reflecting higher net pricing of 1.7% partially offset by a 1.3% decrease from volume/mix. The Aunt Jemima product recall also reduced sales by 0.2% for the year. Higher sales of Birds Eye Steamfresh vegetables, Hungry Man frozen meals, Lender's bagels, as well as increased Mrs Paul's and Van de Kamp's seafood sales, were offset by lower sales in our Aunt Jemima breakfast products and Celeste pizza.

40
Duncan Hines Grocery Division:
Net sales in the fifty-three week fiscal year ended December 30, 2012 were $978.6 million, an increase of $12.5 million, or 1.3% from the prior year, reflecting higher net pricing of 1.5% partially offset by a 0.1% decrease from volume/mix and a 0.1% decrease from foreign exchange. During the year we realized strong sales from our Duncan Hines brand driven by the launch of our new Frosting Creations products. Also positively impacting net sales for the year was expanded distribution of Armour canned meats. These increases were offset by lower sales in our Vlasic and syrup brands. Vlasic was negatively impacted by introductory new distribution costs for its new Farmers Garden farmers market quality pickles which have been well received in the market place.
Specialty Foods Division:
Net sales in the fifty-three week fiscal year ended December 30, 2012 were $396.8 million, a decline of $6.0 million, or 1.5%, from the prior year. The decrease is primarily attributable to lower sales in our Private Label business as we de-emphasized lower margin un-branded products and the exit from the lower-margin un-branded Foodservice pickle business during fiscal 2012. The decline reflected a 1.9% increase from higher net pricing more than offset by a 3.4% decrease from volume/mix.
Gross profit
Gross profit for the year ended December 30, 2012 was $584.6 million, or 23.6% of net sales, compared to $614.9 million, or 24.9% of net sales, in the comparable prior-year period. Impacting gross profit in both periods were restructuring charges and restructuring-related expenses. In fiscal 2012 these totaled $37.0 million, comprised of restructuring charges of $30.0 million ($9.0 million in cash and $21.0 million non-cash) and related expenses of $7.0 million. In fiscal 2011 these totaled $25.3 million, comprised of restructuring charges of $17.6 million ($2.2 million in cash and $15.4 million non-cash) and related expenses of $7.7 million. The following table outlines the factors resulting in the decrease in gross profit in fiscal 2012 of $30.3 million and the 1.3 percentage-point decrease in gross margin percentage.
.
$ % net salesHigher net selling prices, net of slotting $ 45.2 1.3 %Productivity including footprint consolidation 71.0 2.9Favorable product mix 9.1 0.2Mark to market gains on financial instruments 2.9 0.1Inflation (principally higher commodity costs) (130.6) (5.2)Higher restructuring and restructuring related costs (11.7) (0.5)Higher management compensation expense (2.2) (0.1)Higher depreciation expense (1.1) —
Subtotal (17.4) (1.3)%Impact of the 53rd week 7.1Lower sales volume (20.0)
$ (30.3)
Marketing and selling expenses
Marketing and selling expenses were $169.7 million, or 6.8% of net sales, for the fiscal year ended December 30, 2012, compared to $171.6 million, or 6.9% of net sales, for fiscal 2011. During the second half of fiscal 2012, in response to competition in the marketplace, we shifted some planned advertising spending to trade marketing expense. As a result, advertising and other consumer spending in fiscal 2012 declined by $9.6 million but was focused on new product introductions in our Duncan Hines and Birds Eye leadership brands. Also impacting Marketing and selling expenses was $3.9 million of lower management incentive compensation expense in fiscal 2011.
Administrative expenses
Administrative expenses were $89.4 million, or 3.6% of net sales, for the fiscal year ended December 30, 2012, compared to $80.5 million, or 3.3% of net sales, for the comparable prior-year period. This increase was principally due to $4.3 million lower

41
management incentive compensation expense in fiscal 2011. The total impact of lower management incentive compensation expense in fiscal 2011 on all expense lines throughout the Statement of Operations was $10.7 million. Also impacting Administrative expense in fiscal 2012 was higher depreciation expense of $1.5 million in fiscal 2012, principally related to the new Parsippany, New Jersey headquarters and $0.5 million of lease termination costs incurred in fiscal 2012 in connection with the completion of our Headquarters office move.
Research and development expenses:
Research and development expenses were $12.0 million, or 0.5% of net sales, for the fiscal year ended December 30, 2012 compared to $8.0 million, or 0.3% of net sales, for the comparable prior-year period. This increase was primarily driven by, $3.0 million ($2.1 million cash and $0.9 million non-cash) of expenses in fiscal 2012 related to consolidating research and development activities of our Birds Eye Frozen Division at our Parsippany, New Jersey headquarters. Also impacting Research and development expenses was $0.3 million of lower management incentive compensation expense in fiscal 2011.
Other Income and Expense:
Other expense (income), net consists of the following:
Fiscal year
December30, 2012
December25, 2011
Other expense (income), net consists of:Amortization of intangibles/other assets $ 15.8 $ 16.2Tradename impairment charges 0.5 25.3Redemption premium on the early extinguishment of debt 14.3 —Lehman Brothers Specialty Financing settlement — 8.5Gain on sale of the Watsonville, CA facility — (0.4)Royalty income and other (0.8) (1.0)Total other expense (income), net $ 29.8 $ 48.6
On April 19, 2012, as part of a debt refinancing (the "April 2012 Refinancing") the Company redeemed all $199.0 million of its outstanding 10.625% Senior Subordinated Notes at a redemption price of 105.313% of the aggregate principal amount. In addition, on June 5, 2012, the Company repurchased and retired $10.0 million of 9.25% Senior Notes at a price of 102.125% of the aggregate principal amount. Also, on September 20, 2012, as part of a debt refinancing (the "September 2012 Refinancing", and, together with the April 2012 Refinancing, the "2012 Refinancings") the Company redeemed $150.0 million of 9.25% Senior Notes at a price of 102.313% of the aggregate principal amount. For more information on the 2012 Refinancings see Note 9 to the Consolidated Financial Statements.
Earnings before interest and taxes
Earnings before interest and taxes were $283.6 million for the fiscal year ended December 30, 2012, an increase of $100.3 million, or 54.7%, from $183.3 million in the comparable prior-year period. The primary drivers of the increase are goodwill and tradename impairment charges of $148.2 million recognized in fiscal year 2011 compared to $0.5 million in fiscal 2012. The increase in fiscal 2012 was partially offset by $14.3 million of charges related to the early extinguishment of debt, increased incentive compensation, increased research and development costs and lower gross profit as described above. Also, the fifty-third week in fiscal 2012 increased Earnings before interest and taxes by $5.5 million.
Birds Eye Frozen Division:
Earnings before interest and taxes increased $81.0 million, or 83.4%, to $178.2 million for the fiscal year ended December 30, 2012, primarily reflecting goodwill and impairment charges of $76.6 million in 2011. Earnings before interest and taxes were also impacted by charges of $8.3 million and $14.0 million in the fiscal years 2012 and 2011, respectively, related to our plant consolidation projects. 2012 was also impacted by significantly higher commodity costs and higher research and development charges resulting from our consolidation activities, which were offset by ongoing productivity programs, higher net selling prices and the $11.0 million savings from the closure of our Fulton, New York plant.

42
Duncan Hines Grocery Division:
Earnings before interest and taxes were $120.7 million, a decline of $36.6 million, or 23.2%, primarily reflecting significantly higher commodity costs, which were only partially offset by productivity improvements and increased net selling prices. Also impacting Earnings before interest and taxes were introductory distribution costs related to the second-half 2012 Vlasic Farmers Garden launch. In addition, Earnings before interest and taxes was also impacted by charges of $23.6 million and $11.3 million in the fiscal years 2012 and 2011, respectively, related to our Millsboro, Delaware and Tacoma, Washington plant consolidation projects.
Specialty Foods Division:
Earnings before interest and taxes increased $63.8 million, or 158.3%, to $23.5 million, primarily reflecting goodwill impairment charges of $71.2 million in 2011. Earnings before interest and taxes were also impacted by charges of $8.1 million in fiscal 2012 resulting from the exit of the lower-margin un-branded pickle business, higher commodity costs which were partially offset by productivity improvements and increased net selling prices.
Interest Expense, net
Net interest expense declined 4.7% or $9.7 million from $208.1 million in the fiscal year ended December 25, 2011 to $198.4 million in the fiscal year ended December 30, 2012. Included in net interest expense in both periods were charges associated with our 2012 Refinancings and certain interest rate swap activity that was de-designated for swap accounting in 2008. These items, which total $17.9 million in fiscal 2012 and $2.1 million in fiscal 2011, are discussed below.
On April 17, 2012 we entered into an amended and restated credit agreement, which provided for the extension of certain of our Tranche B Term Loans and our Revolving Credit facility, the repayment of our Tranche D term loans and the issuance of new Tranche E term loans. In connection with this refinancing, we also redeemed all of our outstanding 10.625% Senior Subordinated Notes. This refinancing resulted in the recognition of approximately $14.8 million of charges to interest expense during fiscal 2012. The charges recognized consisted of $7.3 million of write downs of existing deferred financing costs as well as $7.5 million of new costs incurred in connection with the transaction that were recorded directly to interest expense.
On August 30, 2012 the Company entered into the first amendment to the amended and restated credit agreement, which provided for the issuance of new Tranche F term loans. In connection with this refinancing, on September 20, 2012 we also redeemed $150 million aggregate principal of our 9.25% senior notes. This refinancing resulted in the recognition of approximately $2.6 million of charges to interest expense during the third quarter for write downs of existing deferred financing costs.
Included in net interest expense was $0.4 million and $2.1 million for the fiscal years ended December 30, 2012 and December 25, 2011, respectively, related to the amortization of the cumulative mark-to-market adjustment for an interest rate swap that was de-designated for swap accounting in the fourth quarter of 2008 and subsequently terminated. The counterparty to the interest rate swap was LBSF and the hedge was de-designated for swap accounting at the time of LBSF's bankruptcy filing. At that time of de-designation, the cumulative mark to market adjustment was $11.5 million. As of December 30, 2012, the balance was fully amortized.
Excluding the impact of the aforementioned charges on net interest expense in both periods, the net decrease in interest expense was $25.5 million, of which $13.5 million was due to the pay down of our term loans and notes, $13.3 million was due to lower payments on interest rate swap agreements and $2.6 million was due to lower amortization of deferred financing costs. Partially offsetting these interest savings were a $2.8 million increase resulting from the additional fifty-third week in the 2012 fiscal year as compared to the fifty-two weeks in the 2011 fiscal year and a $0.7 million increase due to higher weighted average interest rates on our term loans.
We utilize interest rate swap agreements to reduce the potential exposure to interest rate movements and to achieve a desired proportion of variable versus fixed rate debt. Any gains or losses realized on the interest rate swap agreements, excluding the AOCL portion, are recorded as an adjustment to interest expense. Included in net interest expense was $10.1 million and $23.4 million for the fiscal years 2012 and 2011, respectively, recorded from losses on interest rate swap agreements, resulting in $13.3 million lower payments on interest rate swap agreements.
Provision (benefit) for income taxes
Our effective tax rate was 38.4% for the fiscal year ended December 30, 2012 compared to (89.1%) for the fiscal year ended December 25, 2011. The effective rate difference was principally due to the $100.2 million portion of the $122.9 million goodwill impairment in December 2011 for which no tax benefit was recognized. Additionally, in the prior year, a benefit of $3.0 million was recorded as a result of evaluating new information affecting the measurement of certain unrecognized tax positions.

43
Under Section 382 of the Code, the Company is a loss corporation. Section 382 of the Code places limitations on our ability to use certain NOLCs to offset income. The annual NOL limitation on the portion subject to Section 382 is approximately $17.0 million to $23.0 million, subject to other rules and restrictions. Our NOLCs and certain other tax attributes generated prior to December 23, 2009 may not be utilized to offset Birds Eye income from recognized built in gains through December 2014 pursuant to Section 384 of the Code. See Note 16 to the Consolidated Financial Statements. Approximately $225.0 million of the NOLCs are not subject to Section 382 limitations.
Liquidity and Capital Resources
Historical
Our cash flows are seasonal. Typically we are a net user of cash in the third quarter of the calendar year (i.e., the quarter ending in September) and a net generator of cash over the balance of the year.
Our principal liquidity requirements have been, and we expect will be, for working capital and general corporate purposes, including capital expenditures and debt service. In addition, subsequent to the IPO, the Company initiated a quarterly dividend program. Currently, the quarterly payment is $0.21 per share or approximately $24.0 million. Capital expenditures are expected to be approximately $120.0 to $130.0 million in 2014, which include approximately $48.0 million related to our acquisition integration projects. We have historically satisfied our liquidity requirements with internally generated cash flows and availability under our revolving credit facility. We expect that our ability to generate cash from our operations and ability to borrow from our credit facilities should be sufficient to support working capital needs, planned growth and capital expenditures for the next 12 months and for the foreseeable future. We keep an insignificant amount of cash in foreign accounts, primarily related to the operations of our Canadian business. Tax liabilities related to bringing these funds back into the United States would not be significant and have been accrued.
Statements of cash flows for the fiscal year ended December 29, 2013 compared to the fiscal year ended December 30, 2012
Net cash provided by operating activities was $262.2 million for the fiscal year ended December 29, 2013 and was the result of net earnings, excluding non-cash charges and credits of $287.8 million and an increase in working capital of $25.5 million. The increase in working capital was primarily the result of a $21.3 million increase in accounts receivable resulting from the timing of sales within the month of December in 2013 compared to the previous year. Also contributing to the increase in working capital was a $17.1 million decrease in accrued liabilities primarily attributable to lower interest payable resulting from the refinancing and pay downs as well, and a $7.3 million decrease in accrued trade marketing expense driven by lower sales for December of 2013 compared to the previous year as a result of the impact of the 53rd week. The aging profile of accounts receivable has not changed significantly from December 30, 2012. The increase in working capital was partially offset by a $16.1 million decrease in inventory principally resulting from inventory built in 2012 related to our pickle supply chain consolidation and a $4.1 million decrease in accounts payable driven principally by the timing of production. All other working capital accounts generated a net $0.1 million cash outflow.
Net cash provided by operating activities was $202.9 million for the fiscal year ended December 30, 2012 and was the result of net earnings, excluding non-cash charges and credits of $216.1 million and an increase in working capital of $13.1 million. The increase in working capital was primarily the result of a $22.0 million increase in inventory principally resulting from temporary inventory buildup from our supply chain efficiency initiatives, principally the close down of the Millsboro, Delaware plant and a $16.3 million decrease in accounts payable driven principally by the timing of production. These were offset by a $9.4 million increase in accrued trade marketing expense driven by higher sales for December of 2012 compared to the previous year as well as increased spending rates driven by increased competitive activity. Also impacting working capital was a decrease of $16.3 million in accounts receivable resulting from the timing of sales within the month of December in 2012 compared to the previous year. The aging profile of accounts receivable has not changed significantly from December 25, 2011. All other working capital accounts generated a net $0.4 million cash inflow.
Net cash used in investing activities for the fiscal year ended December 29, 2013 totaled $652.4 million and included $575.2 million for the acquisition of Wish-Bone as well as $84.1 million for capital expenditures which included approximately $6.3 million of costs related to our facility consolidation projects. Net cash used in investing activities also included $6.9 million of proceeds from the sale of assets.
Net cash used in investing activities was $77.7 million for the fiscal year ended December 30, 2012 and was primarily related to capital expenditures. Capital expenditures during fiscal 2012 included approximately $8.6 million of costs related to our facility consolidation projects.
44
Net cash provided by financing activities for the fiscal year ended December 29, 2013 was impacted by our IPO, our April 2013 refinancing and the addition of Term Loan H, which are explained in greater detail in Note 10 to the Consolidated Financial Statements. Net cash provided by financing activities for the fiscal year ended December 29, 2013 was $414.4 million and consisted of $625.0 million of proceeds, primarily from our IPO ($667.0 million of gross proceeds net of $43.1 million of underwriting discounts and other fees), $2,142.4 million of proceeds from our new Term Loan G and H Loans and $350.0 million of proceeds from our notes offering which were partially offset by $1,736.1 million of Term Loan repayments, $899.2 million of repurchases of outstanding notes, $41.7 million of dividends paid, $23.1 million of debt acquisition costs and $2.8 million of net capital lease and notes payable activity.
Net cash used by financing activities for the fiscal year ended December 30, 2012 was impacted by our April and September 2012 refinancings, which is explained in greater detail in Note 9 to the Consolidated Financial Statements. Net cash used by financing activities for the fiscal year ended December 30, 2012 was $184.1 million and consisted of $632.0 million of term loan repayments, $373.3 million of repurchases of outstanding notes, $17.4 million of debt acquisition costs, $3.5 million of capital lease payments, $0.4 million of notes payable activity, and $0.9 million for repurchases of equity. These outflows were funded by $842.6 million of proceeds from our new Tranche E and F Term loans, with the remainder coming from cash on hand.
The net of all activities resulted in an increase in cash of $24.5 million for the fiscal year ended December 29, 2013, compared to a decrease in cash of $58.8 million for the fiscal year ended December 30, 2012.
Statements of cash flows for the fiscal year ended December 30, 2012 compared to the fiscal year ended December 25, 2011
Net cash provided by operating activities was $202.9 million for the fiscal year ended December 30, 2012 and was the result of net earnings, excluding non-cash charges and credits of $216.1 million and a decrease in working capital of $13.1 million. The decrease in working capital was primarily the result of a $22.0 million increase in inventory principally resulting from temporary inventory buildup from our supply chain efficiency initiatives, principally the close down of the Millsboro, Delaware plant and a $16.3 million decrease in accounts payable driven principally by the timing of production. These were offset by a $9.4 million increase in accrued trade marketing expense driven by higher sales for December of 2012 compared to the previous year as well as increased spending rates driven by increased competitive activity. Also impacting working capital was a decrease of $16.3 million in accounts receivable resulting from the timing of sales within the month of December in 2012 compared to the previous year. The aging profile of accounts receivable has not changed significantly from December 25, 2011. All other working capital accounts generated a net $0.4 million cash inflow.
Net cash provided by operating activities was $204.2 million for the fiscal year ended December 25, 2011 and was the result of net earnings, excluding non-cash charges and credits, of $215.5 million and an increase in working capital of $11.3 million. The increase in working capital was primarily the result of a $23.5 million decrease in accrued liabilities driven by lower incentive compensation and interest accruals, a $12.1 million decrease in accrued trade marketing expense driven by lower trade spending rates in December and a faster rate of settlement on deductions, and an $11.0 million increase in accounts receivable driven by the timing of sales as well as higher selling prices. The aging profile of accounts receivable did not change significantly from December 2010. These were offset by a $38.2 million increase in accounts payable driven by our inventory purchases and the timing of vendor payments. All other working capital accounts had no net effect on cash during the period.
Net cash used in investing activities was $77.7 million for the fiscal year ended December 30, 2012 and was primarily related to capital expenditures. Capital expenditures during fiscal 2012 included approximately $8.6 million of costs related to our facility consolidation projects.
Net cash used in investing activities was $109.4 million for the fiscal year ended December 25, 2011 and consisted of $117.3 million of capital expenditures, offset by $7.9 million of proceeds received for the sale of our Watsonville, CA facility, which had been recorded as an asset held for sale. Capital expenditures during 2011 included approximately $29.0 million of costs related to our plant consolidation projects in Tacoma and Fulton. Although not impacting our cash capital expenditures, we also acquired approximately $11.2 million of assets through capital leases during 2011.
Net cash used by financing activities was impacted by our April and September 2012 refinancings, which is explained in greater detail in Note 9 to the Consolidated Financial Statements. Net cash used by financing activities for the fiscal year ended December 30, 2012 was $184.1 million and consisted of $632.0 million of term loan repayments, $373.3 million of repurchases of outstanding notes, $17.4 million of debt acquisition costs, $3.5 million of capital lease payments, $0.4 million of notes payable activity, and $0.9 million for repurchases of equity. These outflows were funded by $842.6 million of proceeds from our new Tranche E and F Term loans, with the remainder coming from cash on hand.
Net cash used by financing activities for the fiscal year ended December 25, 2011 was $59.0 million and consisted of, $57.5 million of term loan repayments, including a $55.0 million voluntary prepayment of the Tranche D Term Loan made in December 2011,

45
$2.5 million of payments on capital leases, $1.6 million of share repurchases of equity, and $0.7 million of debt acquisition costs. These outflows were partially offset by proceeds from new equity contributions of $0.6 million and other financing activities of $2.7 million.
The net of all activities resulted in a decrease in cash of $58.8 million for the fiscal year ended December 30, 2012, compared to an increase in cash of $35.7 million for the fiscal year ended December 25, 2011.
Debt
As of December 29, 2013 and December 30, 2012, our long term debt consisted of the following:
December 29,2013
December 30,2012
Long-term debt- Senior Secured Credit Facility - Tranche B Non Extended Term Loans due 2014 $ — $ 243.3- Senior Secured Credit Facility - Tranche B Extended Term Loans due 2016 — 637.9- Senior Secured Credit Facility - Tranche E Term Loans due 2018 — 398.0- Senior Secured Credit Facility - Tranche F Term Loans due 2018 — 448.9- Senior Secured Credit Facility - Tranche G Term Loans due 2020 1,621.9 —- Senior Secured Credit Facility - Tranche H Term Loans due 2020 525.0 —- 4.875% Senior Notes due 2021 350.0 —- 9.25% Senior Notes due 2015 — 465.0- 8.25% Senior Notes due 2017 — 400.0- 10.625% Senior Subordinated Notes due 2017 — —- Unamortized discount on long term debt (16.1) (7.2)- Capital lease obligations 20.0 21.0
Sub-total 2,500.8 2,606.9Less: current portion of long-term obligations 24.6 30.4Total long-term debt $ 2,476.2 $ 2,576.5
To partially fund the Wish-Bone acquisition, on October 1, 2013 Pinnacle Foods Finance, the Company's wholly-owned subsidiary, entered into an amendment to the Second Amended and Restated Credit Agreement (the “Amendment”) in the form of incremental term loans in the amount of $525.0 million (the “Tranche H Term Loans”). In connection with Tranche H Term Loans, Pinnacle Foods Finance incurred $8.5 million of original issue discount and deferred financing fees of $10.5 million.
On April 29, 2013, Pinnacle Foods Finance entered into the second amendment to the amended and restated Senior Secured Credit Facility, which provided for a seven year term loan facility in the amount of $1,630.0 million (the "Tranche G Term Loans") and replaced the existing revolving credit facility with a new five year $150.0 million revolving credit facility. Additionally, Pinnacle Foods Finance issued $350.0 million aggregate principal amount of 4.875% Senior Notes (the "4.875% Senior Notes") due 2021.
On April 17, 2012 Pinnacle Foods Finance entered into an amended and restated credit agreement, which extended a portion of its Tranche B Term Loans to 2016, allowed it to borrow on new $400 million Tranche E Term Loans and replace our existing revolving credit facility with a new $150 million revolving credit facility. We used proceeds from the Tranche E Term Loans to pay off all of our outstanding balance of $313.2 million aggregate principal amount of Tranche D Term Loans. On April 19, 2012, we redeemed all $199.0 million of our outstanding 10.625% Senior Subordinated Notes using proceeds from the Tranche E Term Loans along with available cash.
On August 30, 2012, Pinnacle Foods Finance entered into the first amendment to the amended and restated credit agreement which allowed it to borrow on new $450 million Tranche F Term Loans. The Company used proceeds from the Tranche F Term Loans along with available cash to pay off $300 million of the aggregate principal amount of Tranche B Non Extended Term Loans and $150 million of the aggregate principal amount of 9.25% Senior Notes. For additional details regarding our debt instruments and our April and September 2012 refinancing, please refer to Note 10 of the Consolidated Financial Statements, "Debt and Interest Expense"

46
We meet the service requirements on our debt utilizing cash flow generated from operations. In addition to the above facilities, Pinnacle Foods Finance has a $150.0 million revolving credit facility, which can be used to fund its working capital needs and can also be used to issue up to $50.0 million of letters of credit. There were no borrowings against the revolving credit facility as of December 29, 2013 and December 30, 2012. As of December 29, 2013 and December 30, 2012, Pinnacle Foods Finance had issued $32.9 million and $33.5 million, respectively, of letters of credit under this facility, leaving $117.1 million and $116.5 million, respectively, of unused capacity under this facility.
The Senior Secured Credit Facility loans amortize in quarterly 0.25% installments. The scheduled principal payments of the Tranche G Term Loans outstanding as of December 29, 2013 are $16.3 million in 2014, $16.3 million in 2015, $16.3 million in 2016, $20.4 million in 2017, $12.2 million in 2018 and $1,540.4 million thereafter. The scheduled principal payments of the Tranche H Term Loans outstanding as of December 29, 2013 are $5.3 million in 2014, $5.3 million in 2015, $5.3 million in 2016, $6.6 million in 2017, $3.9 million in 2018 and $498.6 million thereafter.
Under the terms of our Senior Secured Credit Facility, Pinnacle Foods Finance is required to use 50% of its “Excess Cash Flow” to prepay the term loans under the Senior Secured Credit Facility (which percentage will be reduced to 25% at a total net leverage ratio of between 4.50 and 5.49 and 0% at a total net leverage ratio below 4.50). Excess Cash Flow is defined as consolidated net income (as defined), as adjusted for certain items, including (1) all non-cash charges and credits included in arriving at consolidated net income, (2) changes in working capital, (3) capital expenditures (to the extent they were not financed with debt), (4) the aggregate amount of principal payments on indebtedness and (5) certain other items defined in the Senior Secured Credit Facility. For the 2012 reporting year, we determined that there were no amounts due under the Excess Cash Flow requirements of the Senior Secured Credit Facility. No payment was due under the Excess Cash Flow requirements of the Senior Secured Credit Facility for the fiscal 2013 reporting year.
As market conditions warrant, we and our subsidiaries, affiliates or significant equity holders (including Blackstone and its affiliates) may from time to time, in our or their sole discretion, purchase, repay, redeem or retire any of our outstanding debt or equity securities (including any publicly issued debt or equity securities), in privately negotiated or open market transactions, by tender offer, exchange offer or otherwise.
Covenant Compliance
The following is a discussion of the financial covenants contained in our debt agreements.
Senior Secured Credit Facility
Pinnacle Foods Finance's Senior Secured Credit Facility contains a number of covenants that, among other things, restrict, subject to certain exceptions, our ability to:
• incur additional indebtedness and make guarantees;• create liens on assets;• engage in mergers or consolidations;• sell assets;• pay dividends and distributions or repurchase our capital stock;• make investments, loans and advances, including acquisitions; and• engage in certain transactions with affiliates.
The Senior Secured Credit Facility also contains certain customary affirmative covenants and events of default.
4.875% Senior Notes
On April 29, 2013, we issued the 4.875% Senior Notes. The 4.875% Senior Notes are general senior unsecured obligations, effectively subordinated in right of payment to all of our existing and future senior secured indebtedness, and guaranteed on a full, unconditional, joint and several basis by our wholly-owned domestic subsidiaries that guarantee our other indebtedness.

47
The indenture governing the 4.875% Senior Notes limits our (and most or all of our subsidiaries’) ability to, subject to certain exceptions:
• incur additional debt or issue certain preferred shares;• pay dividends on or make other distributions in respect of our capital stock or make other restricted payments;• make certain investments;• sell certain assets;• create liens on certain assets to secure debt;• consolidate, merge, sell or otherwise dispose of all or substantially all of our assets;• enter into certain transactions with our affiliates; and• designate our subsidiaries as unrestricted subsidiaries.
Subject to certain exceptions, the indenture governing the 4.875% Senior Notes permits us and our restricted subsidiaries to incur additional indebtedness, including secured indebtedness.
Adjusted EBITDA
The Company's metric of Adjusted EBITDA, an operating performance measure, which is used in creating targets for the bonus and equity portions of our compensation plans, is equivalent to Covenant Compliance EBITDA under our debt agreements.
Pursuant to the terms of the Senior Secured Credit Facility, Pinnacle Foods Finance is required to maintain a ratio of Net First Lien Secured Debt to Adjusted EBITDA of no greater than 5.75 to 1.00. Net First Lien Secured Debt is defined as Pinnacle Foods Finance's aggregate consolidated secured indebtedness secured on a first lien basis, less the aggregate amount of all unrestricted cash and cash equivalents.
In addition, under the Senior Secured Credit Facility and the indenture governing the 4.875% Senior Notes, our ability to engage in activities such as incurring additional indebtedness, making investments and paying dividends is tied to the Senior Secured Leverage Ratio (which is currently the same as the ratio of Net First Lien Secured Debt to Adjusted EBITDA described above), in the case of the Senior Secured Credit Facility, or to the ratio of Adjusted EBITDA to fixed charges for the most recently concluded four consecutive fiscal quarters, in the case of the Senior Notes. We believe that these covenants are material terms of these agreements and that information about the covenants is material to an investor's understanding our financial performance. As of December 29, 2013, we were in compliance with all covenants and other obligations under the Senior Secured Credit Facility and the indenture governing the 4.875% Senior Notes.
Adjusted EBITDA is defined as earnings (loss) before interest expense, taxes, depreciation and amortization (“EBITDA”), further adjusted to exclude non-cash items, extraordinary, unusual or non-recurring items and other adjustment items permitted in calculating Adjusted EBITDA under the Senior Secured Credit Facility and the indenture governing the Senior Notes. We believe that the inclusion of supplementary adjustments to EBITDA applied in presenting Adjusted EBITDA is appropriate to provide additional information to investors to demonstrate compliance with our financial covenants.
EBITDA and Adjusted EBITDA do not represent net earnings or loss or cash flow from operations as those terms are defined by U.S. Generally Accepted Accounting Principles (“GAAP”) and do not necessarily indicate whether cash flows will be sufficient to fund cash needs. In particular, the definitions of Adjusted EBITDA in the Senior Secured Credit Facility and the indenture allow us to add back certain non-cash, extraordinary, unusual or non-recurring charges that are deducted in calculating net earnings or loss. However, these are expenses that vary greatly and are difficult to predict. While EBITDA and Adjusted EBITDA and similar measures are frequently used as measures of operations and the ability to meet debt service requirements, they are not necessarily comparable to other similarly titled captions of other companies due to the potential inconsistencies in the method of calculation.
Our ability to meet the covenants specified above in future periods will depend on events beyond our control, and we cannot assure you that we will meet those ratios. A breach of any of these covenants in the future could result in a default under, or an inability to undertake certain activities in compliance with, the Senior Secured Credit Facility and the indenture governing the 4.875% Senior Notes, at which time the lenders could elect to declare all amounts outstanding under the Senior Secured Credit Facility to be immediately due and payable. Any such acceleration would also result in a default under the indenture governing the 4.875% Senior Notes.

48
The following table provides a reconciliation from our net earnings (loss) to EBITDA and Adjusted EBITDA for the fiscal years ended December 29, 2013 and December 30, 2012. The terms and related calculations are defined in the Senior Secured Credit Facility and the indenture governing the 4.875% Senior Notes.
(thousands of dollars) Fiscal yearDecember 29,
2013December 30,
201252 weeks 53 weeks
Net earnings $ 89,349 $ 52,519
Interest expense, net 132,213 198,374
Income tax expense 71,475 32,701
Depreciation and amortization expense 78,225 98,123
EBITDA $ 371,262 $ 381,717
Wish-Bone Acquisition adjustments (1) 54,716 —
Non-cash items (a) 13,553 63Acquisition, merger and other restructuring charges (b) 22,137 23,276
Other adjustment items (c) 53,361 21,040
Adjusted EBITDA $ 515,029 $ 426,096
(1) Represents the acquired EBITDA for Wish-Bone for the period of fiscal 2013 prior to the Wish-Bone acquisition and the net cost savings projected to be realized from acquisition synergies, calculated consistent with our definition of Adjusted EBITDA.
(a) Non-cash items are comprised of the following:
(thousands of dollars) Fiscal yearDecember 29,
2013December 30,
2012
52 weeks 53 weeks
Non-cash compensation charges (1) $ 7,933 $ 850
Unrealized gains resulting from hedging activities (2) (693) (1,307)
Other impairment charges (3) 520Effects of adjustments related to the application of purchaseaccounting (4) 6,313 —
Total non-cash items $ 13,553 $ 63
_________________(1) Represents non-cash compensation charges related to the granting of equity awards. (2) Represents non-cash gains and losses resulting from mark-to-market adjustments of obligations under derivative contracts.(3) For fiscal 2012, represents impairment on the Bernstein's tradename ($0.5 million). (4) For fiscal 2013, represents expense related to the write-up to fair market value of inventories acquired as a result of the
Wish-Bone Acquisition.

49
(b) Acquisition, merger and other restructuring charges are comprised of the following:
(thousands of dollars) Fiscal yearDecember 29,
2013December 30,
201252 weeks 53 weeks
Expenses in connection with an acquisition or other non-recurringmerger costs (1) $ 9,485 $ 2,349Restructuring charges, integration costs and other businessoptimization expenses (2) 7,979 19,911Employee severance (3) 4,673 1,016Total other adjustments $ 22,137 $ 23,276
_________________(1) For fiscal 2013, primarily represents costs related to the Wish-Bone acquisition, IPO related expenses and due diligence
investigations. For fiscal 2012, primarily represents IPO-related expenses and due diligence investigations. (2) For fiscal 2013, primarily represents restructuring and restructuring related charges related to the closure of our Millsboro,
DE facility, consulting and business optimization expenses related to the expansion of headquarter direct sales coverage for retail and a gain from the sale of our Tacoma, WA location in July 2013. For fiscal 2012, primarily represents restructuring charges, consulting and business optimization expenses related to the closings of the Tacoma, Washington, Fulton, New York, Green Bay, Wisconsin and Millsboro, Delaware facilities.
(3) For fiscal 2013 and fiscal 2012, represents severance costs paid, or to be paid, to terminated employees.
(c) Other adjustment items are comprised of the following:
(thousands of dollars) Fiscal yearDecember 29,
2013December 30,
201252 weeks 53 weeks
Management, monitoring, consulting and advisory fees (1) $ 19,181 $ 4,707Other (2) 34,180 16,333Total other adjustments $ 53,361 $ 21,040
_________________(1) Represents management/advisory fees and expenses paid to an affiliate of Blackstone, including $15.1 million relating to
the termination of the advisory agreement in connection with the IPO.(2) For fiscal 2013, primarily represents $34.2 million of the premiums paid on the redemption of $400.0 million of 8.25%
Senior Notes due 2017. For fiscal 2012, primarily represents $14.3 million of the premiums paid on the redemption of $150.0 million of 9.25% Senior Notes due 2015, the redemption of $199.0 million of 10.625% Senior Subordinated Notes due 2017 and the repurchase and retirement of $10.0 million of 9.25% Senior Notes due 2015. Also, for fiscal 2012, represents costs for the recall of Aunt Jemima product, net of insurance recoveries, of $2.1 million.
Our covenant requirements and actual ratios for the twelve months ended December 29, 2013 are as follows:
Covenant
Requirement Actual Ratio
Senior Secured Credit FacilityNet First Lien Leverage Ratio (1) 5.75 to 1.00 3.98Total Leverage Ratio (2) Not applicable 4.66
Senior Notes (3)Minimum Adjusted EBITDA to fixed charges ratio required to incuradditional debt pursuant to ratio provisions (4) 2.00 to 1.00 4.18
_________________(1) Pursuant to the terms of the Senior Secured Credit Facility, Pinnacle Foods Finance is required to maintain a ratio of Net First
Lien Secured Debt to Adjusted EBITDA of no greater than 5.75 to 1.00. Net First Lien Secured Debt is defined as Pinnacle

50
Foods Finance's aggregate consolidated secured indebtedness secured on a first lien priority basis, less the aggregate amount of all unrestricted cash and cash equivalents.
(2) The Total Leverage Ratio is not a financial covenant but is used to determine the applicable margin rate under the Senior Secured Credit Facility. The Total Leverage Ratio is calculated by dividing consolidated total debt less the aggregate amount of all unrestricted cash and cash equivalents by Adjusted EBITDA.
(3) Our ability to incur additional debt and make certain restricted payments under the indenture governing the Senior Notes, subject to specified exceptions, is tied to an Adjusted EBITDA to fixed charges ratio of at least 2.00 to 1.00.
(4) Fixed charges is defined in the indenture governing the 4.875% Senior Notes as (i) consolidated interest expense (excluding specified items) plus consolidated capitalized interest less consolidated interest income, plus (ii) cash dividends and distributions paid on preferred stock or disqualified stock.
Adjusted Gross Profit
Our management uses Adjusted gross profit as an operating performance measure. Adjusted gross profit is defined as gross profit before accelerated depreciation related to restructuring activities, certain non-cash items, acquisition, merger and other restructuring charges and other adjustments noted in the table below. We believe that the presentation of Adjusted gross profit is useful to investors because it is consistent with our definition of Adjusted EBITDA (defined above), a measure frequently used by securities analysts, investors and other interested parties in their evaluation of the operating performance of companies in industries similar to ours. In addition, we also use targets based on Adjusted gross profit as one of the components used to evaluate our management’s performance. Adjusted gross profit is not defined under GAAP, should not be considered in isolation or as substitutes for measures of our performance prepared in accordance with GAAP and is not indicative of gross profit as determined under GAAP.
The following table provides a reconciliation from our gross profit to Adjusted gross profit for the fiscal years ended December 29, 2013 and December 30, 2012.
(thousands of dollars) Fiscal yearDecember 29,
2013December 30,
201253 weeks 52 weeks
Gross profit $ 654,249 $ 584,549Accelerated depreciation expense (a) — 20,990Non-cash items (b) 6,253 (1,194)Acquisition, merger or other restructuring charges (c) 4,504 16,934Other adjustment items (d) — 1,618Adjusted gross profit $ 665,006 $ 622,897
_________________(a) Reflects accelerated depreciation related to plant closures.
(b) Non-cash items are comprised of the following:
(thousands of dollars) Fiscal yearDecember 29,
2013December 30,
201252 weeks 53 weeks
Non-cash compensation charges (1) $ 633 $ 113Unrealized gains resulting from hedging activities (2)
(693) (1,307)Effects of adjustments related to the application ofpurchase accounting (3) 6,313 —Non-cash items $ 6,253 $ (1,194)
_________________(1) Represents non-cash compensation charges related to the granting of equity awards.(2) Represents non-cash gains and losses resulting from mark-to-market obligations under derivative contracts.

51
(3) For fiscal 2013, represents expense related to the write-up to fair market value of inventories acquired as a result of the Wish-Bone Acquisition.
(c) Acquisition, merger and other restructuring charges are comprised of the following:
(thousands of dollars) Fiscal yearDecember 29,
2013December 30,
201252 weeks 53 weeks
Restructuring charges, integration costs and otherbusiness optimization expenses (1) $ 4,305 $ 16,923Employee severance and recruiting (2) 199 11Total acquisition, merger and other restructuringcharges $ 4,504 $ 16,934
_________________(1) For fiscal 2013, primarily represents restructuring and restructuring related charges, consulting, business
optimization expenses related to closures at our Millsboro, DE (March, 2013) and Fulton, NY (March, 2012) facilities and a gain from the sale of our Tacoma, WA location in July 2013. For fiscal 2012, primarily represents restructuring charges and consulting and business optimization expenses related to the closings of the Tacoma, Washington, Fulton, New York and Millsboro, Delaware facilities.
(2) Represents severance costs paid or accrued to terminated employees.
(d) Other adjustment items are comprised of the following:
(thousands of dollars) Fiscal year
December 29,2013
December 30,2012
52 weeks 53 weeks
Other (1) $ — $ 1,618Total other adjustments $ — $ 1,618
_________________(1) For fiscal 2012, primarily represents costs for the recall of Aunt Jemima product, net of insurance recoveries. (2)
Contractual Commitments
The table below provides information on our contractual commitments as of December 29, 2013:
Total
Less Than1 Year
1-3 Years
3-5 Years
More than 5 Years
(in thousands)
Total debt at face value (1) $2,496,850 $ 21,550 $ 43,100 $ 43,100 $2,389,100Projected interest payments on long term debt (2) 570,301 87,858 167,876 189,338 125,229Operating lease obligations 69,080 12,135 18,386 16,264 22,295Capital lease obligations 27,149 4,577 9,646 2,920 10,006Purchase obligations (3) 752,663 564,341 130,673 10,349 47,300Pension (4) 38,051 10,362 13,489 11,119 3,081Total (5) $3,954,094 $ 700,823 $ 383,170 $ 273,090 $2,597,011
(1) Total debt at face value includes scheduled principal repayments and excludes interest payments. (2) The total projected interest payments on long-term debt are based upon borrowings and interest rates as of December 29,
2013, including the effect of interest rate swaps in place. The interest rate on variable rate debt is subject to changes beyond our control and may result in actual interest expense and payments differing from the amounts above.
(3) The amounts indicated in this line primarily reflect future contractual payments, including certain take-or-pay arrangements entered into as part of the normal course of business. The amounts do not include obligations related to other contractual

52
purchase obligations that are not take-or-pay arrangements. Such contractual purchase obligations are primarily purchase orders at fair value that are part of normal operations and are reflected in historical operating cash flow trends. Purchase obligations also include trade and consumer promotion and advertising commitments. We do not believe such purchase obligations will adversely affect our liquidity position.
(4) The funding of the defined benefit pension plan is based upon our planned 2014 cash contribution. The future years' contributions are based upon our expectations taking into consideration the funded status of the plan at December 29, 2013. Currently, under ERISA and IRS guidelines, our plans are 92% funded.
(5) The total excludes the liability for uncertain tax positions. We are not able to reasonably estimate the timing of the long-term payments or the amount by which the liability will increase or decrease over time. Therefore, the long-term portion of the liability is excluded from the preceding table.
Off-Balance Sheet Arrangements
As of December 29, 2013, we did not have any off-balance sheet obligations.
Accounting Policies and Pronouncements
Critical Accounting Policies and Estimates
The preparation of financial statements in accordance with generally accepted accounting principles in the United States requires the use of judgment, estimates and assumptions. We make such subjective determinations after careful consideration of our historical performance, management's experience, current economic trends and events and information from outside sources. Inherent in this process is the possibility that actual results could differ from these estimates and assumptions for any particular period.
Our significant accounting policies are detailed in Note 2 to our Consolidated Financial Statements for the fiscal year ended December 29, 2013. The following areas are the most important and require the most difficult, subjective judgments.
Trade and consumer promotion programs
The Company offers various sales incentive programs to customers and consumers, such as feature price discounts, in-store display incentives, cooperative advertising programs, new product introduction fees, and coupons. The mix between promotion programs, which are classified as reductions in revenue, and advertising or other marketing activities, which are classified as marketing and selling expenses, fluctuates between periods based on the Company's overall marketing plans, and such fluctuations have an impact on revenues. The measurement and recognition of the costs for trade and consumer promotion programs involves the use of judgment related to performance and redemption estimates. Estimates are made based on historical experience and other factors and are adjusted quarterly based upon our most recent experience and new information. Typically, programs that are offered have a very short duration. Historically, the difference between actual experience compared to estimated redemptions and performance has not been significant to the quarterly or annual financial statements and actual expense has been within 1.0% of amounts accrued. However, actual expenses may differ if the level of redemption rates and performance were to vary from estimates.
Goodwill and Indefinite-lived trade names
We evaluate the carrying amount of goodwill for impairment on an annual basis, as of year end, or more frequently if an event occurs or circumstances change that would more likely than not reduce the fair value of a reporting unit below its carrying amount. The goodwill impairment review consists of a two-step process. We perform quantitative testing by calculating the fair value of each reporting unit. We then compare the fair value of the reporting unit with its carrying value. If this fair value exceeds the carrying value, no further analysis or goodwill impairment charge is required. If the fair value is below the carrying value, we proceed to the next step, which is to measure the amount of the impairment loss. The impairment loss is measured as the difference between the carrying value and implied fair value of goodwill. To measure the implied fair value of goodwill we make a hypothetical allocation of the estimated fair value of the reporting unit to the tangible and intangible assets (other than goodwill) within the respective reporting unit using the same rules for determining fair value and allocation under the authoritative guidance for business combinations as we would use if it were an original purchase price allocation. If the implied fair value of the reporting unit's goodwill is less than its carrying amount, the shortfall is charged to earnings.
In estimating the fair value of our reporting units we primarily use the income approach, which utilizes forecasted discounted cash flows to estimate the fair value for each reporting unit. We believe that the use of the discounted cash flow model results in the most accurate estimate of the reporting unit's fair value since market values for our reporting units are not readily available. The income approach utilizes management's business plans and projections as the basis for expected future cash flows for five years plus a terminal year. We make significant assumptions including projected sales growth rates and operating margins and the

53
weighted average cost of capital. In our recent impairment tests, we forecasted cash flows for five years plus a terminal year and assumed a weighted average cost of capital of 7.5%. Our projections assume sales growth rates for the next five years and the terminal year that generally average between 1.0% and 3.0% and operating margins which increase moderately from historical levels over time as a result of planned capital improvements in our plants and manufacturing efficiency projects. These assumptions are determined based upon our expectations for each of the individual reporting units and in our judgment are consistent with other companies in the packaged food industry.
In fiscal 2013, all reporting units tested had a fair value that exceeded their carrying value by at least 18%. We performed a sensitivity analysis on our weighted average cost of capital and we determined that a 50 basis point increase in the weighted average cost of capital would not have resulted in any of our reporting units implied fair value being less than their carrying value. Additionally, a 50 basis point decrease in the terminal growth rate used for each reporting unit would also not have resulted in any of our reporting units implied fair value being less than their carrying value
We also evaluate the carrying amount of our trade names for impairment on an annual basis, in December, or more frequently if events or changes in circumstances indicate that the asset might be impaired. The impairment test consists of a comparison of the fair value of an intangible asset with its carrying value. If the carrying value of a trade name exceeds its fair value at the time of the evaluation, we would charge the shortfall to earnings.
To estimate the fair value of our trade names we primarily use the relief from royalty method, which utilizes forecasted discounted cash flows to estimate the fair value. The utilization of the relief from royalty method requires us to make significant assumptions including sales growth rates, implied royalty rates and discount rates. In fiscal 2013, all trade names tested had a fair value that exceeded their carrying value.
In the course of our testing, we identified 3 trade names which do not have a fair value that exceeded their carrying value by at least 15%. The total carrying value of these trade names as of December 29, 2013 is $54.7 million. As of December 29, 2013 a 50 basis point increase in the weighted average cost of capital for each brand would have resulted in an impairment charge of $1.5 million. A 50 basis point decrease in the terminal sales growth rate would not have resulted in any impairment charges.
Pension Benefits
The Company provides pension benefits to certain employees and retirees. Pension benefits are no longer offered to salaried employees. All salaried pension benefits which existed are frozen. Determining the cost associated with such benefits is dependent on various actuarial assumptions, including discount rates, expected return on plan assets, compensation increases, turnover rates and mortality rates. Independent actuaries, in accordance with GAAP, perform the required calculations to determine pension expense. Actual results that differ from the actuarial assumptions are generally accumulated and amortized over future periods.
The discount rate is established as of the Company's fiscal year-end measurement date. In establishing the discount rate, the Company reviews published market indices of high-quality debt securities, adjusted as appropriate for duration. In addition, independent actuaries apply high-quality bond yield curves to the expected benefit payments of the plans. The expected return on plan assets is a long-term assumption based upon historical experience and expected future performance, considering our current and projected investment mix. This estimate is based on an estimate of future inflation, long-term projected real returns for each asset class, and a premium for active management. Within any given fiscal period, significant differences may arise between the actual return and the expected return on plan assets. The value of plan assets, used in the calculation of pension expense, is the fair market value. Gains and losses resulting from differences between actual experience and the assumptions are determined at each measurement date. If the net gain or loss exceeds 10% of the greater of plan assets or liabilities, a portion is amortized into earnings in the following year.
Net periodic pension (benefit) cost was a benefit of ($0.9 million) in fiscal 2013 and cost of $2.1 million in fiscal 2012 and $2.8 million in fiscal 2011. Significant weighted-average assumptions for all plans used in the calculation are:
Pension Benefits 2013 2012 2011
PensionDiscount rate 3.9% 4.3% 5.4%Expected return on plan assets 7.0% 7.2% 7.2%
54
Estimated sensitivities to annual net periodic pension cost are as follows: a 50-basis-point reduction in the discount rate would have a minimal effect on pension expense by reducing it by $0.1 million; a 50-basis-point reduction in the estimated return on assets assumption would increase pension expense by approximately $0.8 million.
Net periodic pension expense is expected to be a benefit of approximately $1.4 million in 2014. We expect to contribute approximately $10.8 million to our pension plans in 2014. Given the adverse impact of declining financial markets from 2008 to 2012, combined with the impact that historically low interest rates have on the discount rate used to compute our pension obligation, we made contributions to our plans of $8.3 million in fiscal 2013, $13.3 million in fiscal 2012, $15.9 million in fiscal 2011.
See also Note 11 to the Consolidated Financial Statements "Pension and Retirement Plans"for additional information on pension expenses.
Insurance reserves. We are self-insured and retain liabilities for the first $350,000 of payments on each claim under our worker's compensation insurance policy. We utilize a stop loss policy issued by an insurance company to fund claims in excess of $350,000. We estimate the outstanding retained-insurance liabilities by projecting incurred losses to their ultimate liability and subtracting amounts paid-to-date to obtain the remaining liabilities. We base actuarial estimates of ultimate liability on actual incurred losses, estimates of incurred but not yet reported losses-based on historical information from both us and the industry-and the projected costs to resolve these losses. Retained-insurance liabilities may differ based on new events or circumstances that might materially impact the ultimate cost to settle these losses. Historically, such differences are not significant.
Income taxes. We record income taxes based on the amounts that are refundable or payable in the current year, and we include results of any difference between GAAP and U.S. tax reporting that we record as deferred tax assets or liabilities. We review our deferred tax assets for recovery. A valuation allowance is established when the Company believes that it is more likely than not that some portion of its deferred tax assets will not be realized. Changes in valuation allowances from period to period are included in our tax provision in the period of change. Assessment of the appropriate amount and classification of income taxes is dependent on several factors, including estimates of the timing and realization of deferred income tax assets and the timing of income tax payments. Actual collections and payments may differ from these estimates as a result of changes in tax laws as well as unanticipated future transactions impacting related income tax balances.
Equity-based compensation. Equity-based compensation expense is measured based on the estimated grant date fair value and recognized over the requisite service period for awards that we ultimately expect to vest. We estimate forfeitures at the time of grant based on our actual experience to date and revise our estimates, if necessary, in subsequent periods if actual forfeitures differ from those estimates.
We use the Black-Scholes option-pricing model to value stock options granted. In terms of the assumptions used in the model, we:
• use the simplified method to estimate the number of periods to exercise date. While we had plans in place as a private company, our broader post IPO plans have not been in place for a sufficient amount of time to understand their post vesting behavior. As such, we will continue to use this methodology until such time we have sufficient history to provide a reasonable basis on which to estimate the expected term.
• base the expected volatilities on the average historical volatility of a basket of competitor companies. At such time that we have sufficient history, we will base this assumption on the volatility of our share price.
• base the expected dividend yield assumption on our expected dividend rate during the expected term of the award, and• base the risk free rate for the expected term of the option on the U.S. Treasury yield curve in effect at the time of grant.
We estimate the fair value of non-vested shares based on the market price of the underlying share on the date of the grant.
Recently Issued Accounting Pronouncements
In February 2013, the FASB issued Accounting Standards Update No. 2013-02, “Comprehensive Income (Topic 220): Reporting of Amounts Reclassified Out of Accumulated Other Comprehensive Income,” (“ASU 2013-02”). This new guidance requires that we present either in a single note or parenthetically on the face of the financial statements, the effect of significant amounts reclassified from each component of accumulated other comprehensive income based on its source and the income statement line items affected by the reclassification. This guidance only impacts disclosures within our consolidated financial statements and notes to the consolidated financial statements and does not result in a change to the accounting treatment of Accumulated Other Comprehensive Income. We adopted this guidance in 2013.
55
In July 2013, the FASB issued Accounting Standards Update No. 2013-11, “Income Taxes (Topic 740): Presentation of an Unrecognized Tax Benefit When a Net Operating Loss Carryforward, a Similar Tax Loss, or a Tax Credit Carryforward Exists,” (“ASU 2013-11”). The update provides guidance on financial statement presentation of an unrecognized tax benefit when a NOLC, a similar tax loss, or a tax credit carryforward exists. This ASU applies to all entities with unrecognized tax benefits that also have tax loss or tax credit carryforwards in the same tax jurisdiction as of the reporting date. We adopted this standard in December 2013 noting no material impact on our audited consolidated financial statements.
ITEM 7A: QUANTITATIVE AND QUALITATIVE DISCLOSURE ABOUT MARKET RISK
FINANCIAL INSTRUMENTS
Risk Management Strategy
We are exposed to certain risks arising from both our business operations and economic conditions. We principally manage our exposures to a wide variety of business and operational risks through management of our core business activities. We manage economic risks, including interest rate, liquidity, and credit risk primarily by managing the amount, sources, and duration of our debt funding and the use of derivative financial instruments. The primary risks managed by using derivative instruments are interest rate risk, foreign currency exchange risk and commodity price risk. Specifically, we enter into derivative financial instruments to manage exposures that arise from business activities that result in the receipt or payment of future known and uncertain cash amounts, the value of which are determined by interest rates, foreign exchange rates or commodity prices. Please refer to Note 12 of the Consolidated Financial Statements "Financial Instruments" for additional details regarding our derivatives and refer to Note 10 of the Consolidated Financial Statements "Debt and Interest Expense" for additional details regarding our debt instruments.
Interest Rate Risk
We manage interest rate risk based on the varying circumstances of anticipated borrowings and existing variable and fixed rate debt, including our revolving line of credit. Examples of interest rate management strategies include capping interest rates using targeted interest cost benchmarks, hedging portions of the total amount of debt, hedging a period of months and not always hedging to maturity, and at other times locking in rates to fix interests costs.
Our objectives in using interest rate derivatives are to add stability to interest expense and to manage our exposure to interest rate movements. To accomplish this objective, we primarily use interest rate swaps as part of our interest rate risk management strategy. Interest rate swaps designated as cash flow hedges in accordance with the authoritative guidance for derivative and hedge accounting involve the receipt of variable-rate amounts from a counterparty in exchange for us making fixed-rate payments over the life of the agreements without exchange of the underlying notional amount.
As discussed above, our variable rate financing arrangements subject us to interest rate risk. If the benchmark LIBOR interest rate were to increase by 50 basis points this would have no impact on the interest payments on our variable rate facilities or payments made on our interest rate swap contracts The base rate on our credit facilities are subject to a floor of 0.75%, while the floor for our interest rate contracts are 0.76%. An increase of 50 basis points on LIBOR interest rates would not have placed rates above the floor for our variable rate facilities or our interest rate contracts. As of December 29, 2013, a 50 basis point decrease in the benchmark LIBOR interest rate would have decreased the fair value of our interest rate swap assets by $20.9 million.
Foreign Currency Risk
Certain parts of our foreign operations in Canada expose us to fluctuations in foreign exchange rates. Our goal is to reduce our exposure to such foreign exchange risks on our foreign currency cash flows and fair value fluctuations on recognized foreign currency denominated assets, liabilities and unrecognized firm commitments to acceptable levels primarily through the use of foreign exchange-related derivative financial instruments. We enter into derivative financial instruments to protect the value or fix the amount of certain obligations in terms of our functional currency. As of December 29, 2013, a 10% appreciation in the U.S. dollar relative to the Canadian dollar would have decreased the fair value of our foreign exchange forward contracts by $4.5 million.
Commodity Price Risk
We purchase raw materials in quantities expected to be used in a reasonable period of time in the normal course of business. We generally enter into agreements for either spot market delivery or forward delivery. The prices paid in the forward delivery contracts are generally fixed, but may also be variable within a capped or collared price range. The outstanding purchase commitment for these commodities at any point in time typically ranges from 6 to 12 months of anticipated requirements, depending on the commodity. These contracts are considered normal purchases and sales.

56
In addition, we may also purchase forward derivative contracts on certain commodities to manage the price risk associated with forecasted purchases of materials used in our manufacturing process. Generally, these derivatives are not designated as hedges as they do not meet the authoritative guidance for derivative and hedge accounting but they are not speculative. From time to time, we enter into commodity forward contracts to fix the price of natural gas, diesel fuel, corn, soybean oil and other commodity purchases at a future delivery date. Changes in the fair value of derivatives not designated in hedging relationships are recorded directly in Cost of products sold in the Consolidated Statements of Operations.
As of December 29, 2013, the potential change in fair value of commodity derivative instruments, assuming a 10% adverse movement in the underlying commodity prices, would have resulted in an unrealized net loss of $2.1 million.
Although we may utilize forward purchase contracts and other instruments to mitigate the risks related to commodity price fluctuation, such strategies do not fully mitigate commodity price risk. Adverse movements in commodity prices over the terms of the contracts or instruments could decrease the economic benefits we derive from these strategies.
ITEM 8. FINANCIAL STATEMENTS
REPORT OF INDEPENDENT REGISTERED PUBLIC ACCOUNTING FIRM
To the Board of Directors and Shareholders ofPinnacle Foods Inc.Parsippany, New Jersey
We have audited the accompanying consolidated balance sheets of Pinnacle Foods Inc. and subsidiaries (the “Company”) as of December 29, 2013 and December 30, 2012, and the related consolidated statements of operations, comprehensive earnings (loss), shareholders’ equity, and cash flows for each of the three years in the period ended December 29, 2013. Our audits also included the financial statement schedule listed in the Index at Item 15. These financial statements and financial statement schedule are the responsibility of the Company’s management. Our responsibility is to express an opinion on the financial statements and financial statement schedule based on our audits.
We conducted our audits in accordance with the standards of the Public Company Accounting Oversight Board (United States). Those standards require that we plan and perform the audit to obtain reasonable assurance about whether the financial statements are free of material misstatement. An audit includes examining, on a test basis, evidence supporting the amounts and disclosures in the financial statements. An audit also includes assessing the accounting principles used and significant estimates made by management, as well as evaluating the overall financial statement presentation. We believe that our audits provide a reasonable basis for our opinion.
In our opinion, such consolidated financial statements present fairly, in all material respects, the financial position of Pinnacle Foods Inc. and subsidiaries as of December 29, 2013 and December 30, 2012, and the results of their operations and their cash flows for each of the three years in the period ended December 29, 2013, in conformity with accounting principles generally accepted in the United States of America. Also, in our opinion, such financial statement schedule, when considered in relation to the basic consolidated financial statements taken as a whole, presents fairly, in all material respects, the information set forth therein.
We have also audited, in accordance with the standards of the Public Company Accounting Oversight Board (United States), the Company’s internal control over financial reporting as of December 29, 2013, based on the criteria established in Internal Control-Integrated Framework (1992) issued by the Committee of Sponsoring Organizations of the Treadway Commission and our report dated March 6, 2014 expressed an unqualified opinion on the Company’s internal control over financial reporting.
/s/ Deloitte & Touche LLPParsippany, New JerseyMarch 6, 2014
57
REPORT OF INDEPENDENT REGISTERED PUBLIC ACCOUNTING FIRM
To the Board of Directors and Shareholders ofPinnacle Foods Inc.Parsippany, New Jersey
We have audited the internal control over financial reporting of Pinnacle Foods Inc. and subsidiaries (the “Company”) as of December 29, 2013, based on criteria established in Internal Control-Integrated Framework (1992) issued by the Committee of Sponsoring Organizations of the Treadway Commission. As described in Management’s Annual Report on Internal Control Over Financial Reporting, management excluded from its assessment the internal control over financial reporting at Wishbone, which was acquired on October 1, 2013 and whose financial statements constitute 10.9% and 1.6% of total assets and net sales, respectively, of the consolidated financial statements as of and for the year ended December 29, 2013. Accordingly, our audit did not include the internal control over financial reporting at Wishbone. The Company’s management is responsible for maintaining effective internal control over financial reporting and for its assessment of the effectiveness of internal control over financial reporting, included in Management’s Annual Report on Internal Control over Financial Reporting. Our responsibility is to express an opinion on the Company’s internal control over financial reporting based on our audit.
We conducted our audit in accordance with the standards of the Public Company Accounting Oversight Board (United States). Those standards require that we plan and perform the audit to obtain reasonable assurance about whether effective internal control over financial reporting was maintained in all material respects. Our audit included obtaining an understanding of internal control over financial reporting, assessing the risk that a material weakness exists, testing and evaluating the design and operating effectiveness of internal control based on the assessed risk, and performing such other procedures as we considered necessary in the circumstances. We believe that our audit provides a reasonable basis for our opinion.
A company’s internal control over financial reporting is a process designed by, or under the supervision of, the company’s principal executive and principal financial officers, or persons performing similar functions, and effected by the company’s board of directors, management, and other personnel to provide reasonable assurance regarding the reliability of financial reporting and the preparation of financial statements for external purposes in accordance with generally accepted accounting principles. A company’s internal control over financial reporting includes those policies and procedures that (1) pertain to the maintenance of records that, in reasonable detail, accurately and fairly reflect the transactions and dispositions of the assets of the company; (2) provide reasonable assurance that transactions are recorded as necessary to permit preparation of financial statements in accordance with generally accepted accounting principles, and that receipts and expenditures of the company are being made only in accordance with authorizations of management and directors of the company; and (3) provide reasonable assurance regarding prevention or timely detection of unauthorized acquisition, use, or disposition of the company’s assets that could have a material effect on the financial statements.
Because of the inherent limitations of internal control over financial reporting, including the possibility of collusion or improper management override of controls, material misstatements due to error or fraud may not be prevented or detected on a timely basis. Also, projections of any evaluation of the effectiveness of the internal control over financial reporting to future periods are subject to the risk that the controls may become inadequate because of changes in conditions, or that the degree of compliance with the policies or procedures may deteriorate.
In our opinion, the Company maintained, in all material respects, effective internal control over financial reporting as of December 29, 2013, based on the criteria established in Internal Control-Integrated Framework (1992) issued by the Committee of Sponsoring Organizations of the Treadway Commission.
We have also audited, in accordance with the standards of the Public Company Accounting Oversight Board (United States), the consolidated financial statements and financial statement schedule as of and for the year ended December 29, 2013 of the Company and our report dated March 6, 2014 expressed an unqualified opinion on those financial statements.
/s/ Deloitte & Touche LLPParsippany, New JerseyMarch 6, 2014

58
PINNACLE FOODS INC. AND SUBSIDIARIESCONSOLIDATED STATEMENTS OF OPERATIONS(thousands, except per share amounts)
Fiscal year
December 29,
2013December 30,
2012December 25,
201152 weeks 53 weeks 52 weeks
Net sales $ 2,463,802 $ 2,478,485 $ 2,469,562Cost of products sold 1,809,553 1,893,936 1,854,696
Gross profit 654,249 584,549 614,866Operating expenses
Marketing and selling expenses 175,702 169,736 171,641Administrative expenses 119,790 89,414 80,460Research and development expenses 10,516 12,031 8,021Goodwill impairment charge — — 122,900Other expense (income), net 55,204 29,774 48,578
Total operating expenses 361,212 300,955 431,600Earnings before interest and taxes 293,037 283,594 183,266
Interest expense 132,354 198,484 208,319Interest income 141 110 242
Earnings (loss) before income taxes 160,824 85,220 (24,811)Provision for income taxes 71,475 32,701 22,103Net earnings (loss) $ 89,349 $ 52,519 $ (46,914)
Net earnings per shareBasic $ 0.84 $ 0.65 $ (0.58)Weighted average shares outstanding- basic 106,841 81,231 81,316Diluted $ 0.82 $ 0.61 $ (0.58)Weighted average shares outstanding- diluted 108,619 86,495 81,316Dividends declared $ 0.57 $ — $ —
See accompanying Notes to Consolidated Financial Statements

59
PINNACLE FOODS INC. AND SUBSIDIARIESCONSOLIDATED STATEMENTS OF COMPREHENSIVE EARNINGS (LOSS)(thousands of dollars)
Fiscal yearDecember 29,
2013December 30,
2012December 25,
201152 weeks 53 weeks 52 weeks
Net earnings (loss) $ 89,349 $ 52,519 $ (46,914)Other comprehensive earnings (loss)
Foreign currency translation (176) 276 284Net gain (loss) on financial instrument contracts 29,260 (7,317) (3,388)Gain (loss) on pension actuarial assumption adjustments 40,276 (20,178) (28,901)
Reclassifications into earnings:Financial instrument contracts 2,229 9,850 25,126Amortization of deferred mark-to-market adjustment on terminated swaps — 444 2,120Loss on pension actuarial assumption adjustments 1,663 2,413 732
Tax (provision) benefit on other comprehensive earnings (19,196) 5,395 1,123Total other comprehensive earnings (loss) - net of tax 54,056 (9,117) (2,904)Total comprehensive earnings (loss) $ 143,405 $ 43,402 $ (49,818)
See accompanying Notes to Consolidated Financial Statements

60
PINNACLE FOODS INC. AND SUBSIDIARIESCONSOLIDATED BALANCE SHEETS(thousands of dollars)
December 29,2013
December 30,2012
Current assets:Cash and cash equivalents $ 116,739 $ 92,281Accounts receivable, net of allowances of $5,849 and $5,149, respectively 164,664 143,884Inventories 361,872 358,051Other current assets 7,892 11,862Deferred tax assets 141,142 99,199
Total current assets 792,309 705,277Plant assets, net of accumulated depreciation of $297,103 and $244,694,respectively 523,270 493,666Tradenames 1,951,392 1,603,992Other assets, net 186,125 155,558Goodwill 1,628,095 1,441,495
Total assets $ 5,081,191 $ 4,399,988
Current liabilities:Short-term borrowings $ 2,437 $ 2,139Current portion of long-term obligations 24,580 30,419Accounts payable 142,353 137,326Accrued trade marketing expense 37,060 44,571Accrued liabilities 99,755 119,269Dividends payable 25,119 —
Total current liabilities 331,304 333,724Long-term debt (includes $63,976 and $63,097 owed to related parties,respectively) 2,476,167 2,576,386Pension and other postretirement benefits 49,847 100,918Other long-term liabilities 24,560 28,705Deferred tax liabilities 601,272 471,529
Total liabilities 3,483,150 3,511,262Commitments and contingencies (Note 13)Shareholders' equity:
Pinnacle preferred stock: $.01 per share, 50,000,000 shares authorized, noneissued — —Pinnacle common stock: par value $.01 per share, 500,000,000 sharesauthorized; issued and outstanding 117,231,853 and 81,210,672, respectively 1,172 812Additional paid-in-capital 1,328,847 696,512Retained earnings 275,519 252,955Accumulated other comprehensive loss (7,497) (61,553)
Total shareholders' equity 1,598,041 888,726Total liabilities and shareholders' equity $ 5,081,191 $ 4,399,988
See accompanying Notes to Consolidated Financial Statements

61
PINNACLE FOODS INC. AND SUBSIDIARIESCONSOLIDATED STATEMENTS OF CASH FLOWS(thousands of dollars)
Fiscal year
December 29,
2013December 30,
2012December 25,
201152 weeks 53 weeks 52 weeks
Cash flows from operating activitiesNet earnings (loss) $ 89,349 $ 52,519 $ (46,914)Non-cash charges (credits) to net earnings (loss)
Depreciation and amortization 78,225 98,123 88,476Goodwill and intangible asset impairment charge — 520 148,200Plant asset impairment charge — — 1,286Amortization of discount on term loan 1,354 994 1,205Amortization of debt acquisition costs 4,395 8,585 11,062Call premium on note redemptions 34,180 14,255 —Refinancing costs and write off of debt issuance costs 19,668 17,482 —Amortization of deferred mark-to-market adjustment on terminated swaps — 444 2,119Change in value of financial instruments (535) (1,185) 1,617Equity-based compensation charge 7,933 850 1,151Pension expense, net of contributions (9,131) (10,391) (13,543)Gain on sale of assets held for sale (3,627) — —Other long-term liabilities (1,872) 2,799 113Other long-term assets — — 169Deferred income taxes 67,852 30,929 20,524
Changes in working capitalAccounts receivable (21,347) 16,259 (10,952)Inventories 16,129 (22,027) (5,785)Accrued trade marketing expense (7,290) 9,383 (12,111)Accounts payable 4,112 (16,333) 38,201Accrued liabilities (17,052) (1,432) (23,490)Other current assets (101) 1,079 2,884
Net cash provided by operating activities 262,242 202,853 204,212Cash flows from investing activities
Payments for business acquisition (575,164) — —Capital expenditures (84,055) (78,279) (117,306)Proceeds from sale of plant assets 6,853 570 7,900
Net cash used in investing activities (652,366) (77,709) (109,406)Cash flows from financing activities
Net proceeds from issuance of common stock 624,953 — 558Repurchases of equity (191) (878) (1,624)Dividends paid (41,664) — —Proceeds from bank term loans 2,142,394 842,625 —Proceeds from notes offerings 350,000 — —Repayments of long-term obligations (1,736,146) (632,025) (57,547)Repurchase of notes (899,180) (373,255) —Proceeds from short-term borrowings 5,078 4,294 3,070Repayments of short-term borrowings (4,779) (3,863) (2,954)Borrowings under revolving credit facility — 40,000 —Repayments of revolving credit facility — (40,000) —Repayment of capital lease obligations (2,943) (3,511) (2,543)Debt acquisition costs (23,142) (17,498) (721)Other financing — — 2,730
Net cash provided by (used in) financing activities 414,380 (184,111) (59,031)Effect of exchange rate changes on cash 202 217 (30)Net change in cash and cash equivalents 24,458 (58,750) 35,745Cash and cash equivalents - beginning of period 92,281 151,031 115,286Cash and cash equivalents - end of period $ 116,739 $ 92,281 $ 151,031
Supplemental disclosures of cash flow information:Interest paid $ 120,310 $ 179,427 $ 196,339Interest received 141 110 241Income taxes paid (refunded) 3,425 1,981 (1,954)Non-cash investing and financing activities:
New capital leases 2,030 1,548 11,240Dividends payable 25,119 — —
See accompanying Notes to Consolidated Financial Statements
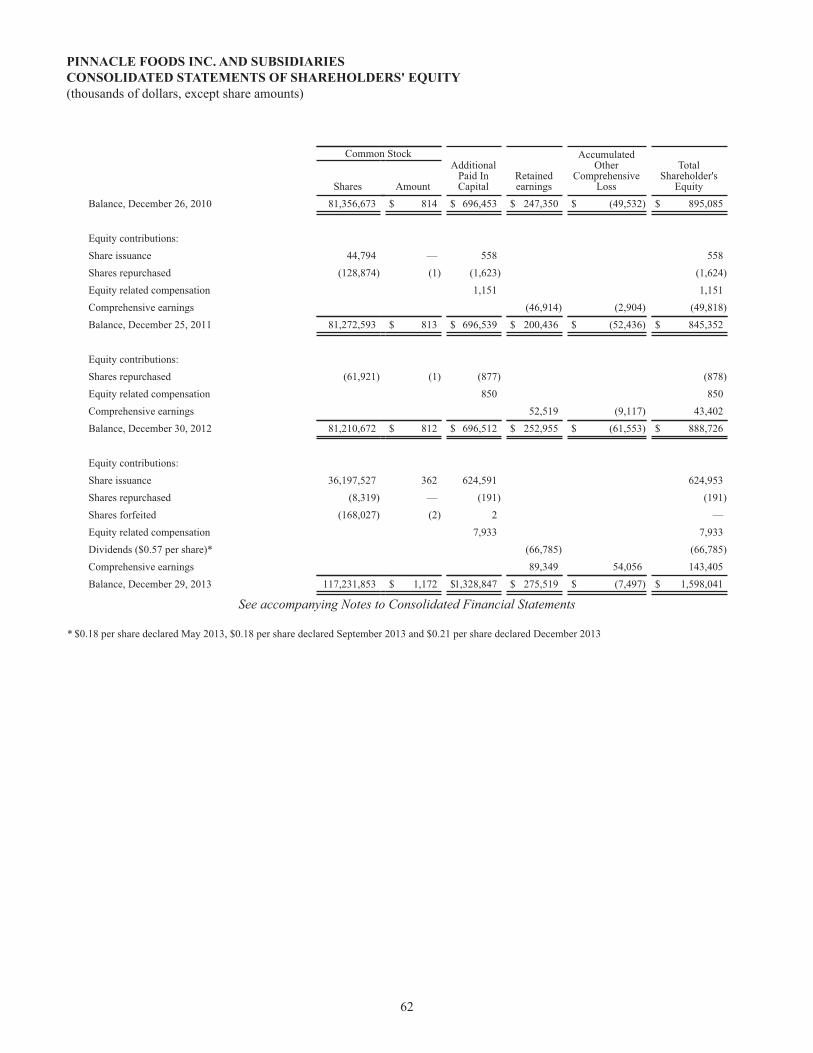
62
PINNACLE FOODS INC. AND SUBSIDIARIESCONSOLIDATED STATEMENTS OF SHAREHOLDERS' EQUITY(thousands of dollars, except share amounts)
Common StockAdditional
Paid InCapital
Retainedearnings
AccumulatedOther
ComprehensiveLoss
TotalShareholder's
EquityShares AmountBalance, December 26, 2010 81,356,673 $ 814 $ 696,453 $ 247,350 $ (49,532) $ 895,085
Equity contributions:Share issuance 44,794 — 558 558Shares repurchased (128,874) (1) (1,623) (1,624)Equity related compensation 1,151 1,151Comprehensive earnings (46,914) (2,904) (49,818)Balance, December 25, 2011 81,272,593 $ 813 $ 696,539 $ 200,436 $ (52,436) $ 845,352
Equity contributions:Shares repurchased (61,921) (1) (877) (878)Equity related compensation 850 850Comprehensive earnings 52,519 (9,117) 43,402Balance, December 30, 2012 81,210,672 $ 812 $ 696,512 $ 252,955 $ (61,553) $ 888,726
Equity contributions:Share issuance 36,197,527 362 624,591 624,953Shares repurchased (8,319) — (191) (191)Shares forfeited (168,027) (2) 2 —Equity related compensation 7,933 7,933Dividends ($0.57 per share)* (66,785) (66,785)Comprehensive earnings 89,349 54,056 143,405Balance, December 29, 2013 117,231,853 $ 1,172 $1,328,847 $ 275,519 $ (7,497) $ 1,598,041
See accompanying Notes to Consolidated Financial Statements
* $0.18 per share declared May 2013, $0.18 per share declared September 2013 and $0.21 per share declared December 2013

PINNACLE FOODS INC. AND SUBSIDIARIESNOTES TO CONSOLIDATED FINANCIAL STATEMENTS(thousands of dollars, except share amounts and where noted in millions)
63
1. Summary of Business Activities
Business Overview
Pinnacle Foods Inc. (hereafter referred to as “Pinnacle” or the “Company”), formerly known as Crunch Holding Corp., is a holding company whose sole asset is 100% ownership of Peak Finance Holdings LLC (“PFH”). PFH is a holding company whose sole asset is 100% ownership of Pinnacle Foods Finance LLC (“Pinnacle Foods Finance”). The Company is majority owned by affiliates of The Blackstone Group L.P. ("Blackstone"). In October 2013, approximately 30.7 million shares previously owned by certain Blackstone Funds were transferred to BCPV Pinnacle Holdings LLC. The transfer of these shares did not result in any change in beneficial ownership for any of the Blackstone Funds.
The Company is a leading manufacturer, marketer and distributor of high quality, branded convenience food products, the products and operations of which are managed and reported in three operating segments: (i) Birds Eye Frozen, (ii) Duncan Hines Grocery and (iii) Specialty Foods. The Company’s United States retail frozen vegetables (Birds Eye), frozen complete bagged meals (Birds Eye Voila!), frozen seafood (Van de Kamp’s, Mrs. Paul’s), full-calorie single-serve frozen dinners and entrées (Hungry-Man), frozen breakfast (Aunt Jemima), frozen and refrigerated bagels (Lender’s), and frozen pizza for one (Celeste) are reported in the Birds Eye Frozen Division. The Company’s baking mixes and frostings (Duncan Hines), liquid and dry-mix salad dressings (Wish-Bone, Western and Bernstein's), shelf-stable pickles (Vlasic), table syrups (Mrs. Butterworth’s and Log Cabin), canned meat (Armour, Nalley and Brooks), pie and pastry fillings (Comstock and Wilderness), barbecue sauces (Open Pit) and all Canadian operations are reported in the Duncan Hines Grocery Division. The Specialty Foods Division consists of snack products (Tim’s Cascade and Snyder of Berlin) and the Company’s food service and private label businesses.
Significant transactions affecting comparability
The results of operations in the fiscal years ended December 29, 2013 and December 30, 2012 are impacted by our April 2013 initial public offering (the "IPO") and the April 2013 and 2012 refinancings which significantly affected Administrative expenses, Other expense, Interest expense and Provision for income taxes.
History and Current Ownership
Since 2001, the Company and its predecessors have been involved in several business combinations to acquire certain assets and liabilities related to the brands discussed above.
On December 23, 2009, Pinnacle Foods Group LLC (“PFG LLC”), an entity wholly owned by Pinnacle Foods Finance, purchased Birds Eye Foods, Inc. (the “Birds Eye Acquisition”).
On March 12, 2013, the Company’s board of directors authorized a 55.2444 for 1 split of the common stock. The split became effective on the date of approval. The Company retained the par value of $0.01 per share for all shares of common stock. All references to numbers of common shares and per-share data in the accompanying financial statements have been adjusted to reflect the stock split on a retroactive basis. Shareholders’ equity reflects the stock split by reclassifying from “Additional paid-in capital” to “Common stock” an amount equal to the par value of the additional shares arising from the split.
On March 27, 2013, the U.S. Securities and Exchange Commission ("SEC") declared effective the Company's registration statement on Form S-1 related to the IPO. The Company's common stock began trading on the New York Stock Exchange ("NYSE"), under the ticker symbol "PF", on March 28, 2013. In connection with the IPO, 2,618,307 additional shares were issued through the exercise of a warrant agreement by Peak Holdings LLC ("Peak Holdings"), which was the majority owner of the Company and Pinnacle Foods Finance prior to the IPO. Immediately thereafter, the warrant agreement was terminated and Peak Holdings was dissolved. On April 3, 2013, the IPO closed in which the Company issued and sold 33,350,000 shares of common stock for cash consideration of $20.00 per share ($18.80 per share net of underwriting discounts). None of Blackstone, Directors or management of the Company sold any shares as part of the IPO. The Company received approximately $623.9 million in net proceeds ($667.0 million of gross proceeds net of $43.1 million of underwriting discounts and other expenses) from the offering, which were used to pay down outstanding debt. See Note 10 of the Consolidated Financial Statements "Debt and Interest Expense" for further details.

PINNACLE FOODS INC. AND SUBSIDIARIESNOTES TO CONSOLIDATED FINANCIAL STATEMENTS(thousands of dollars, except share amounts and where noted in millions)
64
On December 11, 2013, the SEC declared effective the Company's registration statement on Form S-1 related to a secondary offering. In connection with this offering, Blackstone sold 19,550,000 shares which reduced their ownership to approximately 51%. The Company did not receive any proceeds from the sale.
2. Summary of Significant Accounting Policies
Consolidation. The Consolidated Financial Statements include the accounts of Pinnacle and its wholly-owned subsidiaries. The results of companies acquired during the year are included in the Consolidated Financial Statements from the effective date of the acquisition. Intercompany transactions have been eliminated in consolidation.
During the third quarter of 2011, a subsidiary of the Company entered into a transaction with U.S. Bancorp Community Development Corporation and Iowa Community Development LC in connection with our participation in the federal government's New Markets Tax Credit Program. Under the terms of the transaction, the Company received proceeds of $2.7 million, which was used to expand the Ft. Madison, Iowa manufacturing facility. The Company must maintain its status as a qualified entity for a period of seven years from the closing date in order to earn the $2.7 million benefit received. The assets acquired with the proceeds of the transaction, as well as certain other assets of the Company are pledged to secure the Company's continued qualification under the New Markets Tax Credit Program. The $2.7 million is recorded in Other long-term liabilities on the Consolidated Balance Sheet. The transaction resulted in the creation of two new entities, ICD XIII LLC and Pinnacle Foods Investment Fund LLC. Pinnacle has no legal equity interest in these entities. However, since the primary purpose of this transaction is to facilitate benefits for the Company under the New Markets Tax Credit Program and the Company provides a guaranty of its status as a qualified entity, the consolidation analysis determined that the Company is the primary beneficiary and the two new entities should be, and are, consolidated in our Consolidated Financial Statements.
Foreign Currency Translation. Foreign-currency-denominated assets and liabilities are translated into U.S. dollars at exchange rates existing at the respective balance sheet dates. Translation adjustments resulting from fluctuations in exchange rates are recorded as a separate component of Accumulated other comprehensive loss within shareholder's equity. The Company translates the results of operations of its foreign subsidiary at the average exchange rates during the respective periods. Gains and losses resulting from foreign currency transactions are included in Cost of products sold on the Consolidated Statements of Operations and were a $1,897 gain in the year ended December 29, 2013, $344 loss in the year ended December 30, 2012 and a $1,537 loss in the year ended December 25, 2011. These amounts include the mark to market and realized gains and losses on our foreign currency swaps as discussed in Note 12 to our Consolidated Financial Statements.
Fiscal Year. The Company's fiscal year ends on the last Sunday in December resulting in fifty-two-week fiscal years for 2013 and 2011 and a fifty-three-week fiscal year for 2012.
Cash and Cash Equivalents. The Company considers investments in all highly liquid debt instruments with an initial maturity of three months or less to be cash equivalents. Cash equivalents are measured at fair value and are Level 1 assets.
Inventories. Substantially all inventories are valued at the lower of average cost or net realizable value. The type of costs included in inventory are ingredients, containers, packaging, other raw materials, direct manufacturing labor and fully absorbed manufacturing overheads. When necessary, the Company provides allowances to adjust the carrying value of its inventories to the lower of cost or net realizable value, including any costs to sell or dispose and consideration for obsolescence, excessive inventory levels, product deterioration and other factors in evaluating net realizable value.
Plant Assets. Plant assets are stated at historical cost, and depreciation is computed using the straight-line method over the lives of the assets. Buildings and machinery and equipment are depreciated over periods not exceeding 45 years and 15 years, respectively. The weighted average estimated remaining useful lives are approximately 15 years for buildings and 7 years for machinery and equipment. When assets are retired, sold, or otherwise disposed of, their gross carrying value and related accumulated depreciation are removed from the accounts and included in determining gain or loss on such disposals. Costs of assets acquired in a business combination are based on the estimated fair value at the date of acquisition.

PINNACLE FOODS INC. AND SUBSIDIARIESNOTES TO CONSOLIDATED FINANCIAL STATEMENTS(thousands of dollars, except share amounts and where noted in millions)
65
Goodwill and Indefinite-lived Intangible Assets. The Company evaluates the carrying amount of goodwill and indefinite-lived tradenames for impairment on at least an annual basis and when events occur or circumstances change that an impairment might exist. The Company performs goodwill impairment testing for each business which constitutes a component of the Company's operating segments, known as reporting units. The Company performs quantitative testing by calculating the fair value of each reporting unit. The Company compares the fair value of these reporting units with their carrying values inclusive of goodwill. If the carrying amount of the reporting unit exceeds its fair value, the Company compares the implied fair value of the reporting unit's goodwill to its carrying amount and any shortfall is charged to earnings. In estimating the implied fair value of the goodwill, the Company estimates the fair value of the reporting unit's tangible and intangible assets (other than goodwill). In estimating the fair value of our reporting units, the Company primarily uses the income approach, which utilizes forecasted discounted cash flows to estimate the fair value for each reporting unit. The income approach utilizes management's business plans and projections as the basis for expected future cash flows for five years plus a terminal year. It requires significant assumptions including projected sales growth rates and operating margins and the weighted average cost of capital. In the most recent impairment tests, the Company forecasted cash flows for five years plus a terminal year and assumed a weighted average cost of capital of 7.5%. These projections assume sales growth rates for the next five years and the terminal year that generally average between 1.0% and 3.0% and operating margins which increase moderately from historical levels over time as a result of planned capital improvements in our plants and manufacturing efficiency projects. These assumptions are determined based upon management's expectations for each of the individual reporting units.
For indefinite-lived tradename intangible assets, the Company determines recoverability by comparing the carrying value to its fair value estimated based on discounted cash flows attributable to the tradename and charges the shortfall, if any, to earnings. In estimating the fair value of trade names, the Company primarily uses the the relief from royalty method. The relief from royalty method involves discounted cash flow techniques, which require management to make significant assumptions regarding the weighted average cost of capital, sales growth trends and royalty rates.
Assumptions underlying fair value estimates referred to above are subject to risks and uncertainties. These measurements would be considered level 3 under the fair value hierarchy as described in Note 4 to the Consolidated Financial Statements. For more information on goodwill and indefinite-lived intangible assets, please refer to Note 8 to the Consolidated Financial Statements.
Valuation of Long-Lived Assets. The carrying value of long-lived assets held and used, other than goodwill and indefinite-lived intangibles, is evaluated at the asset group level when events or changes in circumstances indicate the carrying value may not be recoverable. The carrying value of a long-lived asset group is considered impaired when the total projected undiscounted cash flows from such asset group are less than the carrying value. In that event, a loss is recognized based on the amount by which the carrying value exceeds the fair market value of the long-lived asset group. Fair market value is determined primarily using the projected cash flows from the asset group discounted at a rate commensurate with the risk involved. Losses on long-lived asset groups held for sale, other than goodwill, are determined in a similar manner, except that fair market values are reduced for disposal costs.
Revenue Recognition and Trade Marketing. Revenue from product sales is recognized upon shipment to the customers as terms are free on board ("FOB") shipping point, at which point title and risk of loss is transferred and the selling price is fixed or determinable. This completes the revenue-earning process specifically that an arrangement exists, delivery has occurred, ownership has transferred, the price is fixed and collectability is reasonably assured. A provision for payment discounts and product return allowances, which is estimated based upon the Company's historical performance, management's experience and current economic trends, is recorded as a reduction of sales in the same period that the revenue is recognized.
Trade promotions, consisting primarily of customer pricing allowances and merchandising funds, and consumer coupons are offered through various programs to customers and consumers. Sales are recorded net of estimated trade promotion spending, which is recognized as incurred at the time of sale. Certain retailers require the payment of slotting fees in order to obtain space for the Company's products on the retailer's store shelves. The fees are recognized as reductions of revenue on the date a liability to the retailer is created. These amounts are included in the determination of net sales. Accruals for expected payouts under these programs are included as accrued trade marketing expense in the Consolidated Balance Sheet. Coupon redemption costs are also recognized as reductions of net sales when the coupons are issued. Estimates of trade promotion expense and coupon redemption costs are based upon programs offered, timing of those offers, estimated redemption/usage rates from historical performance, management's experience and current economic trends.
PINNACLE FOODS INC. AND SUBSIDIARIESNOTES TO CONSOLIDATED FINANCIAL STATEMENTS(thousands of dollars, except share amounts and where noted in millions)
66
Trade marketing expense is comprised of amounts paid to retailers for programs designed to promote our products. These costs include standard introductory allowances for new products (slotting fees). They also include the cost of in-store product displays, feature pricing in retailers' advertisements and other temporary price reductions. These programs are offered to our customers both in fixed and variable (rate per case) amounts. The ultimate cost of these programs depends on retailer performance and is the subject of significant management estimates. The Company records as expense the estimated ultimate cost of the program in the period during which the program occurs. In accordance with the authoritative guidance for revenue recognition, these trade marketing expenses are classified in the Consolidated Statements of Operations as a reduction of net sales. Also, in accordance with the guidance, coupon redemption costs are also recognized as reductions of net sales when issued.
Advertising. Advertising costs include the cost of working media (advertising on television, radio or in print), the cost of producing advertising, and the cost of coupon insertion and distribution. Working media and coupon insertion and distribution costs are expensed in the period the advertising is run or the coupons are distributed. The cost of producing advertising is expensed as of the first date the advertisement takes place. Advertising included in the Company's marketing and selling expenses were $34,031 for fiscal year ended December 29, 2013, $37,260 for fiscal year ended December 30, 2012 and $50,106 for fiscal year ended December 25, 2011.
Shipping and Handling Costs. In accordance with the authoritative guidance for revenue recognition, costs related to shipping and handling of products shipped to customers are classified as Cost of products sold.
Pension benefits. The Company provides pension benefits to certain employees and retirees. Pension benefits are no longer offered to salaried employees. All salaried pension benefits which existed are frozen. Determining the cost associated with such benefits is dependent on various actuarial assumptions, including discount rates, expected return on plan assets, compensation increases, turnover rates and mortality rates. Independent actuaries, in accordance with GAAP, perform the required calculations to determine pension expense. Actual results that differ from the actuarial assumptions are generally accumulated and amortized over future periods.
Equity-Based Compensation. Grant-date fair value of stock options is estimated using the Black-Scholes option-pricing model, which includes using the simplified method to estimate the number of periods to exercise date. While we had equity compensation plans in place as a private company, our broader post-IPO equity compensation plans have not been in place for a sufficient amount of time to understand their post vesting behavior. As such, we will continue to use this methodology until such time we have sufficient history to provide a reasonable basis on which to estimate the expected term. Compensation expense is reduced based on estimated forfeitures with adjustments to actual expense recorded at the time of vesting. Forfeitures are estimated based on historical experience. The majority of our equity options have a three-year vesting period. For those options that have a performance condition, compensation expense is based upon the number of shares expected to vest after assessing the probability that the performance criteria will be met. We recognize compensation cost for awards over the vesting period, adjusted for any changes in our probability assessment.
Insurance reserves. The Company is self-insured under its worker's compensation insurance policy. The Company utilizes a stop loss policy issued by an insurance company to fund claims in excess of $350. The Company estimates the outstanding retained-insurance liabilities by projecting incurred losses to their ultimate liability and subtracting amounts paid-to-date to obtain the remaining liabilities. The Company bases actuarial estimates of ultimate liability on actual incurred losses, estimates of incurred but not yet reported losses and the projected costs to resolve these losses.
Income Taxes. Income taxes are accounted for in accordance with the authoritative guidance for accounting for income taxes under which deferred tax assets and liabilities are determined based on the difference between the financial statement and tax bases of assets and liabilities, using enacted tax rates in effect for the year in which the differences are expected to reverse. The Company continually reviews its deferred tax assets for recovery. A valuation allowance is established when the Company believes that it is more likely than not that some portion of its deferred tax assets will not be realized. Changes in valuation allowances from period to period are included in the Company's tax provision in the period of change.
Financial Instruments. The Company uses financial instruments to manage its exposure to movements in interest rates, certain commodity prices and foreign currencies. The use of these financial instruments modifies the exposure of these risks with the
PINNACLE FOODS INC. AND SUBSIDIARIESNOTES TO CONSOLIDATED FINANCIAL STATEMENTS(thousands of dollars, except share amounts and where noted in millions)
67
intent to reduce the risk or cost to the Company. The Company does not use derivatives for trading purposes and is not a party to leveraged derivatives. The authoritative guidance for derivative and hedge accounting requires that all derivatives be recognized as either assets or liabilities at fair value. Changes in the fair value of derivatives not designated as hedging instruments are recognized in earnings. The cash flows associated with the financial instruments are included in the cash flow from operating activities.
Deferred financing costs. Deferred financing costs are amortized over the life of the related debt using the effective interest rate method. If debt is prepaid or retired early, the related unamortized deferred financing costs are written off in the period the debt is retired.
Capitalized Internal Use Software Costs. The Company capitalizes the cost of internal-use software that has a useful life in excess of one year. These costs consist of payments made to third parties and the salaries of employees working on such software development. Subsequent additions, modifications or upgrades to internal-use software are capitalized only to the extent that they allow the software to perform a task it previously did not perform. Capitalized internal use software costs are amortized using the straight-line method over their estimated useful lives, generally 2 ½ to 3 years. The Company amortized $6,229 for fiscal year ended December 29, 2013, $4,723 for fiscal year ended December 30, 2012 and $4,221 for fiscal year ended December 25, 2011. Additionally, as of December 29, 2013 and December 30, 2012, the net book value of capitalized internal use software totaled $13,552 and $11,276, respectively and is included in Plant assets, net on the Consolidated Balance Sheets.
Accumulated other comprehensive loss. Accumulated other comprehensive loss includes loss on financial instruments, foreign currency translation adjustments, net gains or (losses) on pension actuarial assumptions and the related tax provisions or benefits that are currently presented as a component of shareholder's equity. The components of Accumulated other comprehensive loss at year end were as follows:
December 29,2013
December 30,2012
Swaps mark to market adjustments $ 28,611 $ (2,878)
Foreign currency translation (546) (369)
Loss on pension actuarial assumptions (27,434) (69,374)
Tax (expense) benefit (8,128) 11,068
Accumulated other comprehensive loss $ (7,497) $ (61,553)
Use of Estimates. The preparation of financial statements in conformity with accounting principles generally accepted in the United States of America requires management to make estimates and assumptions that affect amounts reported in the financial statements and accompanying notes. Actual results could differ from those estimates.
Recently Issued Accounting Pronouncements
In July 2013, the Financial Accounting Standards Board ("FASB") issued Accounting Standards Update No. 2013-11, “Income Taxes (Topic 740): Presentation of an Unrecognized Tax Benefit When a Net Operating Loss Carryforward, a Similar Tax Loss, or a Tax Credit Carryforward Exists,” (“ASU 2013-11”). The update provides guidance on financial statement presentation of an unrecognized tax benefit when a net operating loss ("NOL") carryforward, a similar tax loss, or a tax credit carryforward exists. This ASU applies to all entities with unrecognized tax benefits that also have tax loss or tax credit carryforwards in the same tax jurisdiction as of the reporting date. The Company adopted this standard in December 2013 noting no material impact on its consolidated financial statements.
In February 2013, the FASB issued Accounting Standards Update No. 2013-02, “Comprehensive Income (Topic 220): Reporting of Amounts Reclassified Out of Accumulated Other Comprehensive Income,” (“ASU 2013-02”). This new guidance requires that we present either in a single note or parenthetically on the face of the financial statements, the effect of significant amounts reclassified from each component of accumulated other comprehensive income based on its source and the income statement line items affected by the reclassification. This guidance only impacts disclosures within our consolidated financial statements and
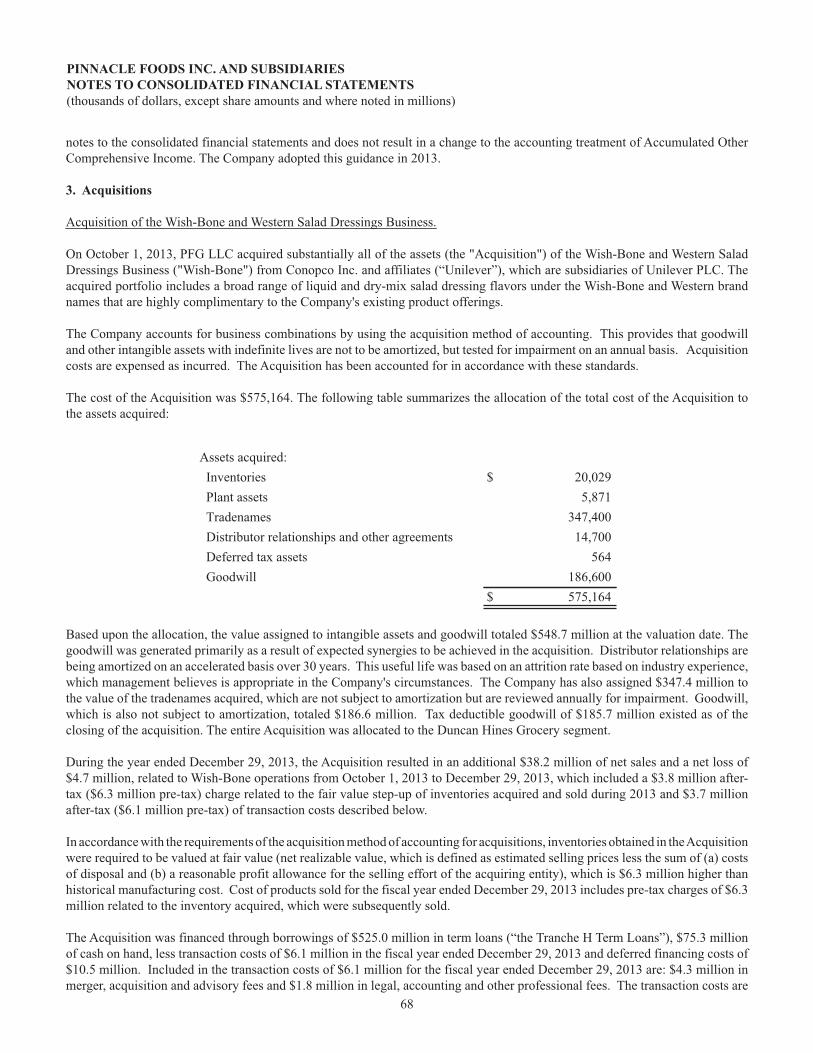
PINNACLE FOODS INC. AND SUBSIDIARIESNOTES TO CONSOLIDATED FINANCIAL STATEMENTS(thousands of dollars, except share amounts and where noted in millions)
68
notes to the consolidated financial statements and does not result in a change to the accounting treatment of Accumulated Other Comprehensive Income. The Company adopted this guidance in 2013.
3. Acquisitions
Acquisition of the Wish-Bone and Western Salad Dressings Business. On October 1, 2013, PFG LLC acquired substantially all of the assets (the "Acquisition") of the Wish-Bone and Western Salad Dressings Business ("Wish-Bone") from Conopco Inc. and affiliates (“Unilever”), which are subsidiaries of Unilever PLC. The acquired portfolio includes a broad range of liquid and dry-mix salad dressing flavors under the Wish-Bone and Western brand names that are highly complimentary to the Company's existing product offerings. The Company accounts for business combinations by using the acquisition method of accounting. This provides that goodwill and other intangible assets with indefinite lives are not to be amortized, but tested for impairment on an annual basis. Acquisition costs are expensed as incurred. The Acquisition has been accounted for in accordance with these standards. The cost of the Acquisition was $575,164. The following table summarizes the allocation of the total cost of the Acquisition to the assets acquired:
Assets acquired: Inventories $ 20,029 Plant assets 5,871 Tradenames 347,400 Distributor relationships and other agreements 14,700 Deferred tax assets 564 Goodwill 186,600
$ 575,164
Based upon the allocation, the value assigned to intangible assets and goodwill totaled $548.7 million at the valuation date. The goodwill was generated primarily as a result of expected synergies to be achieved in the acquisition. Distributor relationships are being amortized on an accelerated basis over 30 years. This useful life was based on an attrition rate based on industry experience, which management believes is appropriate in the Company's circumstances. The Company has also assigned $347.4 million to the value of the tradenames acquired, which are not subject to amortization but are reviewed annually for impairment. Goodwill, which is also not subject to amortization, totaled $186.6 million. Tax deductible goodwill of $185.7 million existed as of the closing of the acquisition. The entire Acquisition was allocated to the Duncan Hines Grocery segment. During the year ended December 29, 2013, the Acquisition resulted in an additional $38.2 million of net sales and a net loss of $4.7 million, related to Wish-Bone operations from October 1, 2013 to December 29, 2013, which included a $3.8 million after-tax ($6.3 million pre-tax) charge related to the fair value step-up of inventories acquired and sold during 2013 and $3.7 million after-tax ($6.1 million pre-tax) of transaction costs described below.
In accordance with the requirements of the acquisition method of accounting for acquisitions, inventories obtained in the Acquisition were required to be valued at fair value (net realizable value, which is defined as estimated selling prices less the sum of (a) costs of disposal and (b) a reasonable profit allowance for the selling effort of the acquiring entity), which is $6.3 million higher than historical manufacturing cost. Cost of products sold for the fiscal year ended December 29, 2013 includes pre-tax charges of $6.3 million related to the inventory acquired, which were subsequently sold. The Acquisition was financed through borrowings of $525.0 million in term loans (“the Tranche H Term Loans”), $75.3 million of cash on hand, less transaction costs of $6.1 million in the fiscal year ended December 29, 2013 and deferred financing costs of $10.5 million. Included in the transaction costs of $6.1 million for the fiscal year ended December 29, 2013 are: $4.3 million in merger, acquisition and advisory fees and $1.8 million in legal, accounting and other professional fees. The transaction costs are

PINNACLE FOODS INC. AND SUBSIDIARIESNOTES TO CONSOLIDATED FINANCIAL STATEMENTS(thousands of dollars, except share amounts and where noted in millions)
69
recorded in Other expense (income), net in the Consolidated Statements of Operations. The Company also incurred $8.5 million in original issue discount in connection with the Tranche H Term Loans. This was recorded in Long-term debt on the Consolidated Balance Sheets and is being amortized over the life of the loan using the effective interest method. For more information, see Note 10 to the Consolidated Financial Statements, Debt and Interest Expense. Pro forma Information
The following unaudited pro forma summary presents the Company's consolidated results of operations as if Wish-Bone had been acquired on December 26, 2011. These amounts adjusted Wish-Bone's historical results to reflect the additional depreciation and amortization that would have been charged assuming the fair value adjustments to plant assets and intangible assets had been applied from December 26, 2011, together with the consequential tax effects. These adjustments also reflect the additional interest expense incurred on the debt to finance the purchase. The 2013 pro forma earnings were adjusted to exclude the acquisition related costs incurred in 2013 and the nonrecurring expense related to the fair value inventory step-up adjustment. The 2012 pro forma earnings were adjusted to include these charges. The pro forma financial information presented below is for informational purposes only and is not indicative of the results of operations that would have been achieved if the acquisition and borrowings undertaken to finance the acquisition had taken place at the beginning of 2012.
Amounts in millions:
Year endedDecember 29, 2013
(unaudited)
Year endedDecember 30, 2012
(unaudited)Net sales $ 2,612.7 $ 2,670.7Net earnings $ 110.1 $ 65.1
4. Fair Value Measurements
The authoritative guidance for financial assets and liabilities discusses valuation techniques, such as the market approach (comparable market prices), the income approach (present value of future income or cash flow), and the cost approach (cost to replace the service capacity of an asset or replacement cost). The guidance utilizes a fair value hierarchy that prioritizes the inputs to valuation techniques used to measure fair value into three broad levels. The following is a brief description of those three levels:
Level 1: Observable inputs such as quoted prices (unadjusted) in active markets for identical assets or liabilities.
Level 2: Inputs other than quoted prices that are observable for the asset or liability, either directly or indirectly. These include quoted prices for similar assets or liabilities in active markets and quoted prices for identical or similar assets or liabilities in markets that are not active.
Level 3: Unobservable inputs that reflect the Company’s assumptions.

PINNACLE FOODS INC. AND SUBSIDIARIESNOTES TO CONSOLIDATED FINANCIAL STATEMENTS(thousands of dollars, except share amounts and where noted in millions)
70
The Company’s financial assets and liabilities subject to recurring fair value measurements and the required disclosures are as follows:
Fair Value
as ofDecember 29,
2013
Fair Value MeasurementsUsing Fair Value Hierarchy
Fair Valueas of
December 30,2012
Fair Value MeasurementsUsing Fair Value Hierarchy
Level 1 Level 2 Level 3 Level 1 Level 2 Level 3
AssetsInterest rate derivatives $ 29,518 $ — $ 29,518 $ — $ — $ — $ — $ —Foreign currencyderivatives 307 — 307 — 638 — 638 —Commodity derivatives 543 — 543 — 525 — 525 —Total assets at fair value $ 30,368 $ — $ 30,368 $ — $ 1,163 $ — $ 1,163 $ —
LiabilitiesInterest rate derivatives $ 1,904 $ — $ 1,904 $ — $ 3,807 $ — $ 3,807 $ —Commodity derivatives — — — — 682 — 682 —Total liabilities at fair value $ 1,904 $ — $ 1,904 $ — $ 4,489 $ — $ 4,489 $ —
The Company manages economic risks, including interest rate, liquidity and credit risk, primarily by managing the amount, sources and duration of its debt funding and the use of derivative financial instruments. The primary risks managed by using derivative instruments are interest rate risk, foreign currency exchange risk and commodity price risk.
The valuations of these instruments are determined using widely accepted valuation techniques, including discounted cash flow analysis on the expected cash flows of each derivative. This analysis reflects the contractual terms of the derivatives, including the period to maturity, and uses observable market-based inputs, including interest rate, commodity, and foreign exchange forward curves. The fair values of interest rate swaps are determined using the market standard methodology of netting the discounted future fixed cash payments (or receipts) and the discounted expected variable cash receipts (or payments). The variable cash receipts (or payments) are based on an expectation of future interest rates (forward curves) derived from observable market interest rate curves. To comply with the provisions of the authoritative guidance for fair value disclosure, the Company incorporates credit valuation adjustments to appropriately reflect both its own non-performance risk and the respective counterparty’s non-performance risk in the fair value measurements. In adjusting the fair value of its derivative contracts for the effect of non-performance risk, the Company has considered the impact of netting and any applicable credit enhancements, such as collateral postings, thresholds, mutual puts, and guarantees. The Company had no fair value measurements based upon significant unobservable inputs (Level 3) as of December 29, 2013 or December 30, 2012.
In addition to the instruments named above, the Company also makes fair value measurements in connection with its annual goodwill and trade name impairment testing. These measurements would fall into Level 3 of the fair value hierarchy.
In December 2011, the Company adopted the provisions of the FASB Accounting Standards Update No. 2011-04, “Amendments to Achieve Common Fair Value Measurement and Disclosure Requirements," (“ASU 2011-04”). For purposes of calculating fair value of financial instruments, we manage the portfolio of financial assets and financial liabilities on the basis of the Company's net exposure to credit risk. The Company has elected to apply the portfolio exception in ASU 2011-04 with respect to measuring counterparty credit risk for all of its derivative transactions subject to master netting arrangements on a net basis by counterparty portfolio.

PINNACLE FOODS INC. AND SUBSIDIARIESNOTES TO CONSOLIDATED FINANCIAL STATEMENTS(thousands of dollars, except share amounts and where noted in millions)
71
5. Shareholder's Equity and Equity-Based Compensation Expense
Equity-based Compensation
The Company has two long-term incentive programs: The 2007 Stock Incentive Plan and the 2013 Omnibus Incentive Plan. Prior to March 28, 2013, PFH, the former parent of the Company also had the 2007 Unit Plan, which was terminated in connection with the Company's IPO. Equity-based compensation expense recognized during the period is based on the value of the portion of equity-based payment awards that is ultimately expected to vest during the period. As equity-based compensation expense recognized in the Consolidated Statements of Operations is based on awards ultimately expected to vest, it has been reduced for estimated forfeitures. The authoritative guidance for equity compensation requires forfeitures to be estimated at the time of grant and revised, if necessary, in subsequent periods if actual forfeitures differ from those estimates.
The Company currently uses the Black-Scholes option-pricing model as its method of valuation for equity-based awards. Prior to March 28, 2013, since the underlying equity was not publicly traded, the determination of fair value of equity-based payment awards on the date of grant using an option-pricing model was based upon estimates of enterprise value as well as assumptions regarding a number of highly complex and subjective variables. The estimated enterprise value was based upon forecasted cash flows for five years plus a terminal year and an assumed discount rate. The other variables used to determine fair value of equity-based payment awards include, but are not limited to, the expected stock price volatility of a group of industry comparable companies over the term of the awards, and actual and projected employee equity option exercise behaviors.
The fair value of the options granted during the fiscal years ended December 29, 2013, December 30, 2012 and December 25, 2011 was estimated on the date of the grant using the Black-Scholes model with the following weighted average assumptions:
Fiscal year endedDecember 29,
2013December 30,
2012December 25,
2011
Risk-free interest rate 1.17% 0.34% 0.64%Expected time to option exercise 6.50 years 3.50 years 1.93 yearsExpected volatility of Pinnacle Foods Inc. stock 35% 40% 55%Expected dividend yield on Pinnacle Foods Inc. stock 3.54% * 2% - 4% 0%
* Dividend yield is based on the weighted average of the expected yield at the time of each grant, 3.54% is principally the result of options granted at the IPO price of $20.00 a share. No dividend was in effect prior to 2013.
Volatility was based on the average volatility of a group of publicly traded food companies. The Company estimates the annual forfeiture rates to be approximately 10% under its long-term incentive plans.

PINNACLE FOODS INC. AND SUBSIDIARIESNOTES TO CONSOLIDATED FINANCIAL STATEMENTS(thousands of dollars, except share amounts and where noted in millions)
72
Expense Information
The following table summarizes equity-based compensation expense related to employee equity options and employee equity units under the authoritative guidance for equity compensation which was allocated as follows:
Fiscal year ended
December 29,2013
December 30,2012
December 25,2011
Cost of products sold $ 633 $ 113 $ 152Marketing and selling expenses 1,399 342 463Administrative expenses 5,792 370 502Research and development expenses 109 25 34Pre-Tax Equity-Based Compensation Expense 7,933 850 1,151Income Tax Benefit 2,083 30 33Net Equity-Based Compensation Expense $ 5,850 $ 820 $ 1,118
As of December 29, 2013, cumulative unrecognized equity compensation expense of the unvested portion of shares and options for the Company's two long-term incentive programs was $40,059. The weighted average period over which vesting will occur is approximately 5.3 years for the 2007 Stock Incentive Plan and 2.3 years for the 2013 Omnibus Plan. The Company did not meet the Management EBITDA target in 2013, 2012 or in 2011 for awards issued in 2011 and prior and, as a result, the performance awards did not vest. For grants issued in 2012, the Company met the 2013 Management EBITDA target, resulting in recognition of $221 of equity based compensation expense. Options under the plans have a termination date of 10 years from the date of issuance.
2007 Stock Incentive PlanThe Company adopted an equity option plan (the “2007 Stock Incentive Plan”) providing for the issuance of up to 1,104,888 shares of the Company's common stock. Pursuant to the 2007 Stock Incentive Plan, certain officers, employees, managers, directors and other persons were eligible to receive grants of nonqualified stock options, as permitted by applicable law. For options granted from 2007 to 2009, generally 25% of the options will vest ratably over five years (“Time-Vested Options”), subject to full acceleration upon a change of control. Fifty percent of the options vest ratably over five years if annual or cumulative Management EBITDA targets, as defined, are met (“Performance Options”). The final 25% of the options vest either on a change of control or liquidity event, if a 12% annual internal rate of return is attained by Blackstone (“Exit Options”). In addition, the plan was also revised to provide that if the EBITDA target is achieved in any two consecutive fiscal years (excluding 2007 and 2008) during the employee's continued employment, then that year's and all prior years' performance options will vest and become exercisable, and if the exit options vest and become exercisable during the employees continued employment, then all the performance options will also vest and become exercisable. Subsequent to 2009, the Company awarded options in the form of Time Vested Options (25%) and Performance Options (75%) to certain employees. The options have the same vesting provisions as stated above, including the provisions that if there is a change of control or liquidity event and if a 12% annual internal rate of return is attained by Blackstone, then all the Performance Options will also vest and become exercisable. Prior to March 1, 2013, this annual internal rate of return target was 20%, but the Compensation Committee of the Board of Directors reduced the target for vesting purposes on that date from 20% to 12% to reflect changes in the food industry environment since the plan was adopted. Subsequent to the adoption of the 2013 Omnibus Incentive Plan (as further described below), there will be no more grants under this plan.

PINNACLE FOODS INC. AND SUBSIDIARIESNOTES TO CONSOLIDATED FINANCIAL STATEMENTS(thousands of dollars, except share amounts and where noted in millions)
73
The following table summarizes the equity option transactions under the 2007 Stock Incentive Plan:
Number of Shares
WeightedAverageExercise
Price
WeightedAverage Fair
Value at GrantDate
WeightedAverage
RemainingLife
AggregateIntrinsic
Value(000's)
Outstanding, December 30, 2012 436,486 $ 9.99 $ 3.97 6.22 $ 1,642
Granted — — —Exercised (86,731) 8.89 4.48Forfeitures (35,359) 10.68 6.98
Outstanding, December 29, 2013 314,396 $ 10.22 $ 6.13 5.51 $ 5,352
Exercisable, December 29, 2013 113,402 $ 9.35 $ 4.08 4.77 $ 2,029
2007 Unit PlanPeak Holdings, the former parent of Pinnacle Foods Inc., adopted an equity plan (the “2007 Unit Plan”) providing for the issuance of profit interest units ("PIUs") in Peak Holdings. Certain employees had been given the opportunity to invest in Peak Holdings through the purchase of Peak Holding's Class A-2 Units. In addition, from 2007 to 2009, each manager who so invested was awarded profit interests in Peak Holdings in the form of Class B-1, Class B-2 and Class B-3 Units. Generally 25% of the PIUs vested ratably over five years (“Class B-1 Units”), subject to full acceleration upon a change of control. Fifty percent of the PIUs vested ratably over five years depending on whether annual or cumulative EBITDA targets are met (“Class B-2 Units”). The plan also provided that, if the Adjusted EBITDA target is achieved in any two consecutive fiscal years during the employee's continued employment, then that year's and all prior years' Class B-2 Units vested, and if there was a change of control or liquidity event defined as when Blackstone sells more than 50% of its holdings and a certain annual internal rate of return is attained by Blackstone, then all the Class B-2 units also vested, and if the Class B-3 Units vested during the employee's continued employment (as described below) then all the Class B-2 Units vested. The final 25% of the PIUs granted vested either on a change of control or liquidity event, if a 12% annual internal rate of return is attained by Blackstone (“Class B-3 Units”). Subsequent to 2009, the Company awarded PIUs to certain employees in the form of Class B-1 Units (25%) and Class B-2 Units (75%). The Class B-1 Units and Class B-2 Units had the same vesting provisions as stated above, including the provisions that if there is a change of control or liquidity event and if a 12% annual internal rate of return is attained by Blackstone, then all the Class B-2 units also vested and became exercisable. Prior to March 1, 2013, this annual internal rate of return target was 20%, but the Compensation Committee of the Board of Directors reduced the target for vesting purposes on that date from 20% to 12% to reflect changes in the food industry environment since the plan was adopted.
In connection with the Company's IPO, Peak Holdings was dissolved resulting in the termination of the 2007 Unit Plan and the adoption of the 2013 Omnibus Incentive Plan (as further described below). As a result of the dissolution, the holders of units of Peak Holdings were distributed the assets of Peak Holdings. As the sole assets of Peak Holdings were shares of the Company's common stock, Class A-2 Units were converted into shares of common stock. The number of shares of common stock delivered to the equity holder as a result of the conversion had the same intrinsic value as the Class A-2 Units held by the equity holder prior to such conversion. Additionally, in connection with the dissolution, all PIUs were converted into shares or restricted shares of the Company's common stock. Vested PIUs were converted into shares of common stock and unvested PIUs were converted into unvested restricted shares of our common stock, which are subject to vesting terms substantially similar to those applicable to the unvested PIU immediately prior to the conversion. The number of shares delivered under the 2013 Omnibus Incentive Plan, 1,546,355, have the same intrinsic value as the PIUs immediately prior to such conversion.

PINNACLE FOODS INC. AND SUBSIDIARIESNOTES TO CONSOLIDATED FINANCIAL STATEMENTS(thousands of dollars, except share amounts and where noted in millions)
74
2013 Omnibus Incentive Plan
In connection with the IPO, the Company adopted an equity incentive plan (the “2013 Omnibus Incentive Plan”) providing for the issuance of up to 11,300,000 shares of the Company's common stock which will be reserved for issuance under (1) equity awards granted as a result of the conversion of unvested PIUs into restricted common stock of the Company, (2) stock options and other equity awards granted in connection with the completion of the IPO, and (3) awards granted by the Company under the 2013 Omnibus Plan following the completion of the IPO. Pursuant to the 2013 Omnibus Plan, certain officers, employees, managers, directors and other persons are eligible to receive grants of equity based awards, as permitted by applicable law.
On March 27, 2013, in connection with the IPO, the Company issued 2,310,000 "Founders Grants" options under the 2013 Omnibus Plan. The options vest in full at the end of three years. Additionally, 82,460 non-vested shares were issued which also vest in full at the end of three years. Pursuant to his employment agreement, on April 3, 2013, Robert J. Gamgort, the Chief Executive Officer, became entitled to 200,000 shares of common stock, which will be issued on April 3, 2014, subject to Mr. Gamgort's continued service through that date. On August 1, 2013, an additional 66,042 non-vested shares and 155,575 options were issued to various employees. On December 2, 2013, an additional 30,626 options were issued. The non-vested shares vest in full at the end of four years while the options vest in full at the end of three years.
The following table summarizes the equity option transactions under the 2013 Omnibus Plan:
Number of Options
WeightedAverageExercise
Price
WeightedAverage Fair
Value at GrantDate
WeightedAverage
RemainingLife
AggregateIntrinsic
Value(000's)
Outstanding, December 30, 2012 — $ — $ — 0 —
Granted 2,496,201 20.44 4.81Exercised — — —Forfeitures (165,710) 20.00 4.63
Outstanding, December 29, 2013 2,330,491 20.47 $ 4.82 9.27 $ 15,782
Exercisable, December 29, 2013 — $ — $ — 0 $ —
The following table summarizes the changes in non-vested shares.
Number of Shares
WeightedAverage Fair
Value at GrantDate
WeightedAverage
Remaining Life
AggregateIntrinsic
Value(000's)
Non-vested shares at December 30, 2012 — $ — 0 $ —
Converted PIUs 1,546,355 20.00Granted 348,502 21.06Forfeitures (168,027) 20.00Vested (81,112) 20.00
Non-vested shares at December 29, 2013 1,645,718 $ 20.34 6.35 $ 44,829

PINNACLE FOODS INC. AND SUBSIDIARIESNOTES TO CONSOLIDATED FINANCIAL STATEMENTS(thousands of dollars, except share amounts and where noted in millions)
75
Other Comprehensive Earnings
The following table presents amounts reclassified out of Accumulated Other Comprehensive Loss ("AOCL") and into Net earnings for the fiscal year ended December 29, 2013.
Gain/(Loss)
AmountsReclassifiedfrom AOCLFiscal year
ended
Details about Accumulated Other Comprehensive Earnings ComponentsDecember 29,
2013 Reclassified from AOCL to:Gains and losses on financial instrument contracts
Interest rate contracts $ (4,000) Interest expenseForeign exchange contracts 1,771 Cost of products sold
Total before tax (2,229)Tax benefit 608 Provision for income taxesDeferred tax expense (9,070) (a) Provision for income taxes
Net of tax (10,691)
Pension actuarial assumption adjustmentsAmortization of actuarial loss (1,663) (b) Cost of products soldTax benefit 643 Provision for income taxes
Net of tax (1,020)Net reclassifications into net earnings $ (11,711)
(a) See Note 12 and Note 16 for additional details.(b) This is included in the computation of net periodic pension cost (see Note 11 for additional details).
Earnings Per Share
Basic earnings per common share is computed by dividing net earnings or loss for common shareholders by the weighted-average number of common shares outstanding during the period. Diluted earnings per common share are calculated by dividing net earnings by weighted-average common shares outstanding during the period plus dilutive potential common shares, which are determined as follows:
Fiscal year ended
December 29,2013
December 30,2012
December 25,2011
Weighted-average common shares 106,841,198 81,230,630 81,315,848
Effect of dilutive securities 1,777,542 5,263,916 —
Dilutive potential common shares 108,618,740 86,494,546 81,315,848
Dilutive potential common shares are calculated in accordance with the treasury stock method, which assumes that proceeds from the exercise of all warrants and options are used to repurchase common stock at market value. The amount of shares remaining after the proceeds are exhausted represents the potentially dilutive effect of the securities. For the fiscal years ended December 29, 2013 and December 30, 2012, conversion of stock options and non-vested shares totaling 186,201 and 102,558 respectively, into common share equivalents were excluded from this calculation as their effect would have been anti-dilutive. For the fiscal year ended December 25, 2011 conversion of warrants and stock options totaling 5,222,797 were excluded from this calculation as their effect would have been anti-dilutive, due to the net loss recorded in the period.

PINNACLE FOODS INC. AND SUBSIDIARIESNOTES TO CONSOLIDATED FINANCIAL STATEMENTS(thousands of dollars, except share amounts and where noted in millions)
76
6. Other Expense (Income), net
Fiscal year
December 29,
2013December 30,
2012December 25,
2011
Other expense (income), net consists of:Amortization of intangibles/otherassets $ 15,875 $ 15,828 $ 16,175Wish-Bone acquisition costs (Note 3) 6,067 — —Tradename impairment charges — 520 25,300Redemption premium on the earlyextinguishment of debt 34,180 14,255 —Lehman Brothers Specialty Financingsettlement — — 8,500Gain on sale of the Watsonville, CAfacility — — (391)Royalty income and other (918) (829) (1,006)Total other expense (income), net $ 55,204 $ 29,774 $ 48,578
Tradename impairment charges. In fiscal 2012, the Company recorded a tradename impairment of $0.5 million on Bernstein's. In fiscal 2011, the Company recorded tradename impairments of $23.7 million on Aunt Jemima breakfast, $1.2 million on Lender's and $0.4 million on Bernstein's.
Redemption premium on the early extinguishment of debt. On May 10, 2013, as part of a debt refinancing (the "April 2013 Refinancing") the Company redeemed all $400.0 million of its outstanding 8.25% Senior Notes at a redemption price of 108.5% of the aggregate principal amount at a premium of $34.2 million. On April 19, 2012, as part of a debt refinancing (the "April 2012 Refinancing") the Company redeemed all $199.0 million of its outstanding 10.625% Senior Subordinated Notes at a redemption price of 105.313% of the aggregate principal amount. In addition, on June 5, 2012, the Company repurchased and retired $10.0 million of 9.25% Senior Notes at a price of 102.125% of the aggregate principal amount. On September 20, 2012, as part of a debt refinancing (the "September 2012 Refinancing") the Company redeemed $150.0 million of its outstanding 9.25% Senior Subordinated Notes at a redemption price of 102.313% of the aggregate principal amount. For more information on debt refinancing see Note 10 to the Consolidated Financial Statements for Debt and Interest Expense.
Lehman Brothers Specialty Financing settlement. On June 4, 2010, Lehman Brothers Special Financing ("LBSF") initiated a claim against the Company in LBSF’s bankruptcy proceeding for an additional payment from the Company of $19.7 million, related to certain derivatives contracts which the Company had earlier terminated due to LBSF’s default as a result of its bankruptcy filing in 2008. On May 31, 2011, the Company and LBSF agreed to a settlement of LBSF’s June 4, 2010 claim. Under the terms of the settlement, the Company made payment of $8.5 million during the third quarter of 2011 in return for LBSF’s full release of its claim.
Sale of the Watsonville, CA facility. On June 24, 2011, the Company completed the sale of its Watsonville, CA facility which had been recorded as an asset held for sale. The proceeds of the sale were $7.9 million and resulted in a $0.4 million gain recorded in Other Expense (Income), net in the fiscal year ended December 30, 2012.
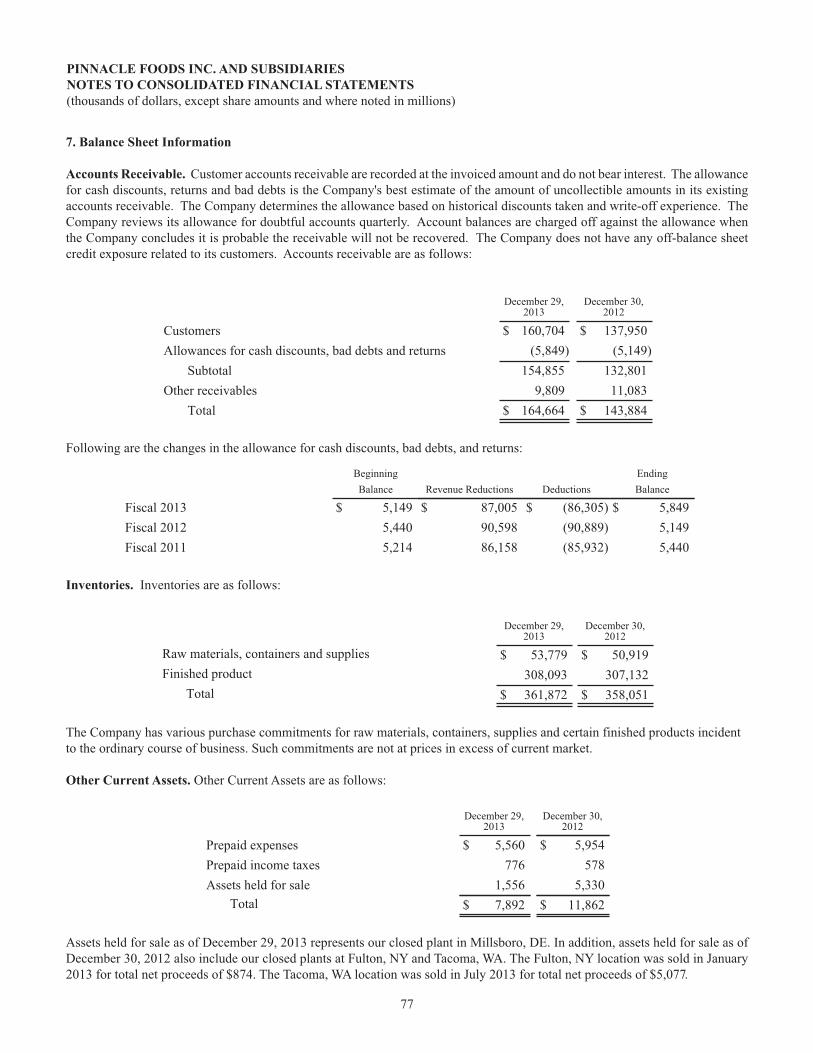
PINNACLE FOODS INC. AND SUBSIDIARIESNOTES TO CONSOLIDATED FINANCIAL STATEMENTS(thousands of dollars, except share amounts and where noted in millions)
77
7. Balance Sheet Information
Accounts Receivable. Customer accounts receivable are recorded at the invoiced amount and do not bear interest. The allowance for cash discounts, returns and bad debts is the Company's best estimate of the amount of uncollectible amounts in its existing accounts receivable. The Company determines the allowance based on historical discounts taken and write-off experience. The Company reviews its allowance for doubtful accounts quarterly. Account balances are charged off against the allowance when the Company concludes it is probable the receivable will not be recovered. The Company does not have any off-balance sheet credit exposure related to its customers. Accounts receivable are as follows:
December 29,2013
December 30,2012
Customers $ 160,704 $ 137,950Allowances for cash discounts, bad debts and returns (5,849) (5,149)
Subtotal 154,855 132,801Other receivables 9,809 11,083
Total $ 164,664 $ 143,884
Following are the changes in the allowance for cash discounts, bad debts, and returns:
Beginning Ending Balance Revenue Reductions Deductions Balance
Fiscal 2013 $ 5,149 $ 87,005 $ (86,305) $ 5,849 Fiscal 2012 5,440 90,598 (90,889) 5,149 Fiscal 2011 5,214 86,158 (85,932) 5,440
Inventories. Inventories are as follows:
December 29,2013
December 30,2012
Raw materials, containers and supplies $ 53,779 $ 50,919Finished product 308,093 307,132
Total $ 361,872 $ 358,051
The Company has various purchase commitments for raw materials, containers, supplies and certain finished products incident to the ordinary course of business. Such commitments are not at prices in excess of current market.
Other Current Assets. Other Current Assets are as follows:
December 29,2013
December 30,2012
Prepaid expenses $ 5,560 $ 5,954Prepaid income taxes 776 578Assets held for sale 1,556 5,330
Total $ 7,892 $ 11,862
Assets held for sale as of December 29, 2013 represents our closed plant in Millsboro, DE. In addition, assets held for sale as of December 30, 2012 also include our closed plants at Fulton, NY and Tacoma, WA. The Fulton, NY location was sold in January 2013 for total net proceeds of $874. The Tacoma, WA location was sold in July 2013 for total net proceeds of $5,077.

PINNACLE FOODS INC. AND SUBSIDIARIESNOTES TO CONSOLIDATED FINANCIAL STATEMENTS(thousands of dollars, except share amounts and where noted in millions)
78
Plant Assets. Plant assets are as follows:
December 29,2013
December 30,2012
Land $ 14,061 $ 14,061Buildings 196,206 178,300Machinery and equipment 576,156 513,339Projects in progress 33,950 32,660
Subtotal 820,373 738,360Accumulated depreciation (297,103) (244,694)
Total $ 523,270 $ 493,666
Depreciation was $62,350, $82,295 and $72,299 during the fiscal years ended December 29, 2013, December 30, 2012 and December 25, 2011, respectively. As of December 29, 2013 and December 30, 2012, Machinery and equipment included assets under capital lease with a book value of $19,168 and $22,030 (net of accumulated depreciation of $9,425 and $8,246), respectively.
Accrued Liabilities. Accrued liabilities are as follows:
December 29,2013
December 30,2012
Employee compensation and benefits $ 59,871 $ 53,373Interest payable 14,108 28,116Consumer coupons 1,445 3,346Accrued restructuring charges (see note 9) 1,938 10,480Accrued financial instrument contracts (see note 12) 768 682Other 21,625 23,272
Total $ 99,755 $ 119,269
Other Long-Term Liabilities. Other long-term liabilities are as follows:
December 29,2013
December 30,2012
Employee compensation and benefits $ 8,434 $ 9,340 Long-term rent liability and deferred rent allowances 9,401 10,217 Liability for uncertain tax positions 727 1,614 Accrued financial instrument contracts (see note 12) 1,136 3,807 Other 4,862 3,727
Total $ 24,560 $ 28,705

PINNACLE FOODS INC. AND SUBSIDIARIESNOTES TO CONSOLIDATED FINANCIAL STATEMENTS(thousands of dollars, except share amounts and where noted in millions)
79
8. Goodwill, Tradenames and Other Assets
Goodwill
Goodwill by segment is as follows:
Birds EyeFrozen
DuncanHines
GrocerySpecialty
Foods Total
Balance, December 25, 2011 $ 527,069 $ 740,465 $ 173,961 $ 1,441,495
Balance, December 30, 2012 $ 527,069 $ 740,465 $ 173,961 $ 1,441,495Wish-Bone Addition (Note 3) — 186,600 — 186,600Balance, December 29, 2013 $ 527,069 $ 927,065 $ 173,961 $ 1,628,095
The authoritative guidance for business combinations requires that all business combinations be accounted for at fair value under the acquisition method of accounting. The authoritative guidance for goodwill provides that goodwill will not be amortized, but will be tested for impairment on an annual basis or more often when events indicate. The Company completed its annual testing as of December 29, 2013 and December 30, 2012, resulting in no impairment.
The Wish-Bone Acquisition was accounted for in accordance the authoritative guidance for business combinations and resulted in $186,600 in goodwill, as of December 29, 2013.
Tradenames
Tradenames by segment are as follows:
Birds Eye Duncan Hines Specialty Frozen Grocery Foods Total
Balance, December 25, 2011 $ 796,680 $ 771,832 $ 36,000 $ 1,604,512Impairments — (520) — (520)Balance, December 30, 2012 $ 796,680 $ 771,312 $ 36,000 $ 1,603,992Wish-Bone Addition (Note 3) — 347,400 — 347,400Balance, December 29, 2013 $ 796,680 $ 1,118,712 $ 36,000 $ 1,951,392
The authoritative guidance for indefinite-lived assets provides that indefinite-lived assets will not be amortized, but will be tested for impairment on an annual basis or more often when events indicate. In December 2012, the Company recorded an impairment charge of $0.5 million for its Bernstein's tradename which is reported in the Duncan Hines Grocery segment. This charge was the result of the Company's reassessment of the longterm sales projections for the brand during our annual planning cycle which occurs during the fourth quarter each year. These costs were recorded in Other expense (income), net on the Consolidated Statements of Operations.
The allocation of the Wish-Bone Acquisition purchase price resulted in indefinite-lived tradename intangible assets of $347,400.

PINNACLE FOODS INC. AND SUBSIDIARIESNOTES TO CONSOLIDATED FINANCIAL STATEMENTS(thousands of dollars, except share amounts and where noted in millions)
80
Other Assets
December 29, 2013
WeightedAvg Life
GrossCarryingAmount
AccumulatedAmortization Net
Amortizable intangiblesRecipes 10 $ 52,810 $ (35,645) $ 17,165Customer relationships - Distributors 36 139,146 (34,518) 104,628Customer relationships - Foodservice 7 36,143 (35,291) 852Customer relationships - Private Label 7 9,214 (9,078) 136License 7 6,175 (3,162) 3,013
Total amortizable intangibles $ 243,488 $ (117,694) $ 125,794Deferred financing costs 46,638 (21,198) 25,440Financial instruments 29,518 — 29,518Other (1) 5,373 — 5,373
Total other assets, net $ 186,125Amortizable intangibles by segment
Birds Eye Frozen $ 63,319Duncan Hines Grocery 58,090Specialty Foods 4,385
$ 125,794
December 30, 2012
WeightedAvg Life
GrossCarryingAmount
AccumulatedAmortization Net
Amortizable intangiblesRecipes 10 $ 52,810 $ (30,365) $ 22,445Customer relationships - Distributors 36 125,746 (28,791) 96,955Customer relationships - Foodservice 7 36,143 (31,882) 4,261Customer relationships - Private Label 7 9,214 (8,533) 681License 7 4,875 (2,250) 2,625
Total amortizable intangibles $ 228,788 $ (101,821) $ 126,967Deferred financing costs 59,486 (35,306) 24,180Financial instruments (see note 12) — — —Other (1) 4,411 — 4,411
Total other assets, net $ 155,558Amortizable intangibles by segment
Birds Eye Frozen $ 69,581Duncan Hines Grocery 48,806Specialty Foods 8,580
$ 126,967
(1) As of December 29, 2013 and December 30, 2012, Other consists of security deposits.

PINNACLE FOODS INC. AND SUBSIDIARIESNOTES TO CONSOLIDATED FINANCIAL STATEMENTS(thousands of dollars, except share amounts and where noted in millions)
81
Amortization of intangible assets was $15,875, $15,828 and $16,175 during the fiscal years ended December 29, 2013, December 30, 2012 and December 25, 2011, respectively. Estimated amortization expense for each of the next five years and thereafter is as follows: 2014 -$13,700 ; 2015 - $12,200; 2016 - $11,000; 2017 - $6,400; 2018 - $4,800 and thereafter - $77,700.
Deferred Financing Costs
All deferred financing costs, which relate to the Senior Secured Credit Facility and Senior Notes are amortized into interest expense over the life of the related debt facility using the effective interest method. As part of the April 2013 Refinancing and debt repayments including usage of the proceeds from the IPO, the Company expensed financing costs of $4,762 and wrote off deferred financing costs of $12,725. In addition, amortization of deferred financing costs was $4,395, $8,585 and $11,062 during the fiscal years ended December 29, 2013, December 30, 2012 and December 25, 2011, respectively. For more information on debt refinancings, see Note 10 to the Consolidated Financial Statements for Debt and Interest Expense.
The following summarizes deferred financing cost activity:
GrossCarryingAmount
AccumulatedAmortization Net
Balance, December 30, 2012 $ 59,486 $ (35,306) $ 24,1802013 - Additions 18,380 — 18,380 - Amortization — (4,395) (4,395) - Write Off (31,228) 18,503 (12,725)Balance, December 29, 2013 $ 46,638 $ (21,198) $ 25,440
9. Restructuring Charges
Pickle supply chain improvements
On May 25, 2012, the Company announced plans to further improve the efficiency of its supply chain by consolidating its Vlasic pickle production into one plant in Imlay City, Michigan. The Company's decision to focus on its branded Vlasic business and de-emphasize its lower-margin, un-branded pickle business was the catalyst for this consolidation.
Millsboro, Delaware plant closure related charges
The Company's pickle production plant, located in Millsboro, Delaware ended production at year-end 2012. The Company recorded employee termination costs of $1,726 in the fiscal year ended December 30, 2012. The Company recorded asset retirement obligation charges of $750 in the fiscal year ended December 30, 2012. In addition, the Company recorded accelerated depreciation charges of $16,547 in the fiscal year ended December 30, 2012. All restructuring charges related to the consolidation of the Company's pickle production are recorded in the Duncan Hines Grocery segment and in the Cost of products sold line in the Consolidated Statements of Operations.
Exit lower-margin un-branded business charge
As a result of exiting the lower-margin un-branded pickle business, the Company terminated the use of a third party ingredients storage facility in the third quarter of 2012. In doing so, the Company recorded contract termination and other fees of $6,483 in the fiscal year ended December 30, 2012. In addition, the Company recorded accelerated depreciation charges at its Imlay City, Michigan plant for assets used in the lower-margin un-branded pickle business. These charges were $1,587 in the fiscal year ended December 30, 2012. All restructuring charges related to exiting the lower-margin un-branded pickle business are recorded in the Specialty foods segment and in the Cost of products sold line in the Consolidated Statements of Operations.
Green Bay, Wisconsin Research Facility
On May 15, 2012, the Company announced plans to relocate the Birds Eye Frozen Division Research and Development team from Green Bay, Wisconsin to its new facility at its Parsippany, New Jersey headquarters. The Company believes that the relocation will allow for seamless collaboration between marketing, sales, procurement and R&D that will drive superior brand innovation,

PINNACLE FOODS INC. AND SUBSIDIARIESNOTES TO CONSOLIDATED FINANCIAL STATEMENTS(thousands of dollars, except share amounts and where noted in millions)
82
marketing and productivity. We closed our Green Bay, Wisconsin research facility in December 2012. The Company recorded employee termination costs of $960 in the fiscal year ended December 30, 2012. The Company recorded facility shutdown costs of $958 in the fiscal year ended December 30, 2012. In addition, the Company recorded accelerated depreciation charges of $878 in the fiscal year ended December 30, 2012. All restructuring charges related to the closure of the Green Bay, Wisconsin research facility are recorded in the Birds Eye Frozen segment and in the Research and development line in the Consolidated Statements of Operations.
Fulton, New York Plant
On April 15, 2011, the Company announced plans to consolidate the Birds Eye Frozen segment's Fulton, New York plant operations into its Darien, Wisconsin and Waseca, Minnesota facilities in order to locate vegetable processing closer to the crop-growing region and thus reduce the related freight costs. In connection with this project, the Company made significant capital investments in its Darien, Wisconsin and Waseca, Minnesota plants. The Company recorded termination costs of $1,680 in the fiscal year ended December 25, 2011. In addition, the Company recorded accelerated depreciation costs of $2,550 and $9,295 in the fiscal years ended December 30, 2012 and December 25, 2011, respectively. All restructuring charges related to the closure of the Fulton, New York plant are recorded in the Birds Eye Frozen segment and in the Cost of products sold line in the Consolidated Statements of Operations. Severance payments were substantially completed in the third quarter of 2012. The Fulton, NY location was sold in January 2013 for net proceeds of $874.
Tacoma, Washington Plant
On December 3, 2010, in an effort to improve its supply chain operations, the Company announced the closure of the Tacoma, Washington plant and the consolidation of production into its Fort Madison, Iowa plant. The Company recorded termination costs of $30 in the fiscal year ended December 25, 2011. In addition to termination benefits, the Company recorded asset retirement obligations of $523 at Tacoma in the fiscal year ended December 25, 2011, which were expensed immediately. The Company recorded asset impairment charges of $1,286 in the fiscal year ended December 25, 2011 upon ceasing use of the facility at the end of the second quarter of 2011. The Company recorded accelerated depreciation costs of and $307 and $4,782 in the fiscal years ended December 30, 2012 and December 25, 2011, respectively. All restructuring charges related to the closure of the Tacoma, Washington plant are recorded in the Duncan Hines Grocery segment and in the Cost of products sold line in the Consolidated Statements of Operations. Severance costs were accrued in the fourth quarter of 2010 and payments were substantially completed in the second quarter of fiscal 2012. The Tacoma, WA location was sold in July 2013 for net proceeds of $5,077.
The following table summarizes total restructuring charges accrued as of December 29, 2013.
Description
Balance,December 25,
2011 Expense Other increases Payments
Balance,December 30,
2012
Facility shutdowns $ 1,201 $ 958 $ 776 (1) $ (139) $ 2,796Contract termination and other fees — 6,483 — (650) 5,833Employee severance 2,875 2,687 — (3,711) 1,851Total $ 4,076 $ 10,128 $ 776 $ (4,500) $ 10,480
Description
Balance,December 30,
2012 Expense Other increases Payments
Balance,December 29,
2013
Facility shutdowns $ 2,796 $ — $ — $ (1,178) $ 1,618Contract termination and other fees 5,833 — — (5,833) —Employee severance 1,851 — — (1,531) 320Total $ 10,480 $ — $ — $ (8,542) $ 1,938
(1) Consists of asset retirement obligations primarily at the Millsboro, Delaware plant.
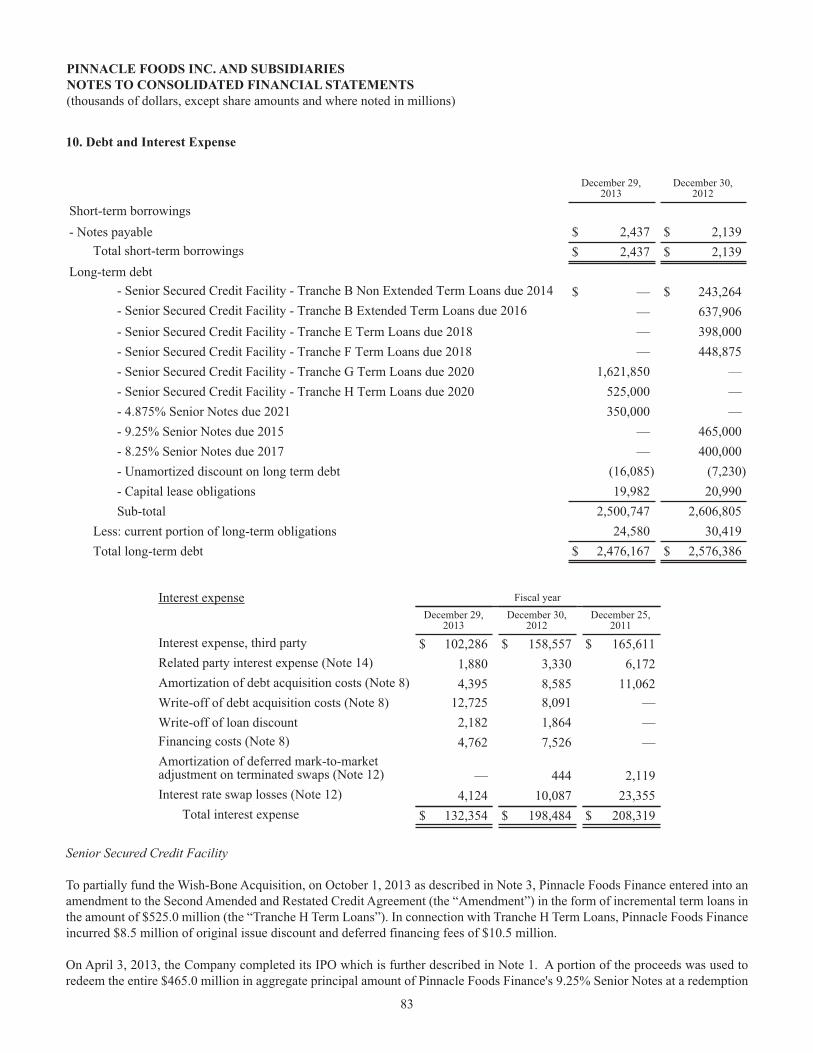
PINNACLE FOODS INC. AND SUBSIDIARIESNOTES TO CONSOLIDATED FINANCIAL STATEMENTS(thousands of dollars, except share amounts and where noted in millions)
83
10. Debt and Interest Expense
December 29,2013
December 30,2012
Short-term borrowings- Notes payable $ 2,437 $ 2,139
Total short-term borrowings $ 2,437 $ 2,139Long-term debt
- Senior Secured Credit Facility - Tranche B Non Extended Term Loans due 2014 $ — $ 243,264- Senior Secured Credit Facility - Tranche B Extended Term Loans due 2016 — 637,906- Senior Secured Credit Facility - Tranche E Term Loans due 2018 — 398,000- Senior Secured Credit Facility - Tranche F Term Loans due 2018 — 448,875- Senior Secured Credit Facility - Tranche G Term Loans due 2020 1,621,850 —- Senior Secured Credit Facility - Tranche H Term Loans due 2020 525,000 —- 4.875% Senior Notes due 2021 350,000 —- 9.25% Senior Notes due 2015 — 465,000- 8.25% Senior Notes due 2017 — 400,000- Unamortized discount on long term debt (16,085) (7,230)- Capital lease obligations 19,982 20,990Sub-total 2,500,747 2,606,805
Less: current portion of long-term obligations 24,580 30,419Total long-term debt $ 2,476,167 $ 2,576,386
Interest expense Fiscal year
December 29,
2013December 30,
2012December 25,
2011
Interest expense, third party $ 102,286 $ 158,557 $ 165,611Related party interest expense (Note 14) 1,880 3,330 6,172Amortization of debt acquisition costs (Note 8) 4,395 8,585 11,062Write-off of debt acquisition costs (Note 8) 12,725 8,091 —Write-off of loan discount 2,182 1,864 —Financing costs (Note 8) 4,762 7,526 —Amortization of deferred mark-to-marketadjustment on terminated swaps (Note 12) — 444 2,119Interest rate swap losses (Note 12) 4,124 10,087 23,355
Total interest expense $ 132,354 $ 198,484 $ 208,319
Senior Secured Credit Facility
To partially fund the Wish-Bone Acquisition, on October 1, 2013 as described in Note 3, Pinnacle Foods Finance entered into an amendment to the Second Amended and Restated Credit Agreement (the “Amendment”) in the form of incremental term loans in the amount of $525.0 million (the “Tranche H Term Loans”). In connection with Tranche H Term Loans, Pinnacle Foods Finance incurred $8.5 million of original issue discount and deferred financing fees of $10.5 million.
On April 3, 2013, the Company completed its IPO which is further described in Note 1. A portion of the proceeds was used to redeem the entire $465.0 million in aggregate principal amount of Pinnacle Foods Finance's 9.25% Senior Notes at a redemption
PINNACLE FOODS INC. AND SUBSIDIARIESNOTES TO CONSOLIDATED FINANCIAL STATEMENTS(thousands of dollars, except share amounts and where noted in millions)
84
price of 100.0%. This is explained in greater detail under the section titled, “Senior Notes and Senior Subordinated Notes.” The remaining net proceeds, together with cash on hand, was used to repay $202.0 million of the Tranche B Non-Extended Term Loans.
On April 29, 2013, (the "April 2013 Refinancing"), Pinnacle Foods Finance, entered into the second amendment to the amended and restated Senior Secured Credit Facility, which provided for a seven year term loan facility in the amount of $1,630.0 million (the "Tranche G Term Loans") and replaced the existing revolving credit facility with a new five year $150.0 million revolving credit facility. Additionally, Pinnacle Foods Finance issued $350.0 million aggregate principal amount of 4.875% Senior Notes (the "4.875% Senior Notes") due 2021.
As a result of the April 2013 Refinancing, Pinnacle Foods Finance used a portion of the proceeds from the Tranche G Term Loans and the 4.875% Senior Notes issuance to (i) repay all existing indebtedness outstanding under the then existing Senior Secured Credit Facility, consisting of (a) $38.1 million of Tranche B Non-Extended Term Loans, (b) $634.7 million of Tranche B Extended Term Loans, (c) $396.0 million of Tranche E Term Loans and (d) $446.6 million of Tranche F Term Loans and (ii) redeem $400.0 million in aggregate principal amount of Pinnacle Foods Finance's 8.25% Senior Notes due 2017 at a redemption price of 108.5%.
In connection with the April 2013 Refinancing, Pinnacle Foods Finance incurred deferred financing fees which are detailed in Note 8 to the Consolidated Financial Statements, “Goodwill, Tradenames and Other Assets”. Also, Pinnacle Foods Finance incurred $4,075 of original issue discount on the new Tranche G Term Loans, and wrote off $2,182 of existing original issue discount.
The stated maturity dates are: April 29, 2020 for the Tranche G Loans and Tranche H Term Loans, and April 29, 2018 for the revolving credit facility.
Pinnacle Foods Finance's borrowings under the Senior Secured Credit Facility, bear interest at a floating rate and are maintained as base rate loans or as eurocurrency rate loans. Base rate loans bear interest at the base rate plus the applicable base rate margin, as described in the Senior Secured Credit Facility. The base rate is defined as the highest of (i) the administrative agent's prime rate, (ii) the federal funds effective rate plus 1/2 of 1% and (iii) the eurocurrency rate that would be payable on such day for a eurocurrency rate loan with a one-month interest period plus 1%. Eurocurrency rate loans bear interest at the adjusted eurocurrency rate plus the applicable eurocurrency rate margin, as described in the Senior Secured Credit Facility. The eurocurrency rate is determined by reference to the British Bankers Association "BBA" LIBOR rate for the interest period relevant to such borrowing. With respect to Tranche G Term Loans and the Tranche H Term Loans, the eurocurrency rate shall be no less than 0.75% per annum and the base rate shall be no less than 1.75% per annum. The interest rate margin for Tranche G Term Loans and the Tranche H Term Loans under the Senior Secured Credit Facility is 1.50%, in the case of the base rate loans and 2.50%, in the case of eurocurrency rate loans. The margin is subject to a 25 basis point step down upon achievement by Pinnacle Foods Finance of a total net leverage ratio of less than 4.25:1.0.
The obligations under the Senior Secured Credit Facility are unconditionally and irrevocably guaranteed by Peak Finance Holdings LLC, any subsidiary of Peak Finance Holdings LLC that directly or indirectly owns 100% of the issued and outstanding equity interests of Pinnacle Foods Finance, subject to certain exceptions, each of Pinnacle Foods Finance’s direct or indirect material wholly-owned domestic subsidiaries (collectively, the “Guarantors”) and by the Company effective with the April 2013 refinancing. In addition, subject to certain exceptions and qualifications, borrowings under the Senior Secured Credit Facility are secured by first priority or equivalent security interests in (i) all the capital stock of, or other equity interests in, each direct or indirect domestic material subsidiary of Pinnacle Foods Finance and 65% of the capital stock of, or other equity interests in, each direct material "first tier' foreign subsidiary of Pinnacle Foods Finance and (ii) certain tangible and intangible assets of Pinnacle Foods Finance and those of the Guarantors (subject to certain exceptions and qualifications).
The total combined amount of the Senior Secured Credit Facility Loans that were owed to affiliates of Blackstone as of December 29, 2013 and December 30, 2012, was $63,796 and $63,097, respectively.
A commitment fee of 0.375% per annum based on current leverage ratios is applied to the unused portion of the revolving credit facility. There were no revolver borrowings made during fiscal 2013 or 2011. There were revolver borrowings made during fiscal 2012, however, there were no revolver borrowings outstanding as of December 30, 2012. As of December 29, 2013 and December 30, 2012, the Eurocurrency interest rate on the revolving credit facility would have been 2.67% and 3.71%, respectively.

PINNACLE FOODS INC. AND SUBSIDIARIESNOTES TO CONSOLIDATED FINANCIAL STATEMENTS(thousands of dollars, except share amounts and where noted in millions)
85
For the fiscal year ending December 30, 2012, the weighted average interest rate on the revolving credit facility calculated on the base rate was 3.72%.
For the fiscal years ended December 29, 2013, December 30, 2012, December 25, 2011, the weighted average interest rate on the term loan components of the Senior Secured Credit Facility were 3.52%, 3.76% and 3.51%, respectively. As of December 29, 2013 and December 30, 2012 the Eurocurrency interest rate on the term loan facilities was 3.25% and 4.08%, respectively.
Pinnacle Foods Finance pays a fee for all outstanding letters of credit drawn against the revolving credit facility at an annual rate equivalent to the applicable eurocurrency rate margin then in effect under the revolving credit facility, plus the fronting fee payable in respect of the applicable letter of credit. The fronting fee is equal to 0.125% per annum of the daily maximum amount then available to be drawn under such letter of credit. The fronting fees are computed on a quarterly basis in arrears. Total letters of credit issued under the revolving credit facility cannot exceed $50,000. As of December 29, 2013 and December 30, 2012, Pinnacle Foods Finance had utilized $32,923 and $33,453, respectively of the revolving credit facility for letters of credit. As of December 29, 2013 and December 30, 2012, respectively, there was $117,077 and $116,547 of borrowing capacity under the revolving credit facility, of which $17,077 and $16,547 was available to be used for letters of credit.
Under the terms of the Senior Secured Credit Facility, Pinnacle Foods Finance is required to use 50% of its “Excess Cash Flow” to prepay the term loans under the Senior Secured Credit Facility (which percentage will be reduced to 25% at a total net leverage ratio of between 4.50 and 5.49 and to 0% at a total net leverage ratio below 4.50). As of December 29, 2013, Pinnacle Foods Finance had a total net leverage ratio of 4.66 (proforma adjusted for the Wish-Bone acquisition in compliance with the terms of the Senior Secured Credit Facility. See Note 18 for further details. Excess Cash Flow is defined as consolidated net income (as defined), as adjusted for certain items, including (1) all non-cash charges and credits included in arriving at consolidated net income, (2) changes in working capital, (3) capital expenditures (to the extent they were not financed with debt), (4) the aggregate amount of principal payments on indebtedness and (5) certain other items defined in the Senior Secured Credit Facility. For the 2012 reporting year, Pinnacle Foods Finance determined that there were no amounts due under the Excess Cash Flow requirements of the Senior Secured Credit Facility. For the 2013 reporting year, Pinnacle Foods Finance determined that there are no amounts due under the Excess Cash Flow requirements of the Senior Secured Credit Facility. The term loans under the Senior Secured Credit Facility amortize in quarterly installments of 0.25% of their aggregate funded total principal amount. The scheduled principal payments of the Tranche G Term Loans outstanding as of December 29, 2013 are $16.3 million in 2014, $16.3 million in 2015, $16.3 million in 2016, $20.4 million in 2017, $12.2 million in 2018 and $1,540.4 million thereafter. The scheduled principal payments of the Tranche H Term Loans outstanding as of December 29, 2013 are $5.3 million in 2014, $5.3 million in 2015, $5.3 million in 2016, $6.6 million in 2017, $3.9 million in 2018 and $498.6 million thereafter.
Pursuant to the terms of the Senior Secured Credit Facility, Pinnacle Foods Finance is required to maintain a ratio of Net First Lien Secured Debt to Adjusted EBITDA of no greater than 5.75 to 1.00. Net First Lien Secured Debt is defined as aggregate consolidated secured indebtedness, less the aggregate amount of all unrestricted cash and cash equivalents. In addition, under the Senior Secured Credit Facility and the indenture governing the Senior Notes, Pinnacle Foods Finance's ability to engage in activities such as incurring additional indebtedness, making investments and paying dividends is tied to the Senior Secured Leverage Ratio (which is currently the same as the ratio of Net First Lien Secured Debt to Adjusted EBITDA described above), in the case of the Senior Secured Credit Facility, or to the ratio of Adjusted EBITDA to fixed charges for the most recently concluded four consecutive fiscal quarters, in the case of the Senior Notes. The Senior Secured Credit Facility also permits restricted payments up to an aggregate amount of (together with certain other amounts) the greater of $50 million and 2% of Pinnacle Foods Finance's consolidated total assets, so long as no default has occurred and is continuing and its pro forma Senior Secured Leverage Ratio would be no greater than 4.25 to 1.00. As of December 29, 2013 the Company is in compliance with all covenants and other obligations under the Senior Secured Credit Facility and the indenture governing the Senior Notes.
Senior Notes
On April 3, 2013, the Company completed its IPO which is further described in Note 1. A portion of the proceeds was used to redeem the entire $465.0 million in aggregate principal amount of Pinnacle Foods Finance's 9.25% Senior Notes at a redemption price of 100.0%.
On April 29, 2013, as part of the April 2013 Refinancing, Pinnacle Foods Finance, an indirect subsidiary of the Company, issued $350.0 million aggregate principal amount of 4.875% Senior Notes (the "4.875% Senior Notes") due 2021.
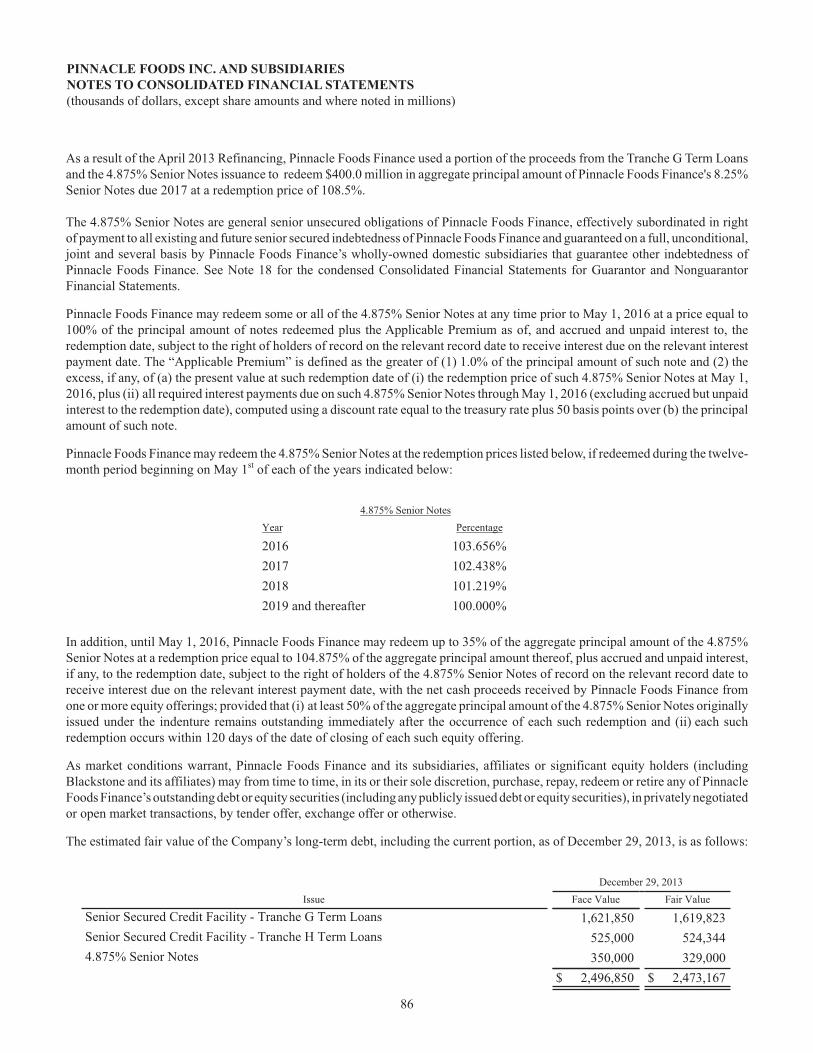
PINNACLE FOODS INC. AND SUBSIDIARIESNOTES TO CONSOLIDATED FINANCIAL STATEMENTS(thousands of dollars, except share amounts and where noted in millions)
86
As a result of the April 2013 Refinancing, Pinnacle Foods Finance used a portion of the proceeds from the Tranche G Term Loans and the 4.875% Senior Notes issuance to redeem $400.0 million in aggregate principal amount of Pinnacle Foods Finance's 8.25% Senior Notes due 2017 at a redemption price of 108.5%.
The 4.875% Senior Notes are general senior unsecured obligations of Pinnacle Foods Finance, effectively subordinated in right of payment to all existing and future senior secured indebtedness of Pinnacle Foods Finance and guaranteed on a full, unconditional, joint and several basis by Pinnacle Foods Finance’s wholly-owned domestic subsidiaries that guarantee other indebtedness of Pinnacle Foods Finance. See Note 18 for the condensed Consolidated Financial Statements for Guarantor and Nonguarantor Financial Statements.
Pinnacle Foods Finance may redeem some or all of the 4.875% Senior Notes at any time prior to May 1, 2016 at a price equal to 100% of the principal amount of notes redeemed plus the Applicable Premium as of, and accrued and unpaid interest to, the redemption date, subject to the right of holders of record on the relevant record date to receive interest due on the relevant interest payment date. The “Applicable Premium” is defined as the greater of (1) 1.0% of the principal amount of such note and (2) the excess, if any, of (a) the present value at such redemption date of (i) the redemption price of such 4.875% Senior Notes at May 1, 2016, plus (ii) all required interest payments due on such 4.875% Senior Notes through May 1, 2016 (excluding accrued but unpaid interest to the redemption date), computed using a discount rate equal to the treasury rate plus 50 basis points over (b) the principal amount of such note.
Pinnacle Foods Finance may redeem the 4.875% Senior Notes at the redemption prices listed below, if redeemed during the twelve-month period beginning on May 1st of each of the years indicated below:
4.875% Senior NotesYear Percentage
2016 103.656%2017 102.438%2018 101.219%2019 and thereafter 100.000%
In addition, until May 1, 2016, Pinnacle Foods Finance may redeem up to 35% of the aggregate principal amount of the 4.875% Senior Notes at a redemption price equal to 104.875% of the aggregate principal amount thereof, plus accrued and unpaid interest, if any, to the redemption date, subject to the right of holders of the 4.875% Senior Notes of record on the relevant record date to receive interest due on the relevant interest payment date, with the net cash proceeds received by Pinnacle Foods Finance from one or more equity offerings; provided that (i) at least 50% of the aggregate principal amount of the 4.875% Senior Notes originally issued under the indenture remains outstanding immediately after the occurrence of each such redemption and (ii) each such redemption occurs within 120 days of the date of closing of each such equity offering.
As market conditions warrant, Pinnacle Foods Finance and its subsidiaries, affiliates or significant equity holders (including Blackstone and its affiliates) may from time to time, in its or their sole discretion, purchase, repay, redeem or retire any of Pinnacle Foods Finance’s outstanding debt or equity securities (including any publicly issued debt or equity securities), in privately negotiated or open market transactions, by tender offer, exchange offer or otherwise.
The estimated fair value of the Company’s long-term debt, including the current portion, as of December 29, 2013, is as follows:
December 29, 2013Issue Face Value Fair Value
Senior Secured Credit Facility - Tranche G Term Loans 1,621,850 1,619,823Senior Secured Credit Facility - Tranche H Term Loans 525,000 524,3444.875% Senior Notes 350,000 329,000
$ 2,496,850 $ 2,473,167

PINNACLE FOODS INC. AND SUBSIDIARIESNOTES TO CONSOLIDATED FINANCIAL STATEMENTS(thousands of dollars, except share amounts and where noted in millions)
87
The estimated fair value of the Company’s long-term debt, including the current portion, as of December 30, 2012, is as follows:
December 30, 2012Issue Face Value Fair Value
Senior Secured Credit Facility - Tranche B Non Extended Term Loans $ 243,264 $ 244,480Senior Secured Credit Facility - Tranche B Extended Term Loans 637,906 641,095Senior Secured Credit Facility - Tranche E Term Loans 398,000 400,985Senior Secured Credit Facility - Tranche F Term Loans 448,875 452,2429.25% Senior Notes 465,000 471,9758.25% Senior Notes 400,000 427,000
$ 2,593,045 $ 2,637,777
The estimated fair values of the Company's long-term debt are classified as Level 2 in the fair value hierarchy. The fair value is based on the quoted market price for such notes and borrowing rates currently available to the Company for loans with similar terms and maturities.
11. Pension and Retirement Plans
The Company accounts for pension and retirement plans in accordance with the authoritative guidance for retirement benefit compensation. This guidance requires recognition of the funded status of a benefit plan in the statement of financial position. The guidance also requires recognition in accumulated other comprehensive earnings of certain gains and losses that arise during the period but are deferred under pension accounting rules.
The Company uses a measurement date for the pension benefit plans that coincides with its year end.
The Company has two defined benefit plans (Pinnacle Foods Pension Plan and the Birds Eye Foods Pension Plan, both of which were frozen for future benefit accruals as of December 30, 2012), two qualified 401(k) plans, two non-qualified 40l(k) plans and participates in a multi-employer defined benefit plan.
With reference to the two non-qualified 401(k) plans, one is the Birds Eye Foods non-qualified 401 (k) plan which was closed to new contributions on April 1, 2010. The second plan is the Pinnacle Foods Supplemental Savings Plan which was approved by the Compensation Committee of the Board of Directors on September 11, 2012 to become effective in 2013 and was adopted for the purpose of allowing all Company employees, regardless of compensation level, the opportunity to receive the same 3% match on total compensation (base salary plus bonus).
During fiscal 2012, the Company changed investment managers for the Pinnacle Foods Pension Plan and the Birds Eye Pension Plan to Mercer Investment Management, Inc. Funds under the control of the previous investment managers were liquidated successfully and invested in Mercer common and collective trust funds.
Pinnacle Foods Pension PlanThe Company maintains a non-contributory defined benefit pension plan (the “Pinnacle Foods Pension Plan”) that covers eligible union employees and provides benefits generally based on years of service and employees’ compensation. The Pinnacle Foods Pension Plan is funded in conformity with the funding requirements of applicable government regulations. Plan assets consist principally of cash equivalents, equity and fixed income common collective trusts. Plan assets do not include any of the Company’s own equity or debt securities. The plan is frozen for future benefits.

PINNACLE FOODS INC. AND SUBSIDIARIESNOTES TO CONSOLIDATED FINANCIAL STATEMENTS(thousands of dollars, except share amounts and where noted in millions)
88
The Company recorded a curtailment gain of $3,310 in the fiscal year ending December 30, 2012 which decreased Accrued pension benefits and Accumulated other comprehensive income that was the result of a new collective bargaining agreement at our Fayetteville, Arkansas plant and the closure of our Millsboro, Delaware plant.
The following table reconciles the changes in our benefit obligation:
Pinnacle Foods Pension Plan
Pension Benefits
Fiscal year endedDecember 29,
2013December 30,
2012December 25,
2011
Change in Benefit ObligationNet benefit obligation at beginning of the period $ 97,755 $ 91,660 $ 83,814Service cost 69 786 893Interest cost 3,891 4,081 4,263Actuarial (gain) loss (7,486) 9,460 7,388Gross benefits paid (5,315) (4,922) (4,698)Curtailment gain — (3,310) —
Net benefit obligation at end of the period 88,914 97,755 91,660
Change in Plan AssetsFair value of plan assets at beginning of the period 64,230 57,802 55,226Employer contributions 2,710 4,141 6,829Actual return on plan assets 7,524 7,209 445Gross benefits paid (5,315) (4,922) (4,698)
Fair value of plan assets at end of the period 69,149 64,230 57,802
Funded status at end of the year $ (19,765) $ (33,525) $ (33,858)
Amounts recognized in the Consolidated Balance SheetsAccrued pension benefits $ (19,765) $ (33,525) $ (33,858) Net amount recognized at end of the period $ (19,765) $ (33,525) $ (33,858)
Amounts recognized in Accumulated Other Comprehensive LossNet loss $ 20,917 $ 32,283 $ 30,802Prior service cost — — 345 Net amount recognized at end of the period $ 20,917 $ 32,283 $ 31,147
Accumulated benefit obligation 88,914 97,755 88,196
Weighted average assumptionsDiscount rate 4.76% 3.98% 4.59%Expected return on plan assets 6.50% 7.00% 7.50%Rate of compensation increase N/A N/A 3.00%

PINNACLE FOODS INC. AND SUBSIDIARIESNOTES TO CONSOLIDATED FINANCIAL STATEMENTS(thousands of dollars, except share amounts and where noted in millions)
89
The following represents the components of net periodic cost:
Pension Benefits Pinnacle Foods Pension Plan Fiscal year
December 29,
2013December 30,
2012December 25,
2011
Service cost $ 69 $ 786 $ 893Interest cost 3,891 4,081 4,263Expected return on assets (4,445) (4,463) (4,244)Amortization of:
prior service cost — 42 42actuarial loss 802 1,923 724
Curtailment loss — 303Net periodic cost $ 317 $ 2,672 $ 1,678
Weighted average assumptions:Discount rate 3.98% 4.43% 5.45%Expected return on plan assets 7.00% 7.50% 7.50%Rate of compensation increase N/A 3.00% 3.00%
The discount rate used to calculate the present value of the projected benefit obligation is set based on long-term high quality bonds that match the expected benefit payments. The projected return of plan assets assumption is based on projected long-term market returns for the various asset classes in which the plans are invested, weighted by the target asset allocations. The rate of compensation increase represents the long-term assumption for expected increases to salaries for pay-related plans.
Plan Assets
The Company's pension plan weighted-average asset allocations at December 29, 2013 and December 30, 2012, by asset category, are as follows:
December 29,2013
December 30,2012
Asset category Equity securities 51% 60% Debt securities 48% 40% Cash 1% —%
Total 100% 100%
The Company adopted a new investment policy in fiscal 2012 for the Pinnacle Foods Pension Plan. The Plan's investments in equity or debt securities are based on a glide path strategy where the investment in debt securities increases as the Plan's funded status becomes smaller. Based on the current funded status, the policy is to invest approximately 50% of plan assets in equity securities and 50% in fixed income securities. Periodically, the plan assets are rebalanced to maintain these allocation percentages and the investment policy is reviewed. Within each investment category, assets are allocated to various investment styles. Professional managers manage all assets and a consultant is engaged to assist in evaluating these activities. The expected long-term rate of return on assets was determined by assessing the rates of return on each targeted asset class, return premiums generated by portfolio management and by comparison of rates utilized by other companies.

PINNACLE FOODS INC. AND SUBSIDIARIESNOTES TO CONSOLIDATED FINANCIAL STATEMENTS(thousands of dollars, except share amounts and where noted in millions)
90
The following table summarizes the Pinnacle Foods Pension Plan's investments measured at fair value on a recurring basis:
Level 1: Observable inputs such as quoted prices (unadjusted) in active markets for identical assets or liabilities.Level 2: Inputs other than quoted prices that are observable for the asset or liability, either directly or indirectly. These
include quoted prices for similar assets or liabilities in active markets and quoted prices for identical or similar assets or liabilities in markets that are not active.
Level 3: Unobservable inputs that reflect the Company's assumptions.
Fair Value
as ofDecember29, 2013
Fair Value MeasurementsUsing Fair Value Hierarchy
Level 1 Level 2 Level 3 Short-term investments:
Short-term Investment Fund $ 476 $ — $ 476 $ — Equity Common/collective trusts:
Small/ Mid Capitalization Fund 4,805 — 4,805 —Large Capitalization Equity Fund 18,840 — 18,840 —International Fund 11,547 — 11,547 —
Fixed Income Common/collective trusts:
Fixed Income Fund 33,481 — 33,481 —Total assets at fair value $ 69,149 $ — $ 69,149 $ —
Fair Value
as ofDecember30, 2012
Fair Value MeasurementsUsing Fair Value Hierarchy
Level 1 Level 2 Level 3 Short-term investments: Short-term Investment Fund $ 259 $ — $ 259 $ — Equity Common/collective trusts:
Small/ Mid Capitalization Fund 5,273 — 5,273 —Large Capitalization Equity Fund 19,647 — 19,647 —International Fund 13,715 — 13,715 —
Fixed Income Common/collective trusts:
Fixed Income Fund 25,336 — 25,336 —Total assets at fair value $ 64,230 $ — $ 64,230 $ —
Cash FlowsContributions. The Company made contributions to the Pinnacle Foods Pension Plan totaling $2.7 million in fiscal 2013, $4.1 million in fiscal 2012 and $6.8 million in fiscal 2011. In fiscal 2014, the Company expects to make contributions of approximately $4.2 million.

PINNACLE FOODS INC. AND SUBSIDIARIESNOTES TO CONSOLIDATED FINANCIAL STATEMENTS(thousands of dollars, except share amounts and where noted in millions)
91
Birds Eye Foods Pension Plan
The Company’s Birds Eye Foods Pension Plan (the “Birds Eye Foods Pension Plan”) consists of hourly and salaried employees and has primarily non-contributory defined-benefit schedules. The plan is frozen for future benefits.
The Company acquired an Excess Benefit Retirement Plan from Birds Eye Foods ("EBRP"), which serves to provide employees with the same retirement benefit they would have received from Birds Eye’s retirement plan under the career average base pay formula. Benefits for this plan are frozen. Also, the Company maintains a non-qualified Supplemental Executive Retirement Plan (“SERP”) which provides additional retirement benefits to two prior executives of Birds Eye Foods who retired prior to November 4, 1994. Expenses and liabilities for the EBRP and the SERP plan are grouped with those of the Birds Eye Pension Plan in all disclosures listed herein.
The benefits for these plans are based primarily on years of service and employees’ pay near retirement. The Company’s funding policy is consistent with the funding requirements of Federal laws and regulations. Plan assets consist principally of cash equivalents, equity and fixed income common collective trusts. Plan assets do not include any of the Company’s own equity or debt securities.
In fiscal 2012, various pension plan benefits for certain locations were frozen resulting in an plan curtailment of $806 which decreased Accrued pension benefits and Accumulated other comprehensive income. In connection with the plant closure of our Tacoma, Washington location in 2011 we recorded a plan curtailment which decreased Accrued pension benefits and Accumulated other comprehensive income by $4,975.

PINNACLE FOODS INC. AND SUBSIDIARIESNOTES TO CONSOLIDATED FINANCIAL STATEMENTS(thousands of dollars, except share amounts and where noted in millions)
92
The following table reconciles the changes in our benefit obligation:
Birds Eye Foods Pension PlanPension BenefitsFiscal year ended
December 29,2013
December 30,2012
December 25,2011
Change in Benefit ObligationNet benefit obligation at beginning of the period $ 194,535 $ 175,057 $ 155,854Service cost — 102 537Interest cost 7,070 7,439 8,200Participant contributions — — 22Actuarial loss (gain) (26,433) 24,561 27,567Gross benefits paid (12,529) (11,818) (12,148)Curtailment gain — (806) (4,975)
Net benefit obligation at end of the period 162,643 194,535 175,057
Change in Plan AssetsFair value of plan assets at beginning of the period 129,935 118,666 108,446Employer contributions 5,568 8,373 9,471Participant contributions — — 22Actual return on plan assets 12,226 14,714 12,875Gross benefits paid (12,529) (11,818) (12,148)
Fair value of plan assets at end of the period 135,200 129,935 118,666
Funded status at end of the year $ (27,443) $ (64,600) $ (56,391)
Amounts recognized in the Consolidated Balance SheetsAccrued pension benefits $ (27,096) $ (64,179) $ (55,892)Accrued pension benefits (part of accrued liabilities) (347) (421) (499) Net amount recognized at end of the period $ (27,443) $ (64,600) $ (56,391)
Amounts recognized in Accumulated Other Comprehensive LossNet loss $ 7,595 $ 37,955 $ 20,797 Net amount recognized at end of the period $ 7,595 $ 37,955 $ 20,797
Accumulated benefit obligation 162,643 194,536 174,399
Weighted average assumptionsDiscount rate 4.76% 3.83% 4.51%Expected return on plan assets 6.50% 7.00% 7.00%Rate of compensation increase N/A N/A 3.00%

PINNACLE FOODS INC. AND SUBSIDIARIESNOTES TO CONSOLIDATED FINANCIAL STATEMENTS(thousands of dollars, except share amounts and where noted in millions)
93
The following represents the components of net periodic (benefit) cost:
Pension Benefits Birds Eye Foods Pension Plan Fiscal year
December 29,
2013December 30,
2012December 25,
2011
Service cost $ — $ 102 $ 537Interest cost 7,070 7,439 8,200Expected return on assets (8,941) (8,574) (7,634)Amortization of actuarial loss 611 489 9Curtailment gain —
Net periodic (benefit) cost $ (1,260) $ (544) $ 1,112
Weighted average assumptions:Discount rate 3.83% 4.17% 5.31%Expected return on plan assets 7.00% 7.00% 7.00%Rate of compensation increase (1) N/A 1.78% 3.00%
(1) In fiscal 2012, this represents 3% for the seven months when the employees earned service credits.
To develop the expected long-term rate of return on assets assumption, the Company considered the current level of expected returns on risk-free investments (primarily government bonds), the historical level of the risk premium associated with the other asset classes in which the portfolio is invested and the expectations for future returns of each asset class. The expected return for each asset class was then weighted based on the target asset allocation to develop the expected long-term rate of return on assets assumption.
Plan Assets
The following table sets forth the weighted-average asset allocations of the Company's pension plans by asset category:
December 29,2013
December 30,2012
Asset category Equity securities 41% 60% Debt securities 58% 40% Cash 1% —%
Total 100% 100%
The Company adopted a new investment policy in fiscal 2012 for the Birds Eye Foods Pension Plan. The Plan's investments in equity or debt securities is based on a glide path strategy where the investment in debt securities increases as the Plan's funded status becomes smaller. Based on the current funded status, the policy is to invest approximately 60% of plan assets in equity securities and 40% in fixed income securities. Periodically, the plan assets are rebalanced to maintain these allocation percentages and the investment policy is reviewed. Within each investment category, assets are allocated to various investment styles. Professional managers manage all assets and a consultant is engaged to assist in evaluating these activities. The expected long-
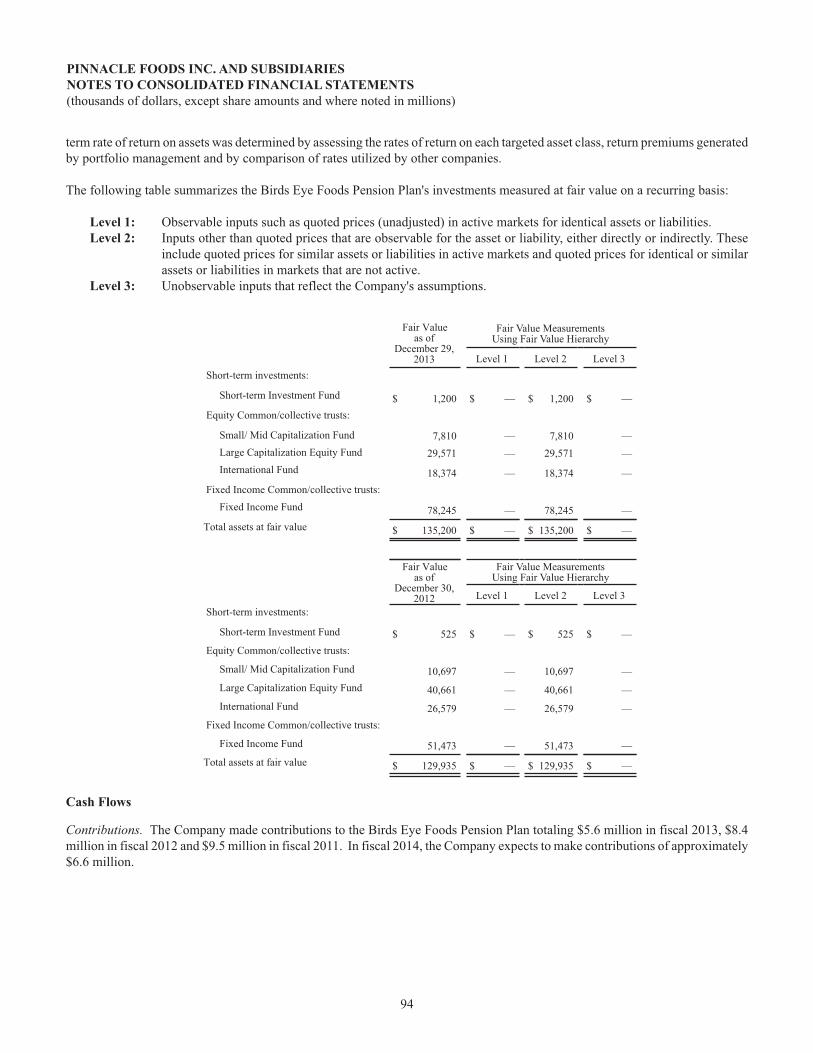
PINNACLE FOODS INC. AND SUBSIDIARIESNOTES TO CONSOLIDATED FINANCIAL STATEMENTS(thousands of dollars, except share amounts and where noted in millions)
94
term rate of return on assets was determined by assessing the rates of return on each targeted asset class, return premiums generated by portfolio management and by comparison of rates utilized by other companies.
The following table summarizes the Birds Eye Foods Pension Plan's investments measured at fair value on a recurring basis:
Level 1: Observable inputs such as quoted prices (unadjusted) in active markets for identical assets or liabilities.Level 2: Inputs other than quoted prices that are observable for the asset or liability, either directly or indirectly. These
include quoted prices for similar assets or liabilities in active markets and quoted prices for identical or similar assets or liabilities in markets that are not active.
Level 3: Unobservable inputs that reflect the Company's assumptions.
Fair Value
as ofDecember 29,
2013
Fair Value MeasurementsUsing Fair Value Hierarchy
Level 1 Level 2 Level 3 Short-term investments:
Short-term Investment Fund $ 1,200 $ — $ 1,200 $ — Equity Common/collective trusts:
Small/ Mid Capitalization Fund 7,810 — 7,810 —Large Capitalization Equity Fund 29,571 — 29,571 —International Fund 18,374 — 18,374 —
Fixed Income Common/collective trusts:Fixed Income Fund 78,245 — 78,245 —
Total assets at fair value $ 135,200 $ — $ 135,200 $ —
Fair Value
as ofDecember 30,
2012
Fair Value MeasurementsUsing Fair Value Hierarchy
Level 1 Level 2 Level 3 Short-term investments:
Short-term Investment Fund $ 525 $ — $ 525 $ — Equity Common/collective trusts:
Small/ Mid Capitalization Fund 10,697 — 10,697 —Large Capitalization Equity Fund 40,661 — 40,661 —International Fund 26,579 — 26,579 —
Fixed Income Common/collective trusts:
Fixed Income Fund 51,473 — 51,473 —Total assets at fair value $ 129,935 $ — $ 129,935 $ —
Cash Flows
Contributions. The Company made contributions to the Birds Eye Foods Pension Plan totaling $5.6 million in fiscal 2013, $8.4 million in fiscal 2012 and $9.5 million in fiscal 2011. In fiscal 2014, the Company expects to make contributions of approximately $6.6 million.

PINNACLE FOODS INC. AND SUBSIDIARIESNOTES TO CONSOLIDATED FINANCIAL STATEMENTS(thousands of dollars, except share amounts and where noted in millions)
95
Estimated Future Benefit Payments for all Plans
The following benefit payments, which reflect expected future service, as appropriate, are expected to be paid:
Pinnacle FoodsPension Plan ($)
Birds Eye FoodsPension Plan ($)
2014 4,684 10,7482015 4,427 10,8882016 4,423 11,4322017 4,346 10,8732018 4,330 10,541
2019-2023 22,565 57,079
Merger of Pension Plans
On December 31, 2013, the Pinnacle Foods Pension Plan merged with the Birds Eye Foods Pension Plan in order to achieve administrative, operational and cost efficiencies. The merged plan was renamed the Pinnacle Foods Group LLC Pension Plan.
Savings Plans
Employees participate in 401(k) plans. Pinnacle matches 50% of employee contributions up to five percent of compensation for union employees after one year of continuous service and six percent of compensation for salaried employees and it is our current intent to continue the match at these levels. Employer contributions made by the Company relating to this plan were $4,593 for fiscal 2013, $4,228 for fiscal 2012 and $4,249 for fiscal 2011.
In addition, the Company acquired a Non-Qualified 401(k) Plan from Birds Eye Foods. Under the Non-Qualified 401(k) Plan, the Company allocates matching contributions for the benefit of "highly compensated employees" as defined under Section 414(q) of the Internal Revenue Code. The plan ceased accepting future contributions on April 1, 2010.
Multi-employer Plan Pinnacle contributes to the United Food and Commercial Workers International Union Industry Pension Fund (EIN 51-6055922) (the "UFCW Plan") under the terms of the collective-bargaining agreement with its Fort Madison employees.
For the fiscal years ended December 29, 2013 and December 30, 2012 contributions to the UFCW Plan were $753 and $744, respectively. The contributions to this plan are paid monthly based upon the number of employees. They represent less than 5% of the total contributions received by this plan during the most recent plan year.
The risks of participating in multi-employer plans are different from single-employer plans in the following aspects: (a) assets contributed to a multi-employer plan by one employer may be used to provide benefits to employees of other participating employers, (b) if a participating employer stops contributing to the multi-employer plan, the unfunded obligations of the plan may be borne by the remaining participating employers and (c) if the Company chooses to stop participating in the plan, the Company may be required to pay a withdraw liability based on the underfunded status of the plan. The UFCW Plan received a Pension Protection Act “green” zone status for the plan year ending June 30, 2013. The zone status is based on information the Company received from the plan and is certified by the plan's actuary. Among other factors, plans in the green zone are at least 80 percent funded. The UFCW Plan did not utilize any extended amortization provisions that effect its placement in the "green" zone. The UFCW Plan has never been required to implement a funding improvement plan nor is one pending at this time.

PINNACLE FOODS INC. AND SUBSIDIARIESNOTES TO CONSOLIDATED FINANCIAL STATEMENTS(thousands of dollars, except share amounts and where noted in millions)
96
12. Financial Instruments
Risk Management Objective of Using Derivatives
The Company is exposed to certain risks arising from both its business operations and economic conditions. The Company principally manages its exposures to a wide variety of business and operational risks through management of its core business activities. The Company manages economic risks, including interest rate, liquidity, and credit risk primarily by managing the amount, sources, and duration of its debt funding and the use of derivative financial instruments. The primary risks managed by using derivative instruments are interest rate risk, foreign currency exchange risk and commodity price risk. Specifically, the Company enters into derivative financial instruments to manage exposures that arise from business activities that result in the receipt or payment of future known and uncertain cash amounts, the value of which are determined by interest rates, foreign exchange rates or commodity prices.
The Company manages interest rate risk based on the varying circumstances of anticipated borrowings and existing variable and fixed rate debt, including the Company’s revolving credit facility. Examples of interest rate management strategies include capping interest rates using targeted interest cost benchmarks, hedging portions of the total amount of debt, or hedging a period of months and not always hedging to maturity, and at other times locking in rates to fix interests costs.
Certain parts of the Company’s foreign operations in Canada expose the Company to fluctuations in foreign exchange rates. The Company’s goal is to reduce its exposure to such foreign exchange risks on its foreign currency cash flows and fair value fluctuations on recognized foreign currency denominated assets, liabilities and unrecognized firm commitments to acceptable levels primarily through the use of foreign exchange-related derivative financial instruments. The Company enters into derivative financial instruments to protect the value or fix the amount of certain obligations in terms of its functional currency. The Company does not enter into these transactions for non-hedging purposes.
The Company purchases raw materials in quantities expected to be used in a reasonable period of time in the normal course of business. The Company generally enters into agreements for either spot market delivery or forward delivery. The prices paid in the forward delivery contracts are generally fixed, but may also be variable within a capped or collared price range. Forward derivative contracts on certain commodities are entered into to manage the price risk associated with forecasted purchases of materials used in the Company’s manufacturing processes.
Cash Flow Hedges of Interest Rate Risk
The Company’s objectives in using interest rate derivatives are to add stability to interest expense and to manage its exposure to interest rate movements. To accomplish this objective, the Company primarily uses interest rate swaps. Interest rate swaps designated as cash flow hedges involve the receipt of variable-rate amounts from a counterparty in exchange for the Company making fixed-rate payments over the life of the agreements without exchange of the underlying notional amount. During the fiscal years ended December 29, 2013, December 30, 2012 and December 25, 2011 such derivatives were used to hedge the variable cash flows associated with existing variable-rate debt.
The second quarter 2013 IPO (Note 1) and debt refinancings (Note 10) resulted in significant changes to the Company's debt profile. For the two $650 million interest rate swaps in place at the time that were scheduled to mature April 2014, it became probable that the associated original forecasted transactions would not occur. As such, the Company discontinued hedge accounting and accelerated the reclassification of amounts in Accumulated other comprehensive loss ("AOCL") to earnings as a result of the hedged forecasted transactions becoming probable not to occur. In the second quarter 2013, these accelerated amounts resulted in a $2.8 million charge to interest expense ($1.7 million, net of tax benefits) and a $9.1 million non-cash charge to the provision for income tax expense related to the release of deferred tax charges recorded in Other comprehensive income (see Note 16 for additional details). Prospective changes in the fair value of these derivatives no longer designated in hedging relationships are recorded directly in earnings.

PINNACLE FOODS INC. AND SUBSIDIARIESNOTES TO CONSOLIDATED FINANCIAL STATEMENTS(thousands of dollars, except share amounts and where noted in millions)
97
As of December 29, 2013, the Company had the following interest rate swaps that were designated as cash flow hedges of interest rate risk:
ProductNumber ofInstruments
CurrentNotionalAmountHedged Fixed Rate Range Index Trade Dates
MaturityDates
Interest Rate Swaps 18 $ 1,643,000 0.76% - 2.97% USD-LIBOR-BBA Apr 2013 -Oct 2013
Apr 2014 -Apr 2020
The effective portion of changes in the fair value of derivatives designated and that qualify as cash flow hedges is recorded in AOCL in the Consolidated Balance Sheets and is subsequently reclassified into earnings in the period that the hedged forecasted transaction affects earnings. The ineffective portion of the change in fair value of the derivatives is recognized directly in earnings. Amounts reported in AOCL related to derivatives will be reclassified to Interest expense as interest payments are made on the Company’s variable-rate debt. During the next twelve months, the Company estimates that an additional $874 will be reclassified as an increase to Interest expense.
Cash Flow Hedges of Foreign Exchange Risk
The Company’s operations in Canada expose the Company to changes in the U.S. Dollar – Canadian Dollar ("USD-CAD") foreign exchange rate. From time to time, the Company’s Canadian subsidiary purchases inventory denominated in U.S. Dollars ("USD"), a currency other than its functional currency. The subsidiary sells that inventory in Canadian dollars. The subsidiary uses currency forward and collar agreements to manage its exposure to fluctuations in the USD-CAD exchange rate. Currency forward agreements involve fixing the USD-CAD exchange rate for delivery of a specified amount of foreign currency on a specified date. Currency collar agreements involve the sale of Canadian Dollar ("CAD") currency in exchange for receiving U.S. dollars if exchange rates rise above an agreed upon rate and purchase of USD currency in exchange for paying CAD currency if exchange rates fall below an agreed upon rate at specified dates.
As of December 29, 2013, the Company had the following foreign currency exchange contracts (in aggregate) that were designated as cash flow hedges of foreign exchange risk:
ProductNumber ofInstruments
Notional Sold inAggregate in
("CAD")
NotionalPurchased inAggregate in
("USD")
USD to CADExchange
Rates Trade DateMaturity
Dates
CAD Forward 13 $ 43,600 $ 40,863 0.993 - 1.077 Sep 2012 -Dec 2013
Jan 2014 -Dec 2014
The effective portion of changes in the fair value of derivatives designated that qualify as cash flow hedges of foreign exchange risk is recorded in AOCL in the Consolidated Balance Sheets and subsequently reclassified into earnings in the period that the hedged forecasted transaction affects earnings. The ineffective portions of the change in fair value of the derivative, as well as amounts excluded from the assessment of hedge effectiveness, are recognized directly in Cost of products sold in the Consolidated Statements of Operations.
Non-designated Hedges of Commodity Risk
Derivatives not designated as hedges are not speculative and are used to manage the Company’s exposure to commodity price risk but do not meet the authoritative guidance for hedge accounting. From time to time, the Company enters into commodity forward contracts to fix the price of natural gas, diesel fuel, corn, wheat and soybean oil purchases and other commodities at a future delivery date. Changes in the fair value of derivatives not designated in hedging relationships are recorded directly in Cost of products sold in the Consolidated Statements of Operations.
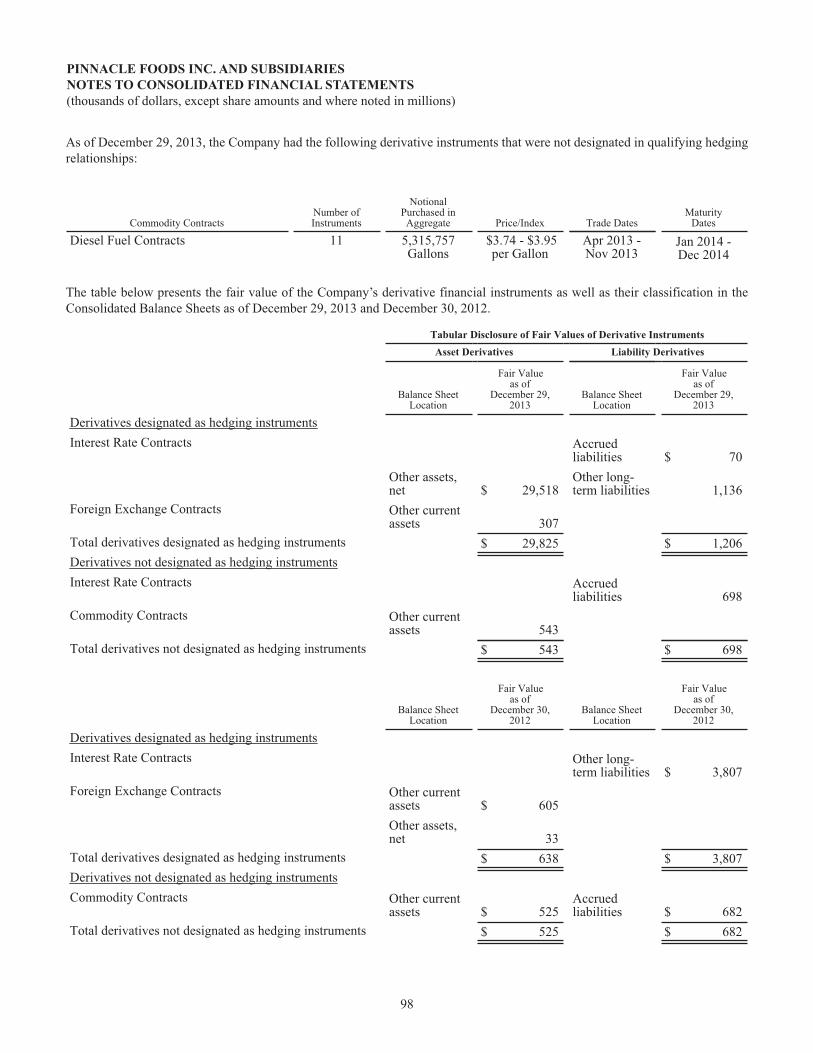
PINNACLE FOODS INC. AND SUBSIDIARIESNOTES TO CONSOLIDATED FINANCIAL STATEMENTS(thousands of dollars, except share amounts and where noted in millions)
98
As of December 29, 2013, the Company had the following derivative instruments that were not designated in qualifying hedging relationships:
Commodity ContractsNumber ofInstruments
NotionalPurchased inAggregate Price/Index Trade Dates
MaturityDates
Diesel Fuel Contracts 11 5,315,757Gallons
$3.74 - $3.95per Gallon
Apr 2013 -Nov 2013
Jan 2014 -Dec 2014
The table below presents the fair value of the Company’s derivative financial instruments as well as their classification in the Consolidated Balance Sheets as of December 29, 2013 and December 30, 2012.
Tabular Disclosure of Fair Values of Derivative Instruments Asset Derivatives Liability Derivatives
Balance Sheet
Location
Fair Valueas of
December 29,2013
Balance SheetLocation
Fair Valueas of
December 29,2013
Derivatives designated as hedging instrumentsInterest Rate Contracts Accrued
liabilities $ 70Other assets,net $ 29,518
Other long-term liabilities 1,136
Foreign Exchange Contracts Other currentassets 307
Total derivatives designated as hedging instruments $ 29,825 $ 1,206Derivatives not designated as hedging instrumentsInterest Rate Contracts Accrued
liabilities 698Commodity Contracts Other current
assets 543Total derivatives not designated as hedging instruments $ 543 $ 698
Balance Sheet
Location
Fair Valueas of
December 30,2012
Balance SheetLocation
Fair Valueas of
December 30,2012
Derivatives designated as hedging instrumentsInterest Rate Contracts Other long-
term liabilities $ 3,807Foreign Exchange Contracts Other current
assets $ 605Other assets,net 33
Total derivatives designated as hedging instruments $ 638 $ 3,807Derivatives not designated as hedging instrumentsCommodity Contracts Other current
assets $ 525Accruedliabilities $ 682
Total derivatives not designated as hedging instruments $ 525 $ 682

PINNACLE FOODS INC. AND SUBSIDIARIESNOTES TO CONSOLIDATED FINANCIAL STATEMENTS(thousands of dollars, except share amounts and where noted in millions)
99
The table below presents the effect of the Company’s derivative financial instruments in the Consolidated Statements of Operations and AOCL for the fiscal years ended December 29, 2013 and December 30, 2012.
Tabular Disclosure of the Effect of Derivative Instruments
Gain/(Loss)
Derivatives in Cash Flow HedgingRelationships
Recognized inAOCL onDerivative(EffectivePortion)
Effective portionreclassified from AOCL to:
Reclassifiedfrom AOCL
into Earnings(EffectivePortion)
Ineffective portionrecognized in Earnings in:
Recognized inEarnings onDerivative(Ineffective
Portion)
Interest Rate Contracts $ 27,817 Interest expense $ (4,000) (a) Interest expense $ 8Foreign Exchange Contracts 1,443 Cost of products sold 1,771 Cost of products sold (3)Fiscal year ended December 29, 2013 $ 29,260 $ (2,229) $ 5
Interest Rate Contracts $ (7,028) Interest expense $ (10,290) (a) Interest expense $ (241)Foreign Exchange Contracts (289) Cost of products sold (4) Cost of products sold (8)Fiscal year ended December 30, 2012 $ (7,317) $ (10,294) $ (249)
Interest Rate Contracts $ (3,364) Interest expense $ (25,465) Interest expense $ (9)Foreign Exchange Contracts (24) Cost of products sold (1,781) Cost of products sold 274Fiscal year ended December 26, 2011 $ (3,388) $ (27,246) $ 265
Derivatives Not Designated as Hedging Instruments Recognized in Earnings in:
Recognized inEarnings onDerivative
Commodity Contracts Cost of products sold $ 667Interest Rate Contracts Interest expense (132)Fiscal year ended December 29, 2013 $ 535
Commodity Contracts Cost of products sold $ (97)Fiscal year ended December 30, 2012 $ (97)
Commodity Contracts Cost of products sold $ (1,337)Fiscal year ended December 26, 2011 $ (1,337)
(a) Includes $2.8 million of accelerated reclassifications out of AOCL.
Credit risk-related Contingent Features
The Company has agreements with certain counterparties that contain a provision whereby the Company could be declared in default on its derivative obligations if repayment of the underlying indebtedness is accelerated by the lender due to the Company’s default on the indebtedness. As of December 29, 2013, the Company has not posted any collateral related to these agreements. If the Company had breached this provision at December 29, 2013, it could have been required to settle its obligations under the agreements at their termination value, which differs from the recorded fair value. The table below summarizes the aggregate fair values of those derivatives that contain credit risk-related contingent features as of December 29, 2013 and December 30, 2012.

PINNACLE FOODS INC. AND SUBSIDIARIESNOTES TO CONSOLIDATED FINANCIAL STATEMENTS(thousands of dollars, except share amounts and where noted in millions)
100
December 29, 2013
Asset/(Liability)
CounterpartyContract
TypeTermination
Value
PerformanceRisk
AdjustmentAccruedInterest
Fair Value(excludinginterest)
Barclays Interest Rate Contracts $ 12,303 $ (12) $ (155) $ 12,446Commodity Contracts 543 — — 543
Bank of America Interest Rate Contracts 12,930 (124) — 12,806Macquarie Bank Interest Rate Contracts (506) 93 (3) (410)Credit Suisse Interest Rate Contracts 2,634 62 (75) 2,771
Foreign Exchange Contracts 300 6 — 306Total $ 28,204 $ 25 $ (233) $ 28,462
December 30, 2012
Asset/(Liability)
CounterpartyContract
TypeTermination
Value
PerformanceRisk
AdjustmentAccruedInterest
Fair Value(excludinginterest)
Barclays Interest Rate Contracts $ (2,063) $ 31 $ (128) $ (1,904)Commodity Contracts (158) — — (158)
Credit Suisse Interest Rate Contracts (2,063) 32 (128) (1,903)Foreign Exchange Contracts 636 3 — 639
Total $ (3,648) $ 66 $ (256) $ (3,326)
13. Commitments and Contingencies
General
From time to time, the Company and its operations are parties to, or targets of, lawsuits, claims, investigations, and proceedings, which are being handled and defended in the ordinary course of business. Although the outcome of such items cannot be determined with certainty, the Company’s general counsel and management are of the opinion that the final outcome of these matters will not have a material effect on the Company’s financial condition, results of operations or cash flows.
Product Recall
On January 27, 2012, the Company issued a voluntary product recall for certain Aunt Jemima frozen pancakes due to potential cross contamination. The net cost of retrieving and destroying the product covered by the product recall for the fiscal years ended December 30, 2012 and December 25, 2011 was $2.1 million and $1.2 million, respectively.
In order to mitigate the adverse impact of the product recall on the Aunt Jemima brand business continuity, trade promotions and other consumer marketing expenditures were increased in 2012 above normal ongoing levels (market rehabilitation expenses). In August 2013, the Company collected an insurance recovery of $3.2 million related to these market rehabilitation expenses, of which $2.3 million was recorded as a reduction of trade promotions (a component of Net Sales) and $0.9 million as a reduction to Marketing and selling expenses in the fiscal year ended December 29, 2013. The Birds Eye Frozen Division recorded $2.7 million of the recovery while $0.5 million was recorded in the Duncan Hines Grocery Division related to the Aunt Jemima business in Canada.

PINNACLE FOODS INC. AND SUBSIDIARIESNOTES TO CONSOLIDATED FINANCIAL STATEMENTS(thousands of dollars, except share amounts and where noted in millions)
101
Minimum Contractual Payments
As of December 29, 2013, the Company had entered into non-cancellable lease and purchase contracts, with terms in excess of one year, requiring the following minimum payments:
Description 2014 2015 2016 2017 2018 Thereafter Operating leases $ 12,135 $ 9,816 $ 8,570 $ 8,356 $ 7,908 $ 22,295 Capital leases 4,577 3,982 5,664 1,572 1,348 10,006 Purchase Commitments (1) 564,341 70,343 60,329 5,827 4,522 47,300
(1) The amounts indicated in this line primarily reflect future contractual payments, including certain take-or-pay arrangements entered into as part of the normal course of business. The amounts do not include obligations related to other contractual purchase obligations that are not take-or-pay arrangements. Such contractual purchase obligations are primarily purchase orders at fair value that are part of normal operations and are reflected in historical operating cash flow trends. Purchase obligations also include trade and consumer promotion and advertising commitments.
Rent expense under our operating leases was $12,952, $13,861 and $11,313 during the fiscal years ended December 29, 2013, December 30, 2012 and December 25, 2011, respectively.
14. Related Party Transactions
At the closing of its acquisition by Blackstone, the Company entered into an advisory agreement with an affiliate of Blackstone pursuant to which such entity or its affiliates provide certain strategic and structuring advice and assistance to the Company. In addition, under this agreement, affiliates of Blackstone provide certain monitoring, advisory and consulting services to the Company for an aggregate annual management fee equal to the greater of $2,500 or 1.0% of Covenant Compliance EBITDA (as defined in the credit agreement governing the Company’s Senior Secured Credit Facility). Affiliates of Blackstone also receive reimbursement for out-of-pocket expenses. Expenses relating to the management fee were $1,148, $4,650 and $4,600 in the fiscal years ended December 29, 2013, December 30, 2012 and December 25, 2011, respectively. Management fee expenses were recorded in administrative expenses in the Consolidated Statements of Operations. The Company reimbursed Blackstone for out-of-pocket expenses totaling $160 in the fiscal year ended December 30, 2012. There were no out-of-pocket expenses reimbursed to Blackstone in the fiscal years ended December 29, 2013 and December 25, 2011.
On April 3, 2013, the advisory agreement was terminated in accordance with its terms for a fee paid of $15,100. In addition, prepaid expenses for related party management fees of $3,345 that were recorded to Other current assets were expensed.
In connection with our April 2013 IPO, Blackstone acted as an underwriter and received fees and commissions of approximately $2.0 million. In December, 2013, in connection with the secondary offering, the Company engaged Blackstone to provide certain financial consulting services, for which they received approximately $750.
Supplier Costs
Graham Packaging, which was formerly controlled by affiliates of Blackstone, supplies packaging for some of the Company’s products. Purchases from Graham Packaging were $7,813 in the fiscal year ended December 25, 2011, respectively. On September 8, 2011, Graham Packaging announced the completion of its acquisition by Reynolds Group Holdings Limited, and thus ceased to be a related party.
Customer Purchases
Performance Food Group Company, which is controlled by affiliates of Blackstone, is a foodservice supplier that purchases products from the Company. Sales to Performance Food Group Company were $1,071, $5,672 and $4,768 in the fiscal years ended December 29, 2013, December 30, 2012 and December 25, 2011, respectively. As of December 29, 2013 and December 30, 2012 amounts due from Performance Food Group Company were $57 and $68, respectively and were recorded on the Accounts receivable, net of allowances line in the Consolidated Balance Sheets.
PINNACLE FOODS INC. AND SUBSIDIARIESNOTES TO CONSOLIDATED FINANCIAL STATEMENTS(thousands of dollars, except share amounts and where noted in millions)
102
Interest Expense
For the fiscal years ended December 29, 2013, December 30, 2012 and December 25, 2011, fees and interest expense recognized in the Consolidated Statements of Operations for debt to affiliates of Blackstone Advisors L.P. totaled $1,880, $3,330 and $6,172, respectively. As of December 29, 2013 and December 30, 2012, debt owed to related parties was $63,796 and $63,097, respectively and was recorded on the Long-term debt in the Consolidated Balance Sheets. As of December 29, 2013 and December 30, 2012, interest accrued on debt to related parties was $319 and $173, respectively and was recorded on the Accrued liabilities line in the Consolidated Balance Sheets.
15. Segments
The Company is a leading producer, marketer and distributor of high quality, branded food products in North America. The Company manages the business in three operating segments: Birds Eye Frozen, Duncan Hines Grocery and Specialty Foods.
The Birds Eye Frozen Division manages its Leadership Brands in the United States retail frozen vegetables (Birds Eye), frozen complete bagged meals (Birds Eye Voila!), and frozen seafood (Van de Kamp's and Mrs. Paul's) categories, as well as its Foundation Brands in the frozen and refrigerated bagels (Lender's), frozen pizza for one (Celeste), full-calorie single-serve frozen dinners and entrées (Hungry-Man), and frozen breakfast (Aunt Jemima) categories.
The Duncan Hines Grocery Division manages its Leadership Brands in the baking mixes and frostings (Duncan Hines), liquid and dry-mix salad dressings (Wish-Bone and Western), shelf-stable pickles (Vlasic), and table syrups (Mrs. Butterworth's and Log Cabin) categories, and its Foundation Brands in the canned meat (Armour, Nalley and Brooks), pie and pastry fillings (Comstock and Wilderness), barbecue sauces (Open Pit) and salad dressing (Bernstein's) categories as well as all Canadian operations.
The Company refers to the sum of the Birds Eye Frozen Division and the Duncan Hines Grocery Division as the North America retail businesses.
The Specialty Foods Division consists of snack products (Tim's Cascade and Snyder of Berlin) and the foodservice and private label businesses.
Segment performance is evaluated by the Company’s Chief Operating Decision Maker and is based on earnings before interest and taxes. Transfers between segments and geographic areas are recorded at cost plus markup or at market. Identifiable assets are those assets, including goodwill, which are identified with the operations in each segment or geographic region. Corporate assets consist of prepaid and deferred tax assets. Unallocated corporate expenses consist of corporate overhead such as executive management, finance and legal functions and IPO and refinancing related charges.

PINNACLE FOODS INC. AND SUBSIDIARIESNOTES TO CONSOLIDATED FINANCIAL STATEMENTS(thousands of dollars, except share amounts and where noted in millions)
103
Fiscal yearSEGMENT INFORMATION December 29,
2013December 30,
2012December 25,
2011
52 weeks 53 weeks 52 weeks
Net salesBirds Eye Frozen $ 1,096,897 $ 1,103,093 $ 1,100,751Duncan Hines Grocery 1,004,990 978,615 966,068Specialty Foods 361,915 396,777 402,743
Total $ 2,463,802 $ 2,478,485 $ 2,469,562Earnings (loss) before interest and taxes
Birds Eye Frozen $ 198,634 $ 178,184 $ 97,155Duncan Hines Grocery 144,428 120,746 157,316Specialty Foods 29,959 23,503 (40,317)Unallocated corporate expenses (79,984) (38,839) (30,888)
Total $ 293,037 $ 283,594 $ 183,266Depreciation and amortization
Birds Eye Frozen $ 38,409 $ 38,667 $ 42,130Duncan Hines Grocery 22,755 41,400 29,268Specialty Foods 17,061 18,056 17,078
Total $ 78,225 $ 98,123 $ 88,476Capital expenditures*
Birds Eye Frozen $ 40,516 $ 41,885 $ 80,884Duncan Hines Grocery 34,003 25,729 31,171Specialty Foods 11,566 12,213 16,491
Total $ 86,085 $ 79,827 $ 128,546GEOGRAPHIC INFORMATIONNet sales
United States $ 2,439,888 $ 2,454,737 $ 2,442,540Canada 83,551 84,708 84,832Intercompany (59,637) (60,960) (57,810)
Total $ 2,463,802 $ 2,478,485 $ 2,469,562
*Includes new capital leases.

PINNACLE FOODS INC. AND SUBSIDIARIESNOTES TO CONSOLIDATED FINANCIAL STATEMENTS(thousands of dollars, except share amounts and where noted in millions)
104
SEGMENT INFORMATIONDecember 29,
2013December 30,
2012
Total assetsBirds Eye Frozen $ 2,004,250 $ 1,978,668Duncan Hines Grocery 2,577,093 1,965,002Specialty Foods 358,198 356,722Corporate 141,650 99,596
Total $ 5,081,191 $ 4,399,988GEOGRAPHIC INFORMATIONLong-lived assets
United States $ 523,250 $ 493,640Canada 20 26
Total $ 523,270 $ 493,666

PINNACLE FOODS INC. AND SUBSIDIARIESNOTES TO CONSOLIDATED FINANCIAL STATEMENTS(thousands of dollars, except share amounts and where noted in millions)
105
16. Taxes on Earnings
The components of the provision (benefit) for income taxes are as follows:
Provision (benefit) for income taxes Fiscal year ended
December 29,2013
December 30,2012
December 25,2011
Current
Federal $ 117 $ (635) $ (1,186)
State 2,967 1,940 2,339
Non-U.S. 539 467 426
3,623 1,772 1,579
Deferred
Federal 65,554 28,433 23,911
State 2,151 2,520 (3,377)
Non-U.S. 147 (24) (10)
67,852 30,929 20,524
Provision for income taxes $ 71,475 $ 32,701 $ 22,103
Earnings (loss) before income taxes
United States 158,190 $ 83,677 $ (26,558)
Non-U.S. 2,634 1,543 1,747
Total $ 160,824 $ 85,220 $ (24,811)
The effective tax rate differs from the federal statutory income tax rate as explained below:
Effective Income Tax Rate
Federal statutory income tax rate 35.0 % 35.0 % 35.0 %
State income taxes (net of federal benefit) 2.1 % 3.4 % 8.4 %
Tax effect resulting from international activities (0.2)% 0.4 % (0.5)%
Change in deferred tax valuation allowance — % — % (8.0)%
Non-deductible expenses 1.1 % 0.8 % (1.5)%
Goodwill and other long-lived intangibles impairment — % — % (141.4)%
Uncertain tax positions 1.3 % (1.5)% 15.9 %
Swap De-designation (Note 12) 5.0 % — % — %
Other 0.1 % 0.3 % 3.0 %
Effective income tax rate 44.4 % 38.4 % (89.1)%

PINNACLE FOODS INC. AND SUBSIDIARIESNOTES TO CONSOLIDATED FINANCIAL STATEMENTS(thousands of dollars, except share amounts and where noted in millions)
106
Deferred Tax Assets and LiabilitiesDecember 29,
2013December 30,
2012
Accrued liabilities $ 13,597 $ 18,298
Inventories 12,630 12,173
Benefits and compensation 23,436 18,645
Hedges — 1,362
Assets held for sale 1,976 3,738
Net operating loss carryforwards 287,441 325,608
Federal & state tax credits 3,912 7,256
Postretirement benefits 17,847 37,881
Alternative minimum tax 1,901 1,901
Other 2,512 2,815
Subtotal 365,252 429,677
Valuation allowance (2,847) (9,022)
Total net deferred tax assets 362,405 420,655
Other intangible assets (708,409) (697,043)
Partnership interest (8,904) (8,902)
Plant assets (89,901) (82,992)
Unremitted earnings (3,442) (2,560)
Hedges (11,064) —
Other (815) (1,488)
Total deferred tax liabilities (822,535) (792,985)
Net deferred tax liability $ (460,130) $ (372,330)
Amounts recognized in the Consolidated Balance Sheets
Current net deferred tax assets 141,142 $ 99,199
Long-term net deferred tax liability (601,272) (471,529)
Net deferred tax liability $ (460,130) $ (372,330)
Income taxes are accounted for in accordance with the authoritative guidance for accounting for income taxes under which deferred tax assets and liabilities are determined based on the difference between the financial statement basis and tax basis of assets and liabilities using enacted tax rates in effect for the year in which the differences are expected to reverse.
During the fiscal year ended December 29, 2013, the Company refinanced all of its outstanding debt (Note 10) and the Company discontinued hedge accounting for interest rate swaps in effect at that time (Note 12). Effective with the swap termination, deferred tax expense of $9.1 million, which was recorded in Accumulated Other Comprehensive Loss through the swap termination date, was reclassified as a non-cash deferred tax expense in the provision for income taxes through the consolidated statement of operations. For the fiscal years ended December 30, 2012 and December 25, 2011, the Company recorded a $0.7 million charge and $2.6 million benefit, respectively, to the state income tax provision reflecting a change in the effective tax rate as a result of changes to our manufacturing footprint (Note 9) and state legislative changes enacted during the respective fiscal years.

PINNACLE FOODS INC. AND SUBSIDIARIESNOTES TO CONSOLIDATED FINANCIAL STATEMENTS(thousands of dollars, except share amounts and where noted in millions)
107
The authoritative guidance for accounting for income taxes requires that a valuation allowance be established when it is “more likely than not” that all or a portion of deferred tax assets will not be realized. The Company regularly evaluates its deferred tax assets for future realization. A review of all available positive and negative evidence must be considered, including a company's performance, the market environment in which the company operates, the utilization of past tax credits, length of carryback and carryforward periods, and existing contracts or sales backlog that will result in future profits. Based on a review of both the positive and negative evidence, it was determined that the Company had sufficient positive evidence to outweigh any negative evidence and support that it was more likely that not that substantially all of the deferred tax assets would be realized.
The Company recognizes investment tax credits under the flow through method. For the fiscal years ended December 29, 2013, December 30, 2012 and December 25, 2011, net benefits of $0.0 million, $1.3 million and $1.2 million, respectively, were recorded in the Provision for income taxes line of the Consolidated Statements of Operations.
The Company, is a loss corporation as defined by Internal Revenue Code Section 382. Section 382 places an annual limitation on our ability to utilize a portion of our Net Operating Loss Carryovers (NOLC's) and other attributes to reduce future taxable income. As of December 29, 2013, we have federal NOLC's of $1,003.3 million, of which $237.2 million of the carryovers exceed the estimated available Section 382 limitation. The Company has reduced its deferred tax assets for this limitation. Of the remaining $766.1 million of NOLC's, $535.3 million are subject to the various Section 382 limitations which will limit the amount of NOLC's that can be utilized in any given year. It is expected that the Company's annual Section 382 limitation going forward will approximate $17.0 million to $23.0 million, adjusted for certain built in gain recognition items (as defined in Section 382) and pending resolution of certain tax matters. Approximately $230.8 million of the NOLC's are not subject to Section 382 limitations. The Company’s NOLC's and certain other tax attributes generated prior to December 23, 2009 may not be utilized to offset Birds Eye income from recognized built in gains that existed at the acquisition date, through December 2014, pursuant to Internal Revenue Code Section 384.
The Company's federal NOLC's have expiration periods from 2017 through 2031. The Company also has state tax NOLC's that are limited and vary in amount by jurisdiction. State net operating losses are approximately $508.0 million with expiration periods beginning in 2014 through 2033. State tax credits total $2.8 million which could expire on or before 2028. The Company's foreign net operating losses of $0.7 million expire on or before December 2021.
As of December 29, 2013 our valuation allowance for state NOLC's and credits is $3.2 million and the foreign valuation allowance is $0.7 million.
Following are the changes in the deferred tax valuation allowance, before federal benefit:
Beginning Ending
Balance Additions Acquisitions Deductions Balance
Fiscal year ended December 29, 2013 $ 13,354 $ — $ — $ (9,402) $ 3,952
Fiscal year ended December 30, 2012 14,202 474 — (1,322) 13,354
Fiscal year ended December 26, 2011 8,284 6,187 — (269) 14,202

PINNACLE FOODS INC. AND SUBSIDIARIESNOTES TO CONSOLIDATED FINANCIAL STATEMENTS(thousands of dollars, except share amounts and where noted in millions)
108
A reconciliation of the beginning and ending amount of gross unrecognized tax positions is as follows:
Fiscal year endedDecember 29,
2013December 30,
2012December 25,
2011Gross unrecognized tax positions at beginning of year $ 8,507 $ 9,764 $ 13,515Increase for tax positions related to prior periods — 199 646Decrease for tax positions related to prior periods — (509) (4,133)Increase for tax positions related to the current period 2,569 679 558Decrease related to settlement with tax authorities (4,122) (1,580) (822)Reductions due to lapse of applicable statutes of limitations (49) (46) —Gross unrecognized tax positions at end of year $ 6,905 $ 8,507 $ 9,764
The Company's liability for unrecognized tax positions as of December 29, 2013 was $6,905, reflecting a net decrease of $1,602. A net charge of $1,751 was recognized in the provision for income taxes resulting primarily from an increase in uncertianties related to current year federal and state matters, partially offset by the settlement of state tax examinations. The amount that, if recognized, would impact the effective tax rate as of December 29, 2013 was $1,597.
From time to time, various taxing authorities may audit the Company's tax returns. It is reasonably possible that a decrease in the uncertain tax positions of approximately $167 may occur within the next twelve months due to the lapse of certain statutes of limitations or resolution of uncertainties.
The Company recorded a net benefit for interest and penalties associated with uncertain tax positions of $165 and $157, and a charge of $743 to the provision for income taxes for the fiscal years ended December 29, 2013, December 30, 2012 and December 25, 2011, respectively. The Company's liability includes accrued interest and penalties of $161 and $332 as of December 29, 2013 and December 30, 2012, respectively. The Company files income tax returns with the U.S. federal government and various state and international jurisdictions. With few exceptions, as noted below, the Company's calendar year 1999 and subsequent federal and state tax years remain open by statute, principally relating to NOLCs. With limited exception for certain states, Federal and state tax years for pre-acquisition periods (2009 and earlier) of Birds Eye Food Inc. are either closed by statute or by completed tax examinations. As a matter of course, from time to time various taxing authorities may audit the Company's tax returns and the ultimate resolution of such audits could result in adjustments to amounts recognized by the Company.
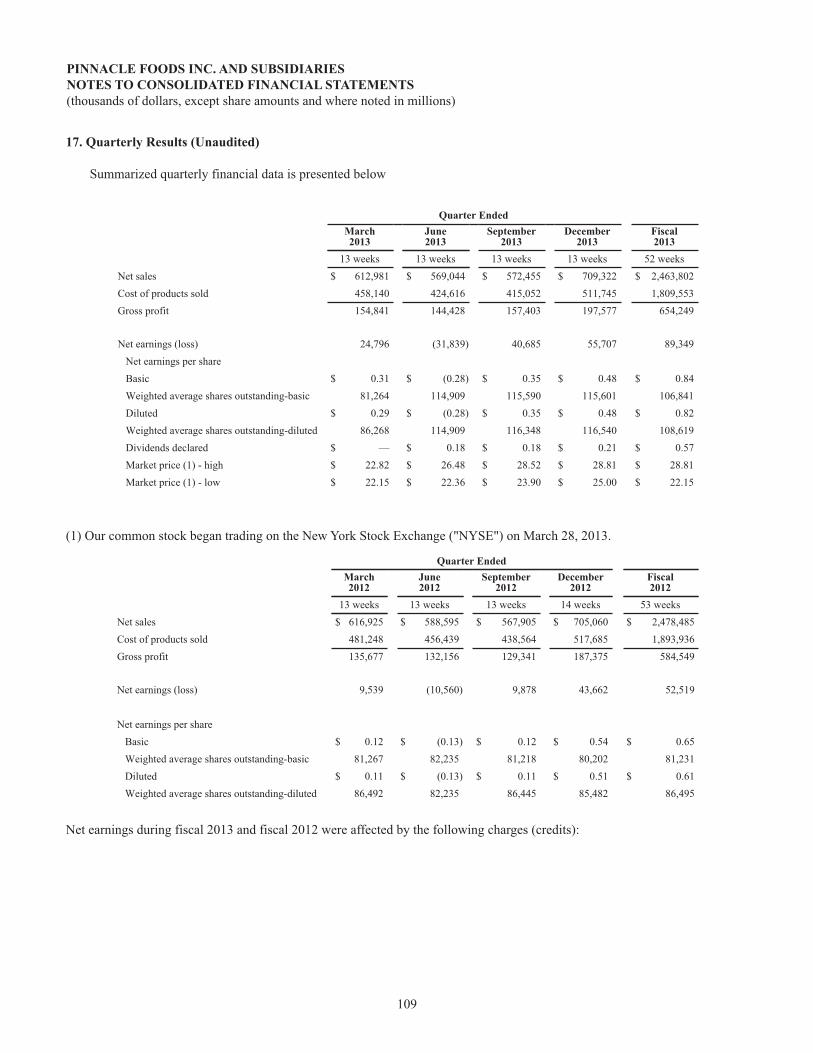
PINNACLE FOODS INC. AND SUBSIDIARIESNOTES TO CONSOLIDATED FINANCIAL STATEMENTS(thousands of dollars, except share amounts and where noted in millions)
109
17. Quarterly Results (Unaudited)
Summarized quarterly financial data is presented below
Quarter EndedMarch2013
June2013
September2013
December2013
Fiscal2013
13 weeks 13 weeks 13 weeks 13 weeks 52 weeksNet sales $ 612,981 $ 569,044 $ 572,455 $ 709,322 $ 2,463,802Cost of products sold 458,140 424,616 415,052 511,745 1,809,553Gross profit 154,841 144,428 157,403 197,577 654,249
Net earnings (loss) 24,796 (31,839) 40,685 55,707 89,349Net earnings per shareBasic $ 0.31 $ (0.28) $ 0.35 $ 0.48 $ 0.84Weighted average shares outstanding-basic 81,264 114,909 115,590 115,601 106,841Diluted $ 0.29 $ (0.28) $ 0.35 $ 0.48 $ 0.82Weighted average shares outstanding-diluted 86,268 114,909 116,348 116,540 108,619Dividends declared $ — $ 0.18 $ 0.18 $ 0.21 $ 0.57Market price (1) - high $ 22.82 $ 26.48 $ 28.52 $ 28.81 $ 28.81Market price (1) - low $ 22.15 $ 22.36 $ 23.90 $ 25.00 $ 22.15
(1) Our common stock began trading on the New York Stock Exchange ("NYSE") on March 28, 2013.
Quarter EndedMarch2012
June2012
September2012
December2012
Fiscal2012
13 weeks 13 weeks 13 weeks 14 weeks 53 weeksNet sales $ 616,925 $ 588,595 $ 567,905 $ 705,060 $ 2,478,485Cost of products sold 481,248 456,439 438,564 517,685 1,893,936Gross profit 135,677 132,156 129,341 187,375 584,549
Net earnings (loss) 9,539 (10,560) 9,878 43,662 52,519
Net earnings per shareBasic $ 0.12 $ (0.13) $ 0.12 $ 0.54 $ 0.65Weighted average shares outstanding-basic 81,267 82,235 81,218 80,202 81,231Diluted $ 0.11 $ (0.13) $ 0.11 $ 0.51 $ 0.61Weighted average shares outstanding-diluted 86,492 82,235 86,445 85,482 86,495
Net earnings during fiscal 2013 and fiscal 2012 were affected by the following charges (credits):

PINNACLE FOODS INC. AND SUBSIDIARIESNOTES TO CONSOLIDATED FINANCIAL STATEMENTS(thousands of dollars, except share amounts and where noted in millions)
110
Quarter EndedMarch2013
June2013
September2013
December2013
Fiscal2013
13 weeks 13 weeks 13 weeks 13 weeks 52 weeks
Cost of products soldWish-Bone acquisition costs (a) $ — $ — $ — $ 6,450 $ 6,450
Administrative expensesWish-Bone acquisition costs (a) — — — 1,265 1,265Termination of management advisory agreement(Note 14) — 18,445 — — 18,445
Other expense (income), net
Wish-Bone acquisition costs (a) — — — 6,067 6,067 Redemption premium on the early extinguishment of debt (see Note 6) — 34,180 — — 34,180
Interest expenseDebt refinancing (see Note 10) — 19,669 — — 19,669De-designation of interest rate swap hedgeaccounting (see Note 12) — 2,783 — — 2,783
Provision for income taxesDe-designation of interest rate swap hedgeaccounting (see Note 12) — 9,070 — — 9,070
Quarter EndedMarch2012
June2012
September2012
December2012
Fiscal2012
13 weeks 13 weeks 13 weeks 14 weeks 53 weeks
Cost of products sold
Restructuring charges (see note 9) $ 2,152 $ 3,537 $ 14,078 $ 9,432 $ 29,199
Restructuring related expenses (b) 1,327 1,513 2,082 3,074 7,996
Aunt Jemima product recall (c) 3,722 (500) — (1,150) 2,072
Research and development expenses
Restructuring charges (see note 9) — 914 465 1,417 2,796
Other expense (income), net
Tradename Impairment charges (d) — — — 520 520 Redemption premium on the early extinguishment of debt (see Note 6) — 10,785 3,470 — 14,255
Interest expenseDebt refinancing (see Note 10) — 14,840 — 2,641 17,481
(a) Wish-Bone acquisition and integration costs include $6.5 million of charges recorded in Cost of Products sold, primarily resulting from the step-up of inventories acquired and sold during 2013, $6.1 million of merger, acquisition and advisory fees recorded in Other expense (income), net and $1.3 million of integration costs recorded in Administrative expense. This is explained in greater detail in Note 3 to the Consolidated Financial Statements.
PINNACLE FOODS INC. AND SUBSIDIARIESNOTES TO CONSOLIDATED FINANCIAL STATEMENTS(thousands of dollars, except share amounts and where noted in millions)
111
(b) Restructuring related expenses include plant enhancement expenses, removal and transfer of equipment and consulting and engineering costs for restructuring projects.
(c) On January 27, 2012 we issued a voluntary recall for certain Aunt Jemima frozen pancakes due to potential cross contamination with soy protein which may cause allergic reaction for people who have a soy allergy (See Note 13 for additional information).
(d) Tradename impairment charges consist of a $0.5 million to the Bernstein's tradename.
18. Guarantor and Nonguarantor Statements
The 4.875% Senior Notes are general senior unsecured obligations of Pinnacle Foods Finance, effectively subordinated in right of payment to all existing and future senior secured indebtedness of Pinnacle Foods Finance and guaranteed on a full, unconditional, joint and several basis by the Company and Pinnacle Foods Finance's 100% owned domestic subsidiaries that guarantee other indebtedness of the Company.
The following condensed consolidating financial information presents:(1) (a) Condensed consolidating balance sheets as of December 29, 2013 and December 30, 2012.
(b) The related condensed consolidating statements of operations and comprehensive earnings for the Company, Pinnacle Foods Finance, all guarantor subsidiaries and the non-guarantor subsidiaries for the following:
i. Fiscal year ended December 29, 2013 ii. Fiscal year ended December 30, 2012; andiii. Fiscal year ended December 25, 2011.
(c) The related condensed consolidating statements of cash flows for the Company, Pinnacle Foods Finance, all guarantor subsidiaries and the non-guarantor subsidiaries for the following:
i. Fiscal year ended December 29, 2013 ii. Fiscal year ended December 30, 2012; andiii. Fiscal year ended December 25, 2011.
(2) Elimination entries necessary to consolidate the Company, Pinnacle Foods Finance with its guarantor subsidiaries and non-guarantor subsidiaries.
Investments in subsidiaries are accounted for by the parent using the equity method of accounting. The guarantor subsidiaries are presented on a combined basis. The principal elimination entries eliminate investments in subsidiaries and intercompany balances and transactions and include a reclassification entry of net non-current deferred tax assets to non-current deferred tax liabilities.

PINNACLE FOODS INC. AND SUBSIDIARIESNOTES TO CONSOLIDATED FINANCIAL STATEMENTS(thousands of dollars, except share amounts and where noted in millions)
112
Pinnacle Foods Inc.Condensed Consolidating Balance Sheet
December 29, 2013
Pinnacle
Foods Inc
PinnacleFoods
Finance LLC
GuarantorSubsidiaries
NonguarantorSubsidiaries
Eliminationsand
ReclassificationsConsolidated
TotalCurrent assets:
Cash and cash equivalents $ — $ — $ 104,345 $ 12,394 $ — $ 116,739Accounts receivable, net — — 156,417 8,247 — 164,664Intercompany accounts receivable 25,119 — 188,941 — (214,060) —Inventories, net — — 355,685 6,187 — 361,872Other current assets — 850 6,931 111 — 7,892Deferred tax assets — — 141,162 (20) — 141,142
Total current assets 25,119 850 953,481 26,919 (214,060) 792,309Plant assets, net — — 523,250 20 — 523,270Investment in subsidiaries 1,598,041 2,027,337 12,453 — (3,637,831) —Intercompany note receivable — 1,984,956 7,270 9,800 (2,002,026) —Tradenames — — 1,951,392 — — 1,951,392Other assets, net — 54,530 131,464 131 — 186,125Deferred tax assets — 284,606 — — (284,606) —Goodwill — — 1,628,095 — — 1,628,095
Total assets $1,623,160 $ 4,352,279 $ 5,207,405 $ 36,870 $ (6,138,523) $ 5,081,191Current liabilities:
Short-term borrowings $ — $ — $ 2,437 $ — $ — $ 2,437Current portion of long-term obligations — 21,550 3,030 — — 24,580Accounts payable — 158 140,694 1,501 — 142,353Intercompany accounts payable — 207,123 — 6,937 (214,060) —Accrued trade marketing expense — — 32,627 4,433 — 37,060Accrued liabilities — 15,306 83,667 782 — 99,755Dividends payable 25,119 — — — — 25,119
Total current liabilities 25,119 244,137 262,455 13,653 (214,060) 331,304Long-term debt — 2,459,215 16,952 — — 2,476,167Intercompany note payable — — 1,994,163 7,863 (2,002,026) —Pension and other postretirement benefits — — 49,847 — — 49,847Other long-term liabilities — 1,136 20,694 2,730 — 24,560Deferred tax liabilities — 49,750 835,957 171 (284,606) 601,272
Total liabilities 25,119 2,754,238 3,180,068 24,417 (2,500,692) 3,483,150Commitments and contingencies (Note13)
Shareholder’s equity:Pinnacle Common Stock $ 1,172 $ — $ — $ — $ — 1,172Additional paid-in-capital 1,328,847 1,330,019 1,285,084 2,324 (2,617,427) 1,328,847Retained earnings 275,519 275,519 768,718 10,504 (1,054,741) 275,519Accumulated other comprehensive loss (7,497) (7,497) (26,465) (375) 34,337 (7,497)
Total shareholders' equity 1,598,041 1,598,041 2,027,337 12,453 (3,637,831) 1,598,041Total liabilities and shareholders'equity $1,623,160 $ 4,352,279 $ 5,207,405 $ 36,870 $ (6,138,523) $ 5,081,191

PINNACLE FOODS INC. AND SUBSIDIARIESNOTES TO CONSOLIDATED FINANCIAL STATEMENTS(thousands of dollars, except share amounts and where noted in millions)
113
Pinnacle Foods Inc.Condensed Consolidating Balance Sheet
December 30, 2012
Pinnacle
Foods Inc
PinnacleFoods
Finance LLC
GuarantorSubsidiaries
NonguarantorSubsidiaries
Eliminationsand
ReclassificationsConsolidated
TotalCurrent assets:
Cash and cash equivalents $ — $ — $ 83,123 $ 9,158 $ — $ 92,281Accounts receivable, net — — 135,791 8,093 — 143,884Intercompany accounts receivable — — 73,769 — (73,769) —Inventories, net — — 350,922 7,129 — 358,051Other current assets — 1,130 10,546 186 — 11,862Deferred tax assets — — 100,245 74 (1,120) 99,199
Total current assets — 1,130 754,396 24,640 (74,889) 705,277Plant assets, net — — 493,640 26 — 493,666Investment in subsidiaries 888,726 1,840,632 11,222 — (2,740,580) —Intercompany note receivable — 1,469,135 7,270 9,800 (1,486,205) —Tradenames — — 1,603,992 — — 1,603,992Other assets, net — 23,691 131,707 160 — 155,558Deferred tax assets — 239,347 — — (239,347) —Goodwill — — 1,441,495 — — 1,441,495
Total assets $ 888,726 $ 3,573,935 $ 4,443,722 $ 34,626 $ (4,541,021) $4,399,988Current liabilities:
Short-term borrowings $ — $ — $ 2,139 $ — $ — $ 2,139Current portion of long-termobligations — 27,411 3,008 — —
30,419
Accounts payable — 37 136,220 1,069 — 137,326Intercompany accounts payable — 65,888 — 7,881 (73,769) —Accrued trade marketing expense — — 41,396 3,175 — 44,571Accrued liabilities — 29,662 90,000 727 (1,120) 119,269
Total current liabilities — 122,998 272,763 12,852 (74,889) 333,724Long-term debt — 2,558,404 17,982 — — 2,576,386Intercompany note payable — — 1,478,593 7,612 (1,486,205) —Pension and other postretirementbenefits — — 100,918 — —
100,918
Other long-term liabilities — 3,807 22,168 2,730 — 28,705Deferred tax liabilities — — 710,666 210 (239,347) 471,529
Total liabilities — 2,685,209 2,603,090 23,404 (1,800,441) 3,511,262Commitments and contingencies(Note 13)
Shareholder’s equity:Pinnacle Common Stock $ 812 $ — $ — $ — $ — 812Additional paid-in-capital 696,512 697,324 1,284,155 2,324 (1,983,803) 696,512Retained earnings 252,955 252,955 608,788 8,842 (870,585) 252,955Accumulated other comprehensiveloss (61,553) (61,553) (52,311) 56 113,808
(61,553)
Total shareholders' equity 888,726 888,726 1,840,632 11,222 (2,740,580) 888,726Total liabilities and shareholders'equity $ 888,726 $ 3,573,935 $ 4,443,722 $ 34,626 $ (4,541,021) $4,399,988

PINNACLE FOODS INC. AND SUBSIDIARIESNOTES TO CONSOLIDATED FINANCIAL STATEMENTS(thousands of dollars, except share amounts and where noted in millions)
114
Pinnacle Foods Finance Inc Condensed Consolidating Statement of Operations and Comprehensive Earnings (Loss)
For the fiscal year ended December 29, 2013
Pinnacle
Foods Inc
PinnacleFoods
Finance LLCGuarantor
SubsidiariesNonguarantorSubsidiaries Eliminations
ConsolidatedTotal
Net sales $ — $ — $2,439,888 $ 83,551 $ (59,637) $2,463,802Cost of products sold — 636 1,797,345 70,167 (58,595) 1,809,553
Gross profit — (636) 642,543 13,384 (1,042) 654,249Operating expenses
Marketing and sellingexpenses — 1,399 168,092 6,211 — 175,702Administrative expenses — 18,114 98,020 3,656 — 119,790Research and developmentexpenses — 109 10,407 — — 10,516Intercompany royalties — — — 47 (47) —Intercompany technicalservice fees — — — 995 (995) —Other expense (income), net — 34,180 21,024 — — 55,204Equity in (earnings) loss ofinvestees (89,349) (159,930) (1,662) — 250,941 —
Total operating expenses (89,349) (106,128) 295,881 10,909 249,899 361,212Earnings (loss) before interestand taxes 89,349 105,492 346,662 2,475 (250,941) 293,037
Intercompany interest(income) expense — (68,983) 68,850 133 — —Interest expense — 130,386 1,939 29 — 132,354Interest income — — 105 36 — 141
Earnings (loss) before incometaxes 89,349 44,089 275,978 2,349 (250,941) 160,824Provision (benefit) for incometaxes — (45,260) 116,048 687 — 71,475Net earnings (loss) $ 89,349 $ 89,349 $ 159,930 $ 1,662 $ (250,941) $ 89,349
Total comprehensive earnings(loss) $ 143,405 $ 143,405 $ 185,544 $ 1,379 $ (330,328) $ 143,405

PINNACLE FOODS INC. AND SUBSIDIARIESNOTES TO CONSOLIDATED FINANCIAL STATEMENTS(thousands of dollars, except share amounts and where noted in millions)
115
Pinnacle Foods Inc.Condensed Consolidating Statement of Operations and Comprehensive Earnings (Loss)
For the fiscal year ended December 30, 2012
Pinnacle
Foods Inc
PinnacleFoods
Finance LLCGuarantor
SubsidiariesNonguarantorSubsidiaries Eliminations
ConsolidatedTotal
Net sales $ — $ — $2,454,737 $ 84,708 $ (60,960) $2,478,485Cost of products sold — 120 1,880,692 73,090 (59,966) 1,893,936
Gross profit — (120) 574,045 11,618 (994) 584,549Operating expenses
Marketing and sellingexpenses — 342 163,567 5,827 — 169,736Administrative expenses — 3,415 82,643 3,356 — 89,414Research and developmentexpenses — 25 12,006 — — 12,031Intercompany royalties — — — 77 (77) —Intercompany technicalservice fees — — — 917 (917) —Other expense (income), net — 14,255 15,519 — — 29,774Equity in (earnings) loss ofinvestees (52,519) (124,967) (831) — 178,317 —
Total operating expenses (52,519) (106,930) 272,904 10,177 177,323 300,955Earnings before interest andtaxes 52,519 106,810 301,141 1,441 (178,317) 283,594
Intercompany interest(income) expense — (95,285) 95,162 123 — —Interest expense — 196,240 2,200 44 — 198,484Interest income — — 110 — — 110
Earnings before income taxes 52,519 5,855 203,889 1,274 (178,317) 85,220Provision (benefit) for incometaxes — (46,664) 78,922 443 — 32,701Net earnings $ 52,519 $ 52,519 $ 124,967 $ 831 $ (178,317) $ 52,519
Total comprehensive earnings $ 43,402 $ 43,402 $ 113,923 $ 787 $ (158,112) $ 43,402
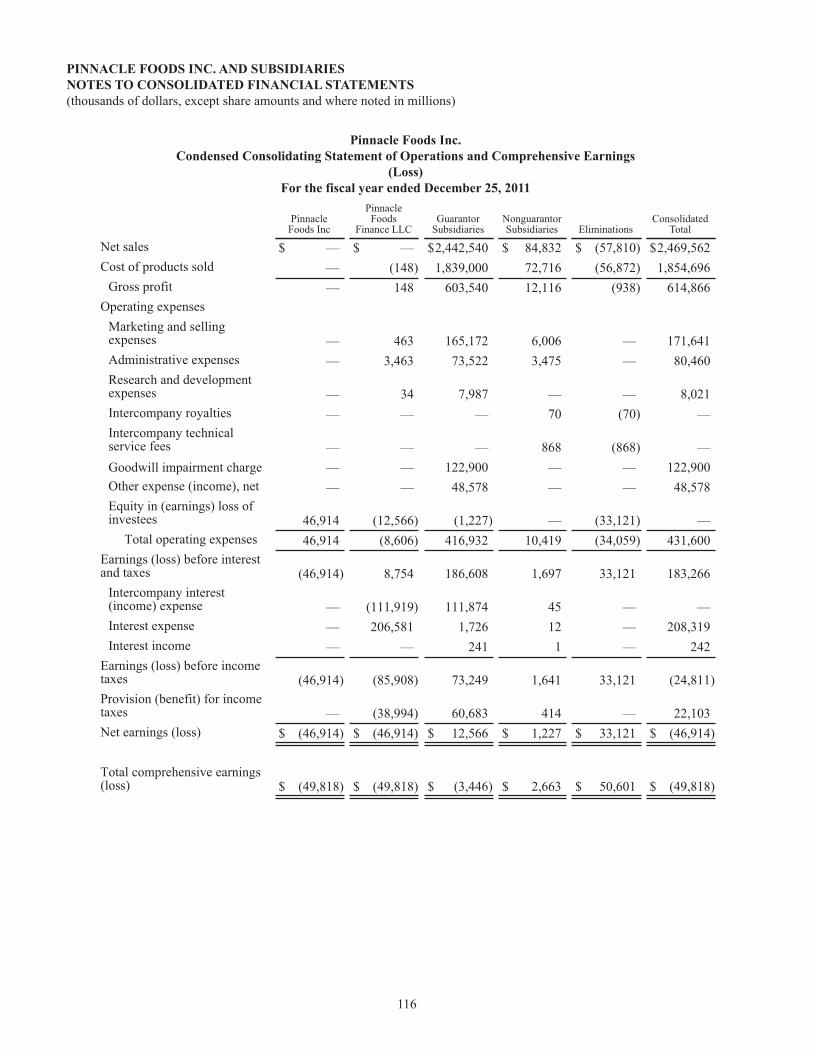
PINNACLE FOODS INC. AND SUBSIDIARIESNOTES TO CONSOLIDATED FINANCIAL STATEMENTS(thousands of dollars, except share amounts and where noted in millions)
116
Pinnacle Foods Inc.Condensed Consolidating Statement of Operations and Comprehensive Earnings
(Loss)For the fiscal year ended December 25, 2011
Pinnacle
Foods Inc
PinnacleFoods
Finance LLCGuarantor
SubsidiariesNonguarantorSubsidiaries Eliminations
ConsolidatedTotal
Net sales $ — $ — $2,442,540 $ 84,832 $ (57,810) $2,469,562Cost of products sold — (148) 1,839,000 72,716 (56,872) 1,854,696
Gross profit — 148 603,540 12,116 (938) 614,866Operating expenses
Marketing and sellingexpenses — 463 165,172 6,006 — 171,641Administrative expenses — 3,463 73,522 3,475 — 80,460Research and developmentexpenses — 34 7,987 — — 8,021Intercompany royalties — — — 70 (70) —Intercompany technicalservice fees — — — 868 (868) —Goodwill impairment charge — — 122,900 — — 122,900Other expense (income), net — — 48,578 — — 48,578Equity in (earnings) loss ofinvestees 46,914 (12,566) (1,227) — (33,121) —
Total operating expenses 46,914 (8,606) 416,932 10,419 (34,059) 431,600Earnings (loss) before interestand taxes (46,914) 8,754 186,608 1,697 33,121 183,266
Intercompany interest(income) expense — (111,919) 111,874 45 — —Interest expense — 206,581 1,726 12 — 208,319Interest income — — 241 1 — 242
Earnings (loss) before incometaxes (46,914) (85,908) 73,249 1,641 33,121 (24,811)Provision (benefit) for incometaxes — (38,994) 60,683 414 — 22,103Net earnings (loss) $ (46,914) $ (46,914) $ 12,566 $ 1,227 $ 33,121 $ (46,914)
Total comprehensive earnings(loss) $ (49,818) $ (49,818) $ (3,446) $ 2,663 $ 50,601 $ (49,818)
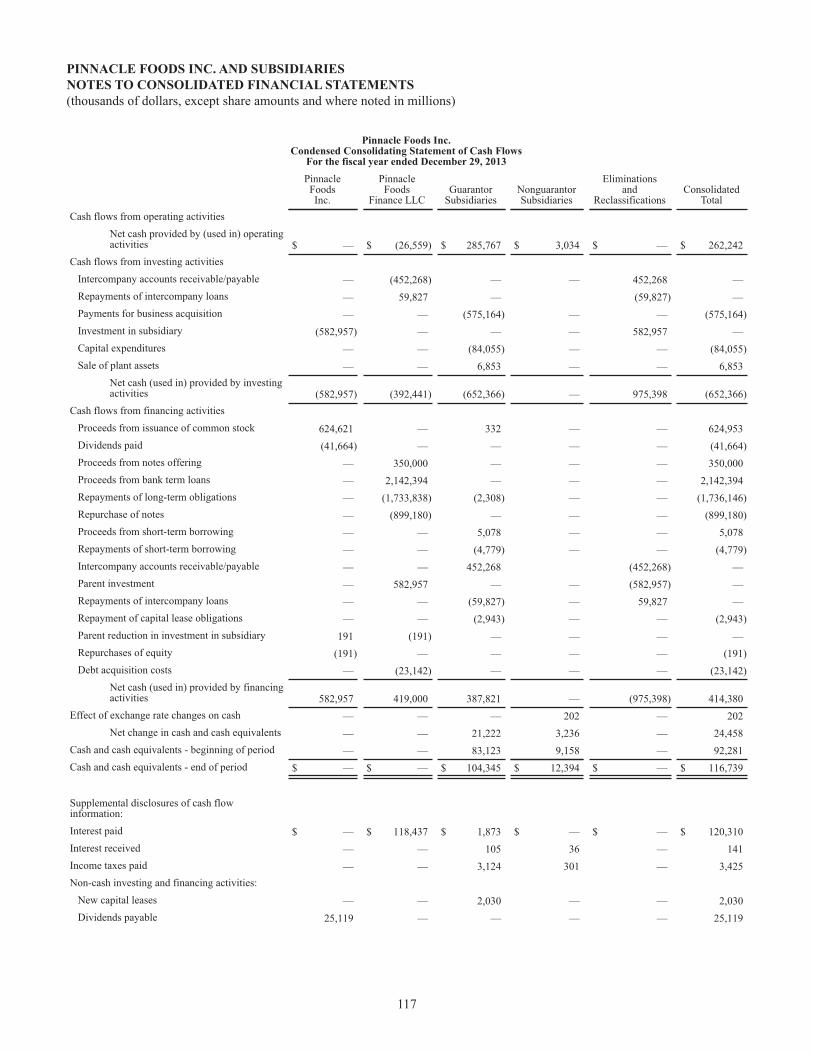
PINNACLE FOODS INC. AND SUBSIDIARIESNOTES TO CONSOLIDATED FINANCIAL STATEMENTS(thousands of dollars, except share amounts and where noted in millions)
117
Pinnacle Foods Inc.Condensed Consolidating Statement of Cash Flows
For the fiscal year ended December 29, 2013
PinnacleFoodsInc.
PinnacleFoods
Finance LLCGuarantor
SubsidiariesNonguarantorSubsidiaries
Eliminationsand
ReclassificationsConsolidated
TotalCash flows from operating activities
Net cash provided by (used in) operatingactivities $ — $ (26,559) $ 285,767 $ 3,034 $ — $ 262,242
Cash flows from investing activitiesIntercompany accounts receivable/payable — (452,268) — — 452,268 —Repayments of intercompany loans — 59,827 — (59,827) —Payments for business acquisition — — (575,164) — — (575,164)Investment in subsidiary (582,957) — — — 582,957 —Capital expenditures — — (84,055) — — (84,055)Sale of plant assets — — 6,853 — — 6,853
Net cash (used in) provided by investingactivities (582,957) (392,441) (652,366) — 975,398 (652,366)
Cash flows from financing activitiesProceeds from issuance of common stock 624,621 — 332 — — 624,953Dividends paid (41,664) — — — — (41,664)Proceeds from notes offering — 350,000 — — — 350,000Proceeds from bank term loans — 2,142,394 — — — 2,142,394Repayments of long-term obligations — (1,733,838) (2,308) — — (1,736,146)Repurchase of notes — (899,180) — — — (899,180)Proceeds from short-term borrowing — — 5,078 — — 5,078Repayments of short-term borrowing — — (4,779) — — (4,779)Intercompany accounts receivable/payable — — 452,268 (452,268) —Parent investment — 582,957 — — (582,957) —Repayments of intercompany loans — — (59,827) — 59,827 —Repayment of capital lease obligations — — (2,943) — — (2,943)Parent reduction in investment in subsidiary 191 (191) — — — —Repurchases of equity (191) — — — — (191)Debt acquisition costs — (23,142) — — — (23,142)
Net cash (used in) provided by financingactivities 582,957 419,000 387,821 — (975,398) 414,380
Effect of exchange rate changes on cash — — — 202 — 202Net change in cash and cash equivalents — — 21,222 3,236 — 24,458
Cash and cash equivalents - beginning of period — — 83,123 9,158 — 92,281Cash and cash equivalents - end of period $ — $ — $ 104,345 $ 12,394 $ — $ 116,739
Supplemental disclosures of cash flowinformation:Interest paid $ — $ 118,437 $ 1,873 $ — $ — $ 120,310Interest received — — 105 36 — 141Income taxes paid — — 3,124 301 — 3,425Non-cash investing and financing activities:
New capital leases — — 2,030 — — 2,030Dividends payable 25,119 — — — — 25,119

PINNACLE FOODS INC. AND SUBSIDIARIESNOTES TO CONSOLIDATED FINANCIAL STATEMENTS(thousands of dollars, except share amounts and where noted in millions)
118
Pinnacle Foods Finance LLC Condensed Consolidating Statement of Cash Flows
For the fiscal year ended December 30, 2012
PinnacleFoodsInc.
PinnacleFoods
Finance LLCGuarantor
SubsidiariesNonguarantorSubsidiaries
Eliminationsand
ReclassificationsConsolidated
TotalCash flows from operating activities
Net cash provided by (used in) operatingactivities $ — $ (87,051) $ 281,501 $ 8,403 $ — $ 202,853
Cash flows from investing activitiesIntercompany accounts receivable/payable — 100,590 — — (100,590) —Repayments of intercompany loans — 167,492 — (167,492) —Capital expenditures — — (78,279) — — (78,279)Sale of plant assets held for sale — — 570 — — 570
Net cash (used in) provided by investingactivities — 268,082 (77,709) — (268,082) (77,709)
Cash flows from financing activitiesProceeds from bank term loans — 842,625 — — — 842,625Repayments of long-term obligations — (632,025) — — — (632,025)Repurchase of notes — (373,255) — — — (373,255)Proceeds from short-term borrowing — — 4,294 — — 4,294Repayments of short-term borrowing — — (3,863) — — (3,863)Borrowings under revolving credit facility — 40,000 — — — 40,000Proceeds from revolving credit facility — (40,000) — — — (40,000)Intercompany accounts receivable/payable — — (100,590) 100,590 —Repayments of intercompany loans — — (167,492) — 167,492 —Repayment of capital lease obligations — — (3,511) — — (3,511)Debt acquisition costs — (17,498) — — — (17,498)Equity contributions — — — — — —Parent reduction in investment in subsidiary 878 (878) — — — —Repurchases of equity (878) — — — — (878)
Net cash (used in) provided by financingactivities — (181,031) (271,162) — 268,082 (184,111)
Effect of exchange rate changes on cash — — — 217 — 217Net change in cash and cash equivalents — — (67,370) 8,620 — (58,750)
Cash and cash equivalents - beginning of period — — 150,493 538 — 151,031Cash and cash equivalents - end of period $ — $ — $ 83,123 $ 9,158 $ — $ 92,281
Supplemental disclosures of cash flowinformation:Interest paid $ — $ 177,296 $ 2,131 $ — $ — $ 179,427Interest received — 1 109 — — 110Income taxes paid — — 1,638 343 — 1,981Non-cash investing and financing activities:
New capital leases — — 1,548 — — 1,548

PINNACLE FOODS INC. AND SUBSIDIARIESNOTES TO CONSOLIDATED FINANCIAL STATEMENTS(thousands of dollars, except share amounts and where noted in millions)
119
Pinnacle Foods Inc.Condensed Consolidating Statement of Cash Flows
For the fiscal year ended December 25, 2011
PinnacleFoodsInc.
PinnacleFoods
Finance LLCGuarantor
SubsidiariesNonguarantorSubsidiaries
Eliminationsand
ReclassificationsConsolidated
TotalCash flows from operating activities
Net cash provided by (used in) operatingactivities $ — $ (90,347) $ 299,953 $ (5,394) $ — $ 204,212
Cash flows from investing activitiesIntercompany accounts receivable/payable — (291,525) — — 291,525 —Intercompany loans — — (7,270) (9,800) 17,070 —Repayments of intercompany loans — 440,552 — (440,552) —Capital expenditures — — (117,306) — — (117,306)Sale of plant assets held for sale — — 7,900 — — 7,900
Net cash (used in) provided by investingactivities — 149,027 (116,676) (9,800) (131,957) (109,406)
Cash flows from financing activitiesRepayments of long-term obligations — (57,547) — — — (57,547)Proceeds from short-term borrowing — — 3,070 — — 3,070Repayments of short-term borrowing — — (2,954) — — (2,954)Intercompany accounts receivable/payable — — 291,525 (291,525) —Proceeds from intercompany loans — — 9,800 7,270 (17,070) —Repayments of intercompany loans — — (440,552) — 440,552 —Repayment of capital lease obligations — — (2,543) — — (2,543)Equity contributions — 558 — — — 558Parent reduction in investment in subsidiary 1,624 (1,624) — — — —Repurchases of equity (1,624) — — — — (1,624)Debt acquisition costs — (67) (454) (200) — (721)Other financing — — — 2,730 — 2,730
Net cash (used in) provided by financingactivities — (58,680) (142,108) 9,800 131,957 (59,031)
Effect of exchange rate changes on cash — — — (30) — (30)Net change in cash and cash equivalents — — 41,169 (5,424) — 35,745
Cash and cash equivalents - beginning of period — — 109,324 5,962 — 115,286Cash and cash equivalents - end of period $ — $ — $ 150,493 $ 538 $ — $ 151,031
Supplemental disclosures of cash flow information:Interest paid $ — $ 194,644 $ 1,695 $ — $ — $ 196,339Interest received — — 240 1 — 241Income taxes paid (refunded) — — (2,849) 895 — (1,954)Non-cash investing and financing activities:
New capital leases — — 11,240 — — 11,240
19. Subsequent Events
On January 29, 2014, the Company entered into a definitive agreement with Duncan Hines co-packer Gilster Mary Lee Corporation (“Gilster”) to acquire the Duncan Hines manufacturing business located in Centralia, Illinois, from Gilster for $16.5 million plus inventories. Under the terms of the agreement, Pinnacle will pay Gilster 10% of the purchase price and the inventories value in cash, with the balance due under a $14.9 million four-year note payable to Gilster on or before April 30, 2018. The acquisition is expected to close sometime in the second quarter of 2014.

120
ITEM 9. CHANGES IN AND DISAGREEMENTS WITH ACCOUNTANTS ON ACCOUNTING AND FINANCIAL DISCLOSURE
None.
ITEM 9A. CONTROLS AND PROCEDURES
(a) Disclosure Controls and Procedures
We maintain disclosure controls and procedures that are designed to provide reasonable assurance that information required to be disclosed by us in our reports that we file or submit under the Exchange Act (as defined in Rules 13a-15(e) and 15d-15(e) of the Securities Exchange Act of 1934, as amended (the “Exchange Act”)) is recorded, processed, summarized and reported within the time periods specified in the SEC's rules and forms, and that such information is accumulated and communicated to our management, with the participation of our Chief Executive Officer and Chief Financial Officer, as appropriate, to allow timely decisions regarding required disclosures.
In designing and evaluating our disclosure controls and procedures, management recognizes that disclosure controls and procedures, no matter how well conceived and operated, can provide only reasonable, not absolute, assurance that the objective of the disclosure controls and procedures are met. The design of any controls and procedures also is based on certain assumptions about the likelihood of future events, and there can be no assurance that any design will succeed in achieving its stated goals under all potential future conditions.
Our management, with the participation of our Chief Executive Officer and Chief Financial Officer, has evaluated the effectiveness of the design and operation of our disclosure controls and procedures as of December 29, 2013. Based upon that evaluation and subject to the foregoing, our Chief Executive Officer and Chief Financial Officer concluded that the design and operation of our disclosure controls and procedures are effective at a level of reasonable assurance.
(b) Management's Annual Report on Internal Control Over Financial Reporting.
The management of Pinnacle Foods Inc. and subsidiaries (the “Company”) is responsible for establishing and maintaining adequate internal control over financial reporting as defined in Exchange Act Rule 13a-15(f) and 15d-15(f). The Company's internal control system was designed to provide reasonable assurance to the Company's management and board of directors regarding the reliability of financial reporting and the preparation of financial statements for external purposes in accordance with generally accepted accounting principles.
Management assessed the effectiveness of the Company's internal control over financial reporting as of December 29, 2013. In making this assessment, management used the criteria established in Internal Control - Integrated Framework (1992) issued by the Committee of Sponsoring Organizations (COSO) of the Treadway Commission. Based on this assessment, management believes that, as of December 29, 2013, the Company's internal control over financial reporting is effective based on those criteria.
We have excluded Wish-Bone from the assessment of internal control over financial reporting as of December 29, 2013 because it was acquired by the Company in a purchase business combination during 2013. Wish-Bone's Total assets and Net sales represented 10.9% and 1.6%, respectively, of the related consolidated financial statement amounts as of and for the fiscal year ended December 29, 2013.
/s/ Robert J. Gamgort Robert J. GamgortChief Executive Officer
/s/ Craig Steeneck Craig SteeneckExecutive Vice President and Chief Financial Officer
(c) Attestation Report of the Registered Public Accounting Firm.
The effectiveness of the Company's internal control over financial reporting as of December 29, 2013 has been audited by Deloitte & Touche LLP, an independent registered public accounting firm, as stated in their report which appears herein.

121
(d) Changes in Internal Control Over Financial Reporting
There was no change in our internal control over financial reporting (as defined in Rules 13a-15(f) and 15d-15(f) of the Exchange Act) that occurred during the fiscal quarter ended December 29, 2013 that has materially affected, or is reasonably likely to materially affect, our internal control over financial reporting.
ITEM 9B: OTHER INFORMATION
Rule 10b5-1 Plans
Our policy governing transactions in our securities by our directors, officers and employees permits such persons to adopt stock trading plans pursuant to Rule 10b5-1 promulgated by the Securities and Exchange Commission under the Securities Exchange Act of 1934, as amended. Our directors, officers and employees have in the past and may from time to time establish such stock trading plans. We do not undertake any obligation to disclose, or to update or revise any disclosure regarding, any such plans and specifically do not undertake to disclose the adoption, amendment, termination or explanation of any such plans.
Iran Threat Reduction and Syria Human Rights Act of 2012
Pursuant to Section 219 of the Iran Threat Reduction and Syria Human Rights Act of 2012 (“ITRSHRA”), which added Section 13(r) of the Exchange Act, the Company hereby incorporates by reference herein Exhibit 99.1 of this report, which includes disclosures publicly filed and/or provided to The Blackstone Group L.P.by Travelport Limited, Hilton Worldwide, Inc. and SunGard Capital Corp., SunGard Capital Corp. II and SunGard Data Systems Inc. (collectively referred to herein as “SunGard”), which may be considered our affiliates.
Annual Meeting Date
The Board of Directors of the Company has fixed the date of the 2014 Annual Meeting of Stockholders for June 10, 2014.
PART III
ITEM 10. DIRECTORS AND EXECUTIVE OFFICERS OF THE REGISTRANT
Information required by this Item 10 will be included in our definitive Proxy Statement to be filed no later than 120 days after the end of the fiscal year covered by this Annual Report on Form 10-K and is incorporated herein by reference.
See information on executive officers in Part I.
ITEM 11. EXECUTIVE COMPENSATION
Information required by this Item 11 will be included in our definitive Proxy Statement to be filed no later than 120 days after the end of the fiscal year covered by this Annual Report on Form 10-K and is incorporated herein by reference.
ITEM 12. SECURITY OWNERSHIP OF CERTAIN BENEFICIAL OWNERS AND MANAGEMENT
Information required by this Item 12 will be included in our definitive Proxy Statement to be filed no later than 120 days after the end of the fiscal year covered by this Annual Report on Form 10-K and is incorporated herein by reference.
ITEM 13. CERTAIN RELATIONSHIPS AND RELATED TRANSACTIONS AND DIRECTOR INDEPENDENCE
Information required by this Item 13 will be included in our definitive Proxy Statement to be filed no later than 120 days after the end of the fiscal year covered by this Annual Report on Form 10-K and is incorporated herein by reference.
ITEM 14. PRINCIPAL ACCOUNTANT FEES AND SERVICES
Information required by this Item 14 will be included in our definitive Proxy Statement to be filed no later than 120 days after the end of the fiscal year covered by this Annual Report on Form 10-K and is incorporated herein by reference.

122
PART IV
ITEM 15: EXHIBITS, FINANCIAL STATEMENTS AND SCHEDULES
Financial Statements: the information required by this Item is contained in Item 8 of Part II of this Annual Report on Form 10-K.
Financial Statement Schedules: Schedule I - Condensed Financial Statements (Parent Company)
ExhibitNumber Description of exhibit
3.1† Amended and Restated Certificate of Incorporation of Pinnacle Foods Inc. (previously filed asExhibit 3.1 to the Current Report on Form 8-K of Pinnacle Foods Inc. filed with the SEC on April 3,2013 (Commission File Number: 001-35844) and incorporated herein by reference)
3.2† Amended and Restated Bylaws of Pinnacle Foods Inc. (previously filed as Exhibit 3.2 to the CurrentReport on Form 8-K of Pinnacle Foods Inc. filed with the SEC on April 3, 2013 (Commission FileNumber: 001-35844) and incorporated herein by reference)
4.1† Form of Stock Certificate for Common Stock (previously filed as Exhibit 4.1 to the RegistrationStatement on Form S-1/A of Pinnacle Foods Inc. filed with the SEC on March 6, 2013 (CommissionFile Number: 333-185565) and incorporated herein by reference)
4.2† Registration Rights Agreement dated April 3, 2013 among Pinnacle Foods Inc. and certain of itsshareholders (previously filed as Exhibit 4.1 to the Current Report on Form 8-K of Pinnacle FoodsInc. filed with the SEC on April 3, 2013 (Commission File Number: 001-35844) and incorporatedherein by reference)
4.3† Stockholders Agreement dated April 3, 2013 among Pinnacle Foods Inc. and the other parties thereto(previously filed as Exhibit 4.2 to the Current Report on Form 8-K of Pinnacle Foods Inc. filed withthe SEC on April 3, 2013 (Commission File Number: 001-35844) and incorporated herein byreference)
4.4† Senior Notes Indenture dated as of April 29, 2013 among Pinnacle Foods Finance LLC and PinnacleFoods Finance Corp., the Guarantors listed therein and Wilmington Trust Company, as Trustee(previously filed as Exhibit 4.1 to the Current Report on Form 8-K of Pinnacle Foods Inc. filed withthe SEC on April 30, 2013 (Commission File Number: 001-35844) and incorporated herein byreference)
4.5† Registration Rights Agreement dated April 29, 2013 among Pinnacle Foods Finance LLC, PinnacleFoods Finance Corp., the Guarantors listed therein and Barclays Capital Inc. (previously filed asExhibit 4.2 to the Current Report on Form 8-K of Pinnacle Foods Inc. filed with the SEC on April30, 2013 (Commission File Number: 001-35844) and incorporated herein by reference)
10.1† Second Amended and Restated Credit Agreement dated April 29, 2013 among Pinnacle FoodsFinance LLC, Peak Finance Holdings LLC, Barclays Bank PLC and the Other Lenders Party thereto(previously filed as Exhibit 10.1 to the Current Report on Form 8-K of Pinnacle Foods Inc. filedwith the SEC on April 30, 2013 (Commission File Number: 001-35844) and incorporated herein byreference)
10.2† First Amendment to Second Amended and Restated Credit Agreement dated October 1, 2013 amongPinnacle Foods Finance LLC, Peak Finance Holdings LLC, the Guarantors Party thereto, BarclaysBank Plc and the Other Lenders Party thereto (previously filed as Exhibit 10.1 to the Current Reporton Form 8-K of Pinnacle Foods Inc. filed with the SEC on October 1, 2013 (Commission FileNumber: 001-35844) and incorporated herein by reference)
10.3† Second Amendment to Amended and Restated Credit Agreement dated April 29, 2013 amongPinnacle Foods Finance LLC, Peak Finance Holdings LLC, the Guarantors Party hereto, BarclaysBank Plc, Bank of America, NA and the Other Lenders Party thereto (previously filed asExhibit 10.2 to the Current Report on Form 8-K of Pinnacle Foods Inc. filed with the SEC on April30, 2013 (Commission File Number: 001-35844) and incorporated herein by reference)
10.4† Guaranty, dated as of April 2, 2007, among Peak Finance Holdings LLC, certain Subsidiaries ofPinnacle Foods Finance LLC and Holdings identified therein and Lehman Commercial Paper Inc.(previously filed as Exhibit 4.10 to the Registration Statement on Form S-4 of Pinnacle FoodsFinance LLC filed with the SEC on December 21, 2007 (Commission File Number: 333-148297)and incorporated herein by reference)
123
10.5† Intellectual Property Security Agreement, dated as of April 2, 2007, among Peak Finance LLC (to bemerged with and into Pinnacle Foods Finance LLC) as Borrower, Peak Finance Holdings LLC asHoldings, certain Subsidiaries of Borrower and Holdings identified therein and Lehman CommercialPaper Inc. (previously filed as Exhibit 4.11 to the Registration Statement on Form S-4 of PinnacleFoods Finance LLC filed with the SEC on December 21, 2007 (Commission File Number:333-148297) and incorporated herein by reference)
10.6† Parent Guaranty, dated as of April 29, 2013, between Pinnacle Foods Inc. and Barclays Bank PLC(previously filed as Exhibit 21.1 to the Registration Statement on Form S-1 of Pinnacle Foods Inc.filed with the SEC on November 26, 2013 (Commission File Number: 333-192563) andincorporated herein by reference)
10.7† Parent Security Agreement, dated as of April 29, 2013, between Pinnacle Foods Inc. and BarclaysBank PLC (previously filed as Exhibit 21.1 to the Registration Statement on Form S-1 of PinnacleFoods Inc. filed with the SEC on November 26, 2013 (Commission File Number: 333-192563) andincorporated herein by reference)
10.8† Asset Purchase Agreement dated August 11, 2013 between Conopco, Inc. and Pinnacle Foods Inc.(previously filed as Exhibit 2.1 to the Current Report on Form 8-K of Pinnacle Foods Inc. filed withthe SEC on October 1, 2013 (Commission File Number: 001-35844) and incorporated herein byreference)
10.9† Modification of the Pinnacle Foods Inc. (formerly Crunch Holding Corp.) 2007 Stock Incentive PlanForm of Nonqualified Stock Option Agreement (previously filed as Exhibit 10.42 to the AnnualReport on Form 10-K of Pinnacle Foods Finance LLC filed with the SEC on March 5, 2013(Commission File Number: 333-148297) and incorporated herein by reference)
10.10† Pinnacle Foods Inc. 2013 Omnibus Incentive Plan (previously filed as Exhibit 10.3 to the CurrentReport on Form 8-K of Pinnacle Foods Inc. filed with the SEC on April 3, 2013 (CommissionFile Number: 001-35844) and incorporated herein by reference)
10.11† Form of Restricted Stock Agreement under 2013 Omnibus Incentive Plan (previously filed asExhibit 10.7 to the Quarterly Report on Form 10-Q of Pinnacle Foods Inc. filed with the SEC onMay 10, 2013 (Commission File Number: 333-185565) and incorporated herein by reference)
10.12† Form of Restricted Stock Agreement (Conversion Replacement Award) (previously filed as Exhibit10.45 to the Registration Statement on Form S-1/A of Pinnacle Foods Inc. filed with the SEC onMarch 6, 2013 (Commission File Number: 333-185565) and incorporated herein by reference)
10.13† Form of Nonqualified Stock Option Agreement under 2013 Omnibus Incentive Plan (previouslyfiled as Exhibit 10.46 to the Registration Statement on Form S-1/A of Pinnacle Foods Inc. filed withthe SEC on March 6, 2013 (Commission File Number: 333-185565) and incorporated herein byreference)
10.14† Tax Sharing Agreement, dated as of November 25, 2003 and amended as of December 23, 2009 andMarch 25, 2011, by and among Pinnacle Foods Inc. (formerly Crunch Holding Corp.), PinnacleFoods Holding Corporation, Pinnacle Foods Corporation, Pinnacle Foods Management Corporation,Pinnacle Foods Brands Corporation, PF Sales (N. Central Region) Corp., PF Sales, LLC, PFDistribution, LLC, PF Standards Corporation, Pinnacle Foods International Corp., Peak FinanceHoldings LLC, Pinnacle Foods Finance Corp., Pinnacle Foods Finance LLC, Pinnacle Foods FortMadison LLC and Pinnacle Foods Group LLC, BEMSA Holding, Inc., Birds Eye Foods, Inc., BirdsEye Holdings, Inc., Birds Eye Group, Inc., GLK Holdings, Inc., Kennedy Endeavors, Incorporated,Rochester Holdco LLC, and Seasonal Employers, Inc. (previously filed as Exhibit 10.10 to theQuarterly Report on Form 10-Q of Pinnacle Foods Finance LLC filed with the SEC on May 11,2011 (Commission File Number: 333-148297) and incorporated herein by reference).
10.15† Trademark License Agreement by and between The Dial Corporation and Conagra, Inc., dated July1, 1995 (previously filed as Exhibit 10.33 to the Annual Report on Form 10-K of Pinnacle FoodsGroup Inc. for the fiscal year ended December 25, 2005 (Commission File Number: 333-118390)and incorporated herein by reference).
10.16† Swanson Trademark License Agreement (U.S.) by and between CSC Brands, Inc. and VlasicInternational Brands Inc., dated as of March 24, 1998 (previously filed as Exhibit 10.27 to theRegistration Statement on Form S-4 of Pinnacle Foods Group Inc. filed with the SEC on August 20,2004 (Commission File Number: 333-1183900) and incorporated herein by reference).
10.17† Swanson Trademark License Agreement (Non-U.S.) by and between Campbell Soup Company andVlasic International Brands Inc., dated as of March 26, 1998 (previously filed as Exhibit 10.28 to theRegistration Statement on Form S-4 of Pinnacle Foods Group Inc. filed with the SEC on August 20,2004 (Commission File Number: 333-118390) and incorporated herein by reference).

124
10.18† Trademark License Agreement, dated as of July 9, 1996, by and between The Quaker OatsCompany, The Quaker Oats Company of Canada Limited and Van de Kamp’s, Inc. (previously filedas Exhibit 10.21 to the Registration Statement on Form S-4 of Pinnacle Foods Finance LLC filedwith the SEC on December 21, 2007 (Commission File Number: 333-148297) and incorporatedherein by reference).
10.19† Trademark License Agreement, dated August 19, 2002, by and between Voila Bakeries, Inc. andAgrilink Foods, Inc. (previously filed as Exhibit 10.1 to the Quarterly Report on Form 10-Q ofPinnacle Foods Finance LLC filed with the SEC on May 9, 2012 (Commission File Number:333-148297) and incorporated herein by reference).
10.20† Technology Sharing Agreement by and between Campbell Soup Company and Vlasic FoodsInternational Inc., dated as of March 26, 1998 (previously filed as Exhibit 10.29 to the RegistrationStatement on Form S-4 of Pinnacle Foods Group Inc. with the SEC on August 20, 2004(Commission File Number: 333-118390) and incorporated herein by reference).
10.21†** Pinnacle Foods Inc. (formerly Crunch Holding Corp.) 2007 Stock Incentive Plan, effective as ofAugust 8, 2007 (previously filed as Exhibit 10.19 to the Registration Statement on Form S-4 ofPinnacle Foods Finance LLC filed with the SEC on December 21, 2007 (Commission File Number:333-148297) and incorporated herein by reference)
10.22†** Pinnacle Foods Inc. (formerly Crunch Holding Corp.) 2007 Stock Incentive Plan Form ofNonqualified Stock Option Agreement (previously filed as Exhibit 10.20 to the RegistrationStatement on Form S-4 of Pinnacle Foods Finance LLC filed with the SEC on December 21, 2007(Commission File Number: 333-148297) and incorporated herein by reference)
10.23†** Modification of the Pinnacle Foods Inc. (formerly Crunch Holding Corp.) 2007 Stock Incentive PlanForm of Nonqualified Stock Option Agreement (previously filed as Exhibit 10.27 to the AnnualReport on Form 10-K of Pinnacle Foods Finance LLC filed with the SEC on March 3, 2009(Commission File Number: 333-148297) and incorporated herein by reference).
10.24†** Employment Agreement, dated April 2, 2007 (Craig Steeneck) (previously filed as Exhibit 10.4 tothe Registration Statement on Form S-4 of Pinnacle Foods Finance LLC filed with the SEC onDecember 21, 2007 (Commission File Number: 333-148297) and incorporated herein by reference)
10.25†** Employment offer letter dated May 25, 2001 (Lynne M. Misericordia) (previously filed asExhibit 10.30 to the Annual Report on Form 10-K of Pinnacle Foods Finance LLC filed with theSEC on March 3, 2009 (Commission File Number: 333-148297) and incorporated herein byreference).
10.26†** Employment offer letter dated May 25, 2001 (M. Kelley Maggs) (previously filed as Exhibit 10.31to the Annual Report on Form 10-K of Pinnacle Foods Finance LLC filed with the SEC on March 3,2009 (Commission File Number: 333-148297) and incorporated herein by reference).
10.27†** Employment Agreement, dated July 13, 2009 (Robert J. Gamgort) (previously filed as Exhibit 10.33to the Quarterly Report on Form 10-Q of Pinnacle Foods Finance LLC filed with the SEC on August12, 2009 (Commission File Number: 333-148297) and incorporated herein by reference).
10.28†** Amendment to Employment Agreement (Robert J. Gamgort) (previously filed as Exhibit 10.44 tothe Annual Report on Form 10-K of Pinnacle Foods Finance LLC filed with the SEC on March 10,2011 (Commission File Number: 333-148297), and incorporated herein by reference).
10.29* Amendment to Employment Agreement (Robert J. Gamgort) dated December 16, 2013.
10.30†** Employment offer letter dated June 3, 2010 (Mark L. Schiller) (previously filed as Exhibit 10.41 tothe Quarterly Report on Form 10-Q of Pinnacle Foods Finance LLC filed with the SEC on August 9,2010 (Commission File Number: 333-148297) and incorporated herein by reference).
10.31† Lease, dated May 23, 2001, between Brandywine Operating Partnership, L.P. and Pinnacle FoodsCorporation (Cherry Hill, New Jersey) (previously filed as Exhibit 10.25 to the RegistrationStatement on Form S-4 of Pinnacle Foods Group Inc. filed with the SEC on August 20, 2004(Commission File Number: 333-118390) and incorporated herein by reference).
10.32† Lease, dated August 10, 2001, between 485 Properties, LLC and Pinnacle Foods Corporation(Mountain Lakes, New Jersey); Amendment No. 1, dated November 23, 2001; Amendment No. 2,dated October 16, 2003 (previously filed as Exhibit 10.26 to the Registration Statement on Form S-4of Pinnacle Foods Group Inc. filed with the SEC on August 20, 2004 (Commission File Number:333-118390) and incorporated herein by reference).
125
10.33† Amendment to Lease Agreement, dated February 10, 2007 (previously filed as Exhibit 10.1 to theCurrent Report on Form 8-K of Pinnacle Foods Group Inc. filed with the SEC on February 15,20076 (Commission File Number: 333-118390) and incorporated herein by reference).
10.34† Lease, dated April 15, 2010, between Woodcrest Road Associates, L.P. and Pinnacle Foods GroupLLC (Cherry Hill, New Jersey) (previously filed as Exhibit 10.40 to the Quarterly Report onForm 10-Q of Pinnacle Foods Finance LLC filed with the SEC on August 9, 2010 (Commission FileNumber: 333-148297) and incorporated herein by reference).
10.35† Lease, dated December 14, 2010 between Jeffroad Green, LLC and Pinnacle Foods Group LLC(Parsippany, New Jersey) (previously filed as Exhibit 10.45 to the Quarterly Report on Form 10-Qof Pinnacle Foods Finance LLC filed with the SEC on May 11, 2011 (Commission File Number:333-148297) and incorporated herein by reference).
10.36†** Terms of Employment letter dated February 7, 2011 (Antonio F. Fernandez) (previously filed asExhibit 10.43 to the Annual Report on Form 10-K of Pinnacle Foods Finance LLC filed with theSEC on March 10, 2011 (Commission File Number: 333-148297) and incorporated herein byreference).
10.37†** Modification of the Pinnacle Foods Inc. (formerly Crunch Holding Corp.) 2007 Stock Incentive PlanForm of Nonqualified Stock Option Agreement (previously filed as Exhibit 10.42 to the AnnualReport on Form 10-K of Pinnacle Foods Finance LLC filed with the SEC on March 5, 2013(Commission File Number: 333-148297) and incorporated herein by reference).
10.38†** Form of Nonqualified Stock Option Agreement under 2013 Omnibus Incentive Plan (previouslyfiled as Exhibit 10.2 to Quarterly Report on Form 10-Q of Pinnacle Foods Inc. filed with the SEC onNovember 13, 2013 (Commission File Number: 333-185565) and incorporated herein by reference)
10.39†** Form of Restricted Stock Agreement under 2013 Omnibus Incentive Plan (previously filed asExhibit 10.1 to the Quarterly Report on Form 10-Q of Pinnacle Foods Inc. filed with the SEC onNovember 13, 2013 (Commission File Number: 333-185565) and incorporated herein by reference)
10.40* Form of Restricted Stock Award Agreement (Directors)
12.1* Computation of Ratios of Earnings to Fixed Charges.
21.1† List of Subsidiaries (previously filed as Exhibit 21.1 to the Registration Statement on Form S-1 ofPinnacle Foods Inc. filed with the SEC on November 26, 2013 (Commission File Number:333-192563) and incorporated herein by reference).
23.1* Consent of Deloitte & Touche LLP.
31.1* Rule 13a-14(a)/15d-14(a) Certification of Chief Executive Officer.
31.2* Rule 13a-14(a)/15d-14(a) Certification of Executive Vice President and Chief Financial Officer.
32.1* Certification of Chief Executive Officer pursuant to 18 U.S.C. Section 1350, as adopted pursuant to Section 906 of the Sarbanes-Oxley Act of 2002 (A)
32.2* Certification of Executive Vice President and Chief Financial Officer pursuant to 18 U.S.C. Section 1350, as adopted pursuant to Section 906 of the Sarbanes-Oxley Act of 2002 (A)
99.1* Section 13(r) Disclosure
101.1* The following materials are formatted in XBRL (eXtensible Business Reporting Language): (i) the Consolidated Statements of Operations, (ii) the Consolidated Statements of Comprehensive Earnings, (iii) the Consolidated Balance Sheets, (iv) the Consolidated Statements of Cash Flows, (v) the Consolidated Statements of Member’s Equity, (vi) Notes to Consolidated Financial Statements, and (vii) document and entity information. (B)
* Filed herewith. ** Identifies exhibits that consist of a management contract or compensatory plan or arrangement. *** To be filed by amendment. † Previously filed.
(A) Pursuant to Commission Release No. 33-8212, this certification will be treated as “accompanying” this Form 10-K and not “filed” as part of such report for purposes of Section 18 of Exchange Act, or otherwise subject to the liability of Section 18 of the Exchange Act and this certification will not be deemed to be incorporated by reference into any filing

126
under the Securities Act of 1933, as amended, or the Exchange Act, except to the extent that the registrant specifically incorporates it by reference.
(B) Pursuant to Rule 406T of Regulation S-T, the Interactive Data files on Exhibit 101.1 hereto are deemed not filed or part of a registration statement or prospectus for purposes of Sections 11 or 12 of the Securities Act of 133, as amended, are deemed not file for purposes of Section 18 of the Securities and Exchange Act of 1934, as amended, and otherwise are not subject to liability under those sections.
PARENT COMPANY INFORMATIONPINNACLE FOODS INC
SCHEDULE I - CONDENSED FINANCIAL STATEMENTS(thousands of dollars)
STATEMENTS OF OPERATIONS
Fiscal year ended
December 29,2013
December 30,2012
December 25,2011
Equity in earnings (loss) of investees $ 89,349 $ 52,519 $ (46,914)Net earnings (loss) $ 89,349 $ 52,519 $ (46,914)Comprehensive (loss) earnings $ 143,405 $ 43,402 $ (49,818)
BALANCE SHEETS
December 29,2013
December 30,2012
Current Assets:Due from subsidiaries 25,119 — Total current assets 25,119 —Non current assets:Investment in subsidiaries 1,598,041 888,726 Total assets $ 1,623,160 $ 888,726
Current liabilities:Dividends payable 25,119 —Total liabilities $ 25,119 $ —
Commitment and contingencies:Shareholders' equity 1,598,041 888,726Total liabilities and shareholders’s equity $ 1,623,160 $ 888,726

127
STATEMENTS OF CASH FLOWS
Fiscal year ended
December 29,
2013December 30,
2012December 25,
2011Cash flows from operating activitiesNet earnings (loss) $ 89,349 $ 52,519 $ (46,914)Non-cash charges (credits) to net earnings (loss)Equity in (earnings) loss of investees (89,349) (52,519) 46,914Net cash provided by operating activities — — —
Cash flows from investing activities
(Increase) reduction in investment in subsidiaries (583,098) 878 1,066Net cash (used) provided by investing activities (583,098) 878 1,066
Cash flows from financing activitiesEquity contributions 624,953 — 558Dividends paid (41,664)Repurchase of equity (191) (878) (1,624)Net cash provided (used) by financing activities 583,098 (878) (1,066)
Cash and cash equivalents - beginning of period — — —Cash and cash equivalents - end of period $ — $ — $ —
See notes to Consolidated Financial Statements of Pinnacle Foods Inc.
PINNACLE FOODS INC.SCHEDULE I - NOTES TO CONDENSED FINANCIAL STATEMENTS
NOTE A - BASIS OF PRESENTATION
Pinnacle Foods Inc. (the “Company”) is a holding company whose sole asset is 100% ownership of Peak Finance Holdings LLC (“PFH”). PFH is a holding company whose sole asset is 100% ownership of Pinnacle Foods Finance LLC (“PFF”). As specified in PFF’s debt agreements, there are restrictions on the Company’s ability to obtain funds from its subsidiary through dividends, loans or advances. Accordingly, these condensed financial statements have been prepared on a “parent-only” basis. Under a parent-only presentation, the Company’s investments in its consolidated subsidiaries are presented under the equity method of accounting. The Company has no material contingencies, long-term obligations or guarantees, except as described in Note 18. This parent-only financial statements should be read in conjunction with Pinnacle Foods Inc.’s audited Consolidated Financial Statements included elsewhere herein.
128
SIGNATURES Pursuant to the requirements of Section 13 or 15(d) of the Securities Exchange Act of 1934, in the City of Parsippany, New Jersey, on March 6, 2014 the registrant has duly caused this report to be signed on its behalf by the undersigned, thereunto duly authorized.
PINNACLE FOODS INC.
By: /s/ Craig SteeneckName: Craig SteeneckTitle: Executive Vice President and Chief Financial Officer
(Principal Financial Officer and Principal AccountingOfficer)
Date: March 6, 2014
Pursuant to the requirement of the Securities Exchange Act of 1934, this report has been signed below by the following persons on behalf of the registrant and in the capacities and on the dates indicated.
Name Title Date
/s/ Robert J. Gamgort Chief Executive Officer and Director March 6, 2014By: Robert J. Gamgort (Principal Executive Officer)
/s/ Craig Steeneck Executive Vice President and Chief Financial Officer March 6, 2014By: Craig Steeneck (Principal Financial Officer and
Principal Accounting Officer)
/s/ Roger Deromedi Chairman of the Board and Director March 6, 2014By: Roger Deromedi
/s/ Ann Fandozzi Director March 6, 2014By: Ann Fandozzi
/s/ Jason Giordano Director March 6, 2014By: Jason Giordano
/s/ Prakash A. Melwani Director March 6, 2014By: Prakash A. Melwani
/s/ Jeff Overly Director March 6, 2014By: Jeff Overly
/s/ Raymond P. Silcock Director March 6, 2014By: Raymond P. Silcock
Exhibit 23.1
CONSENT OF INDEPENDENT REGISTERED PUBLIC ACCOUNTING FIRM
We consent to the incorporation by reference in Registration Statement No. 333-187774 on Form S-8 of our reports dated March 6, 2014, relating to the financial statements and financial statement schedule of Pinnacle Foods Inc. and subsidiaries (the “Company"), and the effectiveness of the Company’s internal control over financial reporting, appearing in this Annual Report on Form 10-K of the Company for the year ended December 29, 2013.
/s/ Deloitte & Touche LLPParsippany, New Jersey
March 6, 2014

Exhibit 31.1CERTIFICATION
I, Robert J. Gamgort, certify that:
1. I have reviewed this annual report on Form 10-K of Pinnacle Foods Inc. (the “Registrant”);2. Based on my knowledge, this report does not contain any untrue statement of a material fact or omit to state a material fact
necessary to make the statements made, in light of the circumstances under which such statements were made, not misleading with respect to the period covered by this report;
3. Based on my knowledge, the financial statements, and other financial information included in this report, fairly present in all material respects the financial condition, results of operations and cash flows of the Registrant as of, and for, the periods presented in this report;
4. The Registrant’s other certifying officer(s) and I are responsible for establishing and maintaining disclosure controls and procedures (as defined in Exchange Act Rules 13a-15(e) and 15d-15(e)) and internal control over financial reporting (as defined in Exchange Act Rules 13a-15(f) and 15d-15(f)) for the Registrant and have:
(a) Designed such disclosure controls and procedures, or caused such disclosure controls and procedures to be designed under our supervision, to ensure that material information relating to the Registrant, including its consolidated subsidiaries, is made known to us by others within those entities, particularly during the period in which this report is being prepared;
(b) Designed such internal control over financial reporting, or caused such internal control over financial reporting to be designed under our supervision, to provide reasonable assurance regarding the reliability of financial reporting and the preparation of financial statements for external purposes in accordance with generally accepted accounting principles;
(c) Evaluated the effectiveness of the Registrant’s disclosure controls and procedures and presented in this report our conclusions about the effectiveness of the disclosure controls and procedures, as of the end of the period covered by this report based on such evaluation; and
(d) Disclosed in this report any change in the Registrant’s internal control over financial reporting that occurred during the Registrant’s most recent fiscal quarter (the Registrant's fourth fiscal quarter in the case of an annual report) that has materially affected, or is reasonably likely to materially affect, the Registrant’s internal control over financial reporting; and
5. The Registrant’s other certifying officer(s) and I have disclosed, based on our most recent evaluation of internal control over financial reporting, to the Registrant’s auditors and the audit committee of the Registrant’s board of directors (or persons performing the equivalent functions):(a) All significant deficiencies and material weaknesses in the design or operation of internal control over financial reporting
which are reasonably likely to adversely affect the Registrant’s ability to record, process, summarize and report financial information; and
(b) Any fraud, whether or not material, that involves management or other employees who have a significant role in the Registrant’s internal control over financial reporting.
Date: March 6, 2014
/s/ ROBERT J. GAMGORT
Robert J. GamgortChief Executive Officer
Exhibit 31.2
CERTIFICATION
I, Craig Steeneck, certify that:
1. I have reviewed this annual report on Form 10-K of Pinnacle Foods Inc. (the “Registrant”);
2. Based on my knowledge, this report does not contain any untrue statement of a material fact or omit to state a material fact necessary to make the statements made, in light of the circumstances under which such statements were made, not misleading with respect to the period covered by this report;
3. Based on my knowledge, the financial statements, and other financial information included in this report, fairly present in all material respects the financial condition, results of operations and cash flows of the Registrant as of, and for, the periods presented in this report;
4. The Registrant’s other certifying officer(s) and I are responsible for establishing and maintaining disclosure controls and procedures (as defined in Exchange Act Rules 13a-15(e) and 15d-15(e)) and internal control over financial reporting (as defined in Exchange Act Rules 13a-15(f) and 15d-15(f)) for the Registrant and have:
(a) Designed such disclosure controls and procedures, or caused such disclosure controls and procedures to be designed under our supervision, to ensure that material information relating to the Registrant, including its consolidated subsidiaries, is made known to us by others within those entities, particularly during the period in which this report is being prepared;
(b) Designed such internal control over financial reporting, or caused such internal control over financial reporting to be designed under our supervision, to provide reasonable assurance regarding the reliability of financial reporting and the preparation of financial statements for external purposes in accordance with generally accepted accounting principles;
(c) Evaluated the effectiveness of the Registrant’s disclosure controls and procedures and presented in this report our conclusions about the effectiveness of the disclosure controls and procedures, as of the end of the period covered by this report based on such evaluation; and
(d) Disclosed in this report any change in the Registrant’s internal control over financial reporting that occurred during the Registrant’s most recent fiscal quarter (the Registrant's fourth fiscal quarter in the case of an annual report) that has materially affected, or is reasonably likely to materially affect, the Registrant’s internal control over financial reporting; and
5. The Registrant’s other certifying officer(s) and I have disclosed, based on our most recent evaluation of internal control over financial reporting, to the Registrant’s auditors and the audit committee of the Registrant’s board of directors (or persons performing the equivalent functions):
(a) All significant deficiencies and material weaknesses in the design or operation of internal control over financial reporting which are reasonably likely to adversely affect the Registrant’s ability to record, process, summarize and report financial information; and
(b) Any fraud, whether or not material, that involves management or other employees who have a significant role in the Registrant’s internal control over financial reporting.
Date: March 6, 2014
/s/ CRAIG STEENECK
Craig SteeneckExecutive Vice President and Chief Financial Officer

Exhibit 32.1 CERTIFICATION PURSUANT TO
18 U.S.C. SECTION 1350, AS ADOPTED PURSUANT TO
SECTION 906 OF THE SARBANES-OXLEY ACT OF 2002
In connection with the Annual Report of Pinnacle Foods Inc. (the “Registrant”) on Form 10-K for the fiscal year ended December 29, 2013, as filed with the Securities and Exchange Commission on the date hereof (the “Report”), I, Robert J. Gamgort, Chief Executive Officer of the Registrant, certify, pursuant to 18 U.S.C. Section 1350, as adopted pursuant to Section 906 of the Sarbanes-Oxley Act of 2002, that:
1. The Report fully complies with the requirements of Section 13(a) or 15(d) of the Securities Exchange Act of 1934; and
2. The information contained in the Report fairly presents, in all material respects, the financial condition and results of operations of the Registrant.
Date: March 6, 2014
/s/ ROBERT J. GAMGORT
Robert J. GamgortChief Executive Officer

Exhibit 32.2 CERTIFICATION PURSUANT TO
18 U.S.C. SECTION 1350, AS ADOPTED PURSUANT TO
SECTION 906 OF THE SARBANES-OXLEY ACT OF 2002
In connection with the Annual Report of Pinnacle Foods Inc. (the “Registrant”) on Form 10-K for the fiscal year ended December 29, 2013, as filed with the Securities and Exchange Commission on the date hereof (the “Report”), I, Craig Steeneck, Chief Financial Officer of the Registrant, certify, pursuant to 18 U.S.C. Section 1350, as adopted pursuant to Section 906 of the Sarbanes-Oxley Act of 2002, that:
1. The Report fully complies with the requirements of Section 13(a) or 15(d) of the Securities Exchange Act of 1934; and2. The information contained in the Report fairly presents, in all material respects, the financial condition and results of operations
of the Registrant.
Date: March 6, 2014
/s/ CRAIG STEENECK
Craig SteeneckExecutive Vice President and Chief Financial Officer

[THIS PAGE INTENTIONALLY LEFT BLANK]

[THIS PAGE INTENTIONALLY LEFT BLANK]

[THIS PAGE INTENTIONALLY LEFT BLANK]

($ in millions)
Net Sales Reported
EBIT Reported Adjustments(5)
Adjusted
Reported Acquisition, merger and other restructuring charges(1)
Other non-cash items(2)
Other adjustments(3)
Adjusted
IPO(4)
Public company costs(4)
Pro forma
Memo: Impact of 53rd week
Pro forma excluding impact of 53rd week
(in millions, except per share) Year Ended December 29, 2013 (52 Weeks)
$2,464
$2,464
$2,464
NetSales
$65456
$665
$665
GrossProfit
$293221453
$382
$382
EBIT
$89149
56
$168
15
$183
NetEarnings
108.6
108.6
8.0
116.6
DilutedShares
$0.82
$1.55
$1.57
DilutedEPS
Year Ended December 29, 2013 (52 Weeks)
$1,097
$1999
$208
Birds EyeFrozen
$1,005
$14423
$167
Duncan HinesGrocery
$2,102
$34332
$375
North AmericaRetail
$362
$301
$31
SpecialtyFoods
($80)56
($24)
Corporate
$2,464
$29389
$382
Total
Segment Net Sales and Adjusted EBIT
Year Ended December 30, 2012 (53 Weeks)
$2,479
$2,479
$2,479
29
$2,450
NetSales
$585 38 (1)1
$623
$623
7
$616
GrossProfit
$284 45 0
21
$350
(3)
$347
6
$341
EBIT
$53 28 0
23
$104
30 (2)
$132
2
$130
NetEarnings
86.5
86.5
30.9
117.4
117.4
117.4
DilutedShares
$0.61
$1.20
$1.13
$0.02
$1.11
DilutedEPS
Adjusted and Pro Forma Measures
Reported Acquisition, merger and other restructuring charges(1)
Other non-cash items(2)
Other adjustments(3)
Adjusted
IPO and Refinancing(4)
Pro forma
Net Sales Reported Memo: Impact of 53rd week
Reported excluding impact of 53rd week
EBIT Reported Adjustments(5)
Adjusted
Memo: Impact of 53rd week
Adjusted excluding impact of 53rd week
(1) Primarily includes: accelerated depreciation from plant consolidations, restructuring charges including integration costs, other non-recurring merger costs and employee severance.(2) Primarily includes: impairment charges, mark-to-market gains/losses and non-cash equity-related compensation charges.(3) Management fee paid to sponsor, AJ recall and bond redemption costs.(4) Pro forma reflects Adjusted Statement of Operations amounts assuming the Company’s 3/28/13 IPO occurred on the first day of Fiscal 2012 and, in the case of 2013, the 4/29/13 Refinancing occurred on the first day of Fiscal 2013.(5) For segment adjustments, see page 35 in the accompanying Form 10-K.
Year Ended December 30, 2012 (53 Weeks)
$1,10312
$1,091
$17815
$193
3
$190
Birds EyeFrozen
$97912
$967
$12127
$148
3
$145
Duncan HinesGrocery
$2,08224
$2,058
$29942
$341
6
$335
North AmericaRetail
$3975
$392
$248
$32
1
$31
SpecialtyFoods
($39)16
($23)
(1)
($22)
Corporate
$2,47929
$2,450
$28466
$350
6
$344
Total
Reconciliations of Non-GAAP Financial Measures
87886_Text.indd 1387886_Text.indd 13 5/1/14 3:09 PM5/1/14 3:09 PM

Net earnings (loss)
Interest expense, net
Provision (benefit) for income taxes
Depreciation and amortization
EBITDA
Acquisition, merger and other restructuring charges(1)
Other non-cash items(2)
Other adjustments(3)
Adjusted EBITDA
Adjustment to Wish-Bone Full Run-rate EBITDA(4)
Adjusted EBITDA Pro forma for Wish-Bone
Reconciliation of Adjusted EBITDA to Net Earnings
$22
236
7
78
$343
27
72
5
$447
2010
($47)
208
22
89
$272
20
152
6
$450
2011
$53
198
33
98
$382
23
21
$426
2012
$89
132
72
78
$371
22
14
53
$460
55
$515
2013
(1) Primarily includes: restructuring charges including integration costs, other non-recurring merger costs and employee severance. (2) Primarily includes: fair value write up of acquired inventories, impairment charges, mark-to-market gains/losses and non-cash equity-related compensation charges.(3) Management fee paid to sponsor, variable product contribution on exited business (Birds Eye Steamfresh Meals), AJ recall and bond redemption costs.(4) Adjustment for additional nine months, including synergies. (5) Primarily includes: restructuring charges including plant consolidations, integration costs, other non-recurring merger costs, management fee paid to sponsor and employee severance.
Reconciliation of Unleveraged Free Cash Flow toReported Cash Flows from Operating Activities
Reported Cash Flows from Operating Activities
Cash expenditures
Acquisition, merger and other restructuring charges(5)
Free Cash Flow
Cash interest expense
Unleveraged Free Cash Flow
Adjustment to Wish-Bone Full Run-rate Unleveraged Free Cash Flow(4)
Unleveraged Free Cash Flow Pro forma for Wish-Bone
$257
(81)
17
$193
202
$395
2010
$204
(117)
42
$129
195
$324
2011
$203
(78)
48
$173
172
$345
2012
$262
(84)
39
$217
108
$325
55
$380
2013
($ in millions)
($ in millions)
Reconciliations of Non-GAAP Financial Measures
87886_Text.indd 1487886_Text.indd 14 5/1/14 3:09 PM5/1/14 3:09 PM

87886_Text.indd 1587886_Text.indd 15 5/1/14 3:09 PM5/1/14 3:09 PM

CORPORATE AND INVESTOR INFORMATION
DividendsPinnacle has initiated a quarterly dividend program since the company became public in 2013. Dividends are paid quarterly, in January, April, July and October.
Independent Registered PublicAccounting FirmDeloitte & Touche LLPParsippany, NJ
Corporate News and ReportsA wide range of information about the
reports, investor information, corporategovernance and career opportunities areavailable on our website – www.pinnaclefoods.com.
Printed materials such as the Annual Report on SEC Form 10-K and quarterly reports on SEC Form 10-Q may be requested via our website or by calling (973) 434-2924.
Forward-Looking StatementsThis annual report contains statements that are forward-looking and actual results could differ materially. Factors that could cause this difference are set forth in Items 1 and 1A of the accompanying Annual Report on SEC Form 10-K.
HeadquartersPinnacle Foods Inc.399 Jefferson RoadParsippany, NJ 07054(973) 541-6620www.pinnaclefoods.com
Stock Exchange ListingNew YorkTicker Symbol: PF
Investor RelationsMaria SceppaguercioSenior Vice President, Investor Relationsand Communicationsemail: [email protected]: http://investors.pinnaclefoods.com(973) 434-2924
Annual Meeting of StockholdersThe annual meeting will be held at9:30 A.M. EDT on Tuesday, June 10, 2014at the Hilton Parsippany Hotel1 Hilton CourtParsippany, NJ 07054
Transfer Agent and RegistrarComputershare Investor ServicesP.O. Box 43078Providence, RI 02940-3078(877) 373-6374
87886_Text.indd 1687886_Text.indd 16 5/1/14 3:09 PM5/1/14 3:09 PM

* The above financial results are presented on a pro forma basis, reflecting Adjusted Statement of Operations amounts, assuming the Company’s 3/28/13 IPO occurred on the first day of Fiscal 2012 and the 4/29/13 Refinancing occurred on the first day of Fiscal 2013. See reconciliation to GAAP financial measures at the end of this Report.(1) 2012 was a 53-week year, whereas 2013 was a 52-week year.(2) Represents Birds Eye Frozen Division plus Duncan Hines Grocery Division.
In a challenging year for the U.S. food industry, we delivered exceptionally strong results. Anticipating that the food industry would remain growth-challenged for some time, we built a business model that can deliver attractive shareholder returns, despite this headwind, and this approach has served us well. Below are the most noteworthy highlights of the year.
composite of our categories—something we have done in three of the last four years
productivity
Wish-Bone business, accelerating our
Net Sales
North America Retail(2)
Gross Profit
% Net Sales
Operating Income (EBIT)
% Net Sales
Net Earnings
Diluted EPS
Diluted Shares Outstanding
2013 Highlights
+0.6%
+2.1%
+8.0%
+12.0%
+40.8%
+41.4%
-0.6%
+1.0%
+6.7%
+190 bps
+10.1%
+150 bps
+38.6%
+38.9%
Change Change (ex 53rd Week(1))
$2,479
$2,082
$623
25.1%
$347
14.0%
$132
$1.13
117.4
2012
$2,464
$2,102
$665
27.0%
$382
15.5%
$183
$1.57
116.6
2013
(Pro Forma Adjusted Basis*)
In millions, except per share
EXECUTIVE MANAGEMENT TEAM
Tony Fernandez, Mark Schiller, Mary Beth DeNooyer, Craig Steeneck, Bob Gamgort, Chris Slager, Kelley Maggs and Chris Boever
Antonio F. FernandezExecutive Vice President and Chief Supply Chain Officer
M. Kelley MaggsExecutive Vice President, Secretary and General Counsel
Mark L. SchillerExecutive Vice President and Division President Birds Eye Frozen Division
Christopher SlagerExecutive Vice President and Division President Duncan Hines Grocery Division
Craig D. SteeneckExecutive Vice President and Chief Financial Officer
Robert J. GamgortChief Executive Officer
Christopher J. BoeverExecutive Vice President and Chief Customer Officer
Mary Beth DeNooyerExecutive Vice President and Chief Human Resources Officer
87886_InsideCover.indd 187886_InsideCover.indd 1 5/1/14 3:12 PM5/1/14 3:12 PM