Embed Size (px)
Citation preview

Sundaram Finance Limited6 6 t h A n n u a l R e p o r t
2 0 1 8 - 1 9

Sundaram Finance LimitedNo.21, Patullos Road, Chennai - 600 002, India.
www.sundaramfinance.in
Sundaram Finance LimitedNo.21, Patullos Road, Chennai - 600 002, India.
www.sundaramfinance.in

Annual Report2018-191
Board of Directors S Viji Chairman S Ram P N Venkatachalam S Mahalingam S Prasad S Ravindran Rajiv C Lochan Shobhana Ramachandhran R Raghuttama Rao T T Srinivasaraghavan Managing Director Harsha Viji Deputy Managing Director A N Raju Director (Operations)
Audit Committee S Prasad Chairman S. Ravindran Shobhana Ramachandhran
Stakeholders Relationship Committee S Prasad Chairman T T Srinivasaraghavan A N Raju
Nomination, Compensation & P N Venkatachalam ChairmanRemuneration Committee S Prasad S Ravindran
Corporate Social Responsibility Shobhana Ramachandhran Chairman Committee S Ravindran T T Srinivasaraghavan
Risk Management Committee T T Srinivasaraghavan Chairman Srinivas Acharya Harsha Viji A N Raju M Ramaswamy
Asset Liability Management Committee T T Srinivasaraghavan Chairman Srinivas Acharya Harsha Viji A N Raju M Ramaswamy
Information Technology Strategy Committee S Mahalingam Chairman P N Venkatachalam Rajiv C Lochan T T Srinivasaraghavan A N Raju V Ananthanarayanan
Chief Financial Officer M Ramaswamy
Secretary & Compliance Officer P Viswanathan
Registered Office 21, Patullos Road, Chennai - 600 002 Tel: 044 2852 1181, Fax: 044 2858 6641 Email:[email protected]•Website:www.sundaramfinance.in
CIN L65191TN1954PLC002429
Auditors M/s. Sundaram & Srinivasan, Chartered Accountants 23, C.P. Ramaswamy Road, Alwarpet, Chennai 600 018
Information Security Assurance Services M/s. C.V. Ramaswamy & Co., Office No. 1, Vidwan Sundaram Street, Nungambakkam, Chennai 600 034

Sundaram Finance Limited
2
Management Team S Ravindran Senior Vice President & Head - Credit Control and Processing Dept.
S Srinivasan Senior Vice President & Head - Corporate Finance
MJKulkarni NationalHead-MH&CEandHead-West
K Sankarakumar Senior Vice President & Head - Distribution
D Ravindran Senior Vice President - Sundaram Infotech Solutions
S Sivakumar Vice President & Head - Administration & Corporate Communications
S Sridhar Vice President & Head - Treasury
RajeshVenkat DeputyRegionHead-West
V Ananthanarayanan Chief Information Officer
N Ramachandran National Head - Auto & Head - North
Deepa Ramesh Vice President & Head - Sundaram Infotech
H Venkatesan Senior General Manager & Head - Group Internal Audit
C Balasubramanian Senior General Manager - Operations
Venkatesh Kumaraswami Senior General Manager & Head - Deposits
S Balasubramanian Senior General Manager & Head - Andhra Region
G Vaikuntam Senior General Manager & Head - Recoveries & ARC
V Soundararajan Mentor - Tamil Nadu
C Muralidharan Senior General Manager & Head - Karnataka
GanesanAK SeniorGeneralManager&Head-TN-West
Sridharan R Senior General Manager & Head - Indirect Taxation
Balachander Gopinath Senior General Manager & Head - East
Sri Raman N National Head - Fleet Cards
Rajesh Srinivas P National Head - SME & Emerging Corporates
Sekar R Head - Human Resources
CURRENCY EQUIVALENTS
`One Million = `10 Lakhs US$ 1 = Indian `69.1713*
`One Billion = `100 Crores or *FBIL Reference Rate as on 31.03.2019
`10,000 Lakhs
Subsidiaries Sundaram BNP Paribas Home Finance Limited Sundaram Trustee Company Limited
Sundaram Asset Management Company Limited LGF Services Limited
Sundaram Asset Management Singapore Pte. Limited Sundaram BNP Paribas Fund Services Limited
Sundaram Alternate Assets Limited
Bankers State Bank of India ICICI Bank Ltd
Bank of India Axis Bank Ltd.
Canara Bank Federal Bank Ltd. Indian Bank The Hongkong and Shanghai Banking Corporation Ltd. Bank of Baroda Standard Chartered Bank
HDFC Bank Ltd. BNP Paribas
Debenture Trustee IDBI Trusteeship Services Limited
Asian Building, Ground Floor, 17, R. Kamani Marg, Ballard Estate, Mumbai – 400001

Annual Report2018-193
Contents
Board's Report 4
Corporate Governance Report 16
Report on CSR Activities 33
Business Responsibility Report 35
Secretarial Audit Report 41
Disclosure on Directors / KMP Remuneration (Rule 5) 45
Disclosure on Stock Options 47
Extract of Annual Return 48
Financial Highlights 69
Independent Auditors' Report 70
Balance Sheet 80
Statement of Profit and Loss 81
Cash Flow Statement 83
Notes to the Accounts 85
Consolidated Financial Statements Balance Sheet 150
Statement of Profit and Loss 151
Cash Flow Statement 154
Notes to the Accounts 156
Independent Auditors' Report 214
Statement in Form AOC-1 relating to 223 Subsidiaries / Associates / Joint Ventures

Sundaram Finance Limited
4
Board’s Report
Your directors have pleasure in presenting the 66th Annual Report together with audited accounts for the year ended
31st March 2019. The summarised financial results of the Company are presented hereunder:
FINANCIAL RESULTS: STANDALONE(` in cr.)
ParticularsYear ended
March 31, 2019Year ended
March 31, 2018
Revenue from Operations 3397.61 2806.27
Other Income 20.56 49.13
Total Revenue 3418.17 2855.40
Less: Total Expenses 2522.89 2005.69
Profit before exceptional items and tax 895.28 849.71
Add: Exceptional item 592.43 –
Profit before tax 1487.71 849.71
Profit after Tax 1126.31 563.44
Other Comprehensive Income * (4.02) (1.51)
Surplus brought forward 767.20 636.85
Amount available for appropriation 1889.49 1198.78
Appropriations to:
- Statutory Reserve 225.26 106.59
- General Reserve 997.30 243.39
Dividend – Final 2016-17 – 72.22
Interim 2017-18 55.55 –
Final 2017-18 77.77 –
Interim 2018-19 55.55 –
Dividend Tax 33.30 9.38
Surplus carried to balance sheet 444.76 767.20
* Remeasurement of (loss)/gain (net) on defined plans, recognised as a part of retained earnings.

Annual Report2018-195
Your Company has, for the first time, adopted Indian
Accounting Standards (IND AS) notified under Section
133 of Companies Act, 2013, read with Companies (Indian
Accounting Standards) Rules 2015 from 1st April 2018 and
the effective date such transition is 1st April 2017. The impact
of the transition has been recorded in the opening reserves
as at 1st April 2017.
CORPORATE GOVERNANCE
A detailed report on corporate governance, together with a
certificate from the Statutory Auditors, in compliance with the
relevant provisions of SEBI (Listing Obligations and Disclosure
Requirements), Regulations 2015, is attached as part of this
report, vide Annexure II.
Compliance reports in respect of all laws applicable to the
Company have been reviewed by the Board of Directors.
RELATED PARTY TRANSACTIONS
All transactions entered into by the Company with related
parties were in the ordinary course of business and on an
arm’s length basis. The Company did not enter into any
material transaction with such related parties, under Section
188 of the Companies Act, 2013, during the year. Form AOC-2,
as required under Section 134 (3) (h) of the Act, read with
Rule 8 (2) of the Companies (Accounts) Rules 2014, is
PAT (` in cr.)
477.00495.35
563.95
604.05*
FY 2015-16 2016-17 2017-18 2018-19
EPS (`) 42.96 44.58 50.71 54.37
*excludes Exceptional Profit of `522.26 cr.
Dividend (` in cr.)
127.77133.32
194.43
122.21
FY 2015-16 2016-17 2017-18 2018-19
% 110 115 120 175*
*includes Special Dividend - 50%
DIVIDEND
Your Company paid an interim dividend of `5/- per share in
February 2019. Your directors are pleased to recommend
a final dividend of `7.50/- per share, which, together with
the interim dividend, would aggregate to a total dividend
of `12.50/- per share (125% on the face value of `10/-).
In addition, your directors are pleased to recommend a
special dividend of `5/-per share (50% on the face value
of `10/-).
The Dividend Distribution Policy, formulated in accordance
with the provisions of Regulation 43A of the SEBI (Listing
Obligations and Disclosure Requirements) Regulations, 2015,
is attached as part of this report, vide Annexure I.

Sundaram Finance Limited
6
attached as part of this report, vide Annexure III (i). Further,
the Company’s policy on Related Party Transactions is attached
as part of this report, vide Annexure III (ii).
The Company did not enter into any transactions with any
person or entity belonging to the promoter or promoter group
and holding 10% or more shareholding in the Company.
CORPORATE SOCIAL RESPONSIBILITY (CSR)
Your Company, along with its subsidiaries and associates, has
always responded in a responsible manner to the growing
needs of the communities in which it operates. During the year,
your Company has, in consonance with the CSR policy of the
Company, undertaken a number of initiatives that contribute to
society at large, in the areas of health, education, environment
and preservation of the country’s rich culture and heritage.
The Annual Report on CSR Activities undertaken by the
Company for the Financial Year 2018-19, is annexed with this
report, vide Annexure IV.
BUSINESS RESPONSIBILITY REPORT
A Business Responsibility Report as required under Regulation
34(2) (f) of the SEBI (Listing Obligations and Disclosure
Requirements), Regulations 2015, is enclosed as part of this
report, vide Annexure V.
DISCLOSURE UNDER THE ‘PREVENTION OF
SEXUAL HARASSMENT AT WORKPLACE POLICY’
The Company has in place a Policy for prevention of Sexual
Harassment, in line with the requirements of The Sexual
Harassment of Women at theWorkplace (Prevention,
Prohibition & Redressal) Act, 2013. An Internal Complaints
Committee (ICC) has been set up to redress complaints. All
employees (permanent, contractual, temporary, trainees)
are covered under this policy. No complaints were received
during the financial year. None was pending unresolved as
on 31st March 2019.
SECRETARIAL AUDIT
In terms of Section 204 of the Companies Act, 2013
and the rules thereunder, the Company has appointed
M/s Damodaran & Associates, Practising Company Secretaries,
as the Secretarial Auditor of the Company. The Secretarial
Audit Report as provided by them is annexed to this Report,
vide Annexure VI.
REMUNERATION TO DIRECTORS /
KEY MANAGEMENT PERSONNEL
Disclosure pursuant to Rule 5 (1) of Companies (Appointment
and Remuneration of Managerial Personnel) Rules, 2014 is
annexed, vide Annexure VII.
SUNDARAM FINANCE EMPLOYEE STOCK OPTION
SCHEME
Based on the recommendations of the Nomination,
Compensation and Remuneration Committee, your Board of
Directors has granted, subject to regulatory approvals where
necessary, 18750 stock options to select eligible employees,
on 30th May 2019. The disclosure required under SEBI (Share
Based Employee Benefits) Regulations, 2014 is furnished,
vide Annexure VIII.
EXTRACT OF ANNUAL RETURN
As required under Section 92 (3) of the Companies Act,
2013 and Rule 12 (1) of the Companies (Management and
Administration) Rules, 2014, an extract of the Annual Return
in MGT-9 is annexed as part of this report, vide Annexure IX.
DETAILS OF SIGNIFICANT AND MATERIAL
ORDERS PASSED BY THE REGULATORS
During the year under review, no significant and material
orders were passed by the regulators, courts or tribunals
against the Company, impacting its going concern status or
its future operations.

Annual Report2018-197
Foreign Direct Investment flows continued to be encouraging
and India's foreign exchange reserves stood at USD 412 billion
at the end of March 2019 as compared to USD 424 billion
at the end of the previous year, as per RBI data. The Current
account deficit (CAD) was higher at 2.6% as against 2.0%
in the previous year, reflecting a lower growth in exports as
also the effects of higher crude oil prices. The gross fiscal
deficit came down marginally, to 3.4% for the period April
2018 to February 2019, as compared to 3.6% for the year
2017-18. The Rupee depreciated, ending the year at `69.20
totheDollar.AccordingtotheWorldBank'sEaseofDoing
Business Report, India has improved its global ranking by
several notches, from 142 to 77 in the last five years.
Almost two years have elapsed since the introduction of The
GoodsandServicesTax(GST).Whiletheoperationalissues
in implementation are being addressed, movement of goods
across the country has become easier thanks to the abolition
of check posts and introduction of e-way billing, making for
faster movement of goods across the country, thus creating a
seamless national market.
Despite strong economic fundamentals, capital markets
remained volatile though the NIFTY grew 14% during the year.
Interest rates also fluctuated but the 10-year G-Sec ended the
year roughly where it began, at 7.35%. Overall bank credit
is reported to have grown at 12.3% in FY19, but industrial
credit grew by only 7% and small and medium enterprises
even lower.
The NBFC sector and the wider financial markets witnessed
considerable turbulence with the default of AAA rated IL&FS
in August 2018. This was followed by a few more downgrades
of NBFCs and Housing finance companies, as a result of which
lending to the NBFC sector, particularly smaller players, was
severelyconstricted.Withaviewtopartiallymitigatethis,RBI
announced a relaxation in the securitisation norms, whereby
the asset seasoning requirement was reduced from 12 to 6
months, thus enabling easier access to funds. This led to a
INFORMATION AS PER SECTION 134 (3) (m) OF
THE COMPANIES ACT, 2013 READ WITH RULE 8
OF THE COMPANIES (ACCOUNTS) RULES, 2014
Your company has no activity relating to conservation of energy
or technology absorption. During 2018-19, expenditure in
foreign currencies amounted to `83.57 cr. foreign currency
earnings amounted to `244.38 lakhs.
MANAGEMENT DISCUSSION AND ANALYSIS
GLOBAL ECONOMY
The International Monetary Fund (IMF) has cautioned that
“following a broad-based upswing in cyclical growth that
lasted nearly two years, the global economic expansion
decelerated in the second half of 2018. Activity softened amid
an increase in trade tensions and tariff hikes between the
United States and China, a decline in business confidence,
a tightening of financial conditions, and higher policy
uncertainty across many economies. Against this global
backdrop, a combination of country and sector specific factors
further reduced momentum. After peaking at close to 4% in
2017, global growth remained strong, at 3.8% in the first half
of 2018, but dropped to 3.2% in the second half of the year.”
The IMFs growth forecast for 2019 is 3.3%.
INDIAN ECONOMY
India’s GDP has averaged 7.5% over the last five years,
indicating a near normal growth and making it one of the
fastest growing major economies in the world. However, it is
estimated to have slowed down to about 7% during 2018-19,
as against the original projection of 7.2%.
Tax collections for the period ended 2018-19 marked an
increase of 18.3% over the previous year, but were well below
the targeted collections for the year. Prices largely remained
undercontrol.WhiletheaverageWPIinflationfor2018-19
was at 4.3% (an increase from 2.9% in the previous year),
headline inflation, based on the Consumer Price Index for
2018-19, came in at 3.4% (compared to 3.6% in 2017-18),
helped by softer food inflation.
Sundaram Finance Limited
8
dramatic increase in securitisation volumes, which more
than doubled to 1.90 lakh crores for the year. However, the
cost of funds for the NBFC sector witnessed a sharp increase,
reflecting the liquidity situation as well as the heightened risk
perception of lenders.
Thanks to the prudent financial practices followed by your
Company and a robust Asset Liability Management framework,
your company continues to enjoy the confidence of its lenders
and was therefore able to withstand market pressures without
any dislocation to its business, during the second half of
2018-19.
AUTOMOTIVE SECTOR
2018-19 was a difficult year for the automotive industry. Festive
season demand which is one of the key drivers of vehicle
sales was lacklustre, at best. Natural calamities in two of the
Southern states also acted as a dampener. Increasing fuel
prices, withdrawal of several NBFCs from the market, revised
axle load norms and buyer fatigue are some of the reasons
attributed to the overall slowing down in the automotive sector.
The M&HCV segment which witnessed very strong growth
during the first half of the financial year saw a complete
reversal of fortunes in the second half, with volumes dropping
dramatically month after month, ending with an overall growth
of 10% for the year. Passenger car/SUV sales registered a
meagre 3% growth over the previous year.
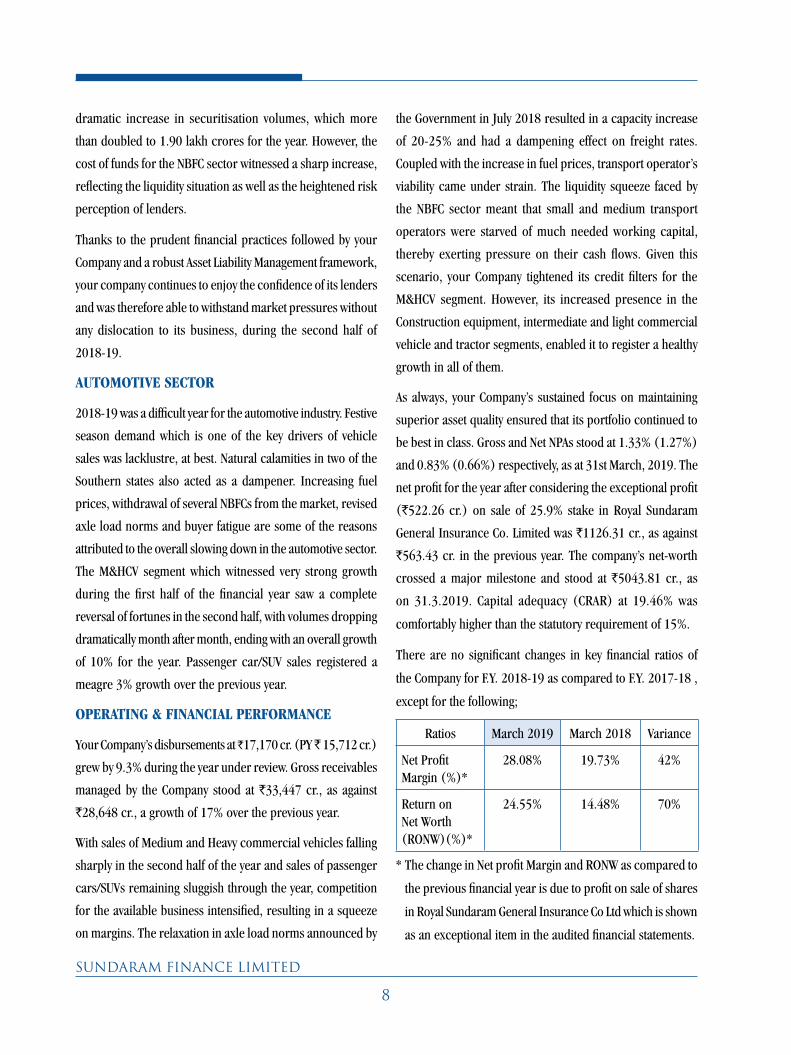
OPERATING & FINANCIAL PERFORMANCE
Your Company’s disbursements at ̀ 17,170 cr. (PY ̀ 15,712 cr.)
grew by 9.3% during the year under review. Gross receivables
managed by the Company stood at `33,447 cr., as against
`28,648 cr., a growth of 17% over the previous year.
WithsalesofMediumandHeavycommercialvehiclesfalling
sharply in the second half of the year and sales of passenger
cars/SUVs remaining sluggish through the year, competition
for the available business intensified, resulting in a squeeze
on margins. The relaxation in axle load norms announced by
the Government in July 2018 resulted in a capacity increase
of 20-25% and had a dampening effect on freight rates.
Coupled with the increase in fuel prices, transport operator’s
viability came under strain. The liquidity squeeze faced by
the NBFC sector meant that small and medium transport
operators were starved of much needed working capital,
thereby exerting pressure on their cash flows. Given this
scenario, your Company tightened its credit filters for the
M&HCV segment. However, its increased presence in the
Construction equipment, intermediate and light commercial
vehicle and tractor segments, enabled it to register a healthy
growth in all of them.
As always, your Company’s sustained focus on maintaining
superior asset quality ensured that its portfolio continued to
be best in class. Gross and Net NPAs stood at 1.33% (1.27%)
and 0.83% (0.66%) respectively, as at 31st March, 2019. The
net profit for the year after considering the exceptional profit
(`522.26 cr.) on sale of 25.9% stake in Royal Sundaram
General Insurance Co. Limited was `1126.31 cr., as against
`563.43 cr. in the previous year. The company’s net-worth
crossed a major milestone and stood at `5043.81 cr., as
on 31.3.2019. Capital adequacy (CRAR) at 19.46% was
comfortably higher than the statutory requirement of 15%.
There are no significant changes in key financial ratios of
the Company for F.Y. 2018-19 as compared to F.Y. 2017-18 ,
except for the following;
Ratios March 2019 March 2018 Variance
Net Profit Margin (%)*
28.08% 19.73% 42%
Return on NetWorth (RONW)(%)*
24.55% 14.48% 70%
*ThechangeinNetprofitMarginandRONWascomparedto
the previous financial year is due to profit on sale of shares
in Royal Sundaram General Insurance Co Ltd which is shown
as an exceptional item in the audited financial statements.

Annual Report2018-199
Disbursement and Receivables Under Management
(` in cr.)
Disbursements Receivables Under Management
2015-16 2016-17 2017-18 2018-19
1144413218
1571217170
20699
24036
28648
33447
RESOURCE MOBILISATION
a) Deposits
During the year, your Company mobilised fresh deposits
aggregating to `701.52 cr. Renewal of deposits during the
year amounted to `980.71 cr, representing 85% of the
matured deposits of ̀ 1150.27 cr. Deposits outstanding at the
year-end were at `2975.16 cr. as against `2499.32 cr in the
previous year. Your Company’s Deposit Balance crossed
the `3,000 cr. mark during the second week of April
2019. The Net accretion for the financial year was `475.84
Cr being the highest ever in the history of your Company. As at
31st March 2019, 3452 deposits amounting to ̀ 31.11 Cr. had
matured for payment and were due to be claimed or renewed.
After close follow-up, these figures are currently 2216 and
`15.17 Cr. respectively. Continuous efforts are being made to
arrange for repayment or renewal of these deposits. There
has been no default in repayment of deposits or payment
of interest thereon during the year. Bureau Veritas (India)
Private Limited has conferred accreditation for the Company’s
Deposits to the revised ISO 9001:2015 Standard.
b) Term Funding
During the year, your Company raised term funding from
Banks, Mutual funds, Insurance companies and others in the
form of non-convertible debentures and term loans to the tune
of `7014 cr., across various tenors.
c) Bank Finance
As part of the overall funding plan, your Company’s working
capital limits with Consortium banks were increased from
`2750 cr. to `3000 cr. During the year, your Company also
issued several tranches of commercial paper aggregating to
`12498 cr. The maximum amount outstanding at any time
was `5250 cr. and the amount outstanding at the end of the
year was `1800 cr.
Own Funds (` in cr.)
3313
3746
5044
4134
March 2016 March 2017 March 2018 March 2019
Book Value (`)
298.16 337.13 372.09 453.96

Sundaram Finance Limited
10
d) Assets Securitised / Assigned
During the year, your Company raised resources to the
extent of `3236 cr. through securitisation and assignment
of receivables.
CREDIT RATINGS
Your Company’s long term credit ratings have been retained
at “AAA”, (Highest Degree of Safety) with a “Stable Outlook”
by both ICRA & CRISIL. The short term borrowings (including
commercial paper) are rated “A1+” (very strong degree of
safety) by both ICRA and CRISIL. Fixed Deposits are rated
“AAA” (Highest Credit Quality) by ICRA and CRISIL.
OUTLOOK
Most economic indicators seem to indicate a slowing growth
momentum. Commercial vehicle and Passenger car / SUV have
fallen sharply in April 2019 by 14% and 17% respectively.
Vehicle sales growth has been feeble for nearly nine months
now, for reasons articulated earlier. February saw the IIP
growth drop to a twenty month low of 0.01% (y-o-y). The PMI
manufacturing index slipped to an eight month low, while the
services sector PMI also declined to a six month low.
As per the Society of Indian Automotive Manufacturers (SIAM),
M&HCV sales are estimated to grow at a mere 5% and LCVs
at9%-10%,in2019-20.WiththenewBSVIemissionnorms
slated for implementation, effective April 1 2020, predictions
of significant pre-buying, ahead of the BS VI rollout, countered
by the excess capacity argument, have lent an air of uncertainty
to how the market participants would respond. Sales of
passenger vehicles (Cars and SUVs) are projected to grow at
3%-5%. Tractor sales are expected to moderate after three
or four years of strong growth. No doubt, the behaviour of
the Southwest monsoon will have an important bearing not
only on tractor sales, but also on the overall prosperity and
well-being of rural India, which in turn will influence overall
rural spending.
With the new Government in place, it is reasonably
expected that the thrust on infrastructure would continue.
Additionally, private sector investments which were subdued
for the past few years are expected to pick up. However, the
uncertainties surrounding market liquidity, interest rates,
imminent introduction of the BS VI emission norms, and
global oil prices, render forecasts difficult. Most economic
commentaries seem to point to a challenging year ahead
for the economy in general and the automotive sector in
particular.
Your Company has taken these factors into account in
drawing up its plans for the year, without losing sight of its
core markets and segments. Rising interest rates in light of
the tight liquidity and intensifying competition are likely to
exert further pressure on margins. Your company expects to
manage this through financing an appropriate mix of higher
and lower yielding assets, while ensuring that asset quality
continues to remain best in class.
INTERNAL FINANCIAL CONTROLS
The Company has a well established internal financial control
and risk management framework, with appropriate policies
and procedures, to ensure the highest standards of integrity
and transparency in its operations and a strong corporate
governance structure, while maintaining excellence in services
to all its stakeholders. Appropriate controls are in place to
ensure: (a) the orderly and efficient conduct of business,
including adherence to policies (b) safeguarding of assets
(c) prevention and detection of frauds/errors (d) accuracy
and completeness of the accounting records and (e) timely
preparation of reliable financial information.
RISK MANAGEMENT
Your Company has built a robust risk management framework
over the years. Engaged, as it is, in retail financing, the

Annual Report2018-1911
Company has to manage various risks, including credit risk,
liquidity risk, interest rate risk and operational risk. The Risk
Management Committee and the Asset Liability Management
Committee review and monitor these risks on a regular basis.
The Company manages credit risk through stringent credit
norms established through several decades of experience in
retail lending and continues to follow the time tested practice
of personally assessing every borrower, before committing to
a credit exposure. The Company monitors ALM on an ongoing
basis to mitigate liquidity risk, while interest rate risks arising
out of maturity mismatch of assets and liabilities are managed
through regular monitoring of the maturity profiles. The
Company also measures the interest rate risk by the duration
gap method.
Operational risks arising from inadequate or failed internal
processes, people and systems or from external events are
adequately addressed by the internal control systems. These
systems are continuously reviewed, monitored and modified,
as necessary. A stable and experienced management team
provides much needed continuity and expertise in managing
the dynamic changes in the market environment. The company
has well documented standard operating procedures for all
processes to ensure better control over transaction processing
and regulatory compliance and periodical review of the same
ensures that the risk of obsolescence is avoided.
INTERNAL AUDIT
As part of its efforts to evaluate the effectiveness of the internal
control systems, your Company’s internal audit department
independently evaluates the adequacy of control measures
on a periodic basis and recommends improvements,
wherever appropriate. The Internal Audit team plays a vital
role in continuously monitoring the effectiveness of the
Standard Operating Procedures and makes extensive use of
software and analytical tools which enables effective offsite
monitoring.
The internal audit department is manned by highly qualified
and experienced personnel and reports directly to the Audit
Committee of the Board. The Audit Committee regularly
reviews the audit findings as well as the adequacy and
effectiveness of the internal control measures.
Additionally, an Information Security Assurance Service is
also provided by independent external professionals. Based
on their recommendations, the Company has implemented a
number of control measures both in operational and IT related
areas, apart from information security related measures.
HUMAN RESOURCES
In an environment that is rapidly becoming technology and
digital oriented, your Company continues to invest in long
term people development, for organisational excellence.
Part of the enduring Sundaram Finance tradition, over the
decades,hasbeenouradherencetothe‘SundaramWay’-the
value system that has formed the bedrock of the Company,
and the percolation of these values to successive generations
of employees. For talent development, we have a healthy mix
of learning programmes addressing both domain knowledge
and soft skills. During the year, 30% of programmes were
for domain knowledge and 70% in the area of soft skills,
involving 3312 man hours of learning. The Sundaram Finance
Centre of Excellence (CoE) launched in 2016-17, with a view
to effectively leverage technology to accelerate the pace of
institutional knowledge transfer across the Sundaram Finance
landscape, has grown by leaps and bounds. The response
has been very enthusiastic and over 2500 employees have
participated in various modules of the CoE during the year. The
increase in penetration of CoE has meant that the percentage
of Facilitator led Domain Knowledge training programmes for
senior managers has come down.
INFORMATION TECHNOLOGY
The IT Strategy Committee of the Company has laid
down a comprehensive policy relating to Cyber Security,

Sundaram Finance Limited
12
Business Continuity, Outsourcing and Information Security /
Technology, in line with its terms of reference.
Your Company has a State of the Art Data Centre catering
not only to its own needs but also those of its subsidiaries
and associates, with a capacity of over 300 servers, managed
by professionals providing 24/7 support, with over 99.99%
uptime. The Data Centre is accredited for ISO/IEC 27001:2013
by TUV Rheinland for Information Security Management
System. The Disaster Recovery Site for all critical applications
is hosted at a separate facility located in a different seismic
zone, with near real-time data replication. Your company has
implemented various protocols for managing Information and
Cyber security across the organization. In its continuous efforts
to ensure a secure environment, your Company has built a
robust infrastructure and carries out periodic comprehensive
vulnerability assessments and penetration testing, to identify
and minimize external threats.
The internal IT Team has mastered a complex landscape of
current technologies, marketing approaches, and operational
capabilities to cater to the various business applications within
the Company. Of special significance is their contribution
to the complex task of transitioning to the IND AS regimen.
Digital services and operations are raising the competitive
bar in every sector. Your Company’s digital strategy is driven
by the twin objectives of enriching our employee’s jobs on
the one hand, while enhancing the customer experience, on
the other. Our digital initiatives address these very objectives,
by enhancing our speed of response to our customers and
providing them a host of digital options to interact and transact
with us, and a number of productivity enhancements through
process automation which free up our people to deliver the
unique‘SundaramExperience’toourcustomers.Wearea
relationship centric business and have consciously adopted
digital, to augment these relationships and be digitally
available for our customers, as and when they need us.
CONSOLIDATED FINANCIAL STATEMENTS
In accordance with the provisions of Section 129 (3) of the
Companies Act, 2013, the Consolidated Financial Statements,
drawn up in accordance with the applicable Accounting
Standards, form part of the Annual Report. A separate
statement containing the salient features of the financial
statements of Subsidiaries and Associates in Form AOC-I forms
part of the Annual Report.
The Consolidated profit after tax is `1160.85 cr. as against
`729.91 cr. of the previous year. The total comprehensive
income for the year was `1012.79 cr. as against `877.87 cr.
The annual accounts of all the Subsidiary Companies have been
posted on your Company’s website – www.sundaramfinance.in.
Detailed information, including the annual accounts of the
Subsidiary Companies will be available for inspection by the
members, at the registered office of the Company and will also
be made available to the members upon request.
SUBSIDIARIES
• Sundaram Finance Holdings Limited
Your Company, along with its promoters, holds 53.34% in
Sundaram Finance Holdings Limited and hence the latter
is treated, under the applicable Accounting Standards, as
subsidiary for consolidation purposes. Sundaram Finance
Holdings Limited reported a gross income of `120.71 cr.
as against `75.59 cr. in the previous year. Profit after tax
was ̀ 84.93 as compared to ̀ 54.40 cr in the previous year.
• SundaramAssetManagementCompanyLimited
The Company reported a gross income of `270.43 cr. as
against ̀ 328.73 cr. in the previous year. Profit after tax was
`19.86 cr. as compared to ̀ 27.46 cr. during the previous
year. The Average Assets under Management amounted to
`31,933 cr. for the year 2018-19 as compared to ̀ 34,164 cr.

Annual Report2018-1913
in the previous year. The company recommended a
dividend of `7.50 per share for the year, on the paid-up
equity capital of `20 cr.
• SundaramTrusteeCompanyLimited
Sundaram Trustee Company Limited earned a gross
income of `1.55 cr., as against `1.56 cr., in the previous
year and reported a profit after tax of `0.80 cr. for the
year, as against ̀ 0.85 cr. in the previous year. The company
recommended a dividend of `120 per share for the year.
• LGFServicesLimited
During the year, the Company reported a gross income
of `0.38 cr. as against `1.90 cr. in the previous year. The
profit after tax for the year was ̀ 0.25 cr. as against ̀ 0.34 cr.
in the previous year. The company proposed a dividend
of `6 per/- share for the year.
JOINT VENTURE
• SundaramBNPParibasHomeFinanceLimited
The company approved loans aggregating to `2672 cr.
(Previous year `2993 cr.). Disbursements during the
year were lower by 7%, at `2449 cr. (PY `2626 cr.).
The company earned a gross income of `1006.27 cr.
(PY `934.58 cr.) and reported a profit after tax at
`145.48 cr. (PY `144.42 cr.). The loan portfolio under
management as at 31st March 2019 stood at `9041 cr.
as against `8336 cr. in the previous year. The gross
and net NPA stood at 2.95% and 1.39% respectively as
of 31.03.2019. The company proposed a dividend of
`3.50 per share for the year (PY 35%).
• RoyalSundaramGeneralInsuranceCo.Limited (Royal Sundaram)
During the year, your Company sold 11,62,91,000 equity
shares of Royal Sundaram, representing 25.90%, to
Ageas Insurance International N.V., Belgium, for a total
consideration of `984.17 cr., reducing your Company’s
shareholding in Royal Sundaram from 75.90% to 50%.
Consequently, Royal Sundaram has become a joint venture.
Royal Sundaram reported a robust increase of 21% in
GrossWrittenPremium(GWP)at̀ 3196 cr. as compared
to `2643 cr. in the previous year. Profit after tax for the
year was `121 cr., as against `83 cr. in the previous year.
• SundaramBNPParibasFundServices Limited
Sundaram BNP Paribas Fund Services Limited earned
an income of `35.25 cr. during the year. The company
reported loss after tax at `8.68 cr. during the year as
against `0.15 cr. in the previous year.
BOARD & AUDIT COMMITTEE
The details regarding number of board meetings held during
the financial year and composition of Audit Committee are
furnished in the Corporate Governance Report.
DIRECTORS
Sri N. Venkataramani, Independent Director of your Company
since 2010, relinquished his directorship after completion of
his first term as Independent Director under the Companies
Act, 2013 on 31st March 2019. Your directors place on record
the significant contribution made by him to the deliberations
of the Board for nearly ten years.
Sri R Raghuttama Rao was co-opted as an Additional Director
on the Board in independent capacity for a term of five (5)
consecutive years with effect from 1st April 2019 and holds
office as Additional Director up to the date of the ensuing
Annual General Meeting. The Company has received due
notice from a member proposing the appointment of
Sri R Raghuttama Rao as Independent Director of the
Company.

Sundaram Finance Limited
14
Sri S. Ravindran and Sri T.T. Srinivasaraghavan, Directors
retire by rotation and being eligible, offer themselves for
re-election.
DECLARATION BY INDEPENDENT DIRECTORS
The Company has received necessary declaration from each
Independent Director of the Company under Section 149 (7)
of the Companies Act, 2013 that the Independent Directors
of the Company meet with the criteria of their Independence
laid down in Section 149 (6).
ANNUAL EVALUATION BY THE BOARD
The Board has made a formal evaluation of its own
performance and that of its committees and individual
directors as required under Section 134(3)(p) of the
Companies Act, 2013.
DIRECTORS' RESPONSIBILITY STATEMENT
Your directors confirm that:
1. In the preparation of the annual accounts, the applicable
accounting standards have been followed along with
proper explanation relating to material departures;
2. The Company has selected such accounting policies
and applied them consistently and made judgments and
estimates that are reasonable and prudent so as to give
a true and fair view of the state of affairs of the company
at the end of the financial year and of the profit of the
company for that period;
3. Proper and sufficient care has been exercised for
the maintenance of adequate accounting records in
accordance with the provisions of the Companies
Act, 2013 for safeguarding the assets of the company
and for preventing and detecting fraud and other
irregularities;
4. The annual accounts have been prepared on a going
concern basis;
5. Adequate internal financial controls have been put in place
and they are operating effectively; and
6. Proper systems have been devised to ensure compliance
with the provisions of all applicable laws and that such
systems are adequate and operating effectively.
AUDITORS
M/S Sundaram & Srinivasan Chartered Accountants, Chennai,
have been appointed as Statutory Auditors of your Company,
to hold office for a term of five (5) consecutive years from
the conclusion of the 64th Annual General Meeting until
the conclusion of the 69th Annual General Meeting at such
remuneration as may be mutually agreed between the Board
of Directors of the Company and the Statutory Auditors.
ACKNOWLEDGEMENT
Your directors gratefully acknowledge the support and
co-operation extended to your Company by all its customers,
depositors, shareholders and bankers, as also the various
mutual funds, insurance companies, automotive manufacturers
and dealers.
Your directors also place on record their special appreciation
of Team Sundaram for their dedication and commitment in
delivering the highest quality of service to every one of our
valued customers.
For and on behalf of the Board
Chennai 600 002 S VIJI 30.05.2019 Chairman

Annual Report2018-1915
Annexure - I
SFL Policy for Distribution of Dividends[Pursuant to Regulation 43A of the SEBI (Listing Obligations and Disclosure Requirements) Regulations, 2015]
The SFL Policy (the Policy) for Distribution of Dividends shall come into effect from the date it is approved by the Board of Directors.
The Policy is being framed in compliance with the requirement stipulated under Regulation 43A of the SEBI (Listing Obligations and
Disclosure Requirements) Regulations, 2015 (Listing Regulations) for distribution of dividends, based on the following parameters:
1. The Board of Directors may declare one or more interim dividends after considering various financial and other parameters.
The Board may recommend final dividend after approval of the final audited accounts.
2. Dividends shall generally be declared out of the annual standalone Profit After Tax of the Company relating to the current financial
year, subject to any other regulatory provisions that may be introduced from time to time.
3. The Board will generally endeavour to maintain a dividend payout ratio (including dividend distribution tax) of 20% – 30% of the
annual standalone profit after tax for each financial year.
4. The factors, internal and external, to be considered by the Board, for determining the quantum of dividend, will include the following:
(a) Internal Factors
• Growthinvolumeofbusiness
• Qualityofassets
• Profitabilityposition
• Stabilityofearnings
• CarriedforwardbalanceinP&Laccount
• Accumulatedreserves
(b) External Factors
• Macro-economicenvironment
• Performanceoftheautomotivesector
• Changesingovernmentalpolicies
• Regulatorychanges
5. The retained earnings of the Company may be used, inter alia, for one or more of the following purposes:
(i) Growth plans;
(ii) Capital expenditure;
(iii) Workingcapitalrequirements;
(iv) Capitalisation;
(v) Investment in new lines of business and / or additional investment in existing lines of business;
(vi) Repayment of debt;
(vii) Meeting contingency plans; and
(viii) Any other purpose as may be permitted by law.
The Board may consider utilising the retained earnings for declaration of dividend under special circumstances.

Sundaram Finance Limited
16
Annexure - II
Sundaram Finance Limited has been following robust governance practices since its inception. The strong edifice of the Company, built in
1954, is supported by the pillars of Customer Faith, Investor Trust and Employee Loyalty. Your Company continues to maintain the highest
standards of integrity and transparency in operations, excellence in service to all stakeholders and strong Corporate Governance standards.
I. BOARD OF DIRECTORS
All the members of the Board are eminent persons with considerable expertise and experience in general management spanning the
automobile, engineering, banking, finance, accounts and audit, information technology, consulting and road transport sectors. The Company
is immensely benefited by the range of experience and skills that the Directors bring to the Board.
The composition of the Board is in conformity with the listing requirements as on 31st March 2019.
The details of directors’ attendance at Board Meetings, AGM and details of other directorships, committee chairmanships / memberships
held by the Directors during the year are as follows:
Name of the Director
DIN Attendance Particulars
Directorships in other public limited companies (as on 31st March 2019)
Committees in which Chairman/Member
of other public limited companies* (as on 31st March
2019)
Directorship in other listed company
Board Meetings
AGM Chairman Director Chairman Member Name of the Company Category of DirectorshipListed Unlisted Listed Unlisted
Promoter Directors
Sri S. VijiNon-executive Chairman
00139043 10 Yes – 2 1 1 1 1 WheelsIndiaLimited Non - Executive Director
Sundaram Finance Holdings Limited (upto 27.08.2018)
Non - Executive Chairman
Sri S. RamNon-executive Director
00018309 10 Yes 2 1 – 2 1 2 WheelsIndiaLimited Non - Executive ChairmanIndia Motor Parts &
Accessories Limited
Sri S. RavindranNon- executive Director
00045076 9 Yes – – – 1 – – India Motor Parts & Accessories Limited(upto 18.09. 2018)
Independent Director
Sri T.T. Srinivasaraghavan, Managing Director
00018247 10 Yes 1 – – 7 – 4 Sundaram Finance Holdings Limited
Non - Executive Chairman
Sri Harsha VijiDeputy Managing Director
00602484 9 Yes – – 1 3 1 2 Sundaram Finance Holdings Limited
Non - Executive Director
Independent Directors
Sri N. Venkataramani # 00001639 8 Yes – – 2 6 3 1 IP Rings Limited Non - Executive DirectorBimetal Bearings Limited
Sri P.N. Venkatachalam 00499442 10 Yes – – 1 6 1 6 Edelweiss Financial Services Ltd
Independent Director
Sri S. Mahalingam 00121727 8 Yes 1 – 2 4 4 4 Sundaram Fasteners Limited
Independent Director
JSWSteelLimited
City Union Bank Limited Non - Executive Chairman
Report on Corporate Governance

Annual Report2018-1917
Name of the Director
DIN Attendance Particulars
Directorships in other public limited companies (as on 31st March 2019)
Committees in which Chairman/Member
of other public limited companies* (as on 31st March
2019)
Directorship in other listed company
Board Meetings
AGM Chairman Director Chairman Member Name of the Company Category of DirectorshipListed Unlisted Listed Unlisted
Sri S. Prasad 00063667 10 Yes – – 3 2 3 2 WheelsIndiaLimited Independent DirectorSundaram Finance
Holdings Limited
India Motor Parts & Accessories Limited
Ms Shobhana Ramachandhran
00273837 9 Yes – – 2 3 – 1 TVS Srichakra Limited Executive Director
India Motor Parts & Accessories Limited (upto 29.11.2018)
Non-Executive Director
Sri Rajiv C. Lochan 05309534 10 Yes – – – 3 – – – –
Executive Director
Sri A N Raju Director (Operations)
00036201 10 Yes – – – 2 1 – – –
* Audit Committee and Stakeholders’ Relationship Committee considered.
# upto 31.03.2019
The expertise/skills/competencies identified by the Board and available with the Directors are detailed below:
Category Expertise Skills / Competenceies
Non-Executive Non-Independent Directors •In-depthIndustryKnowledge•CapitalMarkets•LegalandRegulatoryFramework•RiskAssessmentandManagement•BusinessPolicies•StrategicManagement
•Entrepreneurial•Governance•Behavioural
Independent Directors •In-depthIndustryKnowledge•AuditandFinancialManagement•Treasury•LegalandRegulatoryFramework•RiskAssessmentandManagement•BusinessPolicies•CapitalMarkets
•Technical/Professional•Analytical•Technological•Behavioural
Executive Directors •In-depthIndustryKnowledge•AuditandFinancialManagement•WealthManagement•TreasuryOperationsandManagement•BusinessPolicies•LegalandRegulatoryFramework•CapitalMarkets•RiskAssessmentandManagement•AssetLiabilityManagement•StrategicManagement
•Governance•Leadership•Technical•Analytical•Organisational•Technological•Planning•ResourceManagementandUtilisation•PeopleManagement•Communication•Behavioural

Sundaram Finance Limited
18
II. BOARD MEETINGS
The Board of Directors formulates the broad business and operational policies, periodically reviews the performance and engages itself
with strategic issues concerning the Company.
During the year under review, 10 meetings of the Board of Directors were held.
27.04.2018 14.11.2018
25.05.2018 30.11.2018
27.07.2018 21.12.2018
24.08.2018 31.01.2019
01.11.2018 29.03.2019
All Directors and Senior Management Personnel have re-affirmed compliance with the Code of Conduct approved and adopted by the
Board of Directors.
In our opinion, the independent directors fulfill the conditions specified in the SEBI (Listing Obligations and Disclosure Requirements)
Regulations, 2015 and are independent of the management.
A Certificate issued by Sri M. Damodaran, Partner, M/s. M. Damodaran & Associates, Practicing Company Secretaries, under Sch. V.Para
C.10(i) of SEBI (Listing Obligations and Disclosure Requirements) Regulations, 2015, is attached as part of this report vide Annexure II (i).
The Managing Director, on behalf of the Board, has periodically reviewed compliance reports pertaining to all laws applicable to the
Company and submitted his consolidated report indicating therein that the Company was fully compliant with all applicable laws.
III. AUDIT COMMITTEE
The Audit Committee reviews the financial accounting policies, adequacy of internal control systems and systems audit and interacts
with the statutory auditors, internal auditors and systems auditors. Senior Executives and functional heads are invitees to the committee
meetings. Besides, the Committee reviews the audit plans, interim and annual financial results, management discussion and analysis of
financial condition and results of operations, related party transactions, observations of the management and internal / external auditors
on internal control and follow-up reports of the management.
Composition of the Audit Committee and attendance of the members at Committee meetings are as follows:
Name of the Member No. of Meetings Attended Meeting dates
Sri S. Prasad Chairman 9 26.04.201821.05.201824.08.201822.10.201826.10.201824.12.201821.01.201925.02.201929.03.2019
Sri S. Ravindran Member 7
Ms Shobhana Ramachandhran Member 9
The Company Secretary is the Secretary to the Committee.

Annual Report2018-1919
IV. STAKEHOLDERS RELATIONSHIP COMMITTEE
The Stakeholders Relationship Committee
i) approves and monitors transfers, transmission, splits and consolidation of securities of the Company,
ii) reviews and resolves the grievances of security holders / depositors / debenture holders of the Company including complaints
related to transfer/transmission of shares, non-receipt of annual report, non-receipt of declared dividends, non-receipt of interest
on deposits/debentures, issue of new/duplicate certificates, general meetings etc., and
iii) reviews the compliances with various statutory and regulatory requirements.
Composition of the Stakeholders Relationship Committee and attendance of the members at Committee meetings are as follows:
Name of the Member No. of Meetings Attended Meeting dates
Sri S. Prasad Chairman 2 16.07.2018 &
26.12.2018Sri T.T. Srinivasaraghavan Member 2
Sri A.N. Raju Member 2
Besides, transfer of shares were approved by resolutions passed in circulation on 40 occasions.
Sri P. Viswanathan, Secretary, is the Compliance Officer. No investor complaint was received during the year. None was pending unresolved
as on 31st March 2019.
V. RISK MANAGEMENT COMMITTEE AND ASSET LIABILITY MANAGEMENT COMMITTEE
The Risk Management Committee (RMC) and the Asset Liability Management Committee (ALCO), formed in accordance with the Directions
of the Reserve Bank of India, function under the supervision of the Audit Committee.
The RMC formulates policies and strategies for identification, measurement and reporting on market risks, credit risks and operational risks.
The ALCO is responsible for:
•managingthebalancesheetwithintheperformance/riskparameterslaiddownbytheRMC
•monitoringandmanagingthemarketrisk.
Composition of the Risk Management Committee and Asset Liability Management Committee and attendance of the members at Committee
meetings are as follows:
Name of the Member No. of RMC Meetings attended
RMC Meeting dates
No. of ALCO Meetings attended
ALCO Meeting dates
Sri T.T. Srinivasaraghavan Chairman 4 28.06.2018
28.09.2018
10.12.2018
13.02.2019
10 25.04.201818.06.201825.07.201805.09.201828.09.201801.11.201807.12.201829.12.201830.01.201928.02.2019
Sri Srinivas Acharya Member 4 8
Sri Harsha Viji Member 4 8
Sri A.N. Raju Member 4 9
Sri M. Ramaswamy Member 4 10

Sundaram Finance Limited
20
VI. SEPARATE MEETING OF INDEPENDENT DIRECTORS
A Separate Meeting of Independent Directors was held on 21st December 2018 without the attendance of Non-Independent Directors and
members of management. All the Independent Directors attended the meeting and:
(i) reviewed the performance of non-independent directors and the Board as a whole;
(ii) reviewed the performance of the Chairman of the company, taking into account the views of executive directors and non-executive
directors;
(iii) assessed the quality, quantity and timeliness of flow of information between the company management and the Board that is necessary
for the Board to effectively and reasonably perform their duties.
VII. FAMILIARISATION PROGRAMME FOR INDEPENDENT DIRECTORS
The company has familiarised the Independent Directors with their roles, rights, responsibilities in the company, nature of the industry in
which the company operates, business model etc. through familiarisation programmes. Details of the familiarisation programmes have
been disclosed on the company’s website under the following web link:
https://www.sundaramfinance.in/assets/app_docs/investor-info/corporate_governance/familiarisation_programme/familiarisation-
programme-for-ids-2018-19.pdf
VIII. CORPORATE SOCIAL RESPONSIBILITY COMMITTEE The Corporate Social Responsibility (CSR) Committee has formulated a Corporate Social Responsibility Policy indicating the CSR activities to
be undertaken by the company in accordance with Schedule VII to the Companies Act, 2013. The terms of reference of the CSR Committee
include recommending to the Board the amount of expenditure to be incurred on the CSR activities and monitoring the implementation of
the CSR Policy from time to time. The CSR Policy of the Company, as approved and adopted by the Board, has been posted on the website.
Composition of the Corporate Social Responsibility Committee and attendance of the members at Committee Meeting are as follows:
Name of the Member No. of Meetings Attended Meeting dates
Ms Shobhana Ramachandhran Chairman 2 27.04.2018 &
29.03.2019Sri S. Ravindran Member 2
Sri T.T. Srinivasaraghavan Member 2
IX. NOMINATION, COMPENSATION & REMUNERATION COMMITTEE
The Nomination, Compensation and Remuneration Committee have formulated criteria for evaluation of the Board and non-independent
directors for the purpose of review of their performance at a separate meeting of the Independent Directors. Further, the Committee has
recommended a policy relating to the remuneration of the directors, key managerial personnel, senior management and other employees,
which, inter alia, includes the principles for identification of persons who are qualified to become directors.
The criteria laid down for evaluation of the directors and the remuneration policy, as approved and adopted by the Board, are attached
as part of this report vide Annexures II (ii) and (iii) respectively.
Composition of the Nomination, Compensation & Remuneration Committee and attendance of the members at Committee Meeting are as
follows:
Name of the Member No. of Meetings attended Meeting dates
Sri P.N. Venkatachalam Chairman 3 25.05.2018
31.01.2019
26.03.2019Sri S. Prasad Member 3
Sri S. Ravindran Member 3
The Company Secretary is the Secretary to the Committee.

Annual Report2018-1921
X. INFORMATION TECHNOLOGY STRATEGY COMMITTEEThe Information Technology Strategy Committee has been constituted with the following terms of reference:
a) Approving IT strategy and policy documents and ensuring that the management has put an effective strategic planning process in place;
b) Ascertaining that management has implemented processes and practices that ensure that the IT delivers value to the business;
c) Ensuring IT investments represent a balance of risks and benefits and that budgets are acceptable;
d) Monitoring the method that management uses to determine the IT resources needed to achieve strategic goals and provide high-level
direction for sourcing and use of IT resources;
e) Ensuring proper balance of IT investments for sustaining Company’s growth and becoming aware about exposure towards IT risks
and controls.
f) deliberating and deciding on any other matter which may be referred to the Committee by the Board of Directors or which in the
opinion of the Committee will affect the IT Governance of the Company.
Composition of the Information Technology Strategy Committee and attendance of the members at Committee Meeting is as follows:
Name of the Member No. of Meeting attended Meeting dates
Sri S. Mahalingam Chairman 2
23.07.2018
&
23.11.2018
Sri P.N. Venkatachalam Member 2
Sri Rajiv C. Lochan Member 2
Sri T.T. Srinivasaraghavan Member 2
Sri A.N. Raju Member 2
Sri V. Ananthanarayanan Member 2
XI. REMUNERATION OF DIRECTORSThe sitting fee payable to Non-Executive Directors of the Company for attending the meetings of the Board and various Committees are as under:
Board
`25,000/- for
each meeting
Audit Committee
Nomination, Compensation and Remuneration Committee
Information Technology Strategy Committee
Stakeholders Relationship Committee`10,000/- for
each meetingCorporate Social Responsibility Committee
Separate Meeting of Independent Directors
The Non-Executive Directors are remunerated by way of commission for each financial year as decided by the Board of Directors within
the ceiling of 1% of the net profits of the Company approved by the shareholders. The details of remuneration paid to the Non-Executive
Directors and number of shares held by them are as follows:
Name of the Director Sitting Fee (` in lakhs)
Commission (` in lakhs)
Number of Shares held individually (as on 31.03.2019)
Relationship with other Directors
Sri S. Viji 2.50 8.00 9,09,780 (1) Brother of Sri S. Ram and Father of Sri Harsha Viji
Sri S. Ram 2.50 8.00 5,06,788 (2) Brother of Sri S. VijiSri N. Venkataramani 2.10 8.00 – –Sri P.N. Venkatachalam 3.85 12.00 – –Sri S. Mahalingam 2.60 12.00 – (3) –Sri S. Prasad 5.80 15.00 12,600 –Sri S. Ravindran 4.95 12.00 4,91,360 (4) –Ms Shobhana Ramachandhran 4.80 12.00 3,02,000 –Sri Rajiv C. Lochan 3.10 12.00 – –
Note:•Numberofsharesheldjointlywithothers:(1) 8684 (2) 6,09,896 (3) 3,200 (4) 1,36,342
•NumberofsharesheldasKartaofHUF:(1) 4,79,912

Sundaram Finance Limited
22
Amount of deposits placed by the Non-Executive Directors in the Company aggregated to ̀ 5,58.11 lakhs as on March 31, 2019. The interest
on these deposits paid / credited during the year 2018-19 amounted to `68.80 lakhs.
The Executive Directors of the Company are appointed on contractual basis, on terms approved by the shareholders. Their remuneration
comprises salary, allowances, commission and perquisites. The quantum of commission payable to them is decided by the Nomination,
Compensation and Remuneration Committee and Board of Directors. The remuneration is within the limits prescribed under Schedule
V to the Companies Act, 2013.
The details of remuneration paid to the Executive Directors for the Financial Year 2018-19 are as follows:
(` in lakhs)
Nature of Payment Sri T.T. Srinivasaraghavan
Managing Director
Sri Harsha Viji*
Deputy Managing Director
Sri A N Raju
Director (Operations)
Salary and allowances 1,50.07 1,27.12 96.94
Commission 3,25.00 2,40.00 1,25.00
Contributions to Provident,
Superannuation and Gratuity Funds
13.11 11.09 10.07
Perquisites 2.96 2.40 0.53
Stock Options Nil Nil 47.01#^
Total 4,91.14 3,80.62 2,79.55
* Son of Sri S. Viji, Chairman
# Value of 2,500 stock options exercised during the financial year 2018-19
^ 2,500 stock options were granted at `10/- per share (at par) on 25th May 2018. The said Options would vest on 31st May 2019 and
would be exercisable between 1st June 2019 and 31st August 2019.
XII. GENERAL BODY MEETINGS
Details relating to last three Annual General Meetings:
Year Date Time Location No. of Special Resolutions Passed
2018 20th July 2018 10.00 AM The Music Academy,
New No.168, Old No.306, TTK Road,
Chennai 600 014
Two
2017 20th July 2017 10.00 AM The Music Academy,
New No.168, Old No.306, TTK Road,
Chennai 600 014
One
2016 22nd July 2016 10.00 AM The Music Academy,
New No.168, Old No.306, TTK Road,
Chennai 600 014
Nil
Following Special Resolutions were passed through Postal Ballot and E-voting, as per the procedure prescribed under Section 110 of the
Companies Act, 2013 read with Companies (Management and Administration) Rules, 2011 under the overall supervision of the Scrutinizer,
Sri T K Bhaskar, Partner, HSB Partners, Advocates, Chennai.

Annual Report2018-1923
Sl. No.
Details of Resolution(s) Resolution(s) Passed on
Total No. of votes in favour
Total No. of votes against
% of votes in favour
% of votes against
1. Raising the present limit of borrowing, from `21,000 cr. to `30,000 cr. excluding forex fluctuations
06.12.2018 6,08,59,273 67,499 99.89 0.11
2. Private placement of debentures up to `12000 cr. during the FY 2019-20
21.03.2019 6,66,82,840 87,505 99.87 0.13
3. Re-appointment of Independent Directors for a term of 5 (five) years.
a. Sri P N Venkatachalam 21.03.2019 6,67,34,409 35,936 99.95 0.05
b. Sri S Prasad 6,61,71,397 216,048 99.67 0.33
c. Ms Shobhana Ramachandhran 6,67,32,573 37,772 99.94 0.06
d. Sri S Mahalingam 6,67,32,758 37,587 99.94 0.06
The results of the postal ballots were announced by Sri S. Viji, Chairman, at the Registered Office of the Company and posted on the website.
No special resolution is proposed to be passed, through postal ballot.
XIII. VIGIL MECHANISM / WHISTLE BLOWER POLICYTheCompanyhasestablishednecessaryvigilmechanismandadoptedaWhistleBlowerPolicyforDirectorsandEmployeestoreport
concerns about unethical behaviour. The mechanism provides for adequate safeguards against victimisation. Further, no person has been
denied access to the Audit Committee.
TheWhistleBlowerPolicyisavailableunderthefollowingweblink:
https://www.sundaramfinance.in/assets/app_docs/investor-info/corporate_governance/policies/sfl-whistle-blower-policy.pdf
XIV. DISCLOSURES
• Therewerenomateriallysignificantrelatedpartytransactionshavingpotentialconflictwiththeinterestsofthecompanyatlarge.
• InformationpertainingtotheCreditRatingsassignedbyvariousCreditRatingAgenciesfortheCompany’sshorttermandlongterm
borrowings, including fixed deposits, has been provided in the Board’s Report and also in the audited financial statements.
• AllthemandatoryrequirementsspecifiedinRegulations17to27andRegulation46(2)(b)to(i)oftheSEBI(ListingObligations
and Disclosure Requirements) Regulations, 2015 have been complied with.
• TheCompanywillcontinuetoadoptothernon-mandatoryrequirementsasappropriate.
• TheCompanyhasarecordofunqualifiedfinancialstatementssinceinception.
XV. POLICIES ON MATERIAL SUBSIDIARIES AND RELATED PARTY TRANSACTIONS
The company’s policies on Material Subsidiaries and Related Party Transactions are available on the website under the following web link:
https://www.sundaramfinance.in/assets/app_docs/investor-info/corporate_governance/policies/sfl-policy-on-material-subsidiaries.pdf
https://www.sundaramfinance.in/assets/app_docs/investor-info/corporate_governance/policies/sfl-policy-on-related-party-transactions.pdf
XVI. MEANS OF COMMUNICATION• QuarterlyunauditedandannualauditedresultsoftheCompanywerepublishedin“BusinessLine”(English)and“MakkalKural”
(Tamil).
• TheresultsandpressreleaseswerealsodisplayedontheCompany’swebsiteatwww.sundaramfinance.in.

Sundaram Finance Limited
24
• Shareholdershavebeenprovidedwithanopportunitytoprovidetheiremailidforreceivingcorrespondenceandannualreportin
electronic form.
• Theannualreporthasbeensentinelectronicformtoshareholderswhohaveprovidedtheiremailid.Physicalcopiesoftheannual
report have been provided to such shareholders based on a request received from them for this purpose.
XVII. GENERAL SHAREHOLDER INFORMATION
Annual General Meeting
Date Time Venue
19th July 2019 (Friday) 10.00 AM The Music Academy, New No.168, Old No.306, TTK Road, Chennai 600 014
• FinancialYear–1stApril2019to31stMarch2020
• BookClosuredates–5thJuly2019to19thJuly2019(bothdaysinclusive)
• Datesofpaymentofdividend
Interim 26th February 2019 `5.00 per share (50%)
Final on or after
20th July 2019
`7.50 per share (75%)
Special `5.00 per share (50%)
• Thecompany’ssharesarelistedon:
National Stock Exchange of India Limited
Exchange Plaza, 5th Floor
Plot No. C/1, G Block
Bandra-Kurla Complex
Bandra (E), Mumbai 400 051
• TheCompanyhaspaidthelistingfeesforthefinancialyears2018-19&2019-20totheabovestockexchange.
• NSEStockCode:SUNDARMFIN
• ISIN:INE660A01013
• DetailsofoutstandingsharesinSundaramFinanceLimitedUnclaimedSharesSuspenseAccount.
Particulars Aggregate Number of
shareholders
Outstanding shares lying in Sundaram Finance
Limited Unclaimed Shares Suspense Account
Opening Balance as on 1st April 2018 86 26,765
Less: Shareholders approached for transfer / delivery during 2018-19 and Shares transferred / delivered during 2018-19
3 1,800
Less: Transfer of shares to Investor Education and Protection Fund Authority Ministry of Corporate Affairs
Nil Nil
Balance as on 31st March 2019 83 24,965

Annual Report2018-1925
• DetailsofsharestransferredtotheInvestorEducationandProtectionFundAuthority,MinistryofCorporateAffairs.
Particulars Aggregate Number of
shareholders
Outstanding shares lying in
IEPF Account
Opening Balance as on 1st April 2018 89 26,564
Less : Shareholders approached for transfer / delivery during
2018-19 and Shares transferred / delivered during 2018-19
Nil Nil
Add : Transfer of shares to Investor Education and Protection Fund
Authority Ministry of Corporate Affairs during 2018-19
(i) Shares transferred on 25.07.2018 15 6,754
(ii) Shares transferred on 08.02.2019 6 693
(iii) Shares transferred on 29.03.2019 5 5,002
Balance as on 31st March 2019 115 39,013
Statutory Reminders are sent to members, in respect of shares transferred to the Unclaimed Shares Suspense Account and IEPF authority,
in addition to the reminders through e-mail and phone contacts. Members who have not yet made claims are, therefore, requested to
contact the Company / Registrar and share Transfer Agents immediately.
• FollowingdividendsaretransferabletotheInvestorEducationandProtectionFund(IEPF)ontherespectiveduedates,asunder,in
accordance with the provisions of Section 124 (5) of the Companies Act, 2013.
Nature of Dividend Transferable to IEPF on Nature of Dividend Transferable to IEPF on
Final Dividend 2011-12 17th August 2019 2nd Interim Dividend 2015-16 8th April 2023
Interim Dividend 2012-13 10th March 2020 Final Dividend 2015-16 22nd August 2023
Final Dividend 2012-13 18th August 2020 Interim Dividend 2016-17 20th April 2024
Dividend 2013-14 23rd August 2021 Final Dividend 2016-17 21st August 2024
Interim Dividend 2014-15 2nd March 2022 Interim Dividend 2017-18 28th May 2025
Final Dividend 2014-15 23rd August 2022 Final Dividend 2017-18 20th August 2025
Interim Dividend 2015-16 1st March 2023 Interim Dividend 2018-19 4th March 2026
Reminders are sent to members for encashing unclaimed and unpaid dividends, on a regular basis, in addition to the reminders through
e-mails and phone contacts. Members who have not yet made claims are, therefore, requested to contact the Company / Registrar and
Share Transfer Agents immediately.
Fees paid to M/s. Sundaram & Srinivasan, Chartered Accountants, Statutory Auditors, for all services:
Sl. No. Name of the Company Total Fees Paid (Amount in `)
1. Sundaram Finance Limited 96.00
2. Sundaram PNB Paribas Home Finance Limited 28.00
3. Sundaram Asset Management Company Limited 57.60
Total 180.60
• DisclosureinrelationtoPreventionofSexualHarassmentatWorkplaceisavailableaspartoftheBoard’sReport.

Sundaram Finance Limited
26
MARKET PRICE DATA ON THE NATIONAL STOCK EXCHANGE
Month Apr – 18 May Jun Jul Aug Sep Oct Nov Dec Jan –19 Feb Mar
NSEHigh 1845.00 1890.00 1900.00 1618.80 1677.00 1629.95 1545.00 1518.80 1489.70 1524.80 1654.00 1631.95
Low 1651.05 1686.00 1572.05 1460.60 1466.25 1449.30 1337.50 1355.20 1350.00 1375.00 1329.60 1518.00
Period
S & P CNX Nifty
SF C
losi
ng S
hare
Pri
ce
SF Closing Share Price
S & P CNX Nifty
Apr-18 May Jun Jul Aug Sep Oct Nov Dec Jan-19 Feb Mar
1770.60 1859.00 1599.80 1497.90 1591.90 1514.45 1497.55 1461.15 1438.70 1404.15 1637.00 1558.70
10739 10736 10714 11357 11681 10930 10335 10876 10863 10831 10793 11624
SHARE PRICE PERFORMANCE13000
12500
12000
11500
11000
10500
10000
9500
9000
2500.00
2250.00
2000.00
1750.00
1500.00
1250.00
1000.00
• Sharetransferswereprocessedandsharecertificatesdespatchedwithinthespecifiedtimelimitfromlodgementinaccordancewiththe SEBI (Listing Obligations and Disclosure Requirements) Regulation, 2015.
Dematerialisation requests have been confirmed within the specified time limit.
Investor Relation Services - Shares continue to enjoy the ISO 9001:2015 certification by Bureau Veritas Certification (India) Private Limited.
• M/sCameoCorporateServicesLtd,RegistrarsandShareTransferAgentsofthecompanyhaveattendedtothesharetransferformalitiesregularly. The Registrar and Share Transfer Agents can be contacted by the investors at the following address:
M/s Cameo Corporate Services Ltd'Subramanian Building', No 1 Club House Road, Chennai 600 002Phone 044 2846 0390 to 0395Fax 044 2846 0129Email [email protected] (for general queries)
[email protected] (for annual report related queries)Contact Persons Mr. R.D. Ramasamy, Director
Mr. D. Narasimhan, Joint Manager
Debenture Trustee Ms. Anjalee Athalye Vice President - Operations IDBI Trusteeship Services Limited Asian Building, Ground Floor, No.17, R. Kamani Marg, Ballard Estate, Mumbai – 400 001Tel: 022 40807007 Fax: 022 66311776 Email: [email protected]

Annual Report2018-1927
For your queries / grievances / complaints, please contact:Sri P Viswanathan
Secretary & Compliance Officer
Sundaram Finance Limited
21, Patullos Road, Chennai - 600 002
Ph : 044-28881207
Fax : 044-28550290
Mobile : 9444399168
E mail : [email protected]
T T SrinivasaraghavanManaging Director
SHAREHOLDING PATTERN AS ON 31.03.2019
Public 40.37%
Banks, Financial Institutions & Insurance Companies
1.79%FII / FPIs and NRIs 11.58%
Promoters 36.47%
Mutual Funds & AIF 9.79%
DISTRIBUTION OF SHAREHOLDING AS ON 31ST MARCH 2019
No. of Equity Shares Held Total Shareholders Total Shares Total % to Capital
Upto 250 16,766 8,57,027 0.77
251 to 500 1,970 7,50,328 0.68
501 to 1000 1,758 11,60,238 1.04
1001 to 5000 1,516 46,47,141 4.18
5001 to 10000 367 27,76,525 2.50
10001 to 50000 381 83,02,221 7.47
50001 to 100000 97 70,84,410 6.38
100001 and above 171 8,55,25,970 76.98
Total 23,172 11,11,03,860 100.00
Total shares held in dematerialised form 96.21%
Public shareholding in dematerialised form 94.04%

Sundaram Finance Limited
28
CERTIFICATE OF NON-DISQUALIFICATION OF DIRECTORS(Pursuant to Regulation 34(3) and Schedule V Para C clause (10)(i) of the SEBI
(Listing Obligations and Disclosure Requirements) Regulations, 2015)
To,
The Members of SUNDARAM FINANCE LIMITED
21, PATULLOS ROAD, CHENNAI – 600002.
I have examined the relevant registers, records, forms, returns and disclosures received from the Directors of SUNDARAM FINANCE LIMITED
having CIN - L65191TN1954PLC002429 and having registered office at 21, PATULLOS ROAD, CHENNAI – 600002 (hereinafter referred to
as ‘the Company’), produced before me by the Company for the purpose of issuing this Certificate, in accordance with Regulation 34(3)
read with Schedule V Para-C Sub clause 10(i) of the Securities Exchange Board of India (Listing Obligations and Disclosure Requirements)
Regulations, 2015.
In my opinion and to the best of my information and according to the verifications (including Directors Identification Number (DIN) status
at the portal www.mca.gov.in) as considered necessary and explanations furnished to me by the Company & its officers, I hereby certify that
none of the Directors on the Board of the Company as stated below for the Financial Year ending on 31st March 2019 have been debarred
or disqualified from being appointed or continuing as Directors of companies by the Securities and Exchange Board of India, Ministry of
Corporate Affairs or any such other Statutory Authority.
Sr.
No.
Name of Director DIN Date of
appointment in Company
1. Mr. Thiruvallur Thattai Srinivasaraghavan 00018247 01/02/1998
2. Mr. Santhanam Ram 00018309 27/09/1988
3. Mr. Ayalur Natarajan Raju 00036201 01/06/2014
4. Mr. Srinivasan Ravindran 00045076 29/07/2008
5. Mr. Raghavendra Raghuttama Rao 00146230 01/04/2019
6. Mr. Sreenivasan Prasad 00063667 28/10/2008
7. Mr. Mahalingam Seturaman 00121727 26/05/2014
8. Mr. Santhanam Viji 00139043 17/01/1986
9. Ms. Shobhana Ramachandhran 00273837 27/01/2014
10. Mr. Pudugramam Narayanaswamy Venkatachalam 00499442 28/01/2011
11. Mr. Harsha Viji 00602484 24/09/2010
12. Mr. Rajiv Lochan Chellappa 05309534 25/11/2016
Ensuring the eligibility for the appointment / continuity of every Director on the Board is the responsibility of the management of the
Company. My responsibility is to express an opinion on these based on my verification. This certificate is neither an assurance as to the
future viability of the Company nor of the efficiency or effectiveness with which the management has conducted the affairs of the Company.
For M. Damodaran & Associates
M. Damodaran (Practicing Company Secretary)
Place : Chennai (FCS No. : 5837)
Date : 24.05.2019 (C.P. No. : 5081)
Annexure - II (i)

Annual Report2018-1929
Annexure - II (ii)CRITERIA FOR EVALUATION (as amended on 29th March 2019)
Criteria for evaluation of the Board and non-independent directors at a separate meeting of Independent Directors:
1. Composition of the Board and availability of multi-disciplinary skills.
Whether theBoardcomprisesofDirectorswithsufficientqualificationsandexperience indiverse fields tomakeSFaversatileinstitution.
2. Commitment to good Corporate Governance Practices
a) Whetherthecompanypractiseshighethicalandmoralstandards.
b) Whetherthecompanyisfairandtransparentinallitsdealingswiththestakeholders.
3. Adherence to Regulatory Compliance
WhetherthecompanyadherestothevariousGovernmentregulations.....Local,StateandCentral,intime.
4. Track record of financial performance
WhethertheCompanyhasbeenconsistentlyrecordingsatisfactoryandprofitablefinancialperformanceyearonyearaddingtoshareholder value.
WhethertheCompanyistransparentinallitsdisclosuresonfinancialdata.
5. Grievance redressal mechanism
Whetherapropersystemisinplacetoattendtothecomplaints/grievancesfromtheshareholders,depositors,customers,employeesand others quickly and fairly.
6. Existence of integrated Risk Management System
WhethertheCompanyhasanintegratedriskmanagementsystemtocoverthebusinessrisks.
7. Use of Modern technology
WhethertheCompanyhasanIntegratedITstrategyandwhetherthereisanysystemforperiodicaltechnologyupgradationcoveringboth hardware and software.
8. Commitment to CSR
WhethertheCompanyiscommittedtosocialcausesandCSRandwhetherthereisasystemtoidentify,financeandmonitorsuchsocial activities.
Criteria for evaluation of Chairman at separate meeting of Independent Directors:
1. Leadership qualities
2. Standard of Integrity
3. Understanding of Macro economic trends and Micro industry trends.
4. Public Relations
5. Future Vision and Innovation
Criteria for evaluation of Independent Directors by the entire Board:
1. Qualifications & Experience
2. Standard of Integrity
3. Attendance in Board Meetings/AGM
4. Understanding of Company's business
5. Value addition in Board Meetings
6. Fulfillment of Independence Criteria
Criteria for evaluation of all Committees by the Board with reference to the respective terms of reference:
1. Qualification & Experience of members
2. Depth of review of various matters, including financial performance
3. Review of regulatory compliance

Sundaram Finance Limited
30
Annexure - II (iii) SUNDARAM FINANCE LIMITED REMUNERATION POLICY
(as amended on 29th March 2019)
Sundaram Finance Limited (hereinafter referred to as ‘the Company’) has, since inception, formulated performance based remuneration
structures for its employees at all levels, so as to provide ample opportunity for inclusive growth, supported with adequate learning.
Accordingly, the remuneration structure is based on the qualification and skill levels at the time of joining the organisation and reviewed
on a yearly basis by way of an assessment of their actual performance, through a robust “Performance Management System”.
The components forming part of the compensation structure for each grade are designed to reward performance as well as to mitigate
some of the location based hardships faced by the employees.
Section 178 (2), (3) and (4) of the Companies Act, 2013 read with the applicable rules thereto and Schedule II. Part D of the SEBI (Listing
Obligations and Disclosures Requirements) Regulations, 2015 provide that the Nomination, Compensation and Remuneration Committee
(NCRC) shall identify persons who are qualified to become Directors and shall also recommend to the Board a policy, relating to the
remuneration for Directors, Key Managerial Personnel, Senior Management and other employees.
Accordingly, the NCRC recommends the following Remuneration Policy of the Company so as to ensure that:
a) the level and composition of remuneration to non-executive directors is reasonable and appropriate to attract the right talent.
b) relationshipofremunerationtoperformanceoftheWholetimeDirectorsisclearandmeetsappropriateperformancebenchmarks;
and
c) remuneration to working directors, key managerial personnel and senior management involves a balance between fixed and incentive
pay reflecting short and long term performance objectives appropriate to the working of the company and its goals. This includes
ESOP granted to Eligible Directors / Senior Management.
The following policy shall be hereinafter referred to as “Remuneration Policy of Sundaram Finance Limited”.
I Definitions
a) “Remuneration” means any monetary benefit or its equivalent extended to any person for services rendered by him/her and
includes perquisites as defined under the Income-tax Act, 1961.
b) “Key Managerial Personnel” means,
i) Managing Director, Chief Executive Officer or Manager;
ii) Whole-timeDirector;
iii) Chief Financial Officer;
iv) Company Secretary.
c) “SeniorManagement”meansallexecutivesonelevelbelowtheManagingDirector/Whole-timeDirectorsandshallinclude
the Chief Financial Officer and Company Secretary.
d) “Employee” will mean an employee who has been appointed on the rolls of Sundaram Finance Limited (hereinafter referred
to as ‘the Company’) and has been issued an appointment order by the Company.
e) “Employee Stock Option (ESOP)” means stock options granted under the Sundaram Finance Employee Stock Option Scheme
– 2008, which is in line with the Securities and Exchange Board of India (Share Based Employee Benefits) Regulations, 2014.

Annual Report2018-1931
II Board Diversity
It will be the endeavour of the Company to attract people to be on the Board of our Company as Directors from variety of backgrounds
which are appropriate to the business interests of the Company. To this end, our Directors over the past decades have come from
backgrounds as varied as automobile and allied industry, banking and other financial services including insurance, accounting and
legal profession, former Regulators and retired Civil Servants.
III Remuneration Pattern
The NCRC lays down the following remuneration pattern for Non-Executive Directors and Independent Directors, Executive Directors,
Key Managerial Personnel, Senior Management and other employees under the Remuneration Policy:
1. The remuneration payable to Non-Executive Directors and Independent Directors shall consist of:
(a) Sitting fees for attending the meetings of the Board and sub-committees of the Board, within the limit prescribed under the
Companies Act, 2013;
(b) Commission for each financial year, within the limits specified under the Companies Act, 2013, as may be decided by the Board
of Directors;
(c) Reimbursement of expenses for attending meetings of the Board and sub-committees of the Board.
2. TheremunerationpayabletoWhole-timeDirectors,whoareappointedbasedonShareholders’approval,shallconsistof:
(a) Salary, allowances, commission and perquisites;
(b) Commission for each financial year, as may be decided by the Board of Directors, based on the recommendations of the NCRC;
(c) Minimum Remuneration in any financial year, when the Company has no profits or its profits are inadequate, by way of salary,
allowances, commission and perquisites not exceeding the limits specified in Part II.Section II of Schedule V to the Companies
Act, 2013 or such other limits as may be prescribed by the Government from time to time as minimum remuneration.
The overall remuneration payable to Directors, including Executive Directors, shall be within the limits prescribed under Section
197 of the Companies Act, 2013 read with Schedule V.
As provided under the existing regulatory framework, all Directors, except Independent Directors and Promoter Directors, are
eligible for ESOP.
3. The remuneration payable to Key Managerial Personnel, Senior Management and other employees of the company shall consist of:
(a) Salary, allowances, perquisites and variable components reflecting the short and long term performance objectives appropriate
to the working of the Company, which are aligned to industry standards.
(b) ESOPs to “Eligible Employees”, as may be selected from time to time by the Managing Director.
IV Implementation of the Remuneration Policy
The remuneration payable to Non-Executive Directors and Independent Directors shall be determined by the Board of Directors,
after taking into account their performance and contribution.
The Remuneration payable to Key Managerial Personnel and Senior Management shall be determined by the NCRC after taking into
account their experience, qualification, responsibilities, contributions, performance and industry standards.
The implementation of the Remuneration Policy of the Company, in respect of all other employees shall be the responsibility of the
Managing Director.
The NCRC shall take suitable steps to issue guidelines, procedures and such other steps as may be considered appropriate from time
to time, for effective implementation of the Remuneration Policy.

Sundaram Finance Limited
32
Certificate on Corporate GovernanceThe Members of SUNDARAM FINANCE LIMITED, Chennai.
I have examined the compliance of the conditions of Corporate Governance by Sundaram Finance Limited, Chennai for the year ended on 31st March, 2019, as stipulated in Regulations 17 to 27 of Chapter IV of the Securities and Exchange Board of India (Listing Obligations and Disclosure Requirements) Regulations, 2015.
The compliance of the conditions of corporate governance is the responsibility of the management. My examination was limited to a review of the procedures and implementation thereof, adopted by the company for ensuring the compliance with the conditions of Corporate Governance. It is neither an audit nor an expression of opinion on the financial statements of the company.
In my opinion and to the best of my information and according to the explanations given to me, I certify that the company has complied with the conditions of Corporate Governance stipulated in the above mentioned SEBI Regulations.
I state that such compliance is neither an assurance as to the future viability of the company nor the efficiency or effectiveness with which
the management has conducted the affairs of the company.For M. Damodaran & Associates
M. DamodaranPlace : Chennai (Practicing Company Secretary)Date : 24th May 2019 (C.P. No: 5081)
Annexure III (i)
Form No. AOC-2(Pursuant to clause (h) of sub-section (3) of Section 134 of the Act and Rule 8 (2) of the Companies
(Accounts) Rules, 2014)
Form for disclosure of particulars of contracts/arrangements entered into by the company with related parties referred to in sub-section (1) of section 188 of the Companies Act, 2013 including certain
arms length transactions under third proviso thereto
1. Details of contracts or arrangements or transactions not at arm’s length basis
All transactions entered into by the Company during the year with related parties were on an arm’s length basis.
2. Details of material contracts or arrangement or transactions at arm’s length basis.
The transactions entered into by the Company during the year with related parties on an arm’s length basis were not material in nature.
Chennai S VIJI 30th May 2019 Chairman
Annexure III (ii)
Policy On Related Party Transactions(as per Regulations 23 (1) of SEBI (Listing Obligations and Disclosure Requirements) Regulations, 2015)
(as amended on 29th March 2019)
The Company shall enter into transactions with related parties only on an arm’s length basis, supported by agreement or formal letter. If the transaction is not on arm’s length basis, then, necessary compliances under Companies Act, 2013 and / or SEBI (Listing Obligations and Disclosure Requirements) Regulations, 2015 will be adhered to.
For this purpose, transaction(s) with a related party shall be considered material if the transaction(s) to be entered into individually or taken together with previous transactions during a financial year, exceed 10% of the annual consolidated turnover of the company as per the last audited financial statements of the company.
However, transaction(s) involving payment(s) made to a related party with respect to brand usage or royalty, shall be considered material if the transaction(s) to be entered into individually or taken together with previous transactions during a financial year, exceed 2% of the annual consolidated turnover of the company as per the last audited financial statements of the company.

Annual Report2018-1933
ANNEXURE IV
Annual Report on CSR Activities for the Financial Year 2018-19
1. A brief outline of the company’s CSR policy, including overview of projects or programs proposed to be undertaken and a reference to the web-link to the CSR policy and projects or programs:
CSR Policy of the Company is available in our website under the following link:
https://www.sundaramfinance.in/assets/app_docs/investor-info/corporate_governance/policies/csr.pdf
2. The Composition of the CSR Committee:
Ms Shobhana Ramachandhran, Chairman
Sri S.Ravindran
Sri T.T. Srinivasaraghavan
3. Average net profit of the company for last three financial years:
`689,92.93 lakhs
4. Prescribed CSR Expenditure (two per cent of the amount as in item 3 above):
`13,79.86 lakhs
5. Details of CSR spent during the financial year:
(a) Total amount to be spent for the financial year: `13,79.86 lakhs
(b) Amount unspent, if any - Nil
(c) Manner in which the amount spent during the financial year is detailed below: Details enclosed. (`14,04.87 lakhs)
6. In case the company has failed to spend the two per cent of the average net profit of the last three financial years or any part thereof, the company shall provide the reasons for not spending the amount in its Board Report:
Not applicable
7. A responsibility statement of the CSR Committee that the implementation and monitoring of CSR Policy, is in compliance with CSR objectives and Policy of the company:
WeherebystatethatimplementationandmonitoringofCSRPolicy,isincompliancewithCSRobjectivesandPolicyofthecompany.
Sd/- Sd/-
Chennai 600 002 T.T. Srinivasaraghavan Shobhana RamachandhranDate: 26th April 2019 Managing Director Chairman - CSR Committee

Sundaram Finance Limited
34
CSR Amount spent during the period 01.04.2018 to 31.03.2019 (` in lakhs)
1 2 3 4 5 6 7 8
Sr
No.
CSR project or activity identified Sector in which
the Project is
covered
Projects or programmes
(1) Local area or other
(2) Specify the State and district where projects or programmes were
undertaken
Amount outlay
(budget) project or
programme-wise
Amount spent on the projects or
programs Sub-heads:
(1) Direct expenditure on
projects or program
(2) Overheads:
Cumulative expenditure
up to the reporting
period
Amount spent: Direct or through
implementing agency
1. Promoting education by providing financial assistance to deserving and meritorius students and also Educational Institutions which work for this cause (31 Institutions)
Education Tamilnadu - Chennai 1,97.75 1,97.75 1,97.75 1,97.75
Tamilnadu - Kanchipuram 0.50 0.50 1,98.25 0.50
Tamilnadu - Sirgazhi 0.50 0.50 1,98.75 0.50
Tamilnadu - Thanjavur 60.00 60.00 2,58.75 60.00
Tamilnadu - Cuddalore 1.00 1.00 2,59.75 1.00
Tamilnadu - Pudukkottai 5.00 5.00 2,64.75 5.00
Karnataka - Bengaluru 11.00 11.00 2,75.75 11.00
Gujarat - Ahmedabad 0.10 0.10 2,75.85 0.10
New Delhi - Delhi 10.00 10.00 2,85.85 10.00
2. Environmental sustainability, ecological balance, conservation of natural resources, Solar Projects (5 institutions)
Environment Tamilnadu - Chennai 1,13.20 1,13.20 3,99.05 1,13.20
All over India 1,42.02 1,42.02 5,41.07 1,42.02
3. Promoting preventive and general health care (22 Institutions)
Health Tamilnadu - Chennai 5,38.89 5,38.89 10,79.96 5,38.89
Tamilnadu - Coimbatore 2.00 2.00 10,81.96 2.00
Tamilnadu - Dindigul 5.00 5.00 10,86.96 5.00
Tamilnadu - Ranipet 10.00 10.00 10,96.96 10.00
Tamilnadu - Tiruvannamalai 5.00 5.00 11,01.96 5.00
All over India 16.86 16.86 11,18.82 16.86
4. SocialWelfare(11Institutions) SocialWelfare Tamilnadu - Chennai 24.70 24.70 11,43.52 24.70
Tamilnadu - Thanjavur 91.00 91.00 12,34.52 91.00
Kerala - Trivandrum 50.00 50.00 12,84.52 50.00
5. Protection of national heritage, art and culture (23 Institutions)
National Heritage, Art and Culture
Tamilnadu - Chennai 44.60 44.60 13,29.12 44.60
Tamilnadu - Melattur 0.25 0.25 13,29.37 0.25
Karnataka - Bengaluru 9.00 9.00 13,38.37 9.00
6. Rural Development (1 institution) Rural Areas Bihar - Gaya 7.25 7.25 13,45.62 7.25
7. Sports Development (2 institutions)
Sports Tamilnadu - Chennai 4.25 4.25 13,49.87 4.25
8. Armed Forces Flag Day Fund Armed Forces Punjab - Chandigargh 25.00 25.00 13,74.87 25.00
9. Administrative Expenses 30.00 30.00 14,04.87 30.00
Total 14,04.87 14,04.87 14,04.87
Annexure - IV (i)

Annual Report2018-1935
Business Responsibility Report for the Financial Year 2018-19Section A: General Information about the Company
1. Corporate Identity Number (CIN) : L65191TN1954PLC002429
2. Name of the Company : Sundaram Finance Limited
3. Registered address : 21, Patullos Road, Chennai 600 002
4. Website : www.sundaramfinance.in
5. E-mail id : [email protected]
6. Financial Year reported : 2018-19
7. Sector(s) that the Company is engaged in (industrial activity code-wise)
As per National Industrial Classification – 2008:
Section K - Financial and Insurance Activities
Division 64 – Financial service activities, except insurance and pension funding.
8. List three key products / services that the Company manufactures / provides (as in balance sheet)
A. Providing finance for purchase of commercial vehicles, cars, multi-utility vehicles, construction equipment, tractors and working
capital finance.
B. Distribution of full range of financial products like mutual fund, deposits, insurance etc.
9. Total number of locations where business activity is undertaken by the Company
i. Number of International Locations (Provide details of major 5)
Nil
ii. Number of National Locations
658 locations
10. Markets served by the Company – Local / State / National / International
National
Section B: Financial Details of the Company (as on 31.03.2019)
1. Paid up Capital (INR) : `111.10 cr.
2. Total Turnover (INR) : `3418.17 cr.
3. Total profit after taxes (INR) : `1126.12 cr. (including exceptional item)
4. Total Spending on Corporate Social Responsibility (CSR) as percentage of profit after tax (%)
The Company’s total spending on CSR is 2.04% of the average profit after taxes in the previous three financial years.
5. List of activities in which expenditure in 4 above has been incurred:-
A. Health
B. Education
C. SocialWelfare
D. Environment
E. Promotion of culture and heritage
F. Armed Forces
Annexure - V

Sundaram Finance Limited
36
Section C: Other Details
1. Does the Company have any Subsidiary Company/ Companies?
Yes.
2. Do the Subsidiary Company / Companies participate in the BR Initiatives of the parent company? If yes, then indicate the number of
such subsidiary company(s)
Business Responsibility initiatives of the Parent Company are generally followed by the subsidiary companies to the extent possible.
3. Do any other entity / entities (e.g. suppliers, distributors etc.) that the Company does business with participate in the BR initiatives
of the Company? If yes, then indicate the percentage of such entity / entities? [Less than 30%, 30%-60%, More than 60%]
No.
Section D: BR Information
1. Details of Director / Directors responsible for BR
a) Details of the Director / Directors responsible for implementation of the BR policy / policies
DIN Number 00018247
Name Sri T T Srinivasaraghavan
Designation Managing Director
b) Details of the BR head
S. No. Particulars Details
1. DIN Number (if applicable)
2. Name Sri P Viswanathan
3. Designation Secretary & Compliance Officer
4. Telephone Number 044 2888 1207
5. Email id [email protected]
2. Principle-wise (as per NVGs) BR Policy / policies (Reply in Y / N)
a) Details of Compliance (Reply in Y/N)

Annual Report2018-1937
Sr.
No.
Questions
Busi
ness
Eth
ics
Prod
uct R
espo
nsib
ility
WellbeingofEmployees
Stak
ehol
der E
ngag
emen
t
Hum
an R
ight
s
Envi
ronm
ent
Publ
ic P
olic
y
CSR
Cust
omer
Rel
atio
ns
P1 P2 P3 P4 P5 P6 P7 P8 P9
1 Do you have a policy / policies for.... Y N Y N Y N N Y Y
2 Has the policy being formulated in consultation with the relevant stakeholders? Y – Y – Y – – Y Y
3 Does the policy conform to any national / international standards? If yes,
specify? (50 words)
Y – Y – Y – – Y Y
4 Has the policy being approved by the Board?
Is yes, has it been signed by MD / owner / CEO / appropriate Board Director?
Y – Y – Y – – Y Y
5 Does the company have a specified committee of the Board / Director/ Official
to oversee the implementation of the policy?
Y – Y – Y – – Y Y
6 Indicate the link for the policy to be viewed online? * – * – * – – * *
7 Has the policy been formally communicated to all relevant internal and external
stakeholders?
Y – Y – Y – – Y Y
8 Does the company have in-house structure to implement the policy / policies. Y – Y – Y – – Y Y
9 Does the Company have a grievance redressal mechanism related to the policy
/ policies to address stakeholders’ grievances related to the policy / policies?
Y – Y – Y – – Y Y
10 Has the company carried out independent audit / evaluation of the working of
this policy by an internal or external agency?
N – N N N – – N N
1 The company has not understood the Principles – – – – – – – – –
2 The company is not at a stage where it finds itself in a position to formulate
and implement the policies on specified principles
– – – – – – – – –
3 The company does not have financial or manpower resources available for
the task
– – – – – – – – –
4 It is planned to be done within next 6 months – – – – – – – – –
5 It is planned to be done within the next 1 year – – – – – – – – –
6 Any other reason (please specify) – # – # – # # – –
(b) If answer to S. No. 1 against any principle, is ‘No’, please explain why: (Tick up to 2 options)
* https://www.sundaramfinance.in/assets/app_docs/investor-info/corporate_governance/policies/policies_on_brr.pdf# Considering the nature of company’s business, these Principles have limited applicability. The Company complies with Regulations
governing its operations and has taken initiatives to promote inclusive growth and environmental sustainability.
3. Governance related to BR • IndicatethefrequencywithwhichtheBoardofDirectors,CommitteeoftheBoardorCEOtoassesstheBRperformanceofthe
Company.Within3months,3-6months,Annually,Morethan1year Annually. • DoestheCompanypublishaBRoraSustainabilityReport?Whatisthehyperlinkforviewingthisreport?Howfrequentlyitis
published?
Yes. Annually

Sundaram Finance Limited
38
Section E: Principle-wise performancePrinciple 1: Businesses should conduct and govern themselves with Ethics, Transparency and Accountability.
1. Does the policy relating to ethics, bribery and corruption cover only the company? Yes / No. Does it extend to the Group / Joint Ventures / Suppliers / Contractors / NGOs / Others?
Yes. The Policy covers the company, group and joint ventures.
2. How many stakeholder complaints have been received in the past financial year and what percentage was satisfactorily resolved by the management? If so, provide details thereof, in about 50 words or so.
From Received and Resolved during the year 2018-19Shareholders –Depositors –Customers 639
Principle 2: Businesses should provide goods and services that are safe and contribute to sustainability throughout their life cycle
1. List up to 3 of your products or services whose design has incorporated social or environmental concerns, risks and/or opportunities.
Not Applicable
2. For each such product, provide the following details in respect of resource use (energy, water, raw material etc.) per unit of product (optional):
i. Reduction during sourcing / production / distribution achieved since the previous year throughout the value chain?
ii. Reduction during usage by consumers (energy, water) has been achieved since the previous year?
Not Applicable
3. Does the company have procedures in place for sustainable sourcing (including transportation)?
i. If yes, what percentage of your inputs was sourced sustainably? Also, provide details thereof, in about 50 words or so.
Not Applicable
4. Has the company taken any steps to procure goods and services from local & small producers, including communities surrounding their place of work?
If yes, what steps have been taken to improve their capacity and capability of local and small vendors?
Yes, wherever possible.
5. Does the company have a mechanism to recycle products and waste? If yes what is the percentage of recycling of products and waste (separately as <5%, 5-10%, >10%). Also, provide details thereof, in about 50 words or so.
Yes, wherever possible.
Principle 3: Businesses should promote the wellbeing of all employees
1. Please indicate the Total number of employees.
4,055
2. Please indicate the Total number of employees hired on temporary / contractual / casual basis.
2,783
3. Please indicate the Number of permanent women employees.
190
4. Please indicate the Number of permanent employees with disabilities
The Company does not specifically track the number of disabled employees. The Company gives equal opportunities and treats all employees at par. Based on the income-tax declarations which enable claiming income-tax deduction for self-disability, the Company has 4 employees.
5. Do you have an employee association that is recognized by management.
Yes
6. Whatpercentageofyourpermanentemployeesismembersofthisrecognizedemployeeassociation?
26%

Annual Report2018-1939
7. Please indicate the Number of complaints relating to child labour, forced labour, involuntary labour, sexual harassment in the last financial year and pending, as on the end of the financial year.
Nil
S. No. Category No of complaints filed during the financial year
No of complaints pending as on end of the finan-cial year
1. Child labour / forced labour / involuntary labour
Nil2. Sexual harassment3. Discriminatory employment
8. Whatpercentageofyourundermentionedemployeesweregivensafety&skillup-gradationtraininginthelastyear? A. Permanent Employees B. PermanentWomenEmployees C. Casual / Temporary / Contractual Employees D. Employees with Disabilities
All employees of the Company (Permanent men, Permanent women and Contractual employees) are covered by skill upgradation training programmes conducted through “Sundaram Learning”.
All the employees of the Company at Head Office have been given fire and other safety training while first-aid training had been given to selected employees at HO and at branches.
Principle 4: Businesses should respect the interests of, and be responsive towards all stakeholders, especially those who are disadvantaged, vulnerable and marginalized.
1. Has the company mapped its internal and external stakeholders? Yes/No
No.
2. Out of the above, has the company identified the disadvantaged, vulnerable & marginalized stakeholders.
Not Applicable
3. Are there any special initiatives taken by the company to engage with the disadvantaged, vulnerable and marginalized stakeholders. If so, provide details thereof, in about 50 words or so.
Not Applicable
Principle 5: Businesses should respect and promote human rights
1. Does the policy of the company on human rights cover only the company or extend to the Group / Joint Ventures / Suppliers / Contractors / NGOs / Others?
This is covered under our Policies on Business Responsibility Report.
https://www.sundaramfinance.in/assets/app_docs/investor-info/corporate_governance/policies/policies_on_brr.pdf
2. How many stakeholder complaints have been received in the past financial year and what percent was satisfactorily resolved by the management?
Refer Serial no.2 of Principle 1.
Principle 6: Business should respect, protect and make efforts to restore the environment
1. Does the policy related to Principle 6 cover only the company or extends to the Group / Joint Ventures / Suppliers / Contractors / NGOs / others.
Not Applicable
2. Does the company have strategies / initiatives to address global environmental issues such as climate change, global warming, etc? Y/N. If yes, please give hyperlink for webpage etc.
Not Applicable
3. Does the company identify and assess potential environmental risks? Y / N
Not Applicable
4. Does the company have any project related to Clean Development Mechanism? If so, provide details thereof, in about 50 words or so. Also, if Yes, whether any environmental compliance report is filed?
Please refer to Annual Report on CSR Activities.

Sundaram Finance Limited
40
5. Has the company undertaken any other initiatives on – clean technology, energy efficiency, renewable energy, etc. Y / N. If yes, please give hyperlink for web page etc.
Please refer to Annual Report on CSR Activities.
6. AretheEmissions/WastegeneratedbythecompanywithinthepermissiblelimitsgivenbyCPCB/SPCBforthefinancialyearbeingreported?
Not Applicable.
7. Number of show cause / legal notices received from CPCB / SPCB which are pending (i.e. not resolved to satisfaction) as on end of Financial Year.
Not Applicable.
Principle 7: Businesses, when engaged in influencing public and regulatory policy, should do so in a responsible manner
1. Is your company a member of any trade and chamber or association? If Yes, Name only those major ones that your business deals with:
A. Madras Chamber of Commerce & Industry B. Finance Companies’ Association (India) C. Finance Industry Development Council
2. Have you advocated / lobbied through above associations for the advancement or improvement of public good? Yes / No; if yes specify the broad areas (drop box: Governance and Administration, Economic Reforms, Inclusive Development Policies, Energy security, Water,FoodSecurity,SustainableBusinessPrinciples,Others)
Yes. Representations had been submitted to the Government and Regulatory Authorities on various matters for the improvement of public good.
Principle 8: Businesses should support inclusive growth and equitable development
1. Does the company have specified programmes / initiatives / projects in pursuit of the policy related to Principle 8? If yes details thereof.
Not Applicable.
2. Are the programmes / projects undertaken through in-house team / own foundation / external NGO / government structures / any other organization?
Not Applicable.
3. Have you done any impact assessment of your initiative? Not Applicable.
4. What isyourcompany’sdirectcontribution tocommunitydevelopmentprojects-Amount inINRand thedetailsof theprojectsundertaken.
Amount spent `14,04.87 lakhs. Please refer to Annual Report on CSR Activities for details.
5. Have you taken steps to ensure that this community development initiative is successfully adopted by the community? Please explain in 50 words, or so.
Please refer to Annual Report on CSR Activities.
Principle 9: Businesses should engage with and provide value to their customers and consumers in a responsible manner
1. Whatpercentageofcustomercomplaints/consumercasesarependingasontheendoffinancialyear. Nil.
2. Does the company display product information on the product label, over and above what is mandated as per local laws? Yes / No / N.A. / Remarks (additional information)
Not Applicable.
3. Is there any case filed by any stakeholder against the company regarding unfair trade practices, irresponsible advertising and / or anti-competitive behaviour during the last five years and pending as on end of financial year. If so, provide details thereof, in about 50 words or so.
No.
4. Did your company carry out any consumer survey / consumer satisfaction trends? Yes, this is done periodically.

Annual Report2018-1941
Form No. MR-3Secretarial Audit Report for the Financial Year ended 31.03.2019
[Pursuant to section 204(1) of the Companies Act, 2013 and Rule No.9 of the Companies
(Appointment and Remuneration of Managerial Personnel) Rules, 2014]
To.
The Members,
SUNDARAM FINANCE LIMITED
(CIN: L65191TN1954PLC002429)
21, Patullos Road, Chennai-600002.
I have conducted the secretarial audit of the compliance of applicable statutory provisions and the adherence to good corporate practices
by M/s. SUNDARAM FINANCE LIMITED (hereinafter called the Company). Secretarial Audit was conducted in a manner that provided me
a reasonable basis for evaluating the corporate conducts/statutory compliances and expressing my opinion there on.
Based on my verification of M/s. SUNDARAM FINANCE LIMITED’s books, papers, minute books, forms and returns filed and other records
maintained by the Company and also the information provided by the Company, its officers, agents and authorized representatives during
the conduct of secretarial audit, I hereby report that in my opinion, the Company has, during the audit period covering the financial year
ended on 31.03.2019 complied with the statutory provisions listed hereunder and also that the Company has proper Board-processes and
compliance-mechanism in place to the extent, in the manner and subject to the reporting made hereinafter:
I have examined the books, papers, minute books, forms and returns filed and other records maintained by M/s. SUNDARAM FINANCE
LIMITED (“the Company”) for the financial year ended on 31.03.2019 according to the provisions of:
(i) The Companies Act, 2013 (the Act) and the rules made there under;
(ii) The Securities Contracts (Regulation) Act, 1956 (‘SCRA’) and the rules made there under;
(iii) The Depositories Act, 1996 and the Regulations and Bye-laws framed there under;
(iv) Foreign Exchange Management Act, 1999 and the rules and regulations made thereunder to the extent of Foreign Direct Investment,
Overseas Direct Investment and External Commercial Borrowings;
(v) The following Regulations and Guidelines prescribed under the Securities and Exchange Board of India Act, 1992 (‘SEBI Act’):- (to
the extent applicable)
(a) The Securities and Exchange Board of India (Substantial Acquisition of Shares and Takeovers) Regulations, 2011;
(b) The Securities and Exchange Board of India (Prohibition of Insider Trading) Regulations, 2015;
(c) The Securities and Exchange Board of India (Issue of Capital and Disclosure Requirements) Regulations, 2009/2018;
(d) The Securities and Exchange Board of India (Issue and Listing of Debt Securities) Regulations, 2008;
(e) The Securities and Exchange Board of India (Registrars to an Issue and Share Transfer Agents) Regulations, 1993 regarding
the Companies Act, dealing with client and ESOP;
(f) The Securities and Exchange Board of India (Share Based Employee Benefits) Regulations, 2014;
Annexure - VI (i)

Sundaram Finance Limited
42
(vi) Reserve Bank of India Act, 1934 and RBI Directions and Guidelines as applicable to the NBFCs.
I have also examined compliance with the applicable Regulations and standards of the following:
i. Listing Agreements entered into by the Company with the National Stock Exchange of India Limited as per the Securities and
Exchange Board of India (Listing Obligations and Disclosure Requirements) Regulations, 2015; and
ii. Secretarial Standards (SS-1) for Board Meeting and Secretarial Standards (SS-2) for General Meeting issued by The Institute
of Company Secretaries of India.
During the period under review the Company has complied with the provisions of the Act, Rules, Regulations, Guidelines, Standards, etc.
mentioned above subject to the following Observations:
NIL
I further report that the Board of Directors of the Company is duly constituted with proper balance of Executive Directors, Non-Executive
Directors and Independent Directors and there were no changes in the composition of the Board of Directors during the period under review.
Adequate notice is given to all directors to schedule the Board Meetings, agenda and detailed notes on agenda were sent at least seven days
in advance, and a system exists for seeking and obtaining further information and clarifications on the agenda items before the meeting and
for meaningful participation at the meeting. As per the minutes of the meetings duly recorded and signed by the Chairman, the decisions
of the Board were unanimous and no dissenting views have been recorded.
I further report that there are adequate systems and processes in the Company commensurate with the size and operations of the Company
to monitor and ensure compliance with applicable laws, rules, regulations and guidelines.
I further report that during the audit period the company has;
a) issued Redeemable Non-Convertible Debentures on various dates on private placement basis.
b) redeemed the Redeemable Non-Convertible Debentures on various dates.
c) passed a Special Resolution under Regulation 17(1A) of the Securities and Exchange Board of India (Listing Obligations and Disclosure
Requirements) Regulations, 2015 for the continuation of Sri S Ram, as he has attained the age of 75 years, as Non-Executive Director
of the Company from April 01, 2019, vide Annual General Meeting dated 20th July, 2018.
d) passed a Special Resolution under section 186 of the Companies Act, 2013 to make loans to any persons or other bodies corporate,
from time to time, for such amounts, such that the outstanding loans together with investments made, guarantees given and securities
provided by the Company, does not exceed ` 50,000 cr. (Rupees Fifty Thousand Crore Only) vide Annual General Meeting dated
20th July, 2018.
e) passed Special Resolution through postal ballot on 6th December, 2018 under section 180(1)(c) of the Companies Act, 2013
to increase the present limit of Borrowing of the Company from ` 21,000 cr (Rupees Twenty One Thousand Crore Only) to
`30,000 cr (Rupees Thirty Thousand Crore Only).
f) passed a Special Resolution through postal ballot on 21st March, 2019 for Private Placement of debentures under section 42 and
71 of the Companies Act, 2013 up to a sum of `12,000 cr. (Rupees Twelve Thousand Crore Only) during the period from 1st April
2019 to 31st March 2020.
g) passed a Special Resolution through postal ballot on 21st March, 2019 under section 149 and 152 of the Companies Act, 2013,
for re-appointment of Sri P N Venkatachalam, Independent Director, for a further term of 5 (five) consecutive years up
to 31st March 2024.

Annual Report2018-1943
Disclaimer CertificateTo,
The Members,
SUNDARAM FINANCE LIMITED
(CIN: L65191TN1954PLC002429)
21, Patullos Road,
Chennai - 600002.
My report of even date is to be read along with this letter.
1. Maintenance of secretarial record is the responsibility of the management of the company. My responsibility is to express an opinion
on these secretarial records based on my audit.
2. I have followed the audit practices and processes as were appropriate to obtain reasonable assurance about the correctness of the
contents of the Secretarial records. The verification was done on test basis to ensure that correct facts are reflected in secretarial
records. I believe that the processes and practices, we followed provide a reasonable basis for my opinion.
3. I have not verified the correctness and appropriateness of financial records and Books of Accounts of the company.
4. Whereeverrequired, Ihaveobtained theManagementrepresentationabout thecomplianceof laws,rulesandregulationsand
happening of events etc.
5. The compliance of the provisions of Corporate and other applicable laws, rules, regulations, standards is the responsibility of
management. My examination was limited to the verification of procedures on test basis.
6. The Secretarial Audit report is neither an assurance as to the future viability of the company nor of the efficacy or effectiveness with
which the management has conducted the affairs of the company.
Place : Chennai Name : M. DAMODARAN
Date : 24.05.2019 FCS No. : 5837
C.P. No. : 5081
h) passed a Special Resolution through postal ballot on 21st March, 2019 under section 149 and 152 of the Companies Act, 2013, for
re-appointment of Sri S Prasad, Independent Director, for a further term of 5 (five) consecutive years up to 31st March 2024.
i) passed a Special Resolution through postal ballot on 21st March, 2019 under section 149 and 152 of the Companies Act, 2013, for
re-appointment of Ms. Shobhana Ramachandhran, Independent Director, for a further term of 5 (five) years up to 31st March 2024.
j) passed a Special Resolution through postal ballot on 21st March, 2019 under section 149 and 152 of the Companies Act, 2013, for
re-appointment of Sri S Mahalingam, Independent Director, for a further term of 5 (five) years up to 25th May 2024.
k) passed an Ordinary Resolution through postal ballot on 21st March, 2019 under section 196, 197 and 203 of the Companies Act,
2013, for re-appointment of Sri A N Raju, Director (Operations), for a term of 5 (five) years up to 31st March 2024.
Place : Chennai Name : M. DAMODARAN
Date : 24.05.2019 FCS No. : 5837
C.P. No. : 5081

Sundaram Finance Limited
44
Secretarial Compliance Report of Sundaram Finance Limited for the year ended 31.03.2019
I, M. Damodaran have examined: a) all the documents and records made available to us and explanation provided by Sundaram Finance Limited (“the listed entity”), b) the filings/ submissions made by the listed entity to the stock exchanges, c) website of the listed entity, d) any other document/ filing, as may be relevant, which has been relied upon to make this certification, for the year ended 31.03.2019 in respect of compliance with the provisions of: a) the Securities and Exchange Board of India Act, 1992 (“SEBI Act”) and the Regulations, circulars, guidelines issued there
under; and b) the Securities Contracts (Regulation) Act, 1956 (“SCRA”), rules made there under and the Regulations, circulars, guidelines
issued there under by the Securities and Exchange Board of India (“SEBI”); The specific Regulations, whose provisions and the circulars / guidelines issued thereunder, have been examined, include:- a) Securities and Exchange Board of India (Listing Obligations and Disclosure Requirements) Regulations, 2015; b) Securities and Exchange Board of India (Issue of Capital and Disclosure Requirements) Regulations, 2009/2018; c) Securities and Exchange Board of India (Substantial Acquisition of Shares and Takeovers) Regulations, 2011; d) Securities and Exchange Board of India (Buyback of Securities) Regulations, 2018 – Not Applicable. e) Securities and Exchange Board of India (Share Based Employee Benefits) Regulations, 2014; f) Securities and Exchange Board of India (Issue and Listing of Debt Securities) Regulations, 2008; g) Securities and Exchange Board of India (Issue and Listing of Non-Convertible and Redeemable Preference Shares) Regulations,
2013 – Not Applicable. h) Securities and Exchange Board of India (Prohibition of Insider Trading) Regulations, 2015; i) The Securities and Exchange Board of India (Registrars to an Issue and Share Transfer Agents) Regulations, 1993 regarding
the Companies Act and dealing with client and ESOP; j) Securities and Exchange Board of India (Depositories and Participants) Regulations, 1996/2018 and circulars/ guidelines
issued thereunder; and based on the above examination, I hereby report that, during the Review Period: a) The listed entity has complied with the provisions of the above Regulations and circulars / guidelines issued thereunder to the
extent applicable, except in respect of matters specified below :-
S.No Compliance Requirement (Regulations/ circulars / guidelines including specific clause)
Deviations Observations/ Remarks of the Practicing Company Secretary
NIL NIL NIL b) The listed entity has maintained proper records under the provisions of the above Regulations and circulars / guidelines issued
there under insofar as it appears from my examination of those records. c) The following are the details of actions taken against the listed entity/ its promoters/ directors/ material subsidiaries either by
SEBI or by Stock Exchanges - (including under the Standard Operating Procedures issued by SEBI through various circulars) under the aforesaid Acts/ Regulations and circulars/ guidelines issued thereunder:
Sr. No. Action taken by Details of violation Details of action taken E.g. fines, warning
letter, debarment, etc.
Observations/ remarks of the Practicing Company Secretary,
if any.
Not Applicable d) The listed entity has taken the following actions to comply with the observations made in previous reports:
Sr. No.
Observations of the Practicing Company Secretary in the
previous reports
Observations made in the secretarial compliance
report for the year ended
Actions taken by the listed entity, if any
Comments of the Practicing Company Secretary on the actions
taken by the listed entity
Not ApplicablePlace : Chennai Name : M. DAMODARANDate : 24.05.2019 FCS No. : 5837 C.P. No. : 5081
Annexure - VI (ii)

Annual Report2018-1945
Disclosure pursuant to Rule 5 of Companies (Appointment and Remuneration of Managerial Personnel) Rules, 2014
(i) & (ii) The ratio of the remuneration of each Director to the median and mean remuneration of the employees of the company for the financial year
and the percentage increase in remuneration of each director, Chief Financial Officer, Chief Executive Officer, Company Secretary or Manager,
if any, in the financial year:
Names of the Directors /
Key Managerial Personnel
Ratio to Median
Remuneration
(times)
Ratio to Mean
Remuneration
(times)
Inc / Dec in
Remuneration
S Viji, Chairman 1.72 1.34 0.00%
S Ram 1.72 1.34 0.00%
N Venkataramani 1.66 1.28 0.00%
P N Venkatachalam 2.60 2.02 4.97%
S Mahalingam 2.40 1.86 -1.68%
S Prasad 3.41 2.65 20.23%
S Ravindran 2.78 2.16 -1.45%
Ms Shobhana Ramachandhran 2.76 2.14 0.00%
Sri Rajiv C Lochan 2.48 1.92 3.42%
T T Srinivasaraghavan, Managing Director 78.46 60.81 3.37%
Harsha Viji, Deputy Managing Director 60.65 47.00 8.64%
A N Raju, Director (Operations) 44.23 34.28 18.94%
M Ramaswamy, Chief Financial Officer 32.77 25.39 27.13%
P Viswanathan, Secretary & Compliance Officer 20.65 16.00 39.72%
(iii) The percentage increase in the median remuneration of employees in the financial year: 16%
(iv) The number of permanent employees on the rolls of the Company: 4,055
(v) Average percentile increase already made in the salaries of employees other than the managerial personnel in the last financial year and its
comparison with the percentile increase in the managerial remuneration and justification thereof and point out if there are any exceptional
circumstances for increase in the managerial remuneration:
The average increase in salaries of employees other than managerial personnel in 2018-19 was 15.84%. Percentage increase in the managerial
remuneration for the year was 12.84%.
(vi) Affirmation that the remuneration is as per the remuneration policy of the company.
The Company affirms that remuneration is as per the remuneration policy of the Company.
Annexure - VII

Sundaram Finance Limited
46
(vii) Names of top ten employees in terms of remuneration drawn during the year 2018-19
Sl. No.
Name of the Employee
Designation Remu-neration (` in cr)
Nature of Employement
Qualification and Experience
Date of Commencement of Employment
Age Last employment
Relative of any
director
1 Sri T. T. Srinivasaraghavan
Managing Director
4.91 Contractual BCom, MBA (Gannon University, Pennsylvania) Has 4 decades of experience in Banking and Financial Services industry. He is the Managing Director of the Company since 2003.
02-09-1996 64 G.E. Capital Services India Limited
–
2 Sri Harsha Viji Deputy Managing Director
3.81 Contractual BCom, ACA,MBA (Ann Arbor, Michigan)Nearly 2 decades experience in areas of specialisation particularly, strategy formulation, joint venture negotiations, new business development etc.
14-11-2005 43 Mckinsey & Company
Son of Sri S. Viji, Chairman
3 Sri A.N. Raju Director (Operations)
2.80 Contractual BSc (Engineering) MBAHas over 3 decades of experience in Automobiles, Engineering and Financial Sector.
02-07-1997 59 G.E. Capital Services India Limited
–
4 Sri M. Ramaswamy Chief Financial Officer
2.07 Others B.Sc. Statistics, ACAHas over 3 decades of experience in accounts, taxation and treasury in finance services Industry.
07-06-1986 57 Brahmayya & Co.
–
5 Sri P. Viswanathan Secretary & Compliance Officer
1.32 Others B.Com, FCSHas over 4 decades of experience in statutory compliance in financial services industry
01-10-1982 63 Lakshmi General Finance Limited
–
6 Sri V. Ananthanarayanan
Chief Information Officer
0.70 Others M.Sc., Statistics and Computer Applications, MBA, IT & Finance
Has over 3 decades of experience in Information Technology Industry
02-12-2013 56 Aegis Limited –
7 Sri S Sridhar VP & Head - Treasury
0.64 Others B.Sc.(Maths),ACA,ICWA
Nearly 3 decades of experience in accounts, taxation and treasury in finance services Industry.
25-04-2011 50 Sundaram Business Services Limited
–
8 Sri S. Ravindran Senior Vice President & Head - CCPD
0.62 Others B.Com, M.Com, CAIIB
Has over 4 decades experience in financial services industry
25-05-1984 65 Bank of India –
9 Sri Rajesh Venkat Vice President - Operations
0.62 Others B.A (Economics), MBA
Nearly 2 decades experience in financial services industry
01-07-2017 44 Sundaram Business Services Limited
–
10 Sri S. Srinivasan Senior Vice President & Head - Corporate Finance
0.61 Others B.Com,ICWA
Has over 3 decades of experience in financial services industry
01-04-1983 57 – –

Annual Report2018-1947
Annexure - VIII
Disclosure under Rule 12 (9) of the Companies (Share Capital and Debentures) Rules, 2014 read with Clause 14 of the SEBI (Share Based Employee Benefits)
Regulations, 2014
"The Sundaram Finance Employee Stock Options Scheme-2008 (the Scheme) came into existence with effect from 24th July 2008, pursuant
to the approval obtained from the shareholders. The scheme was framed with the object of granting equity stock options not exceeding
1% of the paid-up capital of the Company (adjusted for corporate actions, if any) in one or more tranches, to eligible employees and
Directors of the Company and its subsidiaries. The Scheme is being administered by the Nomination, Compensation and Remuneration
Committee(NCRC),throughtheSundaramFinanceEmployeesWelfareTrust.
Accordingly, the Board of Directors grants Stock Options at par to the eligible employees / Directors of the Company and its subsidiaries
based on the recommendations of the NCRC.
S. No Particulars Sundaram Finance Employee Stock Option Scheme-2008
a) Options Granted from the introduction of the Scheme 1,99,700
b) Exercise Price `10/- per share (at par)
c) Options vested 1,60,950
d) Options exercised 1,60,950
e) The total number of shares arising as a result of exercise
of Option.
1,60,950
f) Options lapsed NIL
g) Variation of terms of Options Not Applicable
h) Money realized by exercise of Option (Amount `) 16,09,500
i) Total number of Options in force 38,750
j) Employee-wise details of Options granted on 25th May 2018 (Grant 10) & 30th May 2019 (Grant 11)
i) Key Managerial Personnel 1. Sri. A N Raju, Director (Operations) 5,000
2. Sri. M Ramaswamy, Chief Financial Officer 5,000
3. Sri. P Viswanathan, Secretary & Compliance
Officer
4,000
ii) Any other employee who receives a grant in any one
year of Option amounting to 5% or more of Option
granted during that year/s:
1. Sri Srinivas Acharya, Managing Director,
Sundaram BNP Paribas Home Finance Limited
2,500
iii) Identified employees who were granted Option,
during any one year, equal to or exceeding 1% of the
issued capital (excluding outstanding warrants and
conversions) of the Company at the time of grant.
Not Applicable
Other details relating to stock options granted have been furnished vide Note No. 37 forming part of the Notes to the Accounts.

Sundaram Finance Limited
48
Form No. MGT-9Extract of Annual Return
as on the financial year ended on 31st March 2019(Pursuant to Section 92 (3) of the Companies Act, 2013 and rule 12 (1) of the Companies (Management and Administration) Rules, 2014)
I. REGISTRATION AND OTHER DETAILS
(i) CIN L65191TN1954PLC002429(ii) Registration Date 11th August 1954(iii) Name of the Company Sundaram Finance Limited (iv) Category / Sub-Category of the Company Public Company / NBFC (v) Address of the Registered Office and contact details 21, Patullos Road, Chennai 600 002
Tel: 044 2852 1181 Fax: 044 2858 6641 www.sundaramfinance.in Email: [email protected]
(vi) WhetherListedCompanyYes/No Yes(vii) Name, Address and Contact details of Registrar and
Transfer Agent, if any M/s. Cameo Corporate Services Ltd. 'Subramanian Building' No.1, Club House Road, Chennai 600 002 Ph: 044 2846 0390 to 0395 Email: [email protected]
II. PRINCIPAL BUSINESS ACTIVITIES OF THE COMPANY All the business activities contributing 10% or more of the total turnover of the company shall be stated
Name and Description of main products / services
NIC Code of the Product / Service % to total turnover of the company
NBFC engaged in Asset Financing and other financial services
As per National Industrial Classification – 2008: Section K - Financial and Insurance Activities Division 64 – Financial service activities, except insurance and pension funding.
97.74%
Annexure - IX
III. PARTICULARS OF HOLDING, SUBSIDIARY AND ASSOCIATE COMPANIES
Sl. No.
Name and Address of the Company CIN / GLN Holding / Subsidiary / Associate
% of shares held
Applicable Section
1 Sundaram BNP Paribas Home Finance Limited Regd. Office: 21, Patullos Road, Chennai 600 002
U65922TN1999PLC042759 Subsidiary 50.10 2 (87) (ii)
2 Sundaram Asset Management Company Limited Regd. Office: 21, Patullos Road, Chennai 600 002
U93090TN1996PLC034615 Subsidiary 100.00 2 (87) (ii)
3 Sundaram Asset Management Singapore Pte. Limited Not Applicable Subsidiary 100.00 2 (87) (ii)4 Sundaram Alternate Assets Limited
Regd. Office: 21, Patullos Road, Chennai 600 002U65990TN2018PLC120641 Subsidiary 100.00 2 (87) (ii)
5 Sundaram Trustee Company Limited Regd. Office: 21, Patullos Road, Chennai 600 002
U65999TN2003PLC052058 Subsidiary 100.00 2 (87) (ii)
6 LGF Services Limited Regd. Office: 21, Patullos Road, Chennai 600 002
U67190TN2004PLC052384 Subsidiary 100.00 2 (87) (ii)
7 Sundaram BNP Paribas Fund Services Limited Regd. Office: 21, Patullos Road, Chennai 600 002
U67120TN2008PLC068388 Subsidiary 51.00 2 (87) (ii)
8 Royal Sundaram General Insurance Co Limited* Regd. Office: 21, Patullos Road, Chennai 600 002
U67200TN2000PLC045611 Associate 50.00 2 (6)
9 Sundaram Finance Holdings Limited Regd. Office: 21, Patullos Road, Chennai 600 002
U67120TN1993PLC025996 Associate 26.47 2 (6)
* with effect from 23rd February 2019

Annual Report2018-1949
IV. SHARE HOLDING PATTERN (Equity Share Capital Breakup as percentage of Total Equity)(i) Category-wise Share Holding (as submitted to Stock Exchange)
Category of Shareholders No. of shares held at the beginning of the year No. of shares held at the end of the year % Change during the
yearDemat Physical Total % of Total
SharesDemat Physical Total % of Total
Shares
A. Promoters
(1) Indian
(a) Individual / HUF 2,75,66,908 97,292 2,76,64,200 24.90 2,82,93,803 8,286 2,83,02,089 25.47 0.57
(b) Central Govt – – – – – – – – –
(c) State Govt(s) – – – – – – – – –
(d) Bodies Corp. 1,11,85,738 – 1,11,85,738 10.07 1,11,85,738 – 1,11,85,738 10.07 0.00
(e) Banks / FI – – – – – – – – –
(f) Any Other …. – – – – – – – – –
Sub-Total (A)(1) 3,87,52,646 97,292 3,88,49,938 34.97 3,94,79,541 8,286 3,94,87,827 35.54 0.57
(2) Foreign
(a) NRIs - Individuals 10,95,856 – 10,95,856 0.99 10,27,480 – 10,27,480 0.92 -0.07
(b) Other - Individuals – – – – – – – – –
(c) Bodies Corp. – – – – – – – – –
(d) Banks / FI – – – – – – – – –
(e) Any Other …. – – – – – – – – –
Sub-Total (A)(2) 10,95,856 – 10,95,856 0.99 10,27,480 – 10,27,480 0.92 -0.07
Total shareholding of Promoter (A)= (A)(1)+(A)(2)
3,98,48,502 97,292 3,99,45,794 35.95 4,05,07,021 8,286 4,05,15,307 36.47 0.52
B. Public Shareholding
(1) Institutions
(a) Mutual Funds 1,10,71,904 – 1,10,71,904 9.97 1,08,27,459 – 1,08,27,459 9.75 -0.22
(b) Banks / FI 28,194 800 28,994 0.03 13,832 600 14,432 0.01 -0.02
(c) Central Govt – – – – – – – – –
(d) State Govt(s) – – – – – – – – –
(e) Venture Capital Funds – – – – – – – – –
(f) Alternate Investment Funds 44,137 – 44,137 0.04 45,313 – 45,313 0.04 0.00
(g) Insurance Companies 19,80,700 – 19,80,700 1.78 19,80,652 – 19,80,652 1.78 0.00
(h) FIIs & FPIs 66,21,004 100 66,21,104 5.96 80,05,401 100 80,05,501 7.21 1.25
(i) Foreign Venture Capital
Investors
– – – – – – – – –
(j) Any Other - Foreign Portfolio
Investors
– – – – – – – – –
Sub-Total (B)(1) 1,97,45,939 900 1,97,46,839 17.78 2,08,72,657 700 2,08,73,357 18.79 1.01

Sundaram Finance Limited
50
Category of Shareholders No. of shares held at the beginning of the year No. of shares held at the end of the year % Change during the
yearDemat Physical Total % of Total
SharesDemat Physical Total % of Total
Shares
2. Non-Institutions
(a) Bodies Corporate
(i) Indian 1,03,41,021 6,500 1,03,47,521 9.31 1,04,82,035 4,750 1,04,86,785 9.44 0.13
(ii) Overseas – – – – – – – – –
(b) Individuals
i Individual shareholders
holding nominal shares
capital up to `1 lakh
91,72,230 18,04,837 1,09,77,067 9.88 83,48,091 12,30,138 95,78,229 8.62 -1.26
ii Individual shareholders
holding nominal shares
capital in excess of `1 lakh
2,52,24,818 37,08,647 2,89,33,465 26.04 2,06,77,186 27,00,208 2,33,77,394 21.04 -5.00
Non Resident Indian 27,02,381 2,98,748 30,01,129 2.70 45,89,276 2,50,980 48,40,256 4.36 1.66
Resident Hindu Undivided
Family
5,11,368 2 5,11,370 0.46 3,64,537 14,002 3,78,539 0.34 -0.12
Foreign National 18,720 – 18,720 0.02 18,720 – 18,720 0.02 0.00
Trust - Sundaram Finance
EmployeesWelfareTrust
9,79,510 – 9,79,510 0.88 9,60,960 – 9,60,960 0.86 -0.02
Other Trusts 5,626 – 5,626 0.01 6,125 – 6,125 0.01 0.00
Clearing Members 95,989 – 95,989 0.09 4,210 – 4,210 0.00 -0.08
Investor Education and
Protection Fund. No voting
rights in respect of these
shares
26,564 – 26,564 0.02 39,013 – 39,013 0.04 0.01
(c) Others (specify)
Sundaram Finance Limited
Unclaimed Suspense Account.
No voting rights in respect of
these shares
26,765 – 26,765 0.02 24,965 – 24,965 0.02 0.00
Sub-Total (B)(2) 4,58,91,243 55,19,984 5,14,11,227 46.27 4,55,15,118 42,00,078 4,97,15,196 44.75 -1.53
Total Public Shareholding (B)= (B)(1)+(B)(2)
6,56,37,182 55,20,884 7,11,58,066 64.05 6,63,87,775 42,00,778 7,05,88,553 63.53 -0.51
(C) Shares held by Custodian for GDRs and ADRs
– – – – – – – – –
GRAND TOTAL (A)+(B)+(C) 10,54,85,684 56,18,176 11,11,03,860 100.00 10,68,94,796 42,09,064 11,11,03,860 100.00 –

Annual Report2018-1951
ii) Shareholding of promoters
Sl. No.
Shareholder's Name Shareholding at the beginning of the year Shareholding at the end of the year % change in shareholding
during the year
No. of shares % of total shares of the
company
% of shares pledged /
encumbered to total shares
No. of shares % of total shares of the
company
% of shares pledged /
encumbered to total shares
1 Mr Ashwathanarayan Ramji & Mr Narayanan Ramji
600 0.00 – 600 0.00 – 0.00
2 Mr Narayanan Ramji &
Ashwathanarayan Ramji
56,520 0.05 – 88,012 0.08 – 0.03
3 Mr Narayanan Ramji &
Ashwathanarayan Ramji
6,884 0.01 – – 0.00 – -0.01
4 Mr Narayanan Ramji &
Miss Aishwarya Ramji
6,884 0.01 – 6,884 0.01 – 0.00
5 Mr Narayanan Ramji &
Ashwathanarayan Ramji
1,008 0.00 – – 0.00 – 0.00
6 Mr Narayanan Ramji &
Miss Aishwarya Ramji
1,008 0.00 – 1,008 0.00 – 0.00
7 Mr N Ramji & Mrs Sharmila Ramji 788 0.00 394 0.00 0.00
8 Mr Narayanan Ramji & Mrs Sharmila
Ramji
– 0.00 – 394 0.00 – 0.00
9 Mr Narayanan Ramji &
Ashwathanarayan Ramji
23,600 0.02 – – 0.00 – -0.02
10 Mr Srinivas Raghavan 27,040 0.02 – 27,040 0.02 – 0.00
11 Mr Akshay Krishnan 2,00,300 0.18 – 1,97,770 0.18 – 0.00
12 Mr Jaideep Chakravarthy 3,80,756 0.34 – 3,80,756 0.34 – 0.00
13 Mr Pradeep Chakravarthy 3,63,544 0.33 – 3,63,544 0.33 – 0.00
14 Mr S Chakravarthy 6,08,884 0.55 – 6,08,884 0.55 – 0.00
15 Mrs Anuradha Raghavan 3,97,264 0.36 – 3,97,264 0.36 – 0.00
16 Mr S Raghavan 1,03,492 0.09 – 1,03,492 0.09 – 0.00
17 Mrs Usha Raghavan 5,89,992 0.53 – 5,89,992 0.53 – 0.00
18 Mr Barath Rengarajan 4,68,259 0.42 – 4,61,484 0.42 – -0.01
19 Mrs Saraswathi Srinivasan 3,04,320 0.27 – 0 0.00 – -0.27
21 Mr S Ram & Mr S Viji 12,25,160 1.10 – 0 0.00 – -1.10
22 Mr Sumanth Ramanujam 8,862 0.01 – 96,914 0.09 – 0.08
23 Mr K Vasudevan 2,87,492 0.26 – 2,87,492 0.26 – 0.00
24 Mrs Lily Vijayaraghavan &
Mrs Sashi Parthasarathy
3,53,312 0.32 – 3,45,712 0.31 – -0.01
25 Mr K Vasudevan &
Mrs Lakshmi Vasudevan
46,392 0.04 – 46,392 0.04 – 0.00

Sundaram Finance Limited
52
Sl. No.
Shareholder's Name Shareholding at the beginning of the year Shareholding at the end of the year % change in shareholding
during the year
No. of shares % of total shares of the
company
% of shares pledged /
encumbered to total shares
No. of shares % of total shares of the
company
% of shares pledged /
encumbered to total shares
26 Mrs Lakshmi Vasudevan 2,74,816 0.25 – 2,74,816 0.25 – 0.00
27 Mr Sharath Vijayaraghavan (HUF) 2,09,000 0.19 – 2,09,000 0.19 – 0.00
28 Mrs Lily Vijayaraghavan 6,35,436 0.57 – 6,35,436 0.57 – 0.00
29 Mrs Lily Vijayaraghavan &
Mr Badri Vijayaraghavan
1,97,776 0.18 – 1,97,776 0.18 – 0.00
30 Mrs Lily Vijayaraghavan &
Mr Sharath Vijayaraghavan
1,97,776 0.18 – 1,97,776 0.18 – 0.00
31 Mrs Rama Sridharan 55,920 0.05 – 55,920 0.05 – 0.00
32 Mr N Krishnan 1,01,592 0.09 – 1,01,592 0.09 – 0.00
33 Mr N Krishnan (HUF) 1,01,592 0.09 – 1,01,592 0.09 – 0.00
34 Mr Ananth Krishnan 2,00,300 0.18 – 1,97,770 0.18 – 0.00
35 Mr Shreen Raghavan 94,892 0.09 – 94,892 0.09 – 0.00
36 Mrs Dangety Krishnakumari 20,412 0.02 – 20,412 0.02 – 0.00
37 Mr Dangety Satyanarayanamurty 2,912 0.00 – 2,912 0.00 – 0.00
38 M/S. Rohini Holdings Private Limited 12,94,362 1.17 – 12,94,362 1.17 – 0.00
39 M/S. Allegro Holdings Private Limited 12,47,100 1.12 – 12,47,100 1.12 – 0.00
40 M/S. Silver Oak Holdings Private
Limited
14,36,914 1.29 – 14,36,914 1.29 – 0.00
41 M/S. Azorius Holdings Private Limited 8,50,156 0.77 – 8,50,156 0.77 – 0.00
42 M/S. Uthirattadhi Sriram Holdings
Private Limited
14,79,560 1.33 – 14,79,560 1.33 – 0.00
43 M/S. Maham Holdings Limited 5,12,720 0.46 – 5,12,720 0.46 – 0.00
44 M/S. Revathi Holdings Private Limited 12,20,460 1.10 – 12,20,460 1.10 – 0.00
45 M/S. Padmalakshmi Holdings Private
Limited
12,92,832 1.16 – 12,92,832 1.16 – 0.00
46 M/S. Raghuvamsa Holdings Private
Limited
18,51,634 1.67 – 18,51,634 1.67 – 0.00
47 Mrs Indira Krishnaswami 1,62,180 0.15 – 1,62,180 0.15 – 0.00
48 Mr Narayanan Ramji 1,06,760 0.10 – 1,06,760 0.10 – 0.00
49 Mr R. Ramanujam &
Mr R. Srikanth
1,77,088 0.16 – 1.77,088 0.16 – 0.00
50 Mr Ananth Ramanujam 5,69,892 0.51 – 5.81,576 0.52 – 0.01
51 Mr T.T. Rangaswamy,
Mr T.T. Venkatraghavan &
Mr T.T. Srinivasaraghavan
48,628 0.04 – 48,628 0.04 – 0.00

Annual Report2018-1953
Sl. No.
Shareholder's Name Shareholding at the beginning of the year Shareholding at the end of the year % change in shareholding
during the year
No. of shares % of total shares of the
company
% of shares pledged /
encumbered to total shares
No. of shares % of total shares of the
company
% of shares pledged /
encumbered to total shares
52 Mr T.T. Rangaswamy,
Mr T.T. Narendran &
Mr T.T. Hayagreevan
49,200 0.04 – 49,200 0.04 – 0.00
53 Mr T T Srinivasaraghavan
Mrs Vimala Rangaswamy &
Mrs Bagyam Raghavan
85,084 0.08 – 85,084 0.08 – 0.00
54 Mrs Bagyam Raghavan &
Mr T T Venkatraghavan
1,13,308 0.10 – 1,13,308 0.10 – 0.00
55 Mr T T Narendran,
Mrs Vimala Rangaswamy &
Mrs Padmini Narendran
1,62,988 0.15 – 1,62,988 0.15 – 0.00
56 Mrs Padmini Narendran &
Mr T T Hayagreevan
1,06,044 0.10 – 1,06,044 0.10 – 0.00
57 Mrs Vimala Rangaswamy,
Mr T T Narendran &
Mrs Padmini Narendran
95,024 0.09 – 95,024 0.09 – 0.00
58 Mr Srivats Ram 17,01,322 1.53 – 17,01,322 1.53 – 0.00
59 Mr Srikanth Ramanujam 9,14,052 0.82 – 9,14,052 0.82 – 0.00
60 Mr Sriram Viji 12,78,620 1.15 – 12,78,620 1.15 – 0.00
61 Mr R. Ramanujam 2,32,534 0.21 – 2,32,534 0.21 – 0.00
62 Mrs Rupa Srikanth 70,188 0.06 – 70,188 0.06 – 0.00
63 Mr Srikanth Ramanujam &
Mrs Rupa Srikanth
4,472 0.00 – 4,472 0.00 – 0.00
65 Mrs Choodamani Narayanan 5,03,094 0.45 – 5,08,154 0.46 – 0.00
67 Mrs Prema Ramanujam 6,43,412 0.58 – 6,43,412 0.58 – 0.00
68 Mrs Aruna Sankaranarayanan 56,840 0.05 – 56,840 0.05 – 0.00
69 Mr S. Ram 5,06,788 0.46 – 5,06,788 0.46 – 0.00
70 Mr Harsha Viji 13,66,068 1.23 – 16,91,704 1.52 – 0.29
71 Mr Aditya S. Ramanujam 2,21,882 0.20 – 2,61,548 0.24 – 0.04
72 Mr S. Viji 9,09,780 0.82 – 9,09,780 0.82 – 0.00
73 Mrs Vijaya Rangarajan 9,03,564 0.81 – 10,86,265 0.98 – 0.16
74 Mr Sriram Viji &
Mrs Chitra Viji
3,156 0.00 – 3156 0.00 – 0.00
75 Mr R. Ramanujam &
Mr Ananth Ramanujam
25,600 0.02 – 25,600 0.02 – 0.00

Sundaram Finance Limited
54
Sl. No.
Shareholder's Name Shareholding at the beginning of the year Shareholding at the end of the year % change in shareholding
during the year
No. of shares % of total shares of the
company
% of shares pledged /
encumbered to total shares
No. of shares % of total shares of the
company
% of shares pledged /
encumbered to total shares
76 Mr Harsha Viji &
Mrs Chitra Viji
3,156 0.00 – 3,156 0.00 – 0.00
77 Mrs Nivedita Ram 16,49,516 1.48 – 16,49,516 1.48 – 0.00
78 Mrs Chitra Viji 8,34,034 0.75 – 8,34,034 0.75 – 0.00
79 Mrs Gita Ram 11,39,680 1.03 – 11,39,680 1.03 – 0.00
80 Mr S. Viji &
Mrs Chitra Viji
8,684 0.01 – 8,684 0.01 – 0.00
81 Mr Arjun Rangarajan 13,08,270 1.18 – 13,08,270 1.18 – 0.00
82 Mr R. Ramanujam (HUF) 9,992 0.01 – 9,992 0.01 – 0.00
83 Mr Srikanth Ramanujam (HUF) 8,000 0.01 – 8,000 0.01 – 0.00
84 Mr Srivats Ram (HUF) 77,200 0.07 – 77,200 0.07 – 0.00
85 Mr S. Viji (HUF) 1,13,988 0.10 – 1,13,988 0.10 – 0.00
86 Mr S. Viji (HUF) 3,65,924 0.33 – 3,65,924 0.33 – 0.00
88 Mr S. Narayanan 4,600 0.00 – 4,600 0.00 – 0.00
89 Mr Narayanan Ramji (HUF) 4,08,480 0.37 – 1,36,160 0.12 – -0.25
90 Mr Srinivasaraghavan Sundaram 4,000 0.00 – 4,000 0.00 – 0.00
91 Mr A.M. Srinivasan &
Mr S. Kishore
452 0.00 – 452 0.00 – 0.00
92 Mr S. Kishore &
Mr A.M. Srinivasan
1,13,612 0.10 – 1,13,612 0.10 – 0.00
93 Mr Srikanth Ramanujam &
Mr Ananth Ramanujam
8,30,215 0.75 – 8,30,215 0.75 – 0.00
94 Miss Tarika Ram (Minor) 13,490 0.01 – 1,64,380 0.15 – 0.14
95 Miss Tulsi S. Ramanujam 2,19,382 0.20 – 2,67,767 0.24 – 0.04
96 Mr Daya Ambirajan 1,19,650 0.11 – 2,70,539 0.24 – 0.14
97 Master Ranjan Ambirajan 6,744 0.01 – 1,57,633 0.14 – 0.14
98 Mr R. Ramanujam &
Mrs Prema Ramanujam
9,736 0.01 – 9,736 0.01 – 0.00
99 Mr T T Rangaswamy (HUF) 49,324 0.04 – 49,324 0.04 – 0.00
100 Mr T T Srinivasa Raghavan (HUF) 1,23,192 0.11 – 1,23,192 0.11 – 0.00
101 Mr T T Rangaswamy (HUF) 19,368 0.02 – 19,368 0.02 – 0.00
102 Mr T T Narendran (HUF) 95,068 0.09 – 95,068 0.09 – 0.00
103 Mr T T Srinivasaraghavan &
Mr T T Narendran
1,10,000 0.10 – 1,10,000 0.10 – 0.00

Annual Report2018-1955
Sl. No.
Shareholder's Name Shareholding at the beginning of the year Shareholding at the end of the year % change in shareholding
during the year
No. of shares % of total shares of the
company
% of shares pledged /
encumbered to total shares
No. of shares % of total shares of the
company
% of shares pledged /
encumbered to total shares
104 Mr T T Srinivasaraghavan &
Mrs Bagyam Raghavan
1,10,000 0.10 – 1,10,000 0.10 – 0.00
105 Mr T T Narendran &
Mrs Padmini Narendran
90,000 0.08 – 90,000 0.08 – 0.00
106 Mr T T Narendran &
Mrs Padmini Narendran
90,000 0.08 – 90,000 0.08 – 0.00
107 Mrs Vimala Rangaswamy,
Mr T T Srinivasaraghavan &
Mr T T Venkatraghavan
82,664 0.07 – 82,664 0.07 – 0.00
108 Mr A M Srinivasan 120 0.00 – 120 0.00 – 0.00
109 Mr Vishnu Vijayaraghavan 75,984 0.07 – 75,984 0.07 – 0.00
110 Mrs Lakshmi Vijayaraghavan 42,355 0.04 – 42,955 0.04 – 0.00
111 Mr Sharath Vijayaraghavan 1,74,844 0.16 – 1,74,844 0.16 – 0.00
113 Miss Gitanjali Jeevan Jose, Rep By M/G
Mrs Divya Jeevan Jose
10,000 0.01 – 10,000 0.01 – 0.00
114 Master P Siddhartha Jeevan, Rep By
M/G Mrs Divya Jeevan Jose
10,000 0.01 – 10,000 0.01 – 0.00
115 Mr N Krishnan & Mr Akshay Krishnan 3,000 0.00 – 3,000 0.00 – 0.00
116 Mr N Krishnan & Mr Ananth Krishnan 3,000 0.00 – 3,000 0.00 – 0.00
117 Mrs Veena Raghavan 75,000 0.07 – 0 0.00 – -0.07
118 Mr Shreen Raghavan(HUF) 5,115 0.00 5,115 0.00 0.00
119 S Hema 10,34,968 0.93 – 10,34,968 0.93 – 0.00
120 Mrs Kavitha Gorur Keshav &
Mr T T Hayagreevan
10,000 0.01 – 10,000 0.01 – 0.00
121 Miss Nakshatra Hayareevan (Minor) 10,000 0.01 – 10,000 0.01 – 0.00
122 Mr Shriram Vijayaraghavan 1,05,000 0.09 – 1,05,000 0.09 – 0.00
123 Ms Vijaya Rangarajan &
Mr Santhanam Ram
6,09,896 0.55 – 6,09,896 0.55 – 0.00
124 Mr S Ravindran – – – 4,91,360 0.44 0.44
125 Mrs Thanjam Ravindran – – – 5,74,470 0.52 0.52
126 Mr C B Srinivasan – – – 9,600 0.01 0.01
127 Mr Shreyas Ravindran &
Mr Srinivasan Ravindran
– – – 1,36,342 0.12 0.12
128 Ms Sanjana Tara Ramanujam – – – 99,524 0.09 0.09
Total 3,99,45,794 35.95 – 4,05,15,307 36.47 0.51

Sundaram Finance Limited
56
(iii) Change in Promoters' Shareholding (please specify, if there is no change)
Sl. No.
Name of the Promoters
Shareholding at the beginning of the year
Cumulative Shareholding during the year
No. of shares % of total shares of the
company
No. of shares % of total shares of the
company
1 Mr Ananth Ramanujam
At the beginning of the year 5,69,892 0.51
Acquisition - 26th February 2019@ 11,684 0.01 5,81,576 0.52
At the end of the Year 5,81,576 0.52
2 Mr S Ravindran (Promoter w.e.f 29.06.2018)
At the beginning of the year 3,89,920 0.35
Transmission - 29th June 2018# 3,04,320 0.27 6,94,240 0.62
Inter se Transfer - 26th September 2018 -2,02,880 -0.18 4,91,360 0.44
At the end of the Year 4,91,360 0.44
3 Mrs Lily Vijayaraghavan & Mrs Sashi Parthasarathy
At the beginning of the year 3,53,312 0.32
Sale:
Sale on 20th June 2018 -1,300 0.00 3,52,012 0.32
sale on 21st June 2018 -5,000 0.00 3,47,012 0.31
Sale on 25th June 2018 -1,300 0.00 3,45,712 0.31
At the end of the Year 3,45,712 0.31
4 Mrs Saraswathi Srinivasan
At the beginning of the year 3,04,320 0.27
Transmission of Shares - 29th June 2018 -3,04,320 -0.27 – –
At the end of the Year – –
5 Mrs Veena Raghavan
At the beginning of the year 75,000 0.07
Sale on 15th June 2018 -75,000 -0.07 0 0.00
At the end of the Year 0 0.00
6 Mr Barath Rengarajan
At the beginning of the year 4,68,259 0.42
Sale on 21st September 2018 -1,539 0.00 4,66,720 0.42
Sale on 25th September 2018 -5,000 0.00 4,61,720 0.42
Sale on 26th September 2018 -236 0.00 4,61,484 0.42
At the end of the Year 4,61,484 0.42
7 Mrs Thanjam Ravindran
At the beginning of the year (Promoter w.e.f 29.06.2018) 4,22,310 0.38
Inter-se Transfer 26th September 2018 1,52,160 0.14 5,74,470 0.52
At the end of the Year 5,74,470 0.52
@Acquisition of shares pursuant to dissolution of Sri T.S. Santhanam Testamentary Trust# Transmission of Shares held by Mrs Saraswathi Srinivasan

Annual Report2018-1957
Sl. No.
Name of the Promoters
Shareholding at the beginning of the year
Cumulative Shareholding during the year
No. of shares % of total shares of the
company
No. of shares % of total shares of the
company
8 Mrs Choodamani Narayanan
At the beginning of the year 5,03,094 0.45
Purchase - 19th October 2018 5,060 0.00 5,08,154 0.46
At the end of the Year 5,08,154 0.46
9 Mr Ananth Krishnan
At the beginning of the year 2,00,300 0.18
Sale - 19th October 2018 -2,530 0.00 1,97,770 0.18
At the end of the Year 1,97,770 0.18
10 Mr Akshay Krishnan
At the beginning of the year 2,00,300 0.18
Sale - 19th October 2018 -2,530 0.00 1,97,770 0.18
At the end of the Year 1,97,770 0.18
11 Mr Shreyas Ravindran & Mr Srinivasan Ravindran (Promoter w.e.f 29.06.2018)
At the beginning of the year 85,622 0.07
Inter se Transfer - 26th September 2018 50,720 0.05 1,36,342 0.12
At the end of the Year 1,36,342 0.12
12 Mr Narayanan Ramji (HUF)
At the beginning of the year 408480 0.37
Transfer Pursuant to Family Settlement Order - 3rd August 2018
-2,72,320 -0.25 1,36,160 0.12
At the end of the Year 1,36,160 0.12
13 Mrs Lakshmi Vijayaraghavan
At the beginning of the year 1,200 0.00
Purchase - 3rd September 2018 600 0.00 1,800 0.00
At the end of the Year 1,800 0.00
14 Mr Harsha Viji
At the beginning of the year 13,66,068 1.23
Acquisition - 26th February 2019@ 3,25,636 0.29 16,91,704 1.52
At the end of the Year 16,91,704 1.52
15 Mrs. Vijaya Rangarajan
At the beginning of the year 9,03,564 0.81
Acquisition - 26th February 2019@ 1,82,701 0.16 10,86,265 0.98
At the end of the Year 10,86,265 0.98
16 Mr Daya Ambirajan
At the beginning of the year 1,19,650 0.11
Acquisition - 26th February 2019@ 1,50,889 0.14 2,70,539 0.24
At the end of the Year 2,70,539 0.24@Acquisition of shares pursuant to dissolution of Sri T.S. Santhanam Testamentary Trust

Sundaram Finance Limited
58
Sl. No.
Name of the Promoters
Shareholding at the beginning of the year
Cumulative Shareholding during the year
No. of shares % of total shares of the
company
No. of shares % of total shares of the
company
17 Mr Aditya S. Ramanujam
At the beginning of the year 2,21,882 0.20
Acquisition - 26th February 2019@ 39,666 0.04 2,61,548 0.24
At the end of the Year 2,61,548 0.24
18 Miss Tulsi S. Ramanujam
At the beginning of the year 2,19,382 0.20
Acquisition - 26th February 2019@ 48,385 0.04 2,67,767 0.24
At the end of the Year 2,67,767 0.24
19 Miss Tarika Ram (Minor)
At the beginning of the year 13490 0.01
Acquisition - 26th February 2019@ 150890 0.14 1,64,380 0.15
At the end of the Year 1,64,380 0.15
20 Master Ranjan Ambirajan
At the beginning of the year 6,744 0.01
Acquisition - 26th February 2019@ 1,50,889 0.14 1,57,633 0.14
At the end of the Year 1,57,633 0.14
21 Ms Sanjana Tara Ramanujam (Promoter w.e.f 26.02.2019)
At the beginning of the year 23,156 0.02
Acquisition - 26th February 2019@ 76,368 0.07 99,524 0.09
At the end of the Year 99,524 0.09
22 Mr Sumanth Ramanujam
At the beginning of the year 8,862 0.01
Acquisition - 26th February 2019@ 88,052 0.08 96,914 0.09
At the end of the Year 96,914 0.09
23 Mr S Ram & Mr S Viji
At the beginning of the year 12,25,160 1.10
Transfer - 26th February 2019$ -12,25,160 -1.10 – –
At the end of the Year – –
24 Mr C B Srinivasan (Promoter w.e.f 29.06.2018)
At the beginning of the year 9,600 0.01
At the end of the Year – – 9,600 0.01
@Acquisition of shares pursuant to dissolution of Sri T.S. Santhanam Testamentary Trust$ Distribution of shares to beneficiaries pursuant to dissolution of Sri T.S. Santhanam Testamentary Trust - 26.02.2019

Annual Report2018-1959
(iv) Shareholding Pattern of top ten shareholders (other than Directors, Promoters and Holders of GDRs and ADRs):
Sl. No.
Shareholder's Name Shareholding at thebeginning of the year
Cumulative Shareholding during the year
No of shares % of total shares of the company
No of shares % of total shares of the company
1 Axis Mutual Fund Trustee Limited A/C Axis Mutual Fund A/C
At the beginning of the year 40,27,688 3.63
Sale:
11-May-18 -7210 -0.01 40,20,478 3.62
Purchase:
25-May-18 99,986 0.09 41,20,464 3.71
01-Jun-18 4,494 0.00 41,24,958 3.71
08-Jun-18 1,00,000 0.09 42,24,958 3.80
Sale:
08-Jun-18 -4,503 0.00 42,20,455 3.80
15-Jun-18 -1,550 0.00 42,18,905 3.80
Purchase:
13-Jul-18 14,000 0.01 42,32,905 3.81
Sale:
20-Jul-18 -526 0.00 42,32,379 3.81
27-Jul-18 -5,930 -0.01 42,26,449 3.80
Purchase:
07-Sep-18 71,886 0.06 42,98,335 3.87
21-Sep-18 50,000 0.05 43,48,335 3.91
Sale:
21-Sep-18 -39,964 -0.04 43,08,371 3.88
Purchase:
28-Sep-18 19,817 0.02 43,28,188 3.90
Sale:
28-Sep-18 -411 0.00 43,27,777 3.90
Sale:
23-Nov-18 -25,000 -0.02 43,02,777 3.87
Purchase:
30-Nov-18 57,000 0.05 43,59,777 3.92
Sale:
30-Nov-18 -65,876 -0.06 42,93,901 3.86
Purchase:
07-Dec-18 84,500 0.08 43,78,401 3.94

Sundaram Finance Limited
60
Sl. No.
Shareholder's Name Shareholding at thebeginning of the year
Cumulative Shareholding during the year
No of shares % of total shares of the company
No of shares % of total shares of the company
Sale:
07-Dec-18 -86,598 -0.08 42,91,803 3.86
Purchase:
14-Dec-18 3,720 0.00 42,95,523 3.87
Sale:
14-Dec-18 -1,968 0.00 42,93,555 3.86
Purchase:
21-Dec-18 1,02,000 0.09 43,95,555 3.96
Sale:
21-Dec-18 -1,869 0.00 43,93,686 3.95
Purchase:
11-Jan-19 72,595 0.07 44,66,281 4.02
25-Jan-19 2,010 0.00 44,68,291 4.02
Purchase:
12-Feb-19 85,097 0.08 45,53,388 4.10
15-Feb-19 7,000 0.01 45,60,388 4.10
22-Feb-19 55,418 0.05 46,15,806 4.15
Purchase:
01-Mar-19 2,48,688 0.22 48,64,494 4.38
08-Mar-19 1,17,000 0.11 49,81,494 4.48
Sale:
08-Mar-19 -106 0.00 49,81,388 4.48
15-Mar-19 -14,020 -0.01 49,67,368 4.47
22-Mar-19 -57,000 -0.05 49,10,368 4.42
At the end of the Year 0.00 49,10,368 4.42
2 India Motor Parts & Accessories Limited
At the beginning of the year 28,53,600 2.57
Date wise Increase / Decrease – –
At the end of the Year 28,53,600 2.57
3 Bright Star Investments Pvt Ltd
At the beginning of the year 26,30,434 2.37
Date wise Increase / Decrease - -
At the end of the Year 26,30,434 2.37
4 PariWashingtonIndiaMasterFund,Ltd.
At the beginning of the year 1,12,7296 1.01
Purchase:
01-Jun-18 1,60,000 0.14 12,87,296 1.16

Annual Report2018-1961
Sl. No.
Shareholder's Name Shareholding at thebeginning of the year
Cumulative Shareholding during the year
No of shares % of total shares of the company
No of shares % of total shares of the company
13-Jul-18 2,42,500 0.22 15,29,796 1.38
03-Aug-18 85,900 0.08 16,15,696 1.45
05-Oct-18 1,10,000 0.10 17,25,696 1.55
04-Jan-19 1,75,498 0.16 19,01,194 1.71
At the end of the Year 19,01,194 1.71
5 Hdfc Standard Life Insurance Company Limited
At the beginning of the year 10,82,662 0.97
Purchase:
06-Apr-18 78,215 0.07 11,60,877 1.04
13-Apr-18 1,54,250 0.14 13,15,127 1.18
27-Apr-18 71,785 0.06 13,86,912 1.25
25-May-18 767 0.00 13,87,679 1.25
Sale:
01-Jun-18 -540 0.00 13,87,139 1.25
08-Jun-18 -162 0.00 13,86,977 1.25
Purchase:
22-Jun-18 3,829 0.00 13,90,806 1.25
29-Jun-18 25,084 0.02 14,15,890 1.27
06-Jul-18 744 0.00 14,16,634 1.28
13-Jul-18 24,172 0.02 14,40,806 1.30
20-Jul-18 28,298 0.03 14,69,104 1.32
27-Jul-18 46,702 0.04 15,15,806 1.36
03-Aug-18 1,00,000 0.09 16,15,806 1.45
Sale:
24-Aug-18 -355 0.00 16,15,451 1.45
07-Sep-18 -20,266 -0.02 15,95,185 1.44
Purchase:
28-Sep-18 1,164 0.00 15,96,349 1.44
05-Oct-18 42,657 0.04 16,39,006 1.48
12-Oct-18 51,586 0.05 16,90,592 1.52
Sale:
19-Oct-18 -77 0.00 16,90,515 1.52
Purchase:
26-Oct-18 60 0.00 16,90,575 1.52
02-Nov-18 7,869 0.01 16,98,444 1.53
09-Nov-18 10 0.00 16,98,454 1.53

Sundaram Finance Limited
62
Sl. No.
Shareholder's Name Shareholding at thebeginning of the year
Cumulative Shareholding during the year
No of shares % of total shares of the company
No of shares % of total shares of the company
16-Nov-18 33 0.00 16,98,487 1.53
23-Nov-18 1,660 0.00 17,00,147 1.53
30-Nov-18 50,143 0.05 17,50,290 1.58
14-Dec-18 25,033 0.02 17,75,323 1.60
21-Dec-18 4 0.00 17,75,327 1.60
28-Dec-18 4 0.00 17,75,331 1.60
04-Jan-19 21,792 0.02 17,97,123 1.62
11-Jan-19 3,239 0.00 18,00,362 1.62
18-Jan-19 10 0.00 18,00,372 1.62
Sale:
25-Jan-19 -6,952 -0.01 17,93,420 1.61
01-Feb-19 -82,355 -0.07 17,11,065 1.54
15-Feb-19 -4,802 0.00 17,06,263 1.54
22-Feb-19 -7,834 -0.01 16,98,429 1.53
01-Mar-19 -56,005 -0.05 16,42,424 1.48
Purchase:
08-Mar-19 8,643 0.01 16,51,067 1.49
15-Mar-19 12,674 0.01 16,63,741 1.50
22-Mar-19 32,836 0.03 16,96,577 1.53
29-Mar-19 39,125 0.04 17,35,702 1.56
At the end of the Year 17,35,702 1.56
6 United India Insurance Company Limited
At the beginning of the year 15,69,561 1.41
Date wise Increase / Decrease – –
At the end of the Year 15,69,561 1.41
7 Icici Prudential Mutual Fund
At the beginning of the year 25,50,988 2.30
Sale:
06-Apr-18 -15,353 -0.01 25,35,635 2.28
13-Apr-18 -2,258 0.00 25,33,377 2.28
20-Apr-18 -888 0.00 25,32,489 2.28
27-Apr-18 -5,04,054 -0.45 20,28,435 1.83
04-May-18 -45,783 -0.04 19,82,652 1.78
25-May-18 -74,979 -0.07 19,07,673 1.72
01-Jun-18 -26,264 -0.02 18,81,409 1.69

Annual Report2018-1963
Sl. No.
Shareholder's Name Shareholding at thebeginning of the year
Cumulative Shareholding during the year
No of shares % of total shares of the company
No of shares % of total shares of the company
08-Jun-18 -1,13,465 -0.10 17,67,944 1.59
15-Jun-18 -1,08,376 -0.10 16,59,568 1.49
22-Jun-18 -1,00,225 -0.09 15,59,343 1.40
29-Jun-18 -21,729 -0.02 15,37,614 1.38
05-Jul-18 -59,917 -0.05 14,77,697 1.33
06-Jul-18 -26,914 -0.02 14,50,783 1.31
13-Jul-18 -5,427 0.00 14,45,356 1.30
20-Jul-18 -5,806 -0.01 14,39,550 1.30
27-Jul-18 -1,220 0.00 143,8,330 1.29
03-Aug-18 -36,934 -0.03 14,01,396 1.26
10-Aug-18 -16,475 -0.01 13,84,921 1.25
17-Aug-18 -6,049 -0.01 13,78,872 1.24
24-Aug-18 -3,898 0.00 13,74,974 1.24
Purchase:
05-Oct-18 15,169 0.01 13,90,143 1.25
12-Oct-18 25,337 0.02 14,15,480 1.27
Sale:
02-Nov-18 -9,736 0.01 14,05,744 1.27
09-Nov-18 -1,058 0.00 14,04,686 1.26
16-Nov-18 -2,509 0.00 14,02,177 1.26
23-Nov-18 -208 0.00 14,01,969 1.26
07-Dec-18 -2,065 0.00 13,99,904 1.26
14-Dec-18 -8,111 0.01 13,91,793 1.25
Purchase:
18-Jan-19 2,564 0.00 13,94,357 1.26
01-Feb-19 39,895 0.04 14,34,252 1.29
Sale:
15-Feb-19 -580 0.00 14,33,672 1.29
At the end of the Year 14,33,672 1.29
8 Tata Mutual Fund
At the beginning of the year – –
Purchase:
30-Nov-18 4,27,000 0.38 4,27,000 0.38
07-Dec-18 1,90,000 0.17 6,17,000 0.56
14-Dec-18 1,22,746 0.11 7,39,746 0.67

Sundaram Finance Limited
64
Sl. No.
Shareholder's Name Shareholding at thebeginning of the year
Cumulative Shareholding during the year
No of shares % of total shares of the company
No of shares % of total shares of the company
13-Jul-18 1,65,000 0.15 9,04,746 0.81
11-Jan-19 50,000 0.05 9,54,746 0.86
08-Feb-19 1,00,000 0.09 10,54,746 0.95
15-Mar-19 17,000 0.02 10,71,746 0.96
15-Mar-19 33,000 0.03 11,04,746 0.99
At the end of the Year 11,04,746 0.99
9 SundaramFinanceEmployeesWelfareTrust
At the beginning of the year 9,79,510 0.88
Transfer:
15 June 2018 -18,550 -0.02 9,60,960 0.86
At the end of the Year 9,60,960 0.86
10 Franklin Templeton Mutual Fund A/C
Franklin India Prima Fund (New Top 10)
At the beginning of the year 4,81,866 4.34
Purchase:
01-Jun-18 42,361 0.04 5,24,227 0.47
08-Jun-18 24,831 0.02 5,49,058 0.49
05-Jul-18 2,20,000 0.20 7,69,058 0.69
12-Oct-18 25,000 0.02 7,94,058 0.71
At the end of the Year 7,94,058 0.71
11 SBI Magnum Fund
At the beginning of the year 17,95,204 1.62
Sale:
06-Apr-18 -50,000 -0.05 17,45,204 1.57
13-Apr-18 -1,00,000 -0.09 16,45,204 1.48
20-Apr-18 -1,45,204 -0.13 15,00,000 1.35
31-Aug-18 -61,478 -0.06 14,38,522 1.29
21-Sep-18 -2,22,833 -0.20 12,15,689 1.09
30-Nov-18 -5,77,674 -0.52 6,38,015 0.57
07-Dec-18 -70,000 -0.06 5,68,015 0.51
14-Dec-18 -1,16,547 -0.10 4,51,468 0.41
21-Dec-18 -1,05,998 -0.10 3,45,470 0.31
04-Jan-19 -1,04,815 -0.09 2,40,655 0.22
25-Jan-19 -40,000 -0.04 2,00,655 0.18
12-Feb-19 -59,513 -0.05 1,41,142 0.13
15-Feb-19 -1,41,142 -0.13 0 0.00
At the end of the Year 0 0.00

Annual Report2018-1965
(v) Shareholding of Directors and Key Managerial Personnel:
Sl. No.
Name of the Directors and KMP Shareholding at the beginning of the year
Cumulative Shareholding during the year
No. of shares % of total shares of the company
No. of shares % of total shares of the company
1 Sri S VijiAt the beginning of the year(i) held individually 9,09,780 0.82(ii) held as Karta of HUF 4,79,912 0.43(iii) held jointly with others 8,684 0.01Date wise Increase / Decrease – –At the end of the Year (i) held individually 9,09,780 0.82(ii) held as Karta of HUF 4,79,912 0.43(iii) held jointly with others 8,684 0.01
2 Sri S RamAt the beginning of the year(i) held individually 5,06,788 0.46(ii) held as Karta of HUF – –(iii) held jointly with others 6,09,896 0.55 (iv) held as Executor / Trustee* 12,25,160 1.10Date wise Increase / Decrease Transfer - 26th February 2019$ -12,25,160 -1.10 – –At the end of the Year (i) held individually 5,06,788 0.46(ii) held as Karta of HUF – –(iii) held jointly with others 6,09,896 0.55 (iv) held as Executor / Trustee – –
3 Sri N VenkataramaniAt the beginning of the year – –Date wise Increase / Decrease – –At the end of the Year – –
4 Sri P N Venkatachalam – –At the beginning of the year – –Date wise Increase / Decrease – –At the end of the Year – –
5 Sri S MahalingamAt the beginning of the year - held jointly with others
held jointly with others
3,200 –
Date wise Increase / Decrease – –At the end of the Year 3,200 –
6 Sri S PrasadAt the beginning of the year - held jointly with others 12,600 0.01Date wise Increase / Decrease – –Transmission - 14-Sep 2018 -12,600 -0.01At the end of the Year (i) held individually 12,600 0.01
7 Sri S RavindranAt the beginning of the year(i) held individually 3,89,920 0.35(ii) held jointly with others 85,622 0.08Date wise Increase / Decrease – –Transmission - 29-June-2018 3,04,320 0.27 6,94,240
* jointly with Sri S Viji as Trustees, Sri T S Santhanam Testamentary Trust$ Distribution of shares to beneficiaries pursuant to dissolution of Sri T.S. Santhanam Testamentary Trust - 26.02.2019

Sundaram Finance Limited
66
Sl. No.
Name of the Directors and KMP Shareholding at the beginning of the year
Cumulative Shareholding during the year
No. of shares % of total shares of the company
No. of shares % of total shares of the company
Inter se Transfer - 26-Sep-2018 50,720 1,36,342Inter se Transfer - 26-Sep-2018 -2,02,880 4,91,360 0.44At the end of the Year (i) held individually 4,91,360 0.44(ii) held jointly with others 1,36,342 0.12
8 Ms Shobhana RamachandhranAt the beginning of the year - held individually 3,44,720 0.31Date wise Increase / Decrease - - Sale - 04-Sep-2019 -42,720 -0.04 3,02,000At the end of the Year 3,02,000 0.27
9 Sri Rajiv C Lochan – –At the beginning of the year (since 25th November 2016) – –Date wise Increase / Decrease – –At the end of the Year – –
10 Sri T T Srinivasaraghavan, Managing DirectorAt the beginning of the year(i) held as Karta of HUF 1,23,192 0.11(ii) held jointly with others 3,26,376 0.29(iii) held as Executor / Trustee 1,10,000 0.10Date wise Increase / Decrease – –At the end of the Year (i) held as Karta of HUF 1,23,192 0.11(ii) held jointly with others 3,26,376 0.29(iii) held as Executor / Trustee 1,10,000 0.10
11 Sri Harsha Viji, Deputy Managing Director At the beginning of the year(i) held individually 13,66,068 1.23(ii) held jointly with others 3,156 –Date wise Increase / Decrease – –Acquisition - 26th February 2019@ 3,25,636 0.29 16,94,860At the end of the Year (i) held individually 16,91,704 1.52(ii) held jointly with others 3,156 –
12 Sri A N Raju, Director (Operations)At the beginning of the year (since 1st June 2014) -
held jointly with others
30,028 0.03
Exercise of ESOP -15th June 2018 2,500 0.00 32,528 0.03At the end of the Year 32,528 0.03
13 Sri M Ramaswamy, Chief Financial OfficerAt the beginning of the year - held individually 25,902 0.02Exercise of ESOP -15th June 2018 2,500 0.00 28,402 0.03At the end of the Year 28,402 0.03
14 Sri P Viswanathan, Secretary & Compliance OfficerAt the beginning of the year(i) held individually 4,483 0.00(ii) held jointly with others 35,508 0.03Exercise of ESOP -15th June 2018 2,000 – 41,991 0.03At the end of the Year (i) held individually 4,483 0.00(ii) held jointly with others 37,508 0.03
@Acquisition of shares pursuant to dissolution of Sri T.S. Santhanam Testamentary Trust

Annual Report2018-1967
V. INDEBTEDNESS
Indebtedness of the Company including interest outstanding / accrued but not due for payment (` in lakhs)
VI. REMUNERATION OF DIRECTORS AND KEY MANAGERIAL PERSONNEL
A. Remuneration to Managing Director, Whole-time Directors and / or Manager: (` in lakhs)
* Unsecured Loans includes Commercial Paper and Subordinated Debentures
ParticularsSecured Loans
excluding depositsUnsecured
Loans *Deposits Total
Indebtedness
Indebtedness at the beginning of the financial year
(i) Principal Amount 14025,18.47 4059,53.10 2499,32.27 20584,03.84
(ii) Interest due but not paid – – – –
(iii) Interest accrued but not due 370,51.10 74,84.74 117,67.72 563,03.56
Total (i + ii + iii) 14395,69.57 4134,37.84 2616,99.99 21147,07.40
Change in Indebtedness during the financial year
Addition 13296,60.75 14394,24.77 708,67.62 28399,53.15
Reduction 9216,16.21 15063,00.00 225,68.42 24504,84.63
Net Change 4080,44.54 (668,75.23) 482,99.20 3894,68.52
Indebtedness at the end of the financial year
(i) Principal Amount 18117,92.08 3387,95.16 2975,16.31 24481,03.56
(ii) Interest due but not paid – – – –
(iii) Interest accrued but not due 358,22.03 77,67.45 124,82.88 560,72.36
Total (i + ii + iii) 18476,14.11 3465,62.61 3099,99.19 25041,75.92
Sl. No.
Particulars of Remuneration
NameoftheMD/WTD/Manager Total
Sri T T Srinivasaraghavan, Managing Director
Sri Harsha Viji, Deputy Managing
Director
Sri A N Raju, Director
(Operations)
1 Gross Salary
(a) Salary as per provisions contained in Section
17 (1) of the Income-tax Act, 1961
1,50.07 1,12.12 81.94 3,44.13
(b) Value of perquisites u/s 17 (2) of the
Income-tax Act, 1961
2.96 2.40 0.53 5.89
(c) Profits in lieu of salary under section 17 (3)
of the Income-tax Act, 1961
– – – –
2 Stock Option – – 47.01 47.01
3 Sweat Equity – – – –
4 Commission 3,25.00 2,40.00 1,25.00 6,90.00
- as % of profit 0.35% 0.26% 0.14%
- others, specify – – – –
5 Contributions to Provident, Superannuation
and Gratuity Funds
13.11 11.09 10.07 –
Total (I) 4,91.14 3,80.62 2,79.55 11,51.31
Ceiling as per the Act (10% of Net Profits) 92,23.37

Sundaram Finance Limited
68
C. Remuneration to Key Managerial Personnel other than MD/ Manager / WTD (` in lakhs)
Sl.
No.Particulars of Remuneration
Sri P Viswanathan,
Company Secretary
Sri M Ramaswamy,
CFOTotal
1 Gross Salary
(a) Salary as per provisions contained in Section 17 (1) of the Income-
tax Act, 1961
62.75 82.29 1,45.04
(b) Value of perquisites u/s 17 (2) of the Income-tax Act, 1961 0.44 0.32 0.76
(c) Profits in lieu of salary under Section 17 (3) of the Income-tax Act,
1961
– – –
2 Stock Option 37.61 47.01 84.62
3 Sweat Equity – – –
4 Commission 25.00 70.00 95.00
- as % of profit 0.03% 0.08% –
- others, specify – – –
5 Contributions to Provident, Superannuation and Gratuity Funds 6.24 7.85 14.09
Total 1,32.04 2,07.48 3,39.52
B. Remuneration to other Directors: (` in lakhs)
Name of Directors Particulars of Remuneration
Total Fee for attending board /
committee meetings
Commission Others, please
specify
Independent Directors:
Sri N Venkataramani 2.10 8.00 0 10.10
Sri P N Venkatachalam 3.85 12.00 0 15.85
Sri S Mahalingam 2.60 12.00 0 14.60
Sri S Prasad 5.80 15.00 0 20.80
Ms Shobhana Ramachandhran 4.80 12.00 0 16.80
Sri Rajiv C Lochan 3.10 12.00 0 15.10
Total(II) 93.25
Other Non-Executive Directors:
Sri S Viji 2.50 8.00 0 10.50
Sri S Ram 2.50 8.00 0 10.50
Sri S Ravindran 4.95 12.00 0 16.95
Total (III) 37.95
Total Managerial Remuneration (I)+(II)+(III)
12,52.51
Overall Ceiling as per the Act (11% of Net Profits) 101,45.70
VII. PENALTIES / PUNISHMENT / COMPOUNDING OF OFFENCES:
There were no penalties /punishment / compounding of offences against Company, Directors and Other Officers in Default for the year
ended 31st March 2019.

Annual Report2018-1969
Sources and Distribution of Income (2018-19)`4021.05 Cr.
SOURCES
Fees and commission income
5.75%
Profit on sale of Equity shares
14.73%
Others 5.04%
Interest Income 74.48%
DISTRIBUTION
Financial Highlights (` in Cr.)
Finance Costs 43.83%
Retained Earnings 23.08%
Employee & Administrative
Expenses 15.05%
Others 4.18%
Dividend (excl. DDT)
4.84%
Taxes 9.02%
# includes net proceeds from SFL Shares Trust of `256.56 cr.* includes an amount of `522 cr. towards exceptional income on account of sale of shares in Royal Sundaram@ includes Special Dividend of 50%
Year Paid-up Capital
Reserves Deposits Borrowings Total Receivables
PBDT PAT Dividend %
Dividend Amount
1954 0.02 0.10 0.10 0.10
1972 1.00 0.58 8.35 8.37 9.86 0.73 0.30 16.00 0.16
1976 1.50 0.99 13.57 14.44 19.87 1.78 0.67 16.00 0.24
1978 2.00 1.37 14.65 19.47 27.18 2.01 0.77 18.00 0.36
1982 3.00 3.00 45.20 58.42 76.60 4.28 1.58 20.00 0.60
1986 6.00 6.59 104.10 125.60 184.66 10.35 2.67 16.00 0.96
1990-91 12.00 30.24 201.02 334.29 483.21 34.69 12.01 25.00 3.00
1995-96 24.00 204.31 550.44 1138.69 1637.05 127.50 64.92 35.00 8.40
2004-05 27.78 655.22 740.25 3806.38 4488.30 144.55 75.99 75.00 21.87
2008-09 55.55 1097.12 940.06 6275.77 9203.53 257.47 150.73 65.00 36.11
2012-13 111.10 1974.72 1476.99 11487.36 17644.58 674.11 410.11 90.00 99.99
2013-14 111.10 2292.97 1665.57 11796.47 18157.83 738.91 442.51 100.00 111.10
2014-15 111.10 2865.66# 1924.72 12553.00 18733.73 742.49 454.14 105.00 116.66
2015-16 111.10 3199.73 2246.27 12620.15 20698.88 767.43 477.28 110.00 122.21
2016-17 111.10 3632.86 2411.08 13910.84 24034.85 802.23 495.35 115.00 127.77
2017-18 111.10 4022.53 2499.32 21147.07 28647.92 913.33 563.44 120.00 133.32
2018-19 111.10 4932.71 2975.16 25041.76 33446.71 1541.68 1126.31* 175.00@ 194.43

Sundaram Finance Limited
70
Independent Auditors’ ReportTo the members of Sundaram Finance Limited, Chennai for the year ended 31st March, 2019
To the members of Sundaram Finance Limited, Chennai
Report on Standalone Financial Statements
Opinion
WehaveauditedtheaccompanyingstandalonefinancialstatementsofSundaramFinanceLimited(“theCompany”),whichcomprisethe
Balance Sheet as at 31st March 2019, the Statement of Profit and Loss, (including other comprehensive income) the Statement of Changes
in Equity and Statement of Cash Flows for the year then ended and notes to the financial statements, including a summary of significant
accounting policies and other explanatory information.
In our opinion and to the best of our information and according to the explanations given to us, the aforesaid standalone financial statements
give the information required by the Companies Act, 2013 (“The Act”) in the manner so required and give a true and fair view in conformity
with the Indian Accounting Standards prescribed under section 133 of the Act, read with the Companies (Indian Accounting Standards)
Rules, 2015 as amended (“Ind AS”) and other accounting principles generally accepted in India, of the state of affairs of the Company as
at 31st March 2019, and its profit and total comprehensive income, changes in equity and its cash flows for the year ended on that date.
Basis for Opinion
WeconductedourauditinaccordancewiththeStandardsonAuditing(“SA”)specifiedundersection143(10)oftheAct.Ourresponsibilities
under those Standards are further described in the Auditor’s Responsibilities for the Audit of the financial statements section of our report.
WeareindependentoftheCompanyinaccordancewiththeCodeofEthicsissuedbytheInstituteofCharteredAccountantsofIndia(ICAI)
together with the ethical requirements that are relevant to our audit of the financial statements under the provisions of the Act and the
Rules made there under and we have fulfilled our other ethical responsibilities in accordance with these requirements and the ICAI’s Code
ofEthics.Webelievethattheauditevidencewehaveobtainedissufficientandappropriatetoprovideabasisforouropinion.
Key Audit Matters
Key audit matters are those matters that, in our professional judgement, were of most significance in our audit of the financial statements
of the current period. These matters were addressed in the context of our audit of the financial statements as a whole, and in forming our
opinion thereon, and we do not provide a separate opinion on these matters.

Annual Report2018-1971
Key Audit Matter How our audit addressed the key audit matter
Adoption of New Accounting framework (Ind AS)Effective 1st April 2018, the Company adopted the Indian Accounting Standards
('Ind AS") notified by the Ministry of Corporate Affairs with the transition date of
1st April 2017.
• WeconfirmedtheapprovalsofAuditCommitteefor
the choices and exemptions made by the Company
for compliance/acceptability under IND AS 101.
The following are the major impact areas for the Company upon transition:
- Classification and measurement of Financial Assets and Financial Liabilities
- Measurement of Loan losses (expected credit losses)
- Accounting for Securitization and Assignment
- Accounting for Loan Fees and Costs
- Accounting for Employee stock options
- Accounting for Derivative instruments
The migration to the new accounting framework (Ind AS) is a process involving multiple
decision points upon transition. Ind AS 101, First Time Adoption prescribes choices
and exemptions for first time application of Ind AS principles at the transition date.
WeidentifiedtransitiondateaccountingasaKeyAuditMatterbecauseofsignificant
degree of management judgment and application on the areas noted above.
• Evaluated management's transition date
choices and exemptions for compliance/
acceptability under Ind AS 101.
• Understood,themethodologyimplementedby
management to give impact on the transition
and assessed the accuracy of the computations.
We confirm the accuracy of accounting and
adequacy of disclosures in the Financial statements.
Impairment Loss AllowanceManagement’s judgements in the calculation of impairment allowances have
significant impact on the financial statements. The estimates regarding impairment
allowances are complex and require a significant degree of judgement, which
increased with implementation of Expected Credit Loss (“ECL”) approach starting
from 1st April 2017 as required by Ind AS 109 relating to “Financial instruments.”
Management is required to determine the expected credit loss that may occur
over either a 12-month period or the remaining life of an asset, depending on the
categorisation of the individual asset.
The key areas of judgement include:
1. Categorisation of loans in Stage 1, 2 and 3 based on identification of:
(a) exposures with significant increase in credit risk since their origination and
(b) Individually impaired / default exposures.
2. Techniques used to determine Loss Given Default (‘LGD’) and Probability of
Default (‘PD’) to calculate an ECL based on past experience.
3. The impact of different future macroeconomic conditions in the determination
of ECL.
These judgements required new models to be built and implemented to measure
the expected credit losses on certain financial assets measured at amortised cost.
Management has made a number of interpretations and assumptions when designing
and implementing models that are compliant with the new standard.
The accuracy of data flows and the implementation of related controls is critical
for the integrity of the estimated impairment provisions. Given the significance of
judgements and the high complexity related particularly to the calculation of ECL
we considered this area as a Key Audit Matter.
• We ob t a i ned an under s t and ing o f
management’s assessment of impairment
of loans and advances including the Ind AS
109 implementation process, internal rating
model, impairment allowance policy and ECL
modelling methodology.
• Weassessedthedesignandimplementation,
and tested the operating effectiveness of
controls over the modelling process including
governance over monitoring of the model and
approval of key assumptions
• WealsoassessedtheapproachoftheCompany
for categorisation of the loans in various stages
reflecting the inherent risk in the respective
loans.
• Forasampleoffinancialassets,wetestedthe
correctness of Staging, reasonableness of PD,
accuracy of LGD and ECL computation.
As a result of the above audit procedures no
material differences were noted.
Weconfirmtheadequacyofdisclosuresmadein
the Financial statements.

Sundaram Finance Limited
72
Key Audit Matter How our audit addressed the key audit matter
Divestment of shares
During the year the Company has divested 25.90% of its share in Royal Sundaram
General Insurance Company Limited.
Weconsideredtheaccountingtreatmentinthefinancialstatementsofthiseventasa
Key Audit Matter because of its size and the judgment required in calculating some
of the amounts included in the profit on divestment of shares
WeverifiedtheProfitondisposalbyreconciling
the consideration to the Share Purchase Agreement
(SPA), bank accounts and by verifying the
investments disposed to underlying accounting
records.
In addition we verified whether the Profit on
disposal was calculated in accordance with the
relevant clauses of the SPA.
We confirm the accuracy of accounting and
adequacy of disclosures in the Financial statements.
Fair Value of Unquoted Equity Investments (Other than Investments in Subsidiaries and Joint Ventures)
Investment in Unquoted equity shares are measured at Fair value.
The Fair value of these financial assets involved management’s judgement because
these securities are not traded in an active market.
As per Ind AS 109, Cost has been considered as the best estimate of Fair value by
the Management.
Since this valuation is a Level 3 type of valuation in accordance with Ind AS 113
Fair Value Measurement where one or more significant inputs to the fair value
measurement is unobservable .
Accordingly this item is considered to be a Key Audit Matter due to significant
judgments associated with estimating the fair value of investment.
Wediscussedwithmanagement the basis used
in determining the fair value and evaluated the
appropriateness of the valuation methodologies
used by management and compared it to industry
norms and the requirements in Ind AS.
Weconfirmtheadequacyofthedisclosuresmade
in the Financial statements.
Impairment testing of investments in Subsidiaries /Joint Ventures:
Impairment testing of investments in Subsidiaries/Joint venture is considered as a
Key Audit Matter since impairment of these investments may have an impact on the
equity of the Company.
Wecomparedthebookvalueof the investments
in the year under review with their prorata share
of the respective company’s equity based on
their financials, evaluated the internal sources
and external sources of information to identify
impairment indications, if any.
Testing for impairment depends on the future results of the companies concerned.
In addition, there is significant scope for judgement in determining the assumptions
underlying forecast results of the entities.
Where indicators of impairment have beenidentified, assessing the reasonableness of the recoverable amount of each of the relevant subsidiaries and joint ventures, obtained an understanding from management of their financial position and future prospects.
The same has been evaluated and appropriately dealt in the books of accounts.
Based on the audit procedures performed, we found the key judgements and assumptions used in the impairment identification and assessments were duly supported by the available evidence.

Annual Report2018-1973
Key Audit Matter How our audit addressed the key audit matter
IT Systems and ControlsThe Company's key financial accounting and reporting processes are highly
dependent on the automated controls in information systems,
Wehave considered this as Key AuditMatter as any control lapses, Validation
failures, incorrect input data and wrong extraction of data may result in the financial
accounting and reporting records being misstated.
Wehavefocusedonuseraccessmanagement,changemanagement,segregation
of duties, system reconciliation controls and system application controls over key
financial accounting and reporting systems.
Wetestedasampleofkeycontrolsoperatingoverthe information technology in relation to financial accounting and reporting systems, including system access and system change management, program development and computer operations.
Wetestedthedesignandoperatingeffectivenessofkey controls over user access management which includes granting access right, new user creation, removal of user rights and preventative controls designed to enforce segregation of duties.
Reliance was also placed on the System Audit report of the Company.
Based on our review no weakness was found in the IT Systems and Controls.
Information Other than the Financial Statements and Auditor’s Report Thereon
The Company’s Board of Directors is responsible for other information. The other information comprises the information included in the
financial highlights, board’s report, corporate governance report but does not include the financial statements and our auditor’s report
thereon.
Our opinion on the financial statements does not cover the other information and we do not express any form of assurance conclusion
thereon.
In connection with our audit of the financial statements, our responsibility is to read the other information and, in doing so, consider
whether the other information is materially inconsistent with the financial statements or our knowledge obtained in the audit or otherwise
appears to be materially misstated. If, based on the work we performed, we conclude that there is a material misstatement of this other
information,wearerequiredtoreportthatfact.Wehavenothingtoreportinthisregard.
Responsibilities of Management and Those Charged with Governance for the Standalone Financial Statements
The Company’s Board of Directors is responsible for the matters stated in section 134(5) of the Act with respect to the preparation
of these standalone financial statements that give a true and fair view of the financial position, financial performance including other
comprehensive income, changes in equity and cash flows of the Company in accordance with the accounting principles generally accepted
in India, including the accounting Standards specified under section 133 of the Act read with the Companies (Indian Accounting Standards)
Rules, 2015. This responsibility also includes maintenance of adequate accounting records in accordance with the provisions of the Act
for safeguarding of the assets of the Company and for preventing and detecting frauds and other irregularities; selection and application
of appropriate accounting policies; making judgments and estimates that are reasonable and prudent; and design, implementation and
maintenance of adequate internal financial controls, that were operating effectively for ensuring the accuracy and completeness of the
accounting records, relevant to the preparation and presentation of the financial statements that give a true and fair view and are free from
material misstatement, whether due to fraud or error.
In preparing the financial statements, management is responsible for assessing the Company’s ability to continue as a going concern,
disclosing, as applicable, matters related to going concern and using the going concern basis of accounting unless the Board of Directors
either intends to liquidate the Company or to cease operations, or has no realistic alternative but to do so.
The Board of Directors are also responsible for overseeing the Company’s financial reporting process.

Sundaram Finance Limited
74
Auditor’s Responsibilities for the Audit of the Financial Statements
Our objectives are to obtain reasonable assurance about whether the financial statements as a whole are free from material misstatement,
whether due to fraud or error, and to issue an auditor’s report that includes our opinion. Reasonable assurance is a high level of assurance,
but is not a guarantee that an audit conducted in accordance with SAs will always detect a material misstatement when it exists. Misstatements
can arise from fraud or error and are considered material if, individually or in the aggregate, they could reasonably be expected to influence
the economic decisions of users taken on the basis of these financial statements.
As part of an audit in accordance with SAs, we exercise professional judgment and maintain professional skepticism throughout the audit.
Wealso:
• Identifyandassesstherisksofmaterialmisstatementofthefinancialstatements,whetherduetofraudorerror,designandperform
audit procedures responsive to those risks and obtain audit evidence that is sufficient and appropriate to provide a basis for our
opinion. The risk of not detecting a material misstatement resulting from fraud is higher than for one resulting from error, as fraud
may involve collusion, forgery, intentional omissions, misrepresentations, or the override of internal control.
• Obtainanunderstandingofinternalfinancialcontrolsrelevanttotheauditinordertodesignauditproceduresthatareappropriatein
the circumstances. Under section 143(3)(i) of the Act, we are also responsible for expressing our opinion on whether the Company
has adequate internal financial controls system in place and the operating effectiveness of such controls.
• Evaluatetheappropriatenessofaccountingpoliciesusedandthereasonablenessofaccountingestimatesandrelateddisclosures
made by management.
• Concludeontheappropriatenessofmanagement’suseofthegoingconcernbasisofaccountingandbasedontheauditevidence
obtained, whether a material uncertainty exists related to events or conditions that may cast significant doubt on the Company’s ability to
continue as a going concern. If we conclude that a material uncertainty exists, we are required to draw attention in our auditor’s report
to the related disclosures in the financial statements or if such disclosures are inadequate, to modify our opinion. Our conclusions
are based on the audit evidence obtained up to the date of our auditor’s report. However, future events or conditions may cause the
Company to cease to continue as a going concern.
• Evaluatetheoverallpresentation,structureandcontentofthefinancialstatements,includingthedisclosuresandwhetherthefinancial
statements represent the underlying transactions and events in a manner that achieves fair presentation.
Wecommunicatewiththosechargedwithgovernanceregarding,amongothermatters,theplannedscopeandtimingoftheauditand
significant audit findings, including any significant deficiencies in internal control that we identify during our audit.
Wealsoprovidethosechargedwithgovernancewithastatementthatwehavecompliedwithrelevantethicalrequirementsregarding
independence and to communicate with them all relationships and other matters that may reasonably be thought to bear on our independence
and where applicable, related safeguards.
From the matters communicated with those charged with governance, we determine those matters that were of most significance in the
auditofthefinancialstatementsofthecurrentperiodandarethereforethekeyauditmatters.Wedescribethesemattersinourauditor’s
report unless law or regulation precludes public disclosure about the matter or when, in extremely rare circumstances, we determine
that a matter should not be communicated in our report because the adverse consequences of doing so would reasonably be expected to
outweigh the public interest benefits of such communication.

Annual Report2018-1975
Report on Other Legal and Regulatory Requirements
1. As required by the Companies (Auditor’s Report) Order, 2016 (“the Order”), issued by the Central Government of India in terms of
sub-section (11) of section 143 of the Act, we give in “Annexure A” to this Report, a statement on the matters specified in paragraphs
3 and 4 of the said Order, to the extent applicable.
2. As required by Section 143(3) of the Act, we report that:
(a) Wehavesoughtandobtainedalltheinformationandexplanationswhichtothebestofourknowledgeandbeliefwerenecessary
for the purposes of our audit.
(b) In our opinion, proper books of account as required by law have been kept by the Company so far as it appears from our
examination of those books.
(c) The Balance Sheet, the Statement of Profit and Loss, the Statement of Changes in Equity and the Statement of Cash Flow dealt with
by this Report are in agreement with the books of account.
(d) In our opinion, the aforesaid financial statements comply with the Accounting Standards specified under Section 133 of the Act
read with the Companies (Indian Accounting Standards) Rules, 2015.
(e) On the basis of the written representations received from the directors as on 31st March, 2019 taken on record by the Board of
Directors, none of the directors is disqualified as on 31st March, 2019 from being appointed as a director in terms of Section
164(2) of the Act.
(f) WithrespecttotheadequacyoftheinternalfinancialcontrolsoverfinancialreportingoftheCompanyandtheoperatingeffectiveness
of such controls, refer to our separate Report in “Annexure B”.
(g) As regards Managerial Remuneration paid to Directors, refer to note no. xi of “Annexure A” to this Report.
(h) WithrespecttotheothermatterstobeincludedintheAuditor’sReportinaccordancewithRule11oftheCompanies(Auditand
Auditors) Rules, 2014, in our opinion and to the best of our information and according to the explanations given to us:
i. the Company has disclosed the impact of pending litigations on its financial position in its financial statements – refer note
no. 39.04 to the financial statements.
ii. based on the current assessment of the long term contracts, in the ordinary course of business, the company has made adequate
provision for losses where required, as explained in note no. 39.11 of the Notes to Accounts. The derivative contracts being
in the nature of the hedge contracts, the company does not anticipate any material losses from the same.
iii. During the year, there has been no delay in transferring the amounts required to be transferred to the Investor Education and
Protection Fund.
For Sundaram & Srinivasan
Chartered Accountants
Firm Registration. No. 004207S
K.Srinivasan
Place: Chennai Partner
Date : 30th May 2019 Membership Number : 005809

Sundaram Finance Limited
76
ANNEXURE - A TO THE INDEPENDENT AUDITOR’S REPORT OF EVEN DATE ON THE STANDALONE FINANCIAL STATEMENTS OF
SUNDARAM FINANCE LIMITED, CHENNAI
Annexure A referred to in our report under “Report on Other Legal and Regulatory Requirements Para 1” of even date
on the accounts for the year ended 31st March 2019
i. (a) The Company is maintaining proper records showing full particulars, including quantitative details and situation of fixed assets.
(b) Fixed assets have been physically verified by the Management during the year, in accordance with an annual plan of verification,
which in our opinion is reasonable having regard to the size of the Company and nature of the fixed assets. The discrepancies
noticed on such verification were not material and have been properly dealt with in the books of account.
(c) The title deeds of immovable properties are held in the name of the company.
ii. The Company does not have any inventory and hence reporting under this clause 3(ii) is not applicable.
iii. The Company has granted secured loans to two parties and unsecured loan to one party covered in the register maintained under
section 189 of the Act.
(a) The terms and conditions of the grant of the loan are not prejudicial to the Company’s interest;
(b) The repayment of principal and payment of interest has been stipulated and the repayment and receipts are regular;
(c) The amounts are not overdue.
iv. In our opinion and according to the information and explanations given to us, the company has complied with the provisions of section
185 and 186 in respect of loans granted, investments made, guarantees given and securities provided, wherever applicable.
v. In our opinion and according to the information and explanations given to us, the company has complied with the directions issued
by the Reserve Bank of India and the provisions of section 73 to 76 of the Act, and any other relevant provisions of the Act and the
rules framed thereunder with regard to deposits accepted from the public.
vi. The Central Government has not prescribed the maintenance of cost records for the Company u/s. 148(1) of the Companies Act, 2013.
vii. (a) In our opinion and according to the information and explanation given to us, undisputed statutory dues including Provident
Fund, Employees’ State Insurance, Income Tax, Goods and Service Tax, Duty of Customs, Cess and other material statutory dues
have been regularly deposited during the year with appropriate authorities. According to the information and explanations given
to us, there are no arrears of statutory dues which are outstanding as at 31st March 2019 for a period of more than six months
from the date they become payable.

Annual Report2018-1977
(b) According to records of the Company and the information and explanation given to us, the details of disputed Value Added Tax,
Service Tax and Income Tax not deposited are as follows:
Nature of dues Amount in ` lakhs
Period to which the amount relates
Forum where the dispute is pending
Value Added Tax 1,30.09 1993-94 to 2013-14 Assistant / Deputy / Joint Commissioner (Appeals)
32.02 1995-96 to 2011-12 Tribunal
6,42.29 1998-99 to 2004-05 High Court
Service Tax 31,96.37 2014-15 to June 2017 CESTAT
16,77.00 2005-06 to 2013-14 Supreme Court
Income Tax 45,43.20 2016-2017 Commissioner of Income Tax (Appeals)
viii. The Company has not defaulted in the repayment of dues to financial institution, banks, Government or debenture holders.
ix. (a) The Company has not raised any money by the way of initial public offer or further public offer (including debt instruments)
during the year. Hence reporting on utilization of such money does not arise; and
(b) The term loans were applied for the purposes for which the loans were obtained.
x. To the best of our knowledge and belief and according to the information and explanations given to us, during the year, no fraud by
the Company or material fraud on the Company by its employees or officers were noticed during the course of our audit.
xi. The Company has paid / provided for managerial remuneration within limits of section 197 read with schedule V to the Companies
Act, 2013.
xii. The Company is not a Nidhi Company and hence reporting under clause 3(xii) of the Order is not applicable.
xiii. According to the information and explanations furnished to us and based on our examination of the records of the Company, all
transactions with the related parties are in compliance with sections 177 and 188 of the Companies Act, 2013.
The details of such transactions have been disclosed in the financial statements as required by the applicable accounting standards.
xiv. During the year, the Company has not made any preferential allotment or private placement of shares or fully or partly convertible
debentures under section 42 of the Companies Act, 2013.
xv. In our opinion and according to the information and explanations given to us and based on our examination of the records of the
Company, the Company has not entered into any non-cash transactions with Directors or persons connected with them.
xvi. The Company is required to be registered under section 45-IA of the Reserve Bank of India Act, 1934 and has obtained registration.
For Sundaram & SrinivasanChartered Accountants
Firm Registration. No. 004207SK.Srinivasan
Place: Chennai PartnerDate : 30th May 2019 Membership Number : 005809

Sundaram Finance Limited
78
ANNEXURE - B TO THE INDEPENDENT AUDITOR’S REPORT OF EVEN DATE ON THE STANDALONE FINANCIAL STATEMENTS OF
SUNDARAM FINANCE LIMITED, CHENNAIReport on the Internal Financial Controls with reference to Financial Statements under Clause (i) of Sub-section 3 of
Section 143 of the Companies Act, 2013 (“the Act”)
WehaveauditedtheinternalfinancialcontrolsoverfinancialreportingofSundaramFinanceLimited,Chennai(“theCompany”)asat
31st March, 2019 in conjunction with our audit of the standalone financial statements of the Company for the period ended on that date.
Management’s Responsibility for Internal Financial Controls with reference to Financial Statements
The Company’s Management is responsible for establishing and maintaining internal financial controls with reference to financial statements
based on the internal control over financial reporting criteria established by the Company, considering the essential components of internal
control stated in the Guidance Note on Audit of Internal Financial Controls Over Financial Reporting issued by the Institute of Chartered
Accountants of India (ICAI). These responsibilities include the design, implementation and maintenance of adequate internal financial
controls with reference to financial statements that were operating effectively for ensuring the orderly and efficient conduct of its business,
including adherence to the respective Company’s policies, the safeguarding of its assets, the prevention and detection of frauds and errors,
the accuracy and completeness of the accounting records, and the timely preparation of reliable financial information, as required under
the Companies Act, 2013.
Auditor’s Responsibility
Our responsibility is to express an opinion on the Company's internal financial controls over financial reporting with reference to financial
statementsbasedonouraudit.WeconductedourauditinaccordancewiththeGuidanceNoteonAuditofInternalFinancialControlsOver
Financial Reporting (the “Guidance Note”) and the Standards on Auditing, issued by ICAI and deemed to be prescribed under section
143(10) of the Companies Act, 2013, to the extent applicable to an audit of internal financial controls, both issued by the Institute of
Chartered Accountants of India. Those Standards and the Guidance Note require that we comply with ethical requirements and plan and
perform the audit to obtain reasonable assurance about whether adequate internal financial controls over financial reporting with reference
to financial statements were established and maintained and if such controls operated effectively in all material respects.
Our audit involves performing procedures to obtain audit evidence about the adequacy of the internal financial controls system with
reference to financial statements over financial reporting and their operating effectiveness. Our audit of internal financial controls over
financial reporting with reference to financial statements included obtaining an understanding of internal financial controls over financial
reporting with reference to financial statements, assessing the risk that a material weakness exists, and testing and evaluating the design
and operating effectiveness of internal control based on the assessed risk. The procedures selected depend on the auditor’s judgement,
including the assessment of the risks of material misstatement of the financial statements, whether due to fraud or error.
WebelievethattheauditevidencewehaveobtainedissufficientandappropriatetoprovideabasisforourauditopinionontheCompany’s
internal financial controls system with reference to financial statements over financial reporting with reference to financial statements.

Annual Report2018-1979
Meaning of Internal Financial Controls over Financial Reporting
A Company's internal financial control with reference to financial statements over financial reporting is a process designed to provide
reasonable assurance regarding the reliability of financial reporting and the preparation of financial statements for external purposes in
accordance with generally accepted accounting principles. A Company's internal financial control with reference to financial statements
over financial reporting includes those policies and procedures that;
(i) pertain to the maintenance of records, that in reasonable detail, accurately and fairly reflect the transactions and dispositions of
the assets of the Company;
(ii) provide reasonable assurance that transactions are recorded as necessary to permit preparation of financial statements in
accordance with generally accepted accounting principles, and that receipts and expenditures of the Company are being made
only in accordance with authorisations of management and directors of the Company; and
(iii) provide reasonable assurance regarding prevention or timely detection of unauthorised acquisition, use, or disposition of the
Company's assets that could have a material effect on the financial statements.
Inherent Limitations of Internal Financial Controls over Financial Reporting with reference to Financial Statements
Because of the inherent limitations of internal financial controls over financial reporting with reference to financial statements, including
the possibility of collusion or improper management override of controls, material misstatements due to error or fraud may occur and not
be detected. Also, projections of any evaluation of the internal financial controls over financial reporting to future periods are subject to
the risk that the internal financial control with reference to financial statements over financial reporting may become inadequate because
of changes in conditions, or that the degree of compliance with the policies or procedures may deteriorate.
Opinion
In our opinion, the Company has, in all material respects, an adequate internal financial controls system with reference to financial
statements over financial reporting and such internal financial controls over financial reporting were operating effectively as at 31st March,
2019, based on the internal control over financial reporting with reference to financial statements criteria established by the Company
considering the essential components of internal control stated in the Guidance Note on Audit of Internal Financial Controls over Financial
Reporting issued by the Institute of Chartered Accountants of India.
For Sundaram & Srinivasan
Chartered Accountants
Firm Registration. No. 004207S
K.Srinivasan
Place: Chennai Partner
Date : 30.05.2019 Membership Number : 005809

Sundaram Finance Limited
80
S Viji S Prasad Chairman Director
T T Srinivasaraghavan Harsha Viji A N Raju Managing Director Deputy Managing Director Director (Operations)
M Ramaswamy P Viswanathan Chief Financial Officer Secretary & Compliance Officer
As per our report of even date attachedFor Sundaram & SrinivasanChartered AccountantsRegistration No.004207SK SrinivasanPartnerMembership No.5809Place : ChennaiDate : 30th May, 2019
Balance Sheet as at 31st March, 2019 (` in lakhs)
Note March 31, 2019 March 31,2018 April 01, 2017 ASSETS Financial Assets Cash and cash equivalents 7 129,78.52 126,39.56 90,70.62 Bank Balances 8 708,84.47 855,70.36 660,40.53 Derivative financial instruments 9 72,79.83 – – Receivables 10
(I) Trade receivables 17,44.88 19,76.28 11,84.38 (II) Other receivables 11.95 13.16 4,37.73
Loans 11 27271,48.03 22002,99.64 15609,92.39 Investments 12 1866,32.98 2206,80.00 1686,22.01 Other Financial assets 13 12,67.69 11,16.59 8,96.04 Non-Financial Assets Current tax assets (Net) 118,26.62 173,42.04 156,42.13 Deferred tax assets (Net) 14 80,11.44 53,70.73 65,77.80 Investment Property 15 79,66.60 70,91.14 71,23.93 Property, Plant and Equipment 16 213,51.77 216,40.02 266,36.30 Intangible assets under development 17 – 20.94 98.74 Other intangible assets 17 11,90.88 6,62.63 9,43.07 Other non-financial assets 18 66,22.04 66,46.63 52,73.53 Total Assets 30649,17.70 25810,69.72 18695,39.20 LIABILITIES AND EQUITY Liabilities Financial Liabilities Derivative financial instruments 9 – 13,78.55 49,38.51 Payables 19 (I) Trade Payables
i) Total outstanding dues of micro enterprises and small enterprises 85.84 – –ii) Total outstanding dues of creditors other than micro enterprises and small enterprises 94,28.41 65,21.50 69,28.28
(II) Other Payables i) Total outstanding dues of micro enterprises and small enterprises – – –
ii) Total outstanding dues of creditors other than micro enterprises and small enterprises 8,42.93 8,01.05 107,87.68 Debt securities 20 10479,53.29 9244,85.76 9573,94.19 Borrowings (Other than debt securities) 21 9737,06.76 7690,32.34 1305,41.54 Deposits 22 3064,03.94 2579,08.80 2484,44.77 Subordinated liabilities 23 1725,16.68 1594,89.32 892,88.33 Other financial liabilities 24 421,52.63 401,67.98 516,39.99 Non-Financial Liabilities Provisions 25 51,36.08 62,69.06 32,46.39 Other non-financial liabilities 26 23,10.08 16,52.24 12,58.05 Equity Equity share capital 27 111,10.39 111,10.39 111,10.39 Other equity (Refer Statement of Changes in equity) 4932,70.67 4022,52.73 3539,61.08 Total Liabilities and Equity 30649,17.70 25810,69.72 18695,39.20
Significant Accounting policies and Impact of First time adoption of Ind AS 1-6 Balance Sheet, Statement Profit and Loss and other disclosures 7-47

Annual Report2018-1981
Statement of Profit and Loss for the Year Ended 31st March, 2019
S Viji S Prasad Chairman Director
T T Srinivasaraghavan Harsha Viji A N Raju Managing Director Deputy Managing Director Director (Operations)
M Ramaswamy P Viswanathan Chief Financial Officer Secretary & Compliance Officer
As per our report of even date attachedFor Sundaram & SrinivasanChartered AccountantsRegistration No.004207SK SrinivasanPartnerMembership No.5809Place : ChennaiDate : 30th May, 2019
(` in lakhs)
Particulars Note 2018-19 2017-18
Revenue from operationsInterest Income 28 2937,88.12 2393,69.13 Lease Rental income (Net) 57,08.83 74,80.53 Fees and Commission Income 29 231,02.32 214,83.95 Dividend Income 33,04.86 26,34.88 Income from other Services 23,55.09 25,18.38 Recovery of Bad debts 21,72.26 18,67.25 Net gain on fair value changes 30 87,19.05 43,50.66 Net gain on derecognition of financial instruments under amortised cost category 6,10.61 9,22.40
Total Revenue from operations 3397,61.14 2806,27.18 Other Income 31 20,55.58 49,12.76
Total Income 3418,16.72 2855,39.94 Expenses
Finance cost 32 1762,50.94 1346,02.27 Employee benefit expenses 33 322,42.51 278,26.46 Administrative & other expenses 34 276,65.73 232,27.33 Depreciation & amortisation 53,96.77 63,61.64 Impairment on financial instruments 35 107,33.14 85,50.84
Total expenses 2522,89.09 2005,68.54 Profit/(loss) before exceptional items and tax 895,27.63 849,71.40 Exceptional item 44.01 592,43.45 –Profit/(loss) before tax 1487,71.08 849,71.40 Tax expense 14 361,40.20 286,27.75 Current tax 391,45.90 274,20.68 Deferred tax (30,05.70) 12,07.07
Profit/(loss) after tax 1126,30.88 563,43.65 Other Comprehensive IncomeA (i) Items that will not be reclassified to profit or loss
Remeasurements of the defined benefit plans (6,17.68) (2,32.09) (ii) Income tax relating to items that will not be reclassified to profit or loss 2,15.84 81.10
Sub-total (A) (4,01.84) (1,50.99)B (i) Items that will be reclassified to profit or loss
Fair value change on cashflow hedge 10,44.49 – (ii) Income tax relating to items that will be reclassified to profit or loss (3,64.99) –Sub-total (B) 6,79.50 –Other Comprehensive Income (A + B) 2,77.66 (1,50.99)Total Comprehensive Income for the period 1129,08.54 561,92.66 Earnings per equity share (on PAT)Basic & diluted 101.37 50.71

Sundaram Finance Limited
82
Statement of Changes in Equity for the year ended 31st March 2019(a) Equity Share Capital (` in lakhs)
Particulars AmountBalance as at 1st April 2017 111,10.39Changes in equity share capital during the year –Balance as at 31st March, 2018 111,10.39Changes in equity share capital during the year –Balance as at 31st March 2019 111,10.39
(b) Other equity (`in lakhs)
Particulars
Reserves and Surplus Other Comprehensive
Income
Total
Capital Reserve
Share Options Outstanding Account
Statutory Reserve
General Reserve
Retained Earnings
Effective portion of cash flow hedge
Balance as at 01st April 2017 6,59.80 1,66.61 889,83.45 2004,66.08 636,85.14 – 3539,61.08 (A) Profit After tax for the year 563,43.65 563,43.65 (B) Other comprehensive income: –Remeasurements of the defined benefit plans (1,50.99) (1,50.99)Fair value change on cashflow hedge – –
Total Comprehensive income for the year (A)+(B) – – – – 561,92.66 – 561,92.66
Dividends (Including dividend distribution tax) (81,59.51) (81,59.51)Options Granted during the year 2,76.13 2,76.13 Cost of shares transferred on exercise of option (4.93) (4.93)Deferred Employee Compensation Cost (12.70) (12.70)Transfer to general reserve (1,95.00) (243,39.02) (245,34.02)Transfer to Statutory reserve (106,59.02) (106,59.02)Transfer from Share Options Outstanding account 1,95.00 1,95.00 Transfer from Retained earnings 106,59.02 243,39.02 349,98.04 Balance as at 31st March, 2018 6,59.80 2,30.11 996,42.47 2250,00.10 767,20.25 – 4022,52.73 (A) Profit After tax for the year 1126,30.88 1126,30.88 (B) Other comprehensive income:Remeasurements of the defined benefit plans (4,01.84) (4,01.84)Fair value change on cashflow hedge 6,79.50 6,79.50 Total Comprehensive income for the year (A)+(B) – – – – 1122,29.04 6,79.50 1129,08.54 Dividends (Including dividend distribution tax) (222,17.54) (222,17.54)Options Granted during the year 3,44.72 3,44.72 Cost of shares transferred on exercise of option (6.35) (6.35)Deferred Employee Compensation Cost (11.43) (11.43)Transfer to general reserve (2,69.79) (997,30.11) (999,99.90)Transfer to Statutory reserve (225,26.18) (225,26.18)Transfer from Share Options Outstanding account 2,69.79 2,69.79 Transfer from Retained earnings 225,26.18 997,30.11 1222,56.29 Balance as at 31st March 2019 6,59.80 2,87.26 1221,68.65 3250,00.00 444,75.46 6,79.50 4932,70.67
Description of nature and purpose of other equity:a) Capital Reserve: Represents reserve created on account of amalgamations and arrangements.b) Share Options Outstanding Account: Represents reserve on grant of option to employees of the company / group company under Employee Stock option Scheme.c) Statutory reserve: Represents reserve created as per Section 45-IC of the Reserve Bank of India Act, 1934.d) General reserve: Represents amount appropriated from retained earnings.
S Viji S Prasad Chairman Director
T T Srinivasaraghavan Harsha Viji A N Raju Managing Director Deputy Managing Director Director (Operations)
M Ramaswamy P Viswanathan Chief Financial Officer Secretary & Compliance Officer
As per our report of even date attachedFor Sundaram & SrinivasanChartered AccountantsRegistration No.004207SK SrinivasanPartnerMembership No.5809Place : ChennaiDate : 30th May, 2019

Annual Report2018-1983
Cash Flow Statement
2018-19 2017-18
A. CASH FLOW FROM OPERATING ACTIVITIES:
Profit before tax 1487,71.08 849,71.40
Add: Finance costs 1762,50.94 3250,22.02 1346,02.27 2195,73.67
Depreciation and Amortisation expense 53,96.77 63,61.64
Impairment on financial instruments 107,33.14 85,50.84
(Gain)/loss on sale of property, plant and equipment 6,66.06 5,54.99
Share-based payment expense 2,47.83 1,85.37
Derivatives MTM (76,13.89) (35,59.96)
Exchange loss on foreign currency translations 80,11.55 31,66.29
Fair value adjustment of Investments (11,05.16) (7,90.70)
Dividend income (33,04.86) (26,34.88)
(Gain) / Loss on disinvestment of shares - Exceptional item (592,43.45) –
OPERATING PROFIT BEFORE WORKING CAPITAL CHANGES 2788,10.02 2314,07.26
(Increase)/ Decrease in Leased assets - net of sales (32,96.04) 3,54.12
(Increase)/ Decrease in Bank deposits 192,15.72 (306,92.15)
(Increase)/ Decrease in SLR Investments (net) (60,61.37) (26,60.01)
(Increase)/ Decrease in trade and other receivables 2,36.36 (3,65.72)
(Increase)/ Decrease in Loans (5371,10.32) (6478,22.15)
(Increase)/ Decrease in Other financial assets (1,34.19) (2,20.72)
(Increase)/ Decrease in Other non-financial assets 31,24.55 (65,39.72)
Increase/ (Decrease) in trade and other payables 30,34.63 (103,93.41)
Increase/(Decrease) in financial liabilities (56,81.02) (106,51.98)
Increase/(Decrease) in other non-financial liabilities and provisions (11,37.43) (5278,09.11) 31,70.77 (7058,20.97)
Cash generated from Operations (2489,99.09) (4744,13.71)
Financial cost (1423,41.15) (1074,58.48)
Direct Taxes Paid (365,00.00) (1788,41.15) (238,00.00) (1312,58.48)
NET CASH FROM OPERATING ACTIVITIES (A) (4278,40.25) (6056,72.18)
(` in lakhs)

Sundaram Finance Limited
84
Cash Flow Statement (Contd.)
S Viji S Prasad Chairman Director
T T Srinivasaraghavan Harsha Viji A N Raju Managing Director Deputy Managing Director Director (Operations)
M Ramaswamy P Viswanathan Chief Financial Officer Secretary & Compliance Officer
As per our report of even date attachedFor Sundaram & SrinivasanChartered AccountantsRegistration No.004207SK SrinivasanPartnerMembership No.5809Place : ChennaiDate : 30th May, 2019
2018-19 2017-18
B. CASH FLOW FROM INVESTING ACTIVITIES:
Purchase and construction of property, plant and equipment (26,60.03) (17,48.35)
Purchase and construction of investment properties (9,79.10) –
Purchase and generation of intangible assets (9,20.50) (5,24.41)
Purchase of Equity instruments – (226,45.50)
Sale of Equity instruments 973,20.84 –
Purchase of other investments (7549,59.00) (7046,75.94)
Sale of other investments 7610,25.38 6899,12.17
Proceeds from sale of property, plant and equipment, intangible assets and investment property
6,77.36 3,11.52
Dividend income 33,04.86 26,34.88
NET CASH FROM INVESTING ACTIVITIES (B) 1028,09.81 (367,35.63)
C. CASH FLOW FROM FINANCING ACTIVITIES:
Debt securities, deposits, sub-ordinated liabilities and other borrowings
Availment 27980,71.58 28605,05.21
Repayment (24504,84.64) (22063,68.95)
Dividend Paid (including dividend distribution tax) (222,17.54) (81,59.51)
NET CASH FROM FINANCING ACTIVITIES (C) 3253,69.40 6459,76.75
NET INCREASE IN CASH AND CASH EQUIVALENTS (A)+(B)+(C) 3,38.96 35,68.94
CASH AND CASH EQUIVALENTS AT THE BEGINNING OF THE YEAR 126,39.56 90,70.62
CASH AND CASH EQUIVALENTS AT THE END OF THE YEAR 129,78.52 126,39.56
COMPONENTS OF CASH AND CASH EQUIVALENTS
AT THE END OF THE YEAR
Balances with Banks 48,05.28 54,00.78
Cash, Cheques & drafts on hand 81,73.24 72,38.78
129,78.52 126,39.56

Annual Report2018-1985
General information:Sundaram Finance Limited (‘the Company’) is a Public Limited Company incorporated in India with its registered office located at No.21, Patullous Road, Chennai – 600002. The Company is registered as a Non-Banking Finance Company (Deposit taking) with Reserve Bank of India and is primarily engaged in the business of financing of Commercial vehicles, Cars, construction equipment and other vehicles in the retail segment.
The equity shares of the Company are listed on the National Stock Exchange of India Limited.
SIGNIFICANT ACCOUNTING POLICIES AND IMPACT OF FIRST TIME ADOPTION OF INDIAN ACCOUNTING STANDARDS
Note 1 : Basis of preparation and presentation
1.1 STATEMENT OF COMPLIANCE
The financial statements have been prepared as a going concern for the first time in accordance with the Indian Accounting Standard (‘Ind AS’), notified under section 133 of the Companies Act, 2013 read together with Rule 3 of the Companies (Indian Accounting Standards) Rules,2015 and Companies (Indian Accounting Standards) amendments Rules,2016 issued by the Ministry of Corporate Affairs(MCA). The financial statements of the previous year ended 31st March 2018 which was previously prepared in accordance with the accounting standards notified under section 133 of the Companies Act 2013, read together with para 7 of the Companies(Accounts) rules 2014(herein referred to as Previous GAAP) have been now restated as per Ind AS to provide comparability. The date of transition to Ind AS being 1st April 2017, the financial statements for the year ended 31st March 2017 prepared under Previous GAAP has now been restated as per Ind AS as on 01st April 2017.
In addition, the guidance notes and announcements issued by the Institute of Chartered Accountants of India are also applied, except where the compliance with other statutory provisions requires different treatment.
All the amounts included in Standalone Financial Statements are reported in Indian Rupees (`) and all values are rounded off to the nearest lakhs except where otherwise indicated.
NOTES TO THE ACCOUNTS
1.2 ACCOUNTING CONVENTION The Financial Statements have been prepared under the
historical cost convention except for certain financial instruments that are measured at fair values at the end of each reporting period.
Note 2 : Significant Accounting policies
2.1 REVENUE RECOGNITION As per Ind AS 109, Financial Instruments, Interest income
from financial assets is recognised on an accrual basis using effective interest rate method (EIR). The effective interest rate method is the rate that exactly discounts estimated future cash receipts (including all fees, transaction costs and other premiums or discounts paid or received) through the expected life of the financial instrument to the carrying amount on initial recognition.
For revenue recognition from leasing transactions of the Company, refer Note 2.3 on Leases below.
Effective April 1,2018, the Company has adopted Ind AS 115 “Revenue from Contract with Customers”.
Revenue is recognised upon transfer of control of promised services to customer in an amount that reflects the consideration we expect to receive as per the agreement with the customer.
Where the performance obligation is satisfied over timeand where there is no uncertainty as to measurement or collectability of consideration, revenue is recognised as per the percentage of completion method.
The Company has applied revenue recognition criteria for each distinct performance obligation in relation to service income. The transaction price is allocated to each performance obligation based on the standalone selling price.
Dividend income from investments is recognised when the right to receive payment has been established.
2.2 MEASUREMENT OF FAIR VALUES Fair value is the price that would be received to sell an asset
or paid to transfer a liability in an orderly transaction between market participants at the measurement date. The Company’s accounting policies and disclosures require the measurement of financial and non-financial assets and liabilities at fair values. The Company has established policies and procedures with respect to measurement of fair values.

Sundaram Finance Limited
86
2.3 FINANCIAL INSTRUMENTS A financial instrument is any contract that gives rise to a
financial asset for one entity and a financial liability or equity instrument for another entity. Financial instruments also include derivative contracts such as foreign currency forward contracts and cross currency swaps. Financial assets and financial liabilities are recognised when the Company becomes a party to the contractual provisions of the instruments.
Financial Assets / Liabilities
Financial assets and financial liabilities are initially measured at fair value. Transaction costs directly attributable to the acquisition of financial assets or financial liabilities measured at fair value through profit or loss are recognised immediately in profit or loss.
Transaction costs directly attributable to the acquisition or issue of financial assets and financial liabilities that are measured at amortised cost are added to or deducted from the fair value of the financial assets or financial liabilities, as appropriate, on initial recognition.
Classification and subsequent measurement
The Company classifies its financial assets as subsequently measured at either amortized cost or fair value depending on the Company’s business model for managing the financial assets and the contractual cash flow characteristics of the financial assets.
A financial asset is measured at amortised cost only if both of the following conditions are met:
• Theassetisheldwithinabusinessmodelwhoseobjectiveis to hold them to collect contractual cash flows and
• Thecontractualtermsofthefinancialassetgiveriseonspecified dates to cash flows that are solely payments of principal and interest on the amount outstanding.
Such Financial assets are subsequently measured at amortised cost using the Effective Interest rate method. Financial assets are subsequently measured at fair value through other comprehensive income if these financial assets are held within a business model whose objective is achieved by both collecting contractual cash flows and selling financial assets and the contractual terms of financial asset give rise on specified dates to cash flows that are solely payments of principal and interest on principal and the interest on the principal outstanding. Any financial instrument, which does
not meet the criteria for categorisation as amortized cost or as Fair Value Through Other Comprehensive Income (FVTOCI), is classified as at Fair Value Through P&L (FVTPL). In addition, the Company may elect to classify a debt instrument, which otherwise meets amortized cost or FVTOCI criteria, as at FVTPL. However, such election is allowed only if doing so reduces or eliminates a measurement or recognition inconsistency (referred to as ‘accounting mismatch’). Debt instruments included within the FVTPL category are measured at fair value with all changes recognised in the profit and loss.
All financial liabilities are subsequently measured at amortised cost using the effective interest rate method except for financial liabilities at FVTPL. A financial liability is classified as FVTPL if it is held-for-trading or it is a derivative or it is designated as FVTPL on initial recognition. Interest expense, foreign exchange gains (losses) and any gains and losses on de-recognition are recognised in the profit or loss.
Equity Investments
The Company accounts for equity investments in subsidiaries, associates and joint ventures at cost less impairment.
All other equity investments are designated at Fair Value Through Other Comprehensive Income (FVTOCI). The fair value changes on the instrument, excluding dividends, are recognised under Other Comprehensive Income (OCI) . There is no recycling of the amounts from OCI to profit and loss on sale of investment.
Fair Value Hierarchy
The fair value hierarchy is based on inputs to valuation techniques that are used to measure fair value that are either observable or unobservable and consists of the following three levels:
Level I - This level includes financial assets that are measured by reference to quoted prices in active markets for identical assets or liabilities.
Level 2 - This level includes financial assets and liabilities, measured using inputs other than quoted prices included within Level 1 that are observable for the asset or liability, either directly (i.e. price) or indirectly (i.e. derived from prices).
Level 3 - This level includes financial assets and liabilities measured using inputs that are not based on observable market data (unobservable inputs). Fair values are determined in whole or in part, using
NOTES TO THE ACCOUNTS (Contd.)

Annual Report2018-1987
a valuation model based on assumptions that are neither supported by prices from observable current market transactions in the same instrument nor are they based on available market data.
Impairment of Financial Assets
The Company applies the Expected Credit Loss (ECL) model for recognising impairment losses on financial assets.
12 months ECL represents the expected default events on the financial asset that are possible within 12 months after the reporting date.
Wherethecreditriskonthefinancialassetshasnotincreasedsignificantly since initial recognition, the loss is measured at an amount equal to 12 months ECL.
Wherethecreditriskonthefinancialassetshasincreasedsignificantly since initial recognition, the loss is measured at an amount equal to the lifetime expected credit loss.
Contract Asset and Contract Liability.
Revenue in excess of invoicing is classified as contract assets while invoicing in excess of revenue is classified as contract liability.
Value of contract Asset/liability is determined based on the time spent on each project or on period basis for Annual maintenance contract.
De-recognition of financial assets and financial liabilities
Financial asset: A financial asset or a part thereof is primarily de-recognised when:
The right to receive contractual cash flows from the asset has expired, or
The Company has transferred its right to receive cash flows from the asset or has assumed an obligation to pay the received cash flows in full without material delay to a third party under a ‘pass-through’ arrangement; and either (a) the Company has transferred substantially all the risks and rewards of the asset, or (b) the Company has neither transferred nor retained substantially all the risks and rewards of the asset, but has transferred control of the asset.
If the Company enters into transactions whereby it transfers assets recognised on its balance sheet, but retains all or substantially all the risks and rewards of the transferred assets, the transferred assets are not de-recognised.
On de-recognition of a financial asset, the difference between the carrying amount of the asset and the consideration received is recognised in profit or loss.
Financial liabilities: The Company de-recognises a financial liability when its contractual obligations are discharged, cancelled or expired.
Offsetting of financial instruments
Financial assets and financial liabilities are offset and the net amount is reported in the balance sheet when the Company has a legally enforceable right to offset the recognised amounts and there is an intention to settle on a net basis, or realise the asset and settle the liability simultaneously.
2.4 LEASES A lease is classified at the inception of the lease as finance or
operating lease.
Leases are classified as finance leases whenever the terms of the lease transfer substantially all the risks and rewards incidental to ownership to the lessee. All other leases are classified as operating leases.
1. Finance lease (as a lessor): Amount due from lessees under finance leases are recorded in balance sheet as receivables, being the amount equal to net investment in lease. The net investment in lease is the gross investment in lease less unearned finance income.
The lease income earned are recognised in the profit and loss account based on pattern reflecting constant periodic return on the Company’s net investment in lease.
2. Finance lease (as a lessee) : The Company recognises finance lease as an asset and liability in the balance sheet, at the inception date fair value of the leased property or, if lower, at the present value of the minimum lease payments.
Lease payments are accounted as finance charge in statement of profit and loss.
At the end of every reporting period the Company determines whether the asset has become impaired and provides for impairment loss if necessary.
3. Operating lease (as a lessor): Assets leased out on operating lease are recognised as an asset under Property, Plant and Equipment in the balance sheet.
Lease income from operating lease is recognised as incomeonstraightlinebasisovertheleaseterm.Where
NOTES TO THE ACCOUNTS (Contd.)
Sundaram Finance Limited
88
the rentals are structured solely to increase in line with expected general inflation to compensate for the Company’s expected inflationary cost increases, such increases are recognised in the year in which such benefits accrue.
4. Operating Lease (as a lessee): Operating lease payments are recognised as expense in the profit & loss Account on a straight-line basis over the lease term unless another systematic basis is more representative of the time pattern or the payments to the lessor are structured to increase in line with the expected general inflation.
2.5 EMPLOYEE BENEFITS Short term Employee benefits
Short term employee benefits for services rendered by employees are recognised during the period when the services are rendered.
Post Employment benefits
Defined contribution plans
1. Superannuation: The Company contributes to the Superannuation fund, which is administered by trustees and managed by the Life Insurance Corporation of India (LIC). The contributions are charged to the Statement of Profit and Loss.
2. Employees’ Pension Scheme and Employees’ State Insurance Scheme: The Company also contributes to a government administered Employees’ Pension Scheme under the Employees Provident Fund Act and to Employees’ State Insurance Schemes on behalf of its employees.
Defined benefit plans
1. Gratuity: The Company makes an annual contribution to a Gratuity Fund administered by trustees and managed by LIC. The Company accounts its liability based on actuarial valuation as at the balance sheet date using the Projected Unit Credit method.
The change in defined benefit plan liability is split into changes arising out of service, interest cost and re-measurements and the change in defined benefit plan asset is split between interest income and re-measurements. Changes due to service cost and net interest cost / income is recognised in the statement of profit and loss.
Re-measurement of the net defined benefit liability/(asset) comprising actuarial gains and losses and the return on the plan assets (excluding amounts included in net interest on the net defined benefit liability /asset) are recognised in other comprehensive income.
2. Provident Fund: Contributions are made to the Company’s Employees Provident Fund Trust in accordance with the fund rules. The interest rate payable by the trust to the beneficiaries every year is notified by the Government. The Company has an obligation to make good the shortfall, if any, between the return from the Investment of the trust and the notified interest rate. The monthly contribution made by the Company is recognised as employee benefit expense in the Statement of Profit and Loss.
3. Retired Employee Medical scheme: The Post-retirement medical benefit plan provides for reimbursement of health care costs to certain categories of employees post their retirement. The reimbursement is subject to an overall ceiling sanctioned based on cadre of the employee at the time of retirement. The plan is unfunded. Employees do not contribute to the plan.
Other Long Term Employee Benefits
1. Leave Encashment : The Company contributes to a staff leave encashment scheme managed by SBI Life Insurance Company Limited. The Company accounts its liability based on an actuarial valuation, as at the balance sheet date, using the Projected Unit Credit method.
2. Employee Assured Bonus Scheme & Sick leave: The estimated liability in respect of other long term benefits like Employee Assured Bonus Scheme and entitlement of sick leave has been provided based on actuarial valuation.
2.6 SHARE BASED PAYMENTS: Employee Stock Options : The Company has an employee
stock option scheme in accordance with SEBI guidelines 1999. It recognises the compensation expense relating to share based payments in accordance with Ind AS 102 - Share based payments.
The equity settled share based payments to employees is measured at the fair value of the equity instrument at the grant date.
NOTES TO THE ACCOUNTS (Contd.)

Annual Report2018-1989
The fair value determined on the grant date of equity settled share payment is expensed on straight line basis over the vesting period based on Company’s estimate of equity instruments that will eventually vest with a corresponding increase in equity. At the end of each financial year, the Company revises its estimate of the number of equity instruments that are expected to vest. The impact of the revision of the original estimates, if any, is recognised in profit and loss in such a way that the cumulative expense reflects the revised estimate with a corresponding adjustment to equity.
The Option carries neither right to Dividend nor voting rights.
2.7 INCOME TAXES Tax expense comprises current and deferred tax. It is
recognised in profit or loss except to the extent that it relates to a business combination, or items recognised directly in equity or in OCI.
Current tax
Current tax is measured at the amount expected to be paid in respect of taxable income for the year in accordance with the Income Tax Act, 1961. Current tax comprises the tax payable on the taxable income or loss for the year and any adjustment to the tax payable in respect of previous years. It is measured using tax rates enacted at the reporting date.
Current tax assets and liabilities are offset only if, the Company has a legally enforceable right to set off the recognised amounts; and intends either to settle on a net basis, or to realise the asset and settle the liability simultaneously.
Deferred tax
Deferred tax is recognised in respect of temporary differences between the carrying amounts of assets and liabilities in the financial statements and the corresponding tax bases used in the computation of taxable income.
The measurement of deferred tax reflects the tax consequences that would follow from the manner in which the Company expects, at the reporting date, to recover or settle the carrying amount of its assets and liabilities. It is measured using tax rates enacted or substantively enacted at the reporting date.
Deferred tax liabilities are recognised for all taxable temporary differences. Deferred tax assets are recognised to the extent that it is probable that future taxable income will be available against which the deductible temporary differences can be utilized. Deferred tax assets are reviewed at each reporting
date and based on management’s judgement, are reduced to the extent that it is no longer probable that the related tax benefit will be realized.
Unrecognised deferred tax assets are reassessed at each reporting date and recognised to the extent that it has become probable that future taxable profits will be available against which they can be used.
Deferred tax assets and liabilities are offset only if the Company:
a) Has a legally enforceable right to set off current tax assets against current tax liabilities; and
b) The deferred tax assets and the deferred tax liabilities relate to income taxes levied by the same taxation authority.
Current and Deferred tax for the year
Current and deferred tax are recognised in profit or loss, except when they relate to items that are recognised in other comprehensive income or directly in equity, in which case, the current and deferred tax are also recognised in other comprehensive income or directly in equity respectively.
2.8 PROPERTY, PLANT AND EQUIPMENT (PPE) The property plant and equipment are the assets held for the
use in the supply of services.
Property, plant and equipment’s are stated in the balance sheet at cost (net of duty/ tax credit availed) less accumulated depreciation and accumulated impairment losses.
Cost of acquisition is inclusive of freight, non-refundable duties & taxes and other directly attributable cost of bringing the asset to its working condition for the intended use.
Freehold land is not depreciated.
An item is recognised as property, plant and equipment if and only if it is probable that future economic benefits associated with the item will flow to the Company and its costs can be measured reliably. Subsequent expenditure is added to the carrying amount or recognized as separate asset, when the Company expects future economic benefits from that item.
Depreciation is recognised to write off the cost of assets less their residual values over their useful lives, using the written down value method. The estimated useful lives, residual values and depreciation method are reviewed at the end of each reporting period, with the effect of any changes in estimate accounted for on a prospective basis.
NOTES TO THE ACCOUNTS (Contd.)

Sundaram Finance Limited
90
Estimated useful lives of the assets, based on technical assessment, which are different in certain cases from those prescribed in Schedule II of the Companies Act 2013, are as follows:
(in years)
Assets Plant and machinery
Computers-End user services
Computers-Servers and
Network
Vehicles Office equipment
Own 15 7 10 5 8
Operating lease
5 3 6 4 –
The property plant and equipment with definite life are reviewed for impairment whenever the events or changes indicate that their carrying value may not be recoverable.
Depreciation charge for impaired assets is adjusted in future periods in such a manner that the revised carrying amount of the asset is allocated over its remaining useful life.
An item of the property, plant and equipment is de-recognised upon disposal or when no future economic benefits are expected to arise from the continued use of asset. Any gain or loss arising on the disposal or retirement of the item of property, plant and equipment is determined as the difference between the sale proceeds and carrying amount of the asset and is recognised in profit and loss.
2.9 INVESTMENT PROPERTY Properties held to earn rental income or for capital
appreciation or both and that is not occupied by the Company is classified as Investment Property.
It is measured initially at cost of acquisition including transaction costs, borrowing cost and other directly attributable cost in bringing the asset to its working condition for its intended use. Subsequent expenditure is capitalized to the asset carrying amount only when it is probable that the future economic benefit associated with the expenditure will flow to the Company.
The fair value of investment property has been determined by property valuer, having recognised qualifications and experience.
Depreciation is provided on written down value method by adopting useful life of 60 years in the case of Building as prescribed under schedule II to the Companies Act, 2013 after retaining 5% of Original cost as residual value for Buildings.
2.10 INTANGIBLE ASSETS Intangible assets are identified non-monetary assets without
physical existence.
Intangible assets with finite useful lives that are acquired separately are capitalized and carried at cost less accumulated amortization and accumulated impairment losses. Amortization is recognised on a straight-line basis over the estimated useful life of the asset.
Intangible assets are recognised in books only when it is probable that future economic benefits associated with the asset will flow to the Company and the cost can be measured reliably.
The cost of the intangible asset shall include the purchase price, including non-refundable duties and taxes, all the directly attributable costs to bring the intangible to the present location, working condition and intended use.
Intangible assets represent Computer software whose cost is amortized over their expected useful life 2 to 5 years on a straight-line basis.
The estimated useful life and amortization method are reviewed at the end of each reporting period, with the effect of any changes in estimate being accounted for on a prospective basis.
Impairment loss, if any, is provided to the extent, the carrying amount of assets exceeds their recoverable amount. Recoverable amount is the higher of an assets net selling price and the present value of estimated future cash flows expected to arise from the continuing use of the asset and from its disposal at the end of its useful life.
Intangible Assets under development
Development expenditure on new products is capitalized as intangible asset if all the following are demonstrated.
• Technicalfeasibilityofcompletingtheasset
• Intentiontocompletetheasset
• Theabilitytouseorselltheasset
• Probabilitythattheintangibleassetwillgeneratefutureeconomic benefits
• Availabilityoftheadequatetechnical,financialandotherresources to complete the intangible asset
• The ability to measure reliably the expenditureattributable during the development stage
NOTES TO THE ACCOUNTS (Contd.)

Annual Report2018-1991
2.11 IMPAIRMENT OF ASSETS The carrying amounts of assets are reviewed at each balance
sheet date to ascertain impairment based on internal / external factors. An impairment loss is recognised when the carrying amount of an asset exceeds its recoverable amount. The recoverable amount is the higher of the net selling price of the assets and their value in use.
2.12 FOREIGN CURRENCY TRANSACTION Transactions in foreign currency are accounted at the
exchange rates prevailing on the date of the transaction. The foreign currency borrowing being a monetary liability is restated to INR (being the functional currency of the Company) at the prevailing rates of exchange at the end of every reporting period with the corresponding exchange gain/ loss being recognised in profit or loss. The Company enters into forward exchange contracts, forward rate agreements, coupon only swaps and interest rate swaps. The Company undertakes such transactions for hedging its balance sheet. The foreign currency borrowing and derivative swaps are treated as separate transactions.
The derivatives (swaps, forward rate agreements and forward contracts) are classified at fair value through profit or loss (FVTPL) under Ind AS 109, Financial Instruments with the resultant gain or loss being taken to profit or loss.
2.13 DERIVATIVES & HEDGE ACCOUNTING The Company designates certain derivatives held for risk
management as hedging instruments in qualifying hedging relationships. These derivatives qualify for hedge accounting and meet the criteria for cash flow hedge. The effective portion of the gain or loss arising on the fair value measurement of the hedging instrument is recognised in other comprehensive income.
2.14 DIVIDEND The final Dividend on shares is recorded as a liability on the
date of approval by the Shareholders and interim dividends are recorded as a liability on the date of declaration by the Company's Board of Directors
2.15 CASH FLOW STATEMENT Cash flows are reported using the indirect method, whereby
net profit after tax is adjusted for the effects of transactions of non-cash nature, tax and any deferrals or accruals of past or future cash receipts or payments. The cash flows are
prepared for the operating, investing and financing activities of the Company.
2.16 PROVISIONS, CONTINGENT LIABILITIES AND CONTINGENT ASSETS
Provisions are recognised only when the Company has a present obligation (legal or constructive) as a result of past events, and it is probable that it is required to settle the obligation, and a reliable estimate can be made of the amount of obligation.
The amount recognised as a provision is the best estimate of the consideration required to settle the obligation at the reporting date, considering the risk and uncertainties surrounding the obligation.
Contingent liabilities
Contingent liabilities are disclosed when there is a possible obligation arising from past events, the existence of which will be confirmed only by the occurrence or non-occurrence of one or more future uncertain events not wholly within the control of the Company (or)
There is a present obligation that arises from past events where it is either not probable that an outflow of resources will be required to settle the obligation or a reliable estimate of the amount cannot be made.
2.17 EARNINGS PER SHARE The basic earnings per share has been computed by dividing
the net income attributable to equity shareholders by weighted average number of shares outstanding during the year.
The diluted earnings per share have been computed using weighted average number of shares adjusted for effects of all potentially dilutive equity shares.
Note 3 : Approach on exemptions under Ind AS 101 First Time Adoption of Indian Accounting Standards (Ind AS)
MANDATORY EXCEPTIONS ADOPTED BY THE COMPANY
The Company has availed the following mandatory exceptions that are provided to the first time adopters.
1) De recognition of financial assets and financial liabilities
The Company has opted to apply the de recognition requirements as per Ind AS 109 prospectively for transactions on or after 1 April 2017.
NOTES TO THE ACCOUNTS (Contd.)

Sundaram Finance Limited
92
2) Classification and measurement of Financial assets
The Company has determined the classification of financial assets based on facts and circumstances that existed on the date of transition.
OPTIONAL EXEMPTIONS AVAILED BY THE COMPANY The Company has availed the following optional exemptions available to Ind AS upon first time adoption
1) Share based payment transaction
The Company has opted to apply the requirements of Ind AS 102 only to the employee stock options that are yet to be vested as at 1 April 2017.
2) Leases
The Company has evaluated whether an arrangement existing at the transition date contains a lease on the basis of the facts and circumstances existing on the transition date except where the effect is expected to be immaterial
3) Business combination
The Company has elected not to apply Ind AS 103 – Business Combinations retrospectively to past business combinations that occurred before the transition date.
4) Deemed cost
The Company has elected to measure its property plant equipment, intangibles and investment property at the previous GAAP carrying amounts as its deemed cost on the date of transition to Ind AS.
5) Deemed cost of investment in subsidiaries and associate
The Company has elected to measure its investment in subsidiary and associates at the previous GAAP carrying amounts as its deemed cost on the date of transition to Ind AS.
CRITICAL ACCOUNTING JUDGMENTS AND KEY SOURCES OF ESTIMATION UNCERTAINTYOn assessment of the estimates made under the Previous GAAP financial statements, the Company has concluded that there is no necessity to revise the estimates under Ind AS, as there is no objective evidence of an error in those estimates. However, estimates that were required under Ind AS but not required under Previous GAAP are made by the Company for the relevant reporting dates reflecting conditions existing as at that date.
The preparation of financial statements in accordance with Ind AS requires use of estimates and assumptions for some items, which might have an effect on their recognition and measurement in the balance sheet and statement of profit and loss. The estimates and associated assumptions are based on historical experience and other factors that are considered to be relevant. The actual results may differ from these estimates. The Company’s management believes that the estimates used in preparation of the financial statements are prudent and reasonable. Any revision to the accounting estimates is recognised prospectively in the current and future periods.
Note 4 : Standards issued but not yet effective
The amendments to the standard that are issued but not yet effective up to the date of issuance of the standard are disclosed below. The Company intends to adopt these standards, if applicable as and when it becomes effective.
The Ministry of Corporate Affairs has issued the Companies (Indian Accounting Standard) amendments rules 2019 amending the following standards:
Ind AS 116 Leases
Ind AS 116 was issued on 30th March 2019, which shall come into force from 1st April 2019. The standard sets out the principle for the recognition, measurement and disclosure of leases. Principles of Ind AS 116 for lessor are substantially same. However, there is significant change in the way a lessee shall account for leases in its books.
It provides that an entity, being a lessee, shall treat almost all leases, except leases for short-term and leases of low value assets, as finance leases. The entity shall recognise a right-of-use asset and a lease liability whenever it takes any asset on lease. The right-of-use asset shall be measured at cost that comprises of initial value of lease liability, lease payments made on or before the commencement of lease, initial direct costs incurred by the entity and an initial estimated cost of dismantling & removing the leased asset and restoring the site on which the asset is located. The lease liability shall be measured at the present value of the lease payments due, using the implicit interest rate in the lease or lessee’s incremental borrowing rate.
Subsequently, at each balance sheet date, the right-of-use asset shall be depreciated and lease liability shall be increased by interest amount & decreased by amount paid. The right-of-
NOTES TO THE ACCOUNTS (Contd.)

Annual Report2018-1993
use asset may also be measured at revalued amount under revaluation model.
The Company is currently evaluating the impact of the new Lease standard.
Note 5 : Amendments to the Ind AS notified by Ministry of Corporate Affairs, not yet effective Ind AS 12 Income taxes The first amendment requires an entity to create a
corresponding liability for Dividend Distribution Tax (DDT) when it recognises a liability to pay a dividend. The liability for DDT shall be recorded in statement of profit & loss, other comprehensive income or equity, as the case may be.
The second amendment relates to tax consequence of an item whose tax treatment is uncertain. Tax treatment of an item is considered as uncertain when there is uncertainty whether the relevant taxation authority will accept the tax treatment of that item or not.
If there is uncertainty over tax treatment of an item an entity should predict the resolution of the uncertainty. If it is probable that the taxation authority will accept the tax treatment, there will be no impact on the amount of taxable profits/losses, tax bases, unused tax losses/credits and tax rates. In vice-versa case, the entity shall show the effect of the uncertainty for each uncertain tax treatment on account of related items by using either the most likely outcome or the expected outcome of the uncertainty. The Company is currently evaluating the effect of this amendment.
Ind AS 109 Financial Instruments The amendments notified to Ind AS 109 pertain to classification
of a financial instrument with prepayment feature with negative compensation. Negative compensation arises where the terms of the contract of the financial instrument permit the holder to make repayment or permit the lender or issuer to put the instrument to the borrower for repayment before the maturity at an amount less than the unpaid amounts of principal and interest. Earlier, there was no guidance on classification of such instruments.
According to the amendments, these types of instruments can be classified as measured at amortised cost, or measured at fair value through profit or loss, or measured at fair value through other comprehensive income by the lender or issuer if the respective conditions specified under Ind AS 109 are satisfied. The Company is currently evaluating the effect of this amendment.
Ind AS 19 “Employee Benefits”
The amendments to Ind AS 19, Employee Benefits relate to effects of plan amendment, curtailment and settlement. Whenanentitydeterminesthepastservicecostatthetimeof plan amendment or curtailment, it shall remeasure the amount of net defined benefit liability/asset using the current value of plan assets and current actuarial assumptions which should reflect the benefits offered under the plan and plan assets before and after the plan amendment, curtailment and settlement.
The Company does not have any impact on account of this amendment.
Note 6 : Reconciliation between Previous GAAP and Ind AS(i) Equity reconciliation
(` in lakhs)
Particulars Note 31.03.2018 01.04.2017
Equity as per previous GAAP
3970,84.51 3745,62.94
Impact due to Scheme (demerger and merger)
– (228,72.50)
Adjusted Equity as per previous GAAP
3970,84.51 3516,90.44
On application of Effective Interest Rate method
Financial assets (a) 72,19.62 49,67.62
Financial liabilities (a) 15,15.61 11,41.96
Impact on account of Expected credit loss
(b) 96,71.52 93,95.61
Financial assets / Liabilities measured at Fair value through Profit & Loss
(c) 14,56.65 (11.04)
Impact on recognition of securitised loan portfolio
(d) 1,55.81
Derecognition of Financial asset
(e) 23,19.50 28,58.74
Others (f) 2,10.28 1,35.42
Tax impact on above adjustments
(g) (62,70.38) (51,07.28)
Equity as per Ind AS 4133,63.12 3650,71.47
NOTES TO THE ACCOUNTS (Contd.)

Sundaram Finance Limited
94
(ii) Total Comprehensive income reconciliation for the year ended 31st March,2018
(` in lakhs)
Particulars Note Apr-Mar 18Profit as per previous GAAP 532,95.08Adjustments increasing / (decreasing) net profit after tax as reported in the previous GAAP:
Amortisation of net income under EIR method for financial assets
(a) 22,52.00
Amortisation of expenses under EIR method for financial liabilities
(a) 3,73.65
Application of Expected Credit Loss method for loan loss provisions
(b) 2,75.91
Financial assets / liabilities measured at Fair Value through Profit & Loss
(c) 14,67.69
Impact on recognition of securitised loan portfolio
(d) 1,55.81
Derecognition of Financial asset (e) (5,39.24)Others (f) 3,06.95Tax adjustments on above items (g) (12,44.20)Net Profit after tax as per Ind AS 563,43.65Other Comprehensive income (net of taxes) (h) (1,50.99)Total Comprehensive income as per Ind AS 561,92.66
(iii) Effect of Ind AS adoption on Cash flow statement for the year ended 31.03.2018
(` in lakhs)
Particulars Note no. Previous GAAP
Effect of transition to Ind AS
Ind AS
Net Cash flow from operating activities
(a), (c), (d), (e)
& (f)
(3340,33.03) (2716,39.16) (6056,72.18)
Net Cash flow from investing activities
(367,35.63) (367,35.63)
Net Cash flow from financing activities
(a), (c), (d), (e)
3743,40.31 2716,36.44 6459,76.75
Effect of foreign exchange rates
(2.71) 2.71 –
Net increase in cash and cash equivalents
35,68.94 35,68.94
Cash and cash equivalents at the beginning of the year
90,70.62 90,70.62
Cash and cash equivalents at the end of the year
126,39.56 126,39.56
NOTES TO RECONCILIATION BETWEEN PREVIOUS GAAP AND IND AS
a) Under Ind AS, the income from financial assets are recognised under Effective Interest Rate (EIR) method under which the transaction costs, fee income, etc. have been amortised over the underlying period. Similarly, financial expenses are accounted considering the transaction cost under EIR method. Under Previous GAAP, these were accounted upfront.
b) Under Ind AS, impairment loss is provided on Financial Assets as per the expected credit loss method prescribed under Ind AS 109, whereas under Previous GAAP the provisioning/income deferment was made as per the RBI guidelines.
c) Under Ind AS, certain financial assets are measured at fair value through profit or loss (FVTPL), whereas under Previous GAAP, the same was measured at cost / lower of cost or market value, depending on the instrument.
d) Under Ind AS, securitisation fails to satisfy the criteria for de-recognition specified under Ind AS 109, whereas under previous GAAP, Securitised assets were derecognised in the books. The Company has opted the above change only for the transactions after 01.04.2017 in line with Ind AS 101.
e) Under Ind AS, the Profit on Direct assignment transactions are accounted upfront as per Ind AS 109 whereas, under Previous GAAP the profit on assignment were recognised over the tenor of transaction as per RBI guidelines.
f) Under Ind AS, Rental deposits, lease deposits and loan given to employees at concessional rates are initially measured at Fair value and subsequently accounted under amortization method as per Ind AS 109 whereas as per Previous GAAP, measuring at fair value was not required.
g) Tax adjustments include deferred tax impact on account of the above differences between previous GAAP and Ind AS.
h) Under Ind AS, re-measurements i.e Actuarial gains and losses and the return on plan assets, excluding amount included in the net interest expenses on the net defined benefit liability are recognised in Other Comprehensive income instead of profit and loss account as accounted in Previous GAAP.
The Cumulative impact of the above changes as on the transition date is adjusted against the reserves as on 01.04.2017. The subsequent effect of changes for the financial year 2017-18 is disclosed under profit and loss reconciliation.
NOTES TO THE ACCOUNTS (Contd.)

Annual Report2018-1995
Note 7: Cash and cash equivalents(` in lakhs)
March 31, 2019 March 31, 2018 April 1, 2017
Cash on hand 20,63.98 15,72.87 14,44.12
Balances with Banks 48,05.28 54,00.78 26,27.21
Cheques, drafts on hand 61,09.26 56,65.91 49,99.29
TOTAL 129,78.52 126,39.56 90,70.62
Note 8: Bank Balance other than specified in Note 7 above(` in lakhs)
March 31, 2019 March 31, 2018 April 1, 2017
Unpaid dividend account 2,77.16 2,25.33 2,44.28
Balances with banks * 706,07.31 853,45.03 657,96.25
TOTAL 708,84.47 855,70.36 660,40.53
* Bank deposits include,
a) ̀ 611,58.00 lakhs (as on 31.03.2018 `601,11.00 lakhs and as on 31.03.2017 `499,97.10 lakhs) provided as collateral for assets securitised.
b) In accordance with the Reserve Bank of India directives, the company has created a floating charge on the statutory liquid assets comprising bank deposits of ̀ 36,50.00 lakhs (as on 31.03.2018 ̀ 12,44.00 lakhs and as on 31.03.2017 ̀ 121,72.00 lakhs) in favour of trustees representing the deposit holders of the Company.
c) A deposit amounting to `Nil (as on 31.03.2018 - `0.90 lakhs and as on 31.03.2017 - `0.90 lakhs) has been provided for legal purposes.
NOTES TO THE ACCOUNTS (Contd.)
Note 9 : Derivative Financial InstrumentsThe details of the outstanding derivative instruments and their fair values are as below;Part I (` in lakhs)
Particulars 31st March 2019 31st March 2018 1st April 2017
Notional amount
Fair Value Notional amount
Fair Value Notional amount
Fair Value
Assets Liabilities Assets Liabilities Assets Liabilities
(i) Currency derivatives:
- Currency swaps 888,05.16 62,35.34 – 1592,42.93 - 13,04.40 842,44.14 – 28,09.15
- Forward Contracts – – – 203,16.49 - 74.15 220,45.42 – 21,29.36
Subtotal (i) 888,05.16 62,35.34 – 1795,59.42 - 13,78.55 1062,89.56 – 49,38.51
(ii) Interest rate derivatives:
- Forward Rate Agreements & Interest Rate Swaps
300,00.00 10,44.49 – – – – – – –
Subtotal (ii) 300,00.00 10,44.49 – – – – – – –
Total Derivative Financial Instruments (i)+(ii)
1188,05.16 72,79.83 – 1795,59.42 – 13,78.55 1062,89.56 – 49,38.51

Sundaram Finance Limited
96
NOTES TO THE ACCOUNTS (Contd.)
Part II - Included in above (Part I) are derivatives held for hedging and risk management purposes as follows:(` in lakhs)
Particulars 31st March 2019 31st March 2018 1st April 2017Notional amount
Fair Value Notional amount
Fair Value Notional amount
Fair ValueAssets Liabilities Assets Liabilities Assets Liabilities
(i) Cash flow hedging: - Interest rate derivatives 300,00.00 10,44.49 – – – – – – –(ii) Undesignated derivatives 888,05.16 62,35.34 – 1795,59.42 – 13,78.55 1062,89.56 – 49,38.51Total Derivative Financial Instruments (i)+(ii)
1188,05.16 72,79.83 – 1795,59.42 – 13,78.55 1062,89.56 – 49,38.51
Derivatives designated as Hedging InstrumentsThe impact of the hedging instrument on the balance sheet as at 31 March 2019 is as follows: (` in lakhs)
Hedged Instrument Notional Amount
Carrying Amount
Line item in the Balance sheet
Change in fair value used for measuring ineffectiveness for the period
Interest Rate swap/ Forward rate agreement
300,00.00 10,44.49 Derivative Financial Instruments
(10,44.49)
The impact of hedged items on the Balance sheet is as follows: (` in lakhs)
Hedged Item Change in value used for measuring ineffectiveness Cash flow hedge reserve as on 31.03.2019
Fixed rate borrowing / loans (10,44.49) 6,79.50
The effect of cash flow hedge in the statement of profit and loss and other comprehensive income is as follows:(` in lakhs)
Hedged Item Total hedging gain / loss
recognised in OCI
Ineffectiveness recognised in the profit and
loss
Line item in the statement of profit
and loss that include the hedge
ineffectiveness
Amount reclassified from cash flow
hedge reserve to Profit or loss
Line item in the statement of profit
or loss that includes the reclassification
adjustment
Fixed rate borrowing / loans (10,44.49) – NA – NA
Note 10: Receivables(` in lakhs)
March 31, 2019 March 31, 2018 April 1, 2017 Trade receivables- Secured, considered good – – –- Unsecured, considered good 17,33.95 19,57.62 11,70.86 - Receivables which have significant increase in Credit Risk 11.47 16.37 10.59 - Receivables - credit impaired 1.56 8.14 10.39 Less: Impairment loss on the above 2.10 5.85 7.46 Sub-total - Trade receivables 17,44.88 19,76.28 11,84.38 Other receivables- Unsecured, considered good 11.95 13.16 4,37.73 Less: Impairment loss on the above – – –Sub-total - Other receivables 11.95 13.16 4,37.73 TOTAL 17,56.83 19,89.44 16,22.11

Annual Report2018-1997
Note 11: LoansCarried at amortised cost
(` in lakhs)
March 31, 2019 March 31, 2018 April 1, 2017
Hypothecation loans # 25929,22.68 19954,02.33 12927,05.93
Net Investment in hire purchase 789,22.67 1619,81.20 2323,29.64
Term Loans 311,20.09 191,53.76 138,17.66
Advance for business assets 191,50.85 196,33.79 111,25.81
Amount retained on Assets securitised / assigned 111,90.94 140,15.47 194,18.50
Loans repayable on Demand 43,50.08 – –
Bills Purchased and Bills Discounted 16,32.28 12,60.94 6,70.17
Net investment in lease 13,53.17 15,28.11 18,90.09
Other loans @ 43,39.45 38,55.35 41,16.14
Total Loans - Gross 27449,82.21 22168,30.95 15760,73.94
Less: Impaiment loss allowance 178,34.18 165,31.31 150,81.55
Total Loans - Net 27271,48.03 22002,99.64 15609,92.39
Of the above
Secured by tangible assets 27198,49.99 21921,79.33 15606,18.45
Secured by intangible assets – – –
Covered by Bank/Government Guarantees 1,72.61 1,59.17 14.26
Secured by Deposits 3,49.71 3,67.52 3,65.38
Unsecured 246,09.90 241,24.93 150,75.85
Total Loans - Gross 27449,82.21 22168,30.95 15760,73.94
Less: Impaiment loss allowance 178,34.18 165,31.31 150,81.55
Total Loans - Net 27271,48.03 22002,99.64 15609,92.39
Loans in India
Public Sector – – –
Others * 27449,82.21 22168,30.95 15760,73.94
Total Loans - Gross 27449,82.21 22168,30.95 15760,73.94
Less: Impaiment loss allowance 178,34.18 165,31.31 150,81.55
Total Loans in India - Net - (A) 27271,48.03 22002,99.64 15609,92.39
Loans outside India – – –
Less: Impaiment loss allowance – – –
Total Loans outside India - Net - (B) – – –
Total loans (A) + (B) 27271,48.03 22002,99.64 15609,92.39
# includes repossessed assets at market value.
@ includes loans to employees and loan against deposits.
* includes loans to Individuals, Sole proprietorship, Partnership, LLPs, Private and Public Limited companies.
NOTES TO THE ACCOUNTS (Contd.)

Sundaram Finance Limited
98
NOTE
S TO
TH
E AC
COUN
TS (
Cont
d.)
Note
12:
Inv
estm
ents
(`
in la
khs)
Part
icul
ars
Note
No
.Fa
ceVa
lue
(`)
As a
t 31.
03.2
019
As a
t 31.
03.2
018
As a
t 01.
04.2
017
Hol
ding
(N
umbe
r)Ca
rryi
ng
Amou
ntH
oldi
ng
(Num
ber)
Carr
ying
Am
ount
Hol
ding
(N
umbe
r)Ca
rryi
ng
Amou
ntAt
Cos
t:Eq
uity
Ins
trum
ents
- S
ubsi
diar
ies
Roya
l Sun
dara
m G
ener
al In
sura
nce
Co. L
imite
di
10–
–34
,07,
91,0
0088
8,32
.08
25,1
2,29
,000
664,
31.1
2Su
ndar
am A
sset
Man
agem
ent C
ompa
ny L
imite
d10
2,00
,00,
000
185,
70.4
12,
00,0
0,00
018
5,32
.51
2,00
,00,
000
185,
01.7
0Su
ndar
am T
rust
ee C
ompa
ny L
imite
d10
50,0
002,
28.6
250
,000
2,28
.62
50,0
002,
28.6
2LG
F Se
rvic
es L
imite
d10
2,50
,000
5.00
2,50
,000
5.00
250,
000
5.00
Sund
aram
Fin
ance
Hol
ding
s Li
mite
dii
& ii
i5
4,00
,00,
000
20,1
5.18
4,00
,00,
000
20,1
5.18
2,00
,00,
000
20,1
5.18
208,
19.2
110
96,1
3.39
871,
81.6
2 -
Joi
nt V
entu
res
Roya
l Sun
dara
m G
ener
al In
sura
nce
Co. L
imite
d10
22,4
5,00
,000
585,
37.3
4–
–Su
ndar
am B
NP P
arib
as H
ome
Fina
nce
Lim
ited
105,
07,2
8,47
315
2,57
.75
5,07
,28,
473
152,
22.8
25,
07,2
8,47
315
1,86
.03
Sund
aram
BNP
Par
ibas
Fun
d Se
rvic
es L
imite
d10
2,29
,51,
530
22,9
5.15
2,29
,51,
530
22,9
5.15
2,04
,01,
530
20,4
0.15
760,
90.2
417
5,17
.97
172,
26.1
8Le
ss: A
llow
ance
for
Impa
irm
ent l
oss
(12
,42.
70)
(8,
08.1
3) (
7,95
.99)
748,
47.5
416
7,09
.84
164,
30.1
9To
tal -
A95
6,66
.74
1263
,23.
2310
36,1
1.81
At fa
ir v
alue
thro
ugh
othe
r co
mpr
ehen
sive
inco
me:
Equi
ty I
nstr
umen
tsEq
uifa
x Cr
edit
Info
rmat
ion
Serv
ices
Pri
vate
Lim
ited
101,
35,0
0,00
013
,50.
001,
35,0
0,00
013
,50.
001,
35,0
0,00
013
,50.
00Ex
peri
an C
redi
t Inf
orm
atio
n Co
mpa
ny o
f Ind
ia P
riva
te L
imite
d10
1,12
,00,
000
11,2
0.00
1,12
,00,
000
11,2
0.00
1,12
,00,
000
11,2
0.00
Tota
l - B
24,7
0.00
24,7
0.00
24,7
0.00
At fa
ir v
alue
thro
ugh
profi
t or
loss
: -
Mut
ual F
unds
Sund
aram
Mon
ey F
und
103,
30,2
4,68
013
0,15
.52
5,46
,76,
479
200,
30.8
95,
83,3
1,65
620
1,22
.30
Sund
aram
Mut
ual F
und
- See
d Ca
pita
liv
1013
,20.
5011
,73.
6310
,66.
29H
DFC
Cha
rity
Fun
d fo
r Ca
ncer
Cur
e 20
17ii
1030
,00,
000
3,00
.24
30,0
0,00
03,
00.8
730
,00,
000
3,00
.66
SundaramSmartNifty100EqualWeightFund
10–
–2,
69,1
2131
.78
2,69
,121
29.3
2Su
ndar
am B
anki
ng &
PSU
Deb
t Fun
d10
––
1,61
,805
44.2
51,
61,8
0541
.61
146,
36.2
621
5,81
.43
215,
60.1
8

Annual Report2018-1999
NOTE
S TO
TH
E AC
COUN
TS (
Cont
d.)
Part
icul
ars
Note
No
.Fa
ceVa
lue
(`)
As a
t 31.
03.2
019
As a
t 31.
03.2
018
As a
t 01.
04.2
017
Hol
ding
(N
umbe
r)Ca
rryi
ng
Amou
ntH
oldi
ng
(Num
ber)
Carr
ying
Am
ount
Hol
ding
(N
umbe
r)Ca
rryi
ng
Amou
nt -
Alte
rnat
ive
Inve
stm
ent F
unds
IFM
R FI
mpa
ct M
ediu
m T
erm
Mic
rofin
ance
Fun
d1,
00,0
001,
199
12,7
5.32
1,19
912
,74.
001,
199
12,6
5.04
Sund
aram
Alte
rnat
ive
Opp
ortu
nitie
s Fu
nd –
Nan
ocap
Ser
ies
Iv
1,00
,000
900
8,84
.93
900
10,3
8.37
150
1,50
.72
Sund
aram
Alte
rnat
ive
Opp
ortu
nitie
s Fu
nd –
Nan
ocap
Ser
ies
IIv
1,00
,000
913
9,07
.50
913
10,6
3.32
––
Sund
aram
Alte
rnati
ve O
ppor
tuni
ties S
eries
– H
igh Y
ield
Secu
red
Debt
Fund
v51
,56.
6325
,02.
97–
–Su
ndar
am In
dia
Prem
ier
Fund
v1,
000
69,6
657,
24.5
8–
––
–Lo
k Ca
pita
l Gro
wth
Fun
d10
09,
11,0
7713
,89.
496,
38,7
817,
63.1
8–
–10
3,38
.45
66,4
1.83
14,1
5.76
Tota
l - C
249,
74.7
128
2,23
.26
229,
75.9
4At
am
ortis
ed c
ost:
Deb
t sec
uriti
es -
Gov
ernm
ent S
ecur
ities
:Ce
ntra
l Gov
ernm
ent L
oans
ii10
01,
25,1
4,30
012
6,25
.20
1,10
,14,
300
112,
98.4
11,
00,1
4,30
010
4,28
.49
Stat
e Go
vern
men
t Loa
nsii
100
2,78
,98,
000
282,
26.2
22,
76,4
8,00
027
9,69
.64
1,46
,48,
000
150,
49.2
540
8,51
.42
392,
68.0
525
4,77
.74
- N
on-C
onve
rtib
le D
eben
ture
s:Ro
yal S
unda
ram
Gen
eral
Insu
ranc
e Co
. Lim
ited
Unse
cure
d Su
bord
inat
ed R
edee
mab
le N
on-C
onve
rtib
le D
eben
ture
s10
,00,
000
1,00
010
2,76
.94
1,00
010
2,70
.93
1,00
010
2,76
.96
- P
ass
Thro
ugh
Cert
ifica
tes:
77,3
1.21
91,9
1.99
29,1
1.04
- C
omm
erci
al P
aper
:
Nor
ther
n Ar
c Ca
pita
l Lim
ited
5,00
,000
1,00
047
,14.
121,
000
49,7
2.03
9,26
.73
635,
73.6
963
7,02
.99
395,
92.4
7Le
ss: A
llow
ance
for
Impa
irm
ent l
oss
(52
.16)
(39
.47)
(28
.21)
Tota
l - D
635,
21.5
363
6,63
.52
395,
64.2
6
Tota
l Inv
estm
ents
*
A
+B+
C+D
(N
et o
f allo
wan
ce fo
r im
pair
men
t los
s)18
66,3
2.98
2206
,80.
0016
86,2
2.01
* Al
l inv
estm
ents
of t
he c
ompa
ny a
re in
Indi
aNo
tes:
i)
D
urin
g th
e ye
ar th
e co
mpa
ny d
ives
ted
25.9
0% s
take
in R
oyal
Sun
dara
m G
ener
al In
sura
nce
Co. L
imite
d to
Age
as In
sura
nce
Inte
rnat
iona
l N.V
., th
e Ne
ther
land
s. S
ubse
quen
t to
the
sale
, the
co
mpa
ny h
olds
50%
in th
e Eq
uity
cap
ital o
f Roy
al S
unda
ram
Gen
eral
Insu
ranc
e Co
. Lim
ited,
and
has
bec
ome
a Jo
int V
entu
re c
ompa
ny w
ith e
ffect
from
23r
d Fe
brua
ry 2
019.
ii) R
epre
sent
Quo
ted
Inve
stm
ents
.
iii)
Den
otes
sha
res
are
unde
r lo
ck in
per
iod.
iv
) Se
ed C
apita
l inv
estm
ent i
n th
e gr
owth
opt
ion
of th
e op
en-e
nded
sch
emes
of S
unda
ram
Mut
ual F
und
is in
com
plia
nce
with
the
see
d ca
pita
l req
uire
men
ts s
tipul
ated
by
SEBI
Mut
ual F
unds
(A
men
dmen
t) R
egul
atio
ns, 2
014
and
cann
ot b
e re
deem
ed u
nles
s th
e sc
hem
e is
wou
nd u
p.
v)
Repr
esen
ts s
pons
or in
vest
men
ts, i
n co
mpl
ianc
e w
ith S
EBI (
Alte
rnat
ive
Inve
stm
ent F
unds
) Re
gula
tions
, 201
2 an
d th
e sa
me
cann
ot b
e re
deem
ed u
nles
s th
e Fu
nd is
wou
nd u
p.
vi)
In a
ccor
danc
e w
ith th
e Re
serv
e Ba
nk o
f Ind
ia d
irec
tives
, the
com
pany
has
cre
ated
a fl
oatin
g ch
arge
on
the
stat
utor
y liq
uid
asse
ts c
ompr
isin
g in
vest
men
t in
Gove
rnm
ent S
ecur
ities
of f
ace
valu
e `4
0412
.30
lakh
s (a
mor
tised
cos
t - `
4085
1.42
lakh
s).
(` in
lakh
s)

Sundaram Finance Limited
100
Note 13 : Other Financial assets(` in lakhs)
March 31, 2019 March 31, 2018 April 1, 2017
Carried at amortised cost
- Security deposits 7,79.78 7,55.33 7,12.20
- Other advances 5,42.36 4,32.62 2,55.03
Less: Impairment loss on the above 54.45 71.36 71.19
TOTAL 12,67.69 11,16.59 8,96.04
NOTES TO THE ACCOUNTS (Contd.)
NOTE 14: Disclosure pursuant to Ind AS 12 "Income Taxes"(a) Major components of tax expense / (income):
(` in lakhs)
Sl. No. Particulars 2018-19 2017-18
(a) Profit or Loss section:
(i) Current income tax:
Current income tax expense 391,36.27 274,20.68
Tax expense of prior periods – –
391,36.27 274,20.68
(ii) Deferred tax:
Tax expense on origination and reversal of temporary differences (26,58.10) 13,75.05
Effect of previously unrecognised tax losses used to reduce tax expense (3,48.09) (1,67.98)
(30,06.19) 12,07.07
Income tax expense reported in Profit or Loss [(i) + (ii)] 361,30.08 286,27.75
(b) Other Comprehensive Income (OCI) section:
(i) Items not to be reclassified to profit or loss in subsequent periods:
Current tax expense/(income): (2,15.84) (81.10)
On remeasurement of defined benefit plans
(ii) Items to be reclassified to profit or loss in subsequent periods:
(A) Deferred tax expense/(income):
On MTM of cash flow hedges 3,64.99 –
Income tax expense reported in Other Comprehensive Income [(i) + (ii)] 1,49.15 (81.10)
Retained earnings:
Current income tax 389,20.43 273,39.58
Deferred tax (26,41.20) 12,07.07
Income tax expense reported in retained earnings 362,79.23 285,46.65
NOTES TO THE ACCOUNTS

Annual Report2018-19101
(b) Reconciliation of tax expense and the accounting profit multiplied by domestic tax rate applicable in India:(` in lakhs)
Sl. No. Particulars 2018-19 2017-18(a) Profit before tax and exceptional items 894,98.63 849,71.40 (b) Profit on exceptional items 592,43.45 –(c) Profit before tax 1487,42.08 849,71.40 (d) Corporate tax rate as per Income Tax Act 1961 34.94% 34.61%
(e) Tax on Accounting profit (e)=(a)*(d) 312,74.40 294,06.90 (f) (i) Tax on income exempt from tax :
(A) Dividend income 11,54.85 9,11.88 (ii) Tax on expenses not tax deductible : (A) CSR expenses/Donations 1,85.28 1,20.98 (B) Expenses in relation to exempt income 1,28.49 1,27.25 (iii) Tax effect on various other items 13,20.29 1,15.50 Total effect of tax adjustments [(i) -(ii) + (iii)] 21,61.37 7,79.15
(g) Tax on exceptional items @ 23.296% 70,17.05 –(h) Tax expense recognised during the year (h )=(e)-(f)+(g) 361,30.08 286,27.75 (i) Effective tax Rate (f )=(h)/(c) 24.29% 33.69%
NOTES TO THE ACCOUNTS (Contd.)
(c) Unrecognised deductible temporary differences for which no deferred tax asset is recognised in Balance Sheet
(` in lakhs)
Particulars As at 31.03.2019 As at 31.03.2018 As at 01.04.2017
Base amount Deferred tax Base amount Deferred tax Base amount Deferred tax
Deductible temporary differences towards provision for diminution in value of investments on which DTA not created
12,42.7 4,34.25 8,08.13 2,82.39 7,95.99 2,75.48
Total 12,42.7 4,34.25 8,08.13 2,82.39 7,95.99 2,75.48
(d) Components of deferred tax (assets) and liabilities recognised in Balance Sheet and Statement of Profit or Loss:
(`in lakhs)
Sl.no.
Particulars
Balance Sheet Statement of Profit or Loss
As at31-03-2019
As at31-03-2018
As at01-04-2017
2018-19 2017-18
(a) Items disallowed u/s.43B of the Income Tax Act 1961
8,48.35 10,92.82 9,83.19 (2,44.47) 1,09.63
(b) Provision for doubtful debts and advances 26,16.80 38,68.12 49,15.89 (12,51.32) (10,47.77)
(c) Difference between book depreciation and tax depreciation
54,15.82 55,74.87 52,81.58 (1,59.05) 2,93.29
(d) Other temporary differences (8,69.04) (51,65.08) (46,02.86) 42,96.04 (5,62.22)
Deferred tax expense/(income) 26,41.20 (12,07.07)
Net deferred tax (assets)/liabilities 80,11.93 53,70.73 65,77.80

Sundaram Finance Limited
102
(e) Reconciliation of deferred tax (assets) / liabilities: (`in lakhs)
Sl. no. Particulars 2018-19 2017-18(a) Opening balance as at April 1 53,70.73 65,77.80(b) Tax income/(expense) during the period recognised in :
(i) Statement of Profit and Loss in Profit or Loss section 30,06.19 (12,07.07)(ii) Statement of Profit and Loss under OCI section (3,64.99) –Closing balance as at March 31 80,11.93 53,70.73
NOTES TO THE ACCOUNTS (Contd.)
Note 15 Investment Property (` in lakhs)
Particulars Land Building TotalGROSS BLOCK AT DEEMED COST
As at 01.04.2017 61,05.03 10,18.90 71,23.93Additions 76.18 76.18Deductions 45.68 6.15 51.83As at 31.03.2018 60,59.35 10,88.93 71,48.28
DEPRECIATIONUpto 31.03.2017 – – –Additions 57.14 57.14Deductions – – –Upto 31.03.2018 – 57.14 57.14
GROSS BLOCK AT COST As at 31.03.2018 60,59.35 10,88.93 71,48.28Additions 5,46.39 4,32.71 9,79.10Deductions 40.27 0.61 40.88As at 31.03.2019 65,65.47 15,21.03 80,86.50
DEPRECIATIONUpto 31.03.2018 57.14 57.14Additions 63.19 63.19Deductions 0.43 0.43Upto 31.03.2019 – 119.90 1,19.90CARRYING VALUE
As at 31.03.2019 65,65.47 14,01.13 79,66.60As at 31.03.2018 60,59.35 10,31.79 70,91.14As at 31.03.2017 61,05.03 10,18.90 71,23.93
Investment Property The fair value measurement for all the investment property has been categorized as Level 2 based on the inputs to the valuation technique, taking into consideration the prevailing market price of similar property / locality.
(` in lakhs)
Particulars 31.03.2019 31.03.2018 01.04.2017Fair value of the Investment property 243,12.04 233,96.42 240,16.34
Items relating to investment property recognised in Profit & Loss Account for the year ended are given below: (` in lakhs)
Particulars 2018-19 2017-18Rental income from Investment property 6,75.51 6,09.74Direct Operating expenses on properties generating rental income 48.70 50.62Direct Operating expenses on properties not generating rental income 3.85 1.38
The investment properties are freely realisable. (` in lakhs)
Particulars 31.03.2019 31.03.2018 01.04.2017Contractual obligations to purchase, construct or develop investment property – 15.10 10.42

Annual Report2018-19103
Note
16
: Pro
pert
y, P
lant
and
Equ
ipm
ent
(`in
lakh
s)
Part
icul
ars
Free
hold
La
ndFr
eeho
ld
Build
ings
Leas
ehol
d of
fice
/ Re
side
ntia
l Pr
emis
es
Plan
t and
M
achi
nery
&
Co
mpu
ters
Furn
iture
an
d Fi
xtur
esVe
hicl
esO
ffice
Eq
uipm
ent
Asse
ts on
Ope
ratin
g
Leas
eAs
sets
Take
n und
er
Finan
ce Le
ase
Tota
l
Plan
t and
M
achi
nery
&
Com
pute
rs
Vehi
cles
Leas
ehol
d La
nd
GROS
S BL
OCK
AT D
EEM
ED C
OST
As a
t 01.
04.2
017
26,4
4.45
9,51
.59
5,40
.01
16,6
4.27
4,67
.10
10,7
9.53
5,14
.83
81.9
518
6,53
.49
39.0
826
6,36
.30
Addi
tions
96
.52
30.2
7–
7,88
.57
1,69
.87
5,63
.61
99.5
5–
40,1
8.75
–57
,67.
14
Ded
uctio
ns76
.18
–9.
843.
512,
37.6
84.
871.
7153
,70.
58–
57,0
4.37
As a
t 31.
03.2
018
27,4
0.97
9,05
.68
5,40
.01
24,4
3.00
6,33
.46
14,0
5.46
6,09
.51
80.2
417
3,01
.66
39.0
826
6,99
.07
DEP
RECI
ATIO
N
Upto
31.
03.2
017
––
––
––
––
––
Addi
tions
54.9
626
.58
5,48
.97
1,37
.36
3,15
.95
1,18
.77
4.35
42,9
2.75
–54
,99.
69
Ded
uctio
ns–
–1.
200.
4613
.31
0.43
0.59
4,24
.65
–4,
40.6
4
Upto
31.
03.2
018
–54
.96
26.5
85,
47.7
71,
36.9
03,
02.6
41,
18.3
43.
7638
,68.
10–
50,5
9.05
GRO
SS B
LOCK
AT
COST
As a
t 31.
03.2
018
27,4
0.97
9,05
.68
5,40
.01
24,4
3.00
6,33
.46
14,0
5.46
6,09
.51
80.2
417
3,01
.66
39.0
826
6,99
.07
Addi
tions
2,
38.6
52,
39.3
42,
19.0
010
,79.
792,
24.6
25,
23.0
31,
35.6
06,
63.6
547
,66.
64–
80,9
0.32
Ded
uctio
ns2,
40.3
298
.15
–24
.99
8.63
1,15
.78
23.4
059
.30
40,8
6.43
–46
,57.
00
As a
t 31.
03.2
019
27,3
9.30
10,4
6.87
7,59
.01
34,9
7.80
8,49
.45
18,1
2.71
7,21
.71
6,84
.59
179,
81.8
739
.08
301,
32.3
9
DEP
RECI
ATIO
N
Upto
31.
03.2
018
54.9
626
.58
5,47
.77
1,36
.90
3,02
.64
1,18
.34
3.76
38,6
8.10
–50
,59.
05
Addi
tions
83.8
432
.76
6,88
.21
1,42
.41
3,35
.66
1,09
.14
1,54
.47
33,9
4.84
–49
,41.
33
Ded
uctio
ns8.
28–
8.10
2.65
27.4
45.
180.
4511
,67.
66–
12,1
9.76
Upto
31.
03.2
019
–1,
30.5
259
.34
12,2
7.88
2,76
.66
6,10
.86
2,22
.30
1,57
.78
60,9
5.28
–87
,80.
62
CARR
YING
VAL
UE
As
31.0
3.20
1927
,39.
309,
16.3
56,
99.6
722
,69.
925,
72.7
912
,01.
854,
99.4
15,
26.8
111
8,86
.59
39.0
821
3,51
.77
As
31.0
3.20
1827
,40.
978,
50.7
25,
13.4
318
,95.
234,
96.5
611
,02.
824,
91.1
776
.48
134,
33.5
639
.08
216,
40.0
2
As
31.0
3.20
1726
,44.
459,
51.5
95,
40.0
116
,64.
274,
67.1
010
,79.
535,
14.8
381
.95
186,
53.4
939
.08
266,
36.3
0

Sundaram Finance Limited
104
Note 18: Other Non-Financial Assets(` in lakhs)
March 31, 2019 March 31, 2018 April 1, 2017
Balances with Government authorities 47,55.14 40,15.76 28,74.52
Prepaid expenses 12,86.53 17,30.04 16,68.47
SF employee welfare trust 3,09.91 3,16.26 3,21.18
Stamp and stamp papers on hand 1,88.88 1,20.47 89.76
Capital Advances 50.23 1,98.25 1,03.28
Others Assets * 31.35 2,65.85 2,16.32
TOTAL 66,22.04 66,46.63 52,73.53
* Amount paid for which goods / services are to be received.
NOTES TO THE ACCOUNTS (Contd.)
Note 17 Other Intangibles assets and Intangible assets under development(` in lakhs)
Particulars Computer Software Total Intangibles Under
DevelopmentPurchased Self Generated
GROSS BLOCK AT DEEMED COST
As at 01.04.2017 3,29.31 6,13.76 9,43.07 98.75
Additions 3,27.30 1,97.10 5,24.41 1,43.21
Deductions – – – 2,21.02
As at 31.03.2018 6,56.61 8,10.86 14,67.48 20.94
DEPRECIATION
Upto 31.03.2017 – – – –
Additions 3,17.24 4,87.61 8,04.85 –
Deductions – – – –
Upto 31.03.2018 3,17.24 4,87.61 8,04.85 –
GROSS BLOCK AT COST
As at 31.03.2018 6,56.61 8,10.86 14,67.48 20.94
Additions 7,61.10 1,59.41 9,20.50 1,38.47
Deductions - - - 1,59.41
As at 31.03.2019 14,17.71 9,70.27 23,87.98 -
DEPRECIATION
Upto 31.03.2018 3,17.24 4,87.61 8,04.85 –
Additions 3,09.28 82.97 3,92.25 –
Deductions – – – –
Upto 31.03.2019 6,26.52 5,70.58 11,97.10 –
CARRYING VALUE
As at 31.03.2019 7,91.19 3,99.69 11,90.88 –
As at 31.03.2018 3,39.37 3,23.25 6,62.63 20.94
As at 31.03.2017 3,29.31 6,13.76 9,43.07 98.75Note:The Company has, with effect from 1st April 2018, revised the estimated useful life of intangible asset resulting in amortisation expenses for the year 2018-19 being lower by `114.54 lacs.

Annual Report2018-19105
Mat
urity
Pat
tern
of B
orro
win
gs:
(` in
lakh
s)
Impl
icit
Inte
rest
rate
(%
)As
on
31.0
3.20
19As
on
31.0
3.20
18As
on
31.0
3.20
17
Mat
uriti
es<1
year
1 - 3
year
s>3
year
sTo
tal
<1 ye
ar1
- 3 ye
ars
>3 ye
ars
Tota
l<1
year
1 - 3
year
s>3
year
sTo
tal
Secu
red
Debe
ntur
es
> 7
to 8
2076
,83.
0116
76,8
9.89
0.00
3753
,72.
9012
72,6
3.76
3619
,35.
2910
2,66
.68
4994
,65.
7315
0,47
.36
1665
,96.
64–
1816
,43.
99
> 8
to 9
955,
68.2
133
36,6
9.48
283,
86.1
845
76,2
3.86
567,
29.9
353
3,25
.45
438,
05.8
615
38,6
1.23
1230
,42.
4999
0,54
.96
161,
31.6
723
82,2
9.12
> 9
to 1
025
5,52
.10
153,
97.5
7–
409,
49.6
724
8,14
.26
248,
33.3
3–
496,
47.5
911
34,6
9.99
489,
81.1
4–
1624
,51.
13
> 10
to 1
1–
––
–21
2,75
.97
––
212,
75.9
70.
0021
2,62
.18
–21
2,62
.18
Tota
l32
88,0
3.32
5167
,56.
9328
3,86
.18
8739
,46.
4323
00,8
3.92
4400
,94.
0654
0,72
.54
7242
,50.
5225
15,5
9.83
3358
,94.
9216
1,31
.67
6035
,86.
42
Long
Ter
m L
oans
> 6
to 7
423,
92.3
529
8,28
.32
63.5
372
2,84
.19
575,
45.9
070
0,79
.20
57,2
9.58
1333
,54.
680.
00
> 7
to 8
1976
,23.
3864
9,12
.68
21,8
3.83
2647
,19.
8979
0,79
.57
2152
,65.
8493
,37.
3330
36,8
2.74
–11
9,32
.87
–11
9,32
.87
> 8
to 9
1714
,25.
9433
06,4
9.73
131,
49.1
451
52,2
4.81
479,
91.3
9 -
- 47
9,91
.39
146,
50.5
347
8,37
.14
–62
4,87
.67
Tota
l41
14,4
1.67
4253
,90.
7315
3,96
.50
8522
,28.
8918
46,1
6.86
2853
,45.
0415
0,66
.91
4850
,28.
8114
6,50
.53
597,
70.0
1–
744,
20.5
4
Subo
rdin
ated
lia
bilit
ies
> 8
to 9
–85
7,05
.44
857,
05.4
4–
856,
36.7
085
6,36
.70
158,
24.5
215
8,24
.52
> 9
to 1
020
4,15
.23
411,
73.5
761
5,88
.80
1491
9.18
337,
50.6
848
6,69
.86
483,
14.5
848
3,14
.58
> 10
to 1
153
,17.
3119
9,05
.13
252,
22.4
4–
251,
82.7
725
1,82
.77
251,
49.2
425
1,49
.24
Tota
l25
7,32
.54
1467
,84.
1417
25,1
6.68
1491
9.18
1445
,70.
1415
94,8
9.32
892,
88.3
389
2,88
.33
The
Secu
red
Non
- Con
vert
ible
Deb
entu
res
are
sec
ured
by
mor
tgag
e of
im
mov
able
pro
pert
y ra
nkin
g pa
ri p
assu
with
cha
rges
cre
ated
in fa
vour
of
the
trus
tees
and
Hyp
othe
catio
n of
spec
ific
Loan
rec
eiva
bles
/ H
ire
purc
hase
/ Lea
se a
gree
men
ts w
ith a
cov
er o
f 100
%, a
s pe
r th
e te
rms
of is
sue.
The
Term
loan
s fr
om b
anks
are
sec
ured
by
hyp
othe
catio
n of
spe
cific
ass
ets
cove
red
by
a ch
arge
on
Hyp
othe
catio
n Lo
an R
ecei
vabl
es/ H
ire
purc
hase
/ Le
ase
agre
emen
ts.

Sundaram Finance Limited
106
Note 19: Payables(` in lakhs)
March 31, 2019 March 31, 2018 April 1, 2017
Trade payables
(i) Total outstanding dues of micro enterprises and small
enterprises
Outstanding Liability 85.84 – –
(ii) Total outstanding dues of creditors other than micro
enterprises and small enterprises
Dealer Balances 84,69.15 53,71.91 62,43.27
Outstanding Liability 9,59.26 11,49.59 6,85.01
Sub-Total 95,14.25 65,21.49 69,28.28
Other payables
(i) Total outstanding dues of micro enterprises and small
enterprises
– – –
(ii) Total outstanding dues of creditors other than micro
enterprises and small enterprises
8,42.93 8,01.05 107,87.68
Sub-Total 8,42.93 8,01.05 107,87.68
Note 20: Debt Securities(` in lakhs)
March 31, 2019 March 31, 2018 April 1, 2017
Carried at amortised cost
Non-Convertible debentures 8739,46.43 7242,50.52 6035,86.42
Commercial paper 1740,06.86 2002,35.24 3538,07.77
Liability component of compound financial instruments – – –
Total 10479,53.29 9244,85.76 9573,94.19
Of the above
- Debt securities in India 10479,53.29 9244,85.76 9573,94.19
- Debt securities in outside India – – –
Total 10479,53.29 9244,85.76 9573,94.19
The Secured Non - Convertible Debentures are secured by mortgage of immovable property ranking pari passu with charges created
in favour of the trustees and Hypothecation of specific Loan receivables / Hire purchase/ Lease agreements with a cover of 100%, as
per the terms of issue.
NOTES TO THE ACCOUNTS (Contd.)

Annual Report2018-19107
Note 22: Deposits(` in lakhs)
March 31, 2019 March 31, 2018 April 1, 2017
Carried at amortised cost
- Public Deposits 3064,03.94 2579,08.80 2484,44.77
- From banks – – –
- From others – – –
Total 3064,03.94 2579,08.80 2484,44.77
Note 23: Subordinated Liabilities(` in lakhs)
March 31, 2019 March 31, 2018 April 1, 2017
Carried at amortised cost
Subordinated Non Convertible Debentures
- Subordinated Liabilities in India 1725,16.68 1594,89.32 892,88.33
- Subordinated Liabilities outside India – – –
Total 1725,16.68 1594,89.32 892,88.33
Note 21: Borrowings other than debt securities(` in lakhs)
March 31, 2019 March 31, 2018 April 1, 2017
Carried at amortised cost
Secured
Term Loan from banks 8622,33.41 5050,28.81 744,20.54
WorkingcapitaldemandloansandCashcredit 1114,34.27 2102,90.24 238,51.68
Unsecured
Credit facilities from banks – 536,74.21 322,30.24
Finance lease obligation 39.08 39.08 39.08
Total 9737,06.76 7690,32.34 1305,41.54
Of the above
Borrowings in India 9737,06.76 7690,32.34 1305,41.54
Borrowings in Outside India – – –
Total 9737,06.76 7690,32.34 1305,41.54
The Term loans from banks are secured by hypothecation of specific assets covered by a charge on Hypothecation Loan Receivables /
Hire purchase / Lease agreements.
Workingcapitaldemand loansandcashcreditaresecuredbyachargeonHypothecationLoanReceivables /HirePurchase /Lease
agreements, ranking pari passu, excluding assets which are specifically charged to others.
NOTES TO THE ACCOUNTS (Contd.)

Sundaram Finance Limited
108
Note 24: Other Financial liabilities(` in lakhs)
March 31, 2019 March 31, 2018 April 1, 2017
Amount due on assets securitised or assigned 132,07.36 192,33.46 290,71.83
Unpaid matured deposits and interest accrued thereon 35,95.25 37,91.19 45,39.46
Advance received from customers 54,09.91 43,36.63 59,16.84
Unpaid dividend 2,77.16 2,25.33 2,44.28
Payable to employees 58,57.06 55,01.00 48,67.93
Other liabilities** 138,05.89 70,80.37 69,99.65
Total 421,52.63 401,67.98 516,39.99
** Other liabilities include amount payable to creditors for expenses, payable to customers for security deposit received and commission
payable to non-whole time directors.
Note 25: Provisions(` in lakhs)
March 31, 2019 March 31, 2018 April 1, 2017
Provision for employee benefits 11,47.86 6,30.29 4,33.83
Provision for Other expenses ^ 39,88.22 56,38.77 28,12.56
Total 51,36.08 62,69.06 32,46.39
^ Provision for other expenses include provision made for legal cases / claims
Note 26: Other Non-Financial liabilities(` in lakhs)
March 31, 2019 March 31, 2018 April 1, 2017
Revenue received in advance 2,19.57 2,53.38 1,94.53
Other Liabilities # 20,90.51 13,98.86 10,63.52
Total 23,10.08 16,52.24 12,58.05
# Others mainly include government dues, taxes payable, GST payable and salary deductions payable
NOTES TO THE ACCOUNTS (Contd.)

Annual Report2018-19109
Note 27: Equity Share capital(` in lakhs)
March 31, 2019 March 31, 2018 April 1, 2017
Authorised capital
27,81,00,000 Equity Shares of `10/- each * 278,10.00 278,10.00
25,00,00,000 Equity Shares of `10/- each 250,00.00
Issued, Subscribed and fully paid-up
11,11,03,860 Equity Shares of `10/- each 111,10.39 111,10.39 111,10.39
* Authorised share capital has been increased pursuant to the Scheme of Arrangement and Amalgamation
a) reconciliation of the number of shares outstanding at the beginning and at the end of the period
March 31, 2019 March 31, 2018 April 1, 2017
At the beginning of the year 11,11,03,860 11,11,03,860 11,11,03,860
Add: Issue of shares during the year – – –
At the end of the year 11,11,03,860 11,11,03,860 11,11,03,860
b) No shareholder of the company holds more than 5% of the Equity shares
NOTES TO THE ACCOUNTS (Contd.)
STATEMENT OF PROFIT AND LOSS - NOTES
Note 28: Interest Income(` in lakhs)
2018-19 2017-18
On Financial assets measured at amortised cost:
Loans 2835,79.24 2288,76.70
Investments 48,85.38 40,71.90
Deposits with Banks 47,11.69 62,16.89
On Financial assets classified at Fair value through profit or loss:
Investments 6,11.81 2,03.64
Total 2937,88.12 2393,69.13
Note 29 : Fees and Commission Income(` in lakhs)
2018-19 2017-18
Relating to
- Loans 108,29.04 91,42.44
- Selldown servicing fee 58,28.85 63,98.05
- Income from other Financial Services 64,44.43 59,43.46
Total 231,02.32 214,83.95

Sundaram Finance Limited
110
NOTES TO THE ACCOUNTS (Contd.)
Note 31: Other Income(` in lakhs)
2018-19 2017-18
Net gain/(loss) on Derecognition of Property, Plant and equipment 1,77.31 19.19
Interest income 2,13.83 35,02.62
Rental income 7,18.67 6,45.38
Other non-operating income 9,45.77 7,45.57
Total 20,55.58 49,12.76
Note 30: Net Gain on Fair Value Changes(` in lakhs)
2018-19 2017-18
A. Net gain on financial instruments at fair value through profit or loss
(i) On trading portfolio – –
(ii) On Financial instruments designated at fair value through profit or loss – –
B. Others -
Net gain on financial instruments at fair value through profit or loss on
Investments 11,05.16 7,90.70
Derivatives 76,13.89 35,59.96
C. Total Net gain on fair value changes (A + B) 87,19.05 43,50.66
Of the above, fair value changes:
Realised 10,20.46 4,53.14
Unrealised 76,98.59 38,97.53
Total 87,19.05 43,50.66
Note 32: Finance Costs(` in lakhs)
2018-19 2017-18
On Financial liabilities carried at amortised cost:
Interest on
Deposits 216,18.47 208,28.97
Term loans 515,59.49 188,72.67
Debt securities 877,53.26 814,81.28
Subordinated liabilities 145,50.40 111,25.86
Other interest expense and borrowing cost 7,69.32 22,93.49
Total 1762,50.94 1346,02.27

Annual Report2018-19111
NOTES TO THE ACCOUNTS (Contd.)
Note 35: Impairment on Financial Instruments(` in lakhs)
2018-19 2017-18
On Financial instruments measured at amortised cost:
Loans 91,02.41 80,18.12
Investments 4,47.26 23.40
Repossessed Assets 11,59.53 4,96.77
Others 23.94 12.55
Total 107,33.14 85,50.84
Note 33: Employee Benefit Expenses(` in lakhs)
2018-19 2017-18
SalariesandWages 299,17.96 256,52.35
Contribution to provident and other funds 16,54.75 15,68.09
Share Based Payments to employees 2,47.83 1,85.37
Staff welfare expenses 4,21.97 4,20.65
Total 322,42.51 278,26.46
Note 34: Administrative and Other Expenses(` in lakhs)
2018-19 2017-18
Rent, taxes and energy costs 19,68.96 27,68.98
Repairs and maintenance 19,29.60 15,89.87
Communication Costs 10,21.13 11,64.68
Printing and stationery 4,17.30 4,28.13
Advertisement and publicity 1,27.73 1,49.49
Director’s fees, allowances and expenses 1,42.50 1,34.38
Auditor’s fees and expenses 1,10.51 1,24.57
Legal and Professional charges 5,59.10 6,20.15
Insurance 1,72.10 1,73.03
Outsourcing cost 79,36.82 66,58.62
Travel and conveyance 16,83.38 15,37.37
Donations 11,73.14 10,25.45
Exchange loss on foreign currency transactions and translations (Net) 80,10.37 31,69.00
Other expenditure 24,13.09 36,83.61
Total 276,65.73 232,27.33

Sundaram Finance Limited
112
NOTES TO THE ACCOUNTS (Contd.)
Other Notes
Note 36: Capital Management:The Company’s capital management strategy is to ensure that it has sufficient capital for business operations, strategic investment,
regulatory requirements and to provide reasonable return to the shareholders. Equity share capital and other equity are considered for
Capital management.
The company monitors capital Adequacy ratio as stipulated by RBI for NBFC-Investment and credit company - Deposit taking. The Company
endeavour to source diversified borrowing, depending on asset liability duration and interest rate sensitivities.
(` in lakhs)
Particulars 31st March 2019 31st March 2018 31st March 2017
Tier I 4254,72.46 2939,62.52 2493,36.29
Tier II 1396,07.79 1315,30.70 578,30.02
Total 5650,80.26 4254,93.22 3071,66.31
RWA 29038,34.88 23597,46.51 16643,60.62
Tier I % 14.65% 12.46% 14.98%
Tier II % 4.81% 5.57% 3.47%
Total 19.46% 18.03% 18.45%
Note 37: Revenue
Disaggregate revenue information: Since the requirement of application of IND AS 115 on Company’s revenue is insignificant, the
company believes that disaggregation of data about the nature, amount, timing of revenues is not required.
Remaining performance obligation
The remaining performance obligation disclosure provides aggregate amount of transaction price yet to be recognised at the end of
reporting period and an explanation as to when the company expects to recognise these amounts in revenue.
The aggregate value of performance obligations that are completely or partially unsatisfied as at March 31,2019 is ̀ 50,36 lakhs (2017-18
is `44,62 lakhs) which the company expects to recognise in next year.
Note 38: Financial instruments – Fair value measurementsThe following table shows an analysis of financial instruments recorded at fair value by level of the fair value hierarchy:
a. Financial Assets / Liabilities that are measured at Fair value through P&L(` in lakhs)
Fair Value Hierarchy March 31, 2019 March 31, 2018 April 1, 2017
Financial Assets
Derivatives Level 2 72,79.83 – –
Investments
Mutual Funds Level 1 146,36.26 215,81.43 215,60.18
Alternative Investment Funds Level 1 103,38.45 66,41.83 14,15.76
Financial Liabilities
Derivatives Level 2 – 13,78.55 49,38.51
Fair value is estimated based on the market inputs for the classification as per level 2.

Annual Report2018-19113
b. Equity Shares designated at Fair value through Other Comprehensive Income
As on 1st April 2017, the company designated the following investments in equity shares at FVTOCI, because the company intends
to hold these investments for long-term strategic purpose.
(` in lakhs)
March 31, 2019 March 31, 2018 April 1, 2017
Investments in Equifax Credit Information Services Pvt. Ltd. 13,50.00 13,50.00 13,50.00
Investments in Experian Credit Information Company of India Pvt. Ltd.
11,20.00 11,20.00 11,20.00
As per Ind AS 109, Cost has been considered as the best estimate of the fair value.
There were no disposal of investment / dividend receipts during the financial years 2018-19 and 2017-18 respectively.
c. The following table shows the carrying amounts and fair values of financial assets and financial liabilities measured at amortised cost, including their levels in the fair value hierarchy.
(` in lakhs)
Carrying amount Fair Value Hierarchy
Fair value
March 31, 2019 March 31, 2018 April 1, 2017 March 31, 2019 March 31, 2018 April 1, 2017
Financial assets
Cash and cash equivalents 129,78.52 126,39.56 90,70.62 Level 1 129,78.52 126,39.56 90,70.62
Bank Balances 708,84.47 855,70.36 660,40.53 Level 3 711,22.13 858,22.93 668,76.16
Receivables 17,56.83 19,89.45 16,22.11 Level 3 17,56.83 19,89.45 16,22.11
Loans 27271,48.03 22002,99.64 15609,92.39 Level 3 26888,38.24 21844,00.83 15494,26.76
Investments in Government
securities
408,51.42 392,68.05 254,77.74 Level 1 413,73.29 392,78.08 261,74.31
Investments (others) 226,70.11 243,95.47 140,86.53 Level 3 216,93.10 236,55.92 132,33.79
Other Financial assets 12,67.69 11,16.59 8,96.04 Level 3 12,66.72 11,26.81 9,09.44
Total 28775,57.07 23652,79.12 16781,85.96 28390,28.83 23489,13.58 16673,13.20
Financial Liabilities
Payables 103,57.18 73,22.55 177,15.96 Level 3 103,57.18 73,22.55 177,15.96
Debt Securities 10479,53.29 9244,85.76 9573,94.19 Level 3 10533,06.99 9236,82.04 9631,64.94
Borrowings (Other than Debt
Securities)
9737,06.76 7690,32.34 1305,41.54 Level 3 9707,88.56 7666,26.32 1376,95.47
Deposits 3064,03.94 2579,08.80 2484,44.77 Level 3 3051,73.18 2582,87.95 2502,09.25
Subordinated Liabilities 1725,16.68 1594,89.32 892,88.33 Level 3 1769,52.37 1670,73.29 980,86.85
Other Financial Liabilities 421,52.63 401,67.98 516,39.99 Level 3 421,01.65 404,45.45 518,95.85
Total 25530,90.48 21584,06.75 14950,24.78 25586,79.93 21634,37.60 15187,68.32
Fair value is arrived at using discounted future cash flows at market rates for the classification as per level 3 hierarchy.
NOTES TO THE ACCOUNTS (Contd.)

Sundaram Finance Limited
114
Note 39 : Financial Risk Management framework
Risk is an inherent and integral part of the financial services business and the company has been judiciously managing this through an
efficient risk mitigation system, with a view to achieve the Company's stated objectives of Growth with Quality and Profitability. The risks
primarily include credit risk, liquidity risk and market risk.
The policies and procedures laid down by the company for the purpose of risk identification, measurement and management, compare
well with contemporary best practices followed by industry peers. The Risk Management Committee and Asset Liability Management
Committee, functioning under the supervision of the Audit Committee, have enunciated detailed policies for assessment of various types
of risks, and fixed tolerance limits as appropriate.
39.1 Credit Risk
Credit risk is the risk of financial loss to the Company if a customer fails to meet his contractual obligations, and arises principally
from the company's loan receivables.
The company has in place a robust credit policy which clearly defines the credit filters and the terms of acceptance of proposals for
financing different categories of borrowers and asset classes. The credit appraisal process, inter alia, includes filters for stratification
of customers, compliance with know your customer (KYC) norms, Field investigation, Credit bureau verification, exposure ceilings,
asset risk and segment and geography risks. The risk metrics also address Loan to Value, loan tenure, based on the useful life of
the asset, end-use of the asset and credit enhancements, as appropriate. The Company’s exposure is primarily to retail customers,
thereby making for a well-diversified risk portfolio. The time-tested monitoring and recovery mechanism ensures timely recovery
of instalments and where required, necessary action for resolution of delinquent accounts is initiated, including legal proceedings.
Finally, physical presence and in-depth knowledge of the markets in which the Company operates enables early identification of
emerging risks thereby facilitating prompt remedial action.
Impairment - Expected credit loss (ECL):
The application of Ind AS 109 has necessitated fundamental changes to the accounting for expected default risk (risk provisioning).
Specifically, the incurred loss model has been replaced by the Expected Credit Loss model (ECL). Consequent to this change, the
Expected Credit losses on financial instruments are classified under three stages.
Stage 1: Every financial asset is classified as stage 1, upon initial recognition. In addition, stage 1 contains all transactions with
limited default risk.
Stage 2: Financial assets whose default risk has risen significantly since initial recognition and which are not classified as cases with
limited default risk.
Stage 3: Financial assets that display objective evidence of impairment at the reporting date.
The accounting standard, Ind AS 109 does not specifically prescribe any methodology for computing ECL. However, entities are
required to adopt sound and market acceptable methodologies which are in line with the size, complexity and risk-profile of the
financial entity for computing the ECL. The Company uses three main components to measure ECL. These are, Exposure at Risk (EAR),
Probability of Default (PD) and Loss Given Default (LGD). Exposure at Risk (EAR) is defined as the sum of Principal outstanding and
interest accrued at the reporting date. PD is defined as the probability of borrowers defaulting on their obligations. LGD represents
the economic loss, adjusted for cure rate, as a percentage of exposure at the time of default.
Accordingly, loan assets are categorised under three different stages, as under:
Stage 1: WhereinstalmentsareCurrentand1-30daysoverdue
Stage 2: Whereinstalmentsare31days–90daysoverdueand
Stage 3: Whereinstalmentsareoverduebeyond90days
NOTES TO THE ACCOUNTS (Contd.)

Annual Report2018-19115
The company is required to provide 12-month Expected Credit Loss (12-month ECL) for stage 1 assets and the Life Time Expected Credit Loss (LECL) for stage 2 & stage 3 assets.
12-month ECL is the expected credit loss that results from default events that are possible within 12 months after the reporting date.
LECL represents the expected credit loss from default events over the expected life of a financial asset.
As prescribed under para 5.5 in Ind AS 109, 12-months PD is required to be computed for financial instruments which are in stage
1, and life time PD for those in stage 2 & 3. 12-months PD is the likelihood of the borrower defaulting in the 12 months following
the reporting date while life time PD is the likelihood of the borrower defaulting during the residual tenor.
The PD model has been developed for all the major asset classes using a statistical and iterative approach. The design and construction
of the model involves identification of various credit parameters and variables that have a strong and direct correlation to propensity
of default. The PD model reflects to the probability of default, taking into consideration the inherent credit quality of the borrower
and the residual tenor of each contract. It relies not only historical information and the current economic environment, but also
considers forward-looking information such as the forecasts on the macroeconomic outlook, including emerging risks. The PD for
stage3contractsisconsideredat100%.Whereacustomerhasonecontractinstage3andoneormorecontractsinstage1/stage
2, the PD for all the contracts is considered at 100%.
LGD
LGD represents the economic loss, adjusted for cure rate, as a percentage of exposure at the time of default. Economic loss is the
estimated shortfall in realisation of dues, in the event of default. Contracts that have turned delinquent do not necessarily involve
ultimate losses, since many of them are resolved through corrective actions. The cure rate is the probability of a ‘non performing’
(i.e. defaulted) contract reverting to a ‘performing’ (i.e. non-default) status in a year.
Following tables provide an overview of the gross carrying amount and credit loss allowance broken down into stages
NOTES TO THE ACCOUNTS (Contd.)
a. Loans and Advances:(` in lakhs)
Gross Carrying amount
31.03.2019 31.03.2018
Stages -> 1 2 3 Total 1 2 3 Total
Balance at the beginning
of the year
21111,94.55 809,07.33 283,04.53 22204,06.42 15014,56.11 536,65.17 280,24.33 15831,45.61
New business - net of
recovery
6391,59.62 (388,95.53) (52,08.19) 5950,55.90 7239,78.91 (242,40.50) (82,24.63) 6915,13.79
Trfs. due to change in
creditworthiness
(971,26.45) 757,67.46 213,58.99 – (665,55.85) 514,82.66 150,73.19 –
Fin. assets that have been
derecognised
645,38.49 – – 645,38.49 476,84.62 – – 476,84.62
Writeoffduringtheyear – – 77,99.55 77,99.55 – – 65,68.36 65,68.36
Balance at the end of
the year
25886,89.24 1177,79.26 366,55.78 27431,24.28 21111,94.55 809,07.33 283,04.53 22204,06.42

Sundaram Finance Limited
116
NOTES TO THE ACCOUNTS (Contd.)
(` in lakhs)
Expected Credit Loss
31.03.2019 31.03.2018
Stages -> 1 2 3 Total 1 2 3 Total
Balance at the beginning
of the year
12,99.56 13,98.66 137,63.46 164,61.67 9,55.39 5,87.47 134,82.03 150,24.88
New business - net of
recovery
15.67 9,77.39 81,66.76 91,59.83 28.31 9,41.53 70,44.88 80,14.72
Trfs. due to change in
creditworthiness
5,00.06 (1,79.16) (3,20.90) – 3,25.43 (1,30.34) (1,95.09) –
Fin. assets that have been
derecognised
57.44 – – 57.44 9.57 – – 9.57
Writeoffduringtheyear – – 77,99.55 77,99.55 – – 65,68.36 65,68.36
Balance at the end of
the year
17,57.85 21,96.89 138,09.77 177,64.51 12,99.56 13,98.66 137,63.46 164,61.67
(ii) Concentration by Asset class
31.03.2019 31.03.2018 01.04.2017
Commercial Vehicles 50.39 46.99 39.84
Cars 27.32 32.29 39.60
Construction Equipments 10.26 9.42 9.12
Tractors & Farm Equipments 5.43 5.01 4.21
Others 6.60 6.29 7.23
Total 100.00 100.00 100.00
Concentration of credit risk %
(i) Concentration by Geographical risk
31.03.2019 31.03.2018 01.04.2017
South 65.27 65.33 66.70
North 19.00 18.34 16.93
West 12.24 12.87 13.16
East 3.49 3.46 3.21
Total 100.00 100.00 100.00
b. Other assets The company computes Expected Credit Loss on other financial assets including trade receivables based on a provision matrix which
is constructed using historical credit loss experience as adjusted to reflect current conditions.
(` in lakhs)
31.03.2019 31.03.2018 01.04.2017
Stages - > 1 2 3 Total 1 2 3 Total 1 2 3 Total
Gross carrying
amount
60,33.44 11.47 84.08 61,29.00 60,98.94 16.37 1,13.40 62,28.71 55,08.60 10.99 1,04.97 56,24.56
Expected Credit Loss 40.56 0.06 69.26 1,09.88 38.62 0.09 94.47 1,33.18 38.79 0.07 89.07 1,27.93
Net Carrying amount 59,92.88 11.41 14.82 60,19.12 60,60.32 16.28 18.93 60,95.54 54,69.81 10.92 15.90 54,96.63

Annual Report2018-19117
c. Loan Commitments and Financial Guarantees(` in lakhs)
31.03.2019 31.03.2018 01.04.2017
Stages - > 1 2 3 Total 1 2 3 Total 1 2 3 Total
Gross carrying
amount
102,82.93 – – 102,82.93 99,88.39 – – 99,88.39 68,53.66 – – 68,53.66
Expected Credit Loss 73.60 – – 73.60 29.00 – – 29.00 15.00 – – 15.00
Net Carrying amount 102,09.33 – – 102,09.33 99,59.39 – – 99,59.39 68,38.66 – – 68,38.66
Credit risk management practices
(i) Policy on write off: Loans are written off when the value of underlying security/other collateral is not sufficient to cover the
loan exposure or where the underlying security / customer is not traceable. In such cases, the company takes legal recourse
for recovery of shortfall of dues, if any.
(ii) Narrative description of collateral: The underlying assets, which are financed, are the primary collateral held. These
are typically commercial vehicles, cars, construction equipment, farm equipment etc. Additional collateral, by way of credit
enhancement, is obtained based on the management’s credit evaluation of the customer.
d. Debt Securities
All debt investments are allocated to stage 1 under initial recognition. If the rating assigned to the security at the time of investment
is downgraded by two notches and / or where there is a delay in interest servicing by more than 30 days, this would result in
stage 2 classification. Further downgrade of rating and/or delay in interest servicing by more than 90 days/default of payment
of principal would result in stage 3 classification.
For investment in debt instruments, one-year transition matrix provided by the rating agencies is used as the PD. Loss given
default (LGD) parameters assume a recovery rate of 65%, 75% and 50% for unsecured senior, unsecured subordinated and
secured debt securities respectively.
NOTES TO THE ACCOUNTS (Contd.)
A breakup of investment in debt securities into different stages is given as under:
(` in lakhs)
31.03.2019 31.03.2018 01.04.2017
Gross Carrying amount Gross Carrying amount Gross Carrying amount
FVTPL At Amortised Cost FVTPL At Amortised Cost FVTPL At Amortised Cost
Stages -> 1 2 3 Total 1 2 3 Total 1 2 3 Total
Government securities
– 408,51.42 – – 408,51.42 – 392,68.05 – – 392,68.05 – 254,77.74 – – 254,77.74
Mutual Fund 146,36.26 – – – – 215,81.43 – – – – 215,60.17 – – – –
Alternative Investment Funds
103,38.45 – – – – 66,41.83 – – – – 14,15.76 – – – –
Pass through certificates
– 77,31.21 – – 77,31.21 – 91,91.99 – – 91,91.99 – 29,11.04 – – 29,11.04
Non - Convertible Debentures
– 102,76.94 – – 102,76.94 – 102,70.93 – – 102,70.93 – 102,76.96 – – 102,76.96
Commercial paper – 47,14.12 – – 47,14.12 – 49,72.03 – – 49,72.03 – 9,26.73 – – 9,26.73
Total 249,74.71 635,73.69 – – 635,73.69 282,23.26 637,03.00 – – 637,03.00 229,75.93 395,92.47 – – 395,92.47

Sundaram Finance Limited
118
39.2 Liquidity Risk
Liquidity risk relates to Company’s potential inability to meet all payment obligations when they fall due or only being able to meet
them at excessive costs. The objective of the liquidity risk management framework is to ensure that the Company can fulfil its payment
obligations at all times and can manage liquidity and funding risks within its risk appetite. The Asset Liability Committee regularly
monitors the liquidity position and the duration of assets/liabilities and ensures that liquidity is strictly managed as per the policy.
Following are the contractual maturities of financial liabilities / financial assets at the reporting date. The amounts are gross and
undiscounted and include estimated interest payments / receipts and exclude the impact of netting agreements.
(` in lakhs)
31st March 2019
Contractual cash flows
Upto 3 months
Over 3 months & upto 6 months
Over 6 months & upto 1 year
Over 1 year & upto 3 years
Over 3 years & upto 5 years
Over 5 years
Total
Non-derivative fin. liabilities
Payables 94,42.45 4,72.20 – 3,59.76 82.77 – 103,57.18
Debt Securities 2010,03.88 1107,47.25 2298,96.49 5779,04.48 368,30.00 – 11563,82.10
Borrowings (Other than Debt
Securities)
869,93.23 831,98.06 5904,98.99 4567,76.44 158,91.39 39.08 12333,97.19
Deposits 381,17.51 455,66.20 743,34.24 1786,91.36 – – 3367,09.31
Subordinated Liabilities 40,66.95 37,99.02 77,17.25 533,24.34 481,88.68 1518,25.71 2689,21.95
Other Financial Liabilities 408,63.42 98.26 75.00 11,46.48 5,95.68 – 427,78.84
Derivative financial liabilities 7,14.90 6,47.82 – 1,34.80 – – 14,97.52
Total 3812,02.34 2445,28.81 9025,21.97 12683,37.66 1015,88.52 1518,64.79 30500,44.09
Non-derivative fin. assets
Cash and cash equivalents 129,78.52 – – – – – 129,78.52
Bank Balances 46,66.01 162,99.39 386,62.71 154,20.03 – – 750,48.14
Receivables 17,56.83 – – – – – 17,56.83
Loans 4262,00.93 3418,67.46 6126,74.17 14940,07.44 2814,69.75 39,09.70 31601,29.45
Investments 174,83.05 35,16.27 93,24.06 167,51.34 173,21.72 542,22.89 1186,19.33
Other Financial assets 8,16.29 32.07 79.72 2,11.72 1,09.47 4,20.84 16,70.11
Derivative financial assets – – 78,71.21 2,29.25 2,91.97 5,83.93 89,76.36
Total 4639,01.63 3617,15.19 6686,11.87 15266,19.78 2991,92.91 591,37.36 33791,78.74
NOTES TO THE ACCOUNTS (Contd.)(` in lakhs)
Expected Credit Loss31.03.2019 31.03.2018
Stages -> 1 2 3 Total 1 2 3 TotalBalance at the beginning of the year 39.47 – – 39.47 28.21 – – 28.21New investments - net of recovery 13.96 – – 13.96 14.36 – – 14.36Transfers due to change in creditworthiness – – – – – – – –Financial assets that have been derecognised 1.27 – – 1.27 3.10 – – 3.10Writeoffduringtheyear – – – – – – – –Balance at the end of the year 52.16 – – 52.16 39.47 – – 39.47

Annual Report2018-19119
(` in lakhs)
31st March 2018
Contractual cash flows
Upto 3 months
Over 3 months & upto 6 months
Over 6 months & upto 1 year
Over 1 year & upto 3 years
Over 3 years & upto 5 years
Over 5 years
Total
Non-derivative financial liabilities
Payables 65,98.39 4,37.96 – 2,86.21 – – 73,22.56
Debt Securities 1739,86.42 578,17.65 2392,27.93 4699,27.20 672,15.07 – 10081,74.26
Borrowings (Other than Debt
Securities)
1372,90.29 366,70.38 3147,37.76 3081,64.44 156,71.14 39.08 8125,73.09
Deposits 318,03.84 385,83.73 626,21.61 1490,85.34 – – 2820,94.52
Subordinated Liabilities 40,67.58 37,81.07 62,03.45 426,07.72 592,91.18 1423,38.91 2582,89.90
Other Financial Liabilities 382,28.08 82.56 76.84 20,51.49 84.03 – 405,23.00
Derivative financial liabilities 29,34.50 8,08.31 16,95.26 – – – 54,38.07
Total 3949,09.10 1381,81.65 6245,62.85 9721,22.40 1422,61.41 1423,77.99 24144,15.40
Non-derivative financial assets
Cash and cash equivalents 126,39.57 – – – – – 126,39.57
Bank Balances 88,23.42 10,98.09 578,18.46 233,09.19 – – 910,49.16
Receivables 19,89.45 – – – – – 19,89.45
Loans 3401,17.40 2697,54.70 4871,50.85 12058,63.91 2289,53.48 38,78.76 25357,19.09
Investments 270,08.35 24,55.79 42,30.81 173,97.63 190,31.34 542,15.54 1243,39.46
Other Financial assets 6,75.02 40.87 70.35 2,50.71 1,00.51 2,01.88 13,39.34
Derivative fin. assets 9.06 85.95 – 38,97.01 – – 39,92.02
Total 3912,62.26 2734,35.40 5492,70.47 12507,18.45 2480,85.33 582,96.18 27710,68.09
NOTES TO THE ACCOUNTS (Contd.)

Sundaram Finance Limited
120
(` in lakhs)
1st April 2017
Contractual cash flows
Upto 3 months
Over 3 months & upto 6 months
Over 6 months & upto 1 year
Over 1 year & upto 3 years
Over 3 years & upto 5 years
Over 5 years
Total
Non-derivative financial liabilities
Payables 166,72.47 7,77.68 – 265.81 – – 177,15.96
Debt Securities 1814,74.55 1102,01.60 3563,98.31 3660,57.90 167,24.65 – 10308,57.01
Borrowings (Other than Debt
Securities)
9,04.94 5,40.93 718,84.41 641,58.82 – 39.08 1375,28.18
Deposits 325,51.15 415,76.52 613,01.33 1376,54.50 – – 2730,83.50
Subordinated Liabilities 12,25.73 37,83.57 33,25.24 166,99.81 394,70.34 772,36.99 1417,41.68
Other Financial Liabilities 484,23.08 97.36 50.92 29,56.86 2,42.93 – 517,71.15
Derivative financial liabilities 12,51.17 8,16.50 33,34.85 79.07 – – 54,81.59
Total 2825,03.09 1577,94.16 4962,95.06 5878,72.77 564,37.92 772,76.07 16581,79.07
Non-derivative financial assets
Cash and cash equivalents 90,70.62 – – – – – 90,70.62
Bank Balances 14,56.82 12,12.54 468,86.90 222,10.39 – – 717,66.65
Receivables 16,22.11 – – – – – 16,22.11
Loans 2523,29.46 1996,01.09 3548,18.10 8434,47.12 1734,02.19 27,07.92 18263,05.89
Investments 209,99.64 15,69.86 32,34.05 112,39.81 91,75.08 406,71.45 868,89.89
Other Financial assets 5,22.74 44.56 56.76 2,07.52 1,21.40 3,18.41 12,71.39
Derivative financial assets 1.43 3.22 – – – – 4.65
Total 2860,02.82 2024,31.27 4049,95.81 8771,04.85 1826,98.67 436,97.78 19969,31.20
39.3 Market Risk
Market risk is the risk of loss arising from potential adverse changes in the value of the firm’s assets and liabilities from fluctuation
in market variables like liquidity, interest rate and foreign exchange (Currency risk).
a. Interest rate risk
The Company's exposure to changes in interest rates relates to the Company's outstanding floating rate liabilities. Most of the
Company'soutstandingliabilityinlocalcurrencyisonfixedratebasisandhencenotsubjecttointerestraterisk.Whereasthe
foreign currency liability is linked to international rate benchmarks like LIBOR and hence subject to interest rate risk. The
Company hedges these risks through derivative transactions.
NOTES TO THE ACCOUNTS (Contd.)

Annual Report2018-19121
The interest rate profile of the Company's interest bearing financial instruments is as follows:
(` in lakhs)
As at March 31, 2019 As at March 31, 2018 As at April 1, 2017
Financial assets
Fixed-rate instruments
Loans 27257,94.86 21987,71.53 15591,02.30
Investments 634,69.37 636,24.05 395,36.06
Bank Balances 708,84.47 855,70.36 660,40.53
28601,48.70 23479,65.94 16646,78.89
Variable rate instruments
Lease assets 137,66.57 150,38.15 206,25.58
Total 28739,15.27 23630,04.09 16853,04.47
Financial liabilities
Fixed-rate instruments
Debt securities 12204,69.97 10839,75.08 10466,82.52
Borrowings (Other than debt securities) 4973,99.89 4531,18.86 393,39.80
Deposits 3099,99.19 2616,99.99 2529,84.23
20278,69.05 17987,93.93 13390,06.55
Variable rate instruments
Financial liabilities with floating interest rate 4763,06.87 3159,13.48 912,01.74
Total 25041,75.92 21147,07.41 14302,08.29
Fair value sensitivity analysis for fixed rate instruments
The Company's fixed rate instruments are carried at amortised cost and are not measured for interest rate risk, as neither the carrying
amount nor the future cash flows will fluctuate because of changes in market interest rates.
Cash flow sensitivity analysis for variable rate instruments
A reasonably possible change of 100 basis points in interest rates at the reporting date would have increased (decreased) equity and
profit or loss by the amounts shown below. This analysis assumes that all other variables, in particular foreign currency exchange
rates, remain constant.
(` in lakhs)
Profit or loss / Equity Profit or loss / Equity
100 bp increase 100 bp decrease 100 bp increase 100 bp decrease
31st March 2019 31st March 2018
Variable rate instruments (16,53.31) 16,53.31 (10,64.03) 10,64.03
Cross currency Interest Rate swap (7,83.72) 7,83.72 (6,99.14) 6,99.14
Cash flow sensitivity (net) (8,69.59) 8,69.59 (3,64.89 ) 3,64.89
NOTES TO THE ACCOUNTS (Contd.)

Sundaram Finance Limited
122
Interest rate sensitivity
The major lending of the Company is in the form of Hypothecation loans at fixed rates. The loans are financed by various fixed /
floatingRateborrowings.Whiletheassetsfinancedaregenerallyrecoveredoverthetenureoftheunderlyingcontractequally,the
liabilities are in general repayable on maturity. Hence, the interest rate risk and liquidity (mismatches in the duration of assets and
liabilities) are inherent and inevitable.
To measure the above risk the Company adopts the duration gap analysis which is measured for assets and liabilities maturing in
next 12 months as well as for the overall assets and liabilities. Also, for Interest rate risk management, the Duration Gap model is
used on assets and liabilities maturing in the next 12 months, to assess the change in Net Interest Income (NII) for a 1% increase
in interest rate. The change in NII for 1% increase in interest rate as on 31.03.2019 is (`32.95 Cr.)
b. Currency Risk
The Company is exposed to currency risk to the extent that there is a mismatch between the currencies in which borrowings are
denominated and the respective functional currency, i.e. INR. The transactions of the Company are primarily denominated in INR.
Currency risks arise from the foreign currency loans availed by the Company.
Exposure to currency risk
The summary quantitative data about the Company's exposure to currency risk (based on notional amounts) as reported:
(` in lakhs)
As at March 31, 2019 As at March 31, 2018 As at April 1, 2017
USD INR USD INR USD INR
Total foreign currency exposure in
respect of recognised assets and
liabilities
13,12.30 907,73.77 25,40.68 1652,61.98 12,50.28 810,66.16
Cross currency Interest Rate swap /
Forward exchange contracts
(13,12.30) (907,73.77) (25,40.68) (1652,61.98) (12,50.28) (810,66.16)
Net exposure – – – – – –
Sensitivity
Currency risks related to the amounts of foreign currency loans are fully hedged using derivatives that mature on the same dates as
the loans are due for repayment.
Note 40: Financial Instruments - Transferred financial assets that are not derecognised in their entirety
Securitisation:
The company as part of its business model periodically enters into securitisation transactions via Pass Through Certificates (PTC) route
and/or Direct Assignment (DA). As per RBI guidelines, the company maintained credit enhancement for securitisation transactions which
covers the expected losses and thereby retains the risk associated with the assets.
NOTES TO THE ACCOUNTS (Contd.)

Annual Report2018-19123
(` in lakhs)
31st March 2019 31st March 2018 1st April 2017
Carrying amount of transferred assets 3646,47.50 2745,44.68 –
Carrying amount of associated liabilities 3815,13.06 2895,71.87 –
Fair value of assets 3569,13.67 2762,01.36 –
Fair value of associated liabilities 3793,57.79 2877,76.54 –
Net position at Fair value (224,44.12) (115,75.18) –
Note 41: Employee benefits
Post-employment benefits: Defined Contribution Plans(` in lakhs)
Amount recognised as expense in Employee benefit expense 2018-19 2017-18
Superannuation 2,04.35 1,81.43
Pension fund 5,86.92 5,64.53
Employee State Insurance scheme 6.71 10.97
Total 7,97.98 7,56.94
Defined benefit plans
Defined benefit plan exposes the Company to a number of risks, the most significant of which are detailed below:
Investment risk: This may arise from volatility in Asset value due to market fluctuations and impairment of assets due to credit losses.
The defined benefit plans may hold equity type assets, which may carry volatility and associated risk.
Interest risk: A decrease in bond yields will increase plan liabilities, although this is expected to be partially offset by an increase in the
value of the plan's investment in debt instruments.
Salary cost Inflation risk: The present value of some of the defined benefit plan obligations are calculated with reference to the future
salaries of plan participants. Increase in salary due to adverse Inflationary pressures might lead to higher liabilities.
Longevity risk: The present value of defined benefit plan obligation is calculated by reference to the best estimate of the mortality of plan
participants. Increase or decrease in such rate will affect the plan liability.
A. Gratuity (Funded) Expected contribution to the plan for the next year is `7,40 lakhs.
B. Leave encashment & Compensated absences (funded): Expected contribution to the plan for the next year is `5,25 lakhs.
C. Post Retirement employees medical scheme (unfunded): The company earmarks liability towards unfunded post retirement medical benefit and provides for payments to vested employees.
The benefits under the plan are in the form of a medical benefit paid to employees post their employment within the company.
NOTES TO THE ACCOUNTS (Contd.)

Sundaram Finance Limited
124
Details of defined benefit plans as per actuarial valuation are as below: (`in lakhs)
Particulars
FUNDED
Gratuity
UNFUNDED
Retired Employee Medical Scheme
31.03.2019 31.03.2018 01.04.2017 31.03.2019 31.03.2018 01.04.2017
Amounts recognised in profit or loss
Current service cost 2,88.43 2,63.07 – – – –
Net interest expense/(income) (13.35) (8.45) – 7.13 7.67 7.97
Total amount included in employee benefits expense 2,75.08 2,54.62 – 7.13 7.67 7.97
Amounts recognised in other comprehensive income
Re measurement (gains)/losses: Actuarial (gains)/
losses arising from changes in
- Financial assumptions 1,59.37 90.87 – 0.69 (0.71) 0.07
- Experience adjustments 4,26.69 2,03.53 – 9.64 (2.58) (4.73)
Return on plan assets, excluding amount included in
net interest expense/ (income)
21.29 (59.01) – – – –
Total amount recognised in other comprehensive income
6,07.35 2,35.38 – 10.33 (3.29) (4.66)
Changes in the defined benefit obligation
Opening defined benefit obligation 37,95.41 32,51.27 27,00.94 1,02.55 1,05.95 1,09.77
Add/(less) on account of business combination/transfers – (64.57) – – – –
Current service cost 2,88.43 2,63.07 2,05.16 – – –
Interest expense 2,99.10 2,29.26 2,11.48 7.13 7.67 7.96
Remeasurement (gains)/losses arising from changes in
- Demographic assumptions – – 1,94.92 – – –
- Financial assumptions 1,59.37 90.87 - 0.69 (0.71) 0.07
- Experience adjustments 4,26.69 2,03.53 53.65 9.64 (2.58) (4.73)
Benefits paid (1,04.01) (1,78.02) (1,14.88) (19.10) (7.78) (7.12)
Closing defined benefit obligation 48,64.98 37,95.41 32,51.27 1,00.91 1,02.55 1,05.95
Opening fair value of plan assets 36,37.92 31,42.73 25,85.15 – – –
Add/(less) on account of business combination – (73.47) – – – –
Return on plan assets excluding interest income 3,12.45 2,37.71 2,16.76 – – –
Contribution by employer 6,49.24 4,49.96 4,65.17 19.10 7.78 7.12
Benefits paid (1,04.01) (1,78.02) (1,14.88) (19.10) (7.78) (7.12)
Actuarial gain / (loss) on plan assets (21.29) 59.01 (9.47) – – –
Closing fair value of plan assets 44,74.31 36,37.92 31,42.73 – – –
Net asset / (liability) recognised in balance sheet
Defined benefit obligation 48,64.98 37,95.41 32,51.28 1,00.91 1,02.55 1,05.95
Fair value of plan assets 44,74.31 36,37.92 31,42.73 – – –
Surplus/(Deficit) (3,90.67) (1,57.49) (1,08.55) (1,00.91) (1,02.55) (1,05.95)
NOTES TO THE ACCOUNTS (Contd.)

Annual Report2018-19125
(in %)
Particulars
FUNDED
Gratuity
UNFUNDED
Retired Employee Medical Scheme
31.03.2019 31.03.2018 01.04.2017 31.03.2019 31.03.2018 01.04.2017
I. Actuarial assumptions
Discount rate 7.62 7.99 7.25 6.5-7.5 6.36-7.67 6.35-7.51
Expected Return on plan assets 7.62 7.99 7.25 – – –
Attrition rate (Age based)
From Age 18 - 20 years 3.00 3.00 3.00 – – –
From Age 21 - 40 years 2.00 2.00 2.00 – – –
From Age 41 - 58 years 1.00 1.00 1.00 – – –
Salary escalation 8.00 8.00 7.00 – – –
(` in lakhs)
Particulars
FUNDED
Gratuity
UNFUNDED
Retired Employee Medical Scheme
31.03.2019 31.03.2018 01.04.2017 31.03.2019 31.03.2018 01.04.2017
II. Quantitative sensitivity analysis for impact of significant assumptions on defined benefit obligation are as below
Impact of
0.5% decrease in discount rate 2,30.97 1,84.34 1,43.62 – – –
1.0% decrease in discount rate – – – 4.55 4.64 4.76
0.5% increase in discount rate (2,13.19) (1,69.94) (1,32.69) – – –
1.0% increase in discount rate – – – (4.11) (4.19) (4.29)
0.5% decrease in salary growth rate (2,13.42) (1,70.68) (1,33.62) – – –
0.5% increase in salary growth rate 2,29.02 1,83.44 1,43.32 – – –
Life expectancy + 1 year – – – (2.77) (2.77) (2.75)
Life expectancy - 1 year – – – 2.81 2.72 2.70
WeightedaveragedurationoftheDefinedbenefit
obligation (in years)
15.09 15.84 16.27 9.50 10.00 10.60
NOTES TO THE ACCOUNTS (Contd.)

Sundaram Finance Limited
126
(` in lakhs)
Particulars
FUNDED
Gratuity
UNFUNDED
Retired Employee Medical Scheme
31.03.2019 31.03.2018 01.04.2017 31.03.2019 31.03.2018 01.04.2017
Maturity profile of defined benefit obligation
Year 1 9,03.72 7,05.93 6,17.87 12.09 12.17 12.23
Year 2 2,81.75 1,29.00 1,74.50 11.31 11.45 11.58
Year 3 2,50.27 2,49.04 1,81.29 10.51 10.71 10.90
Year 4 1,93.45 2,15.39 1,77.25 9.70 9.95 10.20
Year 5 2,47.34 1,71.20 1,71.42 8.88 9.18 9.47
Next 5 years 18,93.78 15,05.78 12,12.40 32.62 34.52 36.43
In the absence of detailed information regarding plan assets which is funded with Insurance Companies, the composition of each major
category of plan assets, the percentage or amount for each category to the fair value of plan assets & the description of the Asset-Liability
matching strategies used by the plan has not been disclosed.
D. Provident Fund
The provident fund contributions to trust are managed through trust investments in addition to contribution of a portion of its
provident fund liability relating to Employees Pension Scheme to Employees Provident Fund Organisation.
The fund has a relatively balanced mix of investments in order to manage the risks. The investment strategy is designed based on the
interest rate scenario, liquidity needs of the Plans and pattern of investment as prescribed under the statute.
The trustees regularly monitor the funding and investment, there are systems in place to ensure that the health of the portfolio is
regularly reviewed and investments do not pose any significant risk of impairment.
The trust also holds reserves in its Balance sheet which can be used to provide for shortage in yield, if any, in the future years.
Major Category of Plan Assets as a % of the Total Plan Assets
Particulars 31.03.2019 31.03.2018 01.04.2017
Central Government Securities 13.70 17.10 20.40
State Government Securities 34.10 27.90 23.70
Public Sector Bonds 41.90 46.10 46.40
Private Sector Bonds 3.20 1.80 2.20
Special Deposits 3.80 4.50 5.20
Short Term Deposits – – 0.30
Equity Fund 3.30 2.60 1.80
Total 100.00 100.00 100.00
NOTES TO THE ACCOUNTS (Contd.)

Annual Report2018-19127
NOTES TO THE ACCOUNTS (Contd.)
Note 42: Share Based Payments (Refer note 33)
The Company grants ESOP to Senior Management employees in accordance with the terms of the Plan.
Description of the plan that existed during the period
Particulars Grant 10 Grant 9 Grant 8
Board meeting date 25-May-18 29-May-17 30-May-16
Options granted 20000 18550 14400
Exercise price (per share) 10 10 10
Date of grant 25-May-18 29-May-17 30-May-16
Vesting date 31-May-19 31-May-18 31-May-17
Vesting period 12 months 12 Months 12 Months
Exercise period 01-June-19 to
31-August-2019
01-June-2018 to
31-August-2018
01-June-2017 to
31-August-2017
Market price immediately prior to grant date 1732.90 1497.90 1397.70
Intrinsic value 1722.90 1487.90 1387.70
Group share based payments
The company as a part of ESOP scheme, has issued share options to employees of various group companies. The company does not get
reimbursed for the cost of such group share options and such costs are treated as investment in the group companies.
Effect of Share based payments transactions on Entities Financials:
(` in lakhs)
Particulars 2018-19 2017-18
Expenses recognised in Profit & Loss account 2,47.83 1,85.37
Amount recognised as Investment in Group companies 85.46 78.06
Unvested share options issued to employees of various group companies are as under:
(in nos)
Particulars Grant 10 Grant 9 Grant 8
31-03-2019 31-03-2018 01-04-2017
Sundaram Asset Management Company Limited 2,250 2,250 1,250
Royal Sundaram General Insurance Co. Limited 750 750 500
Sundaram BNP Paribas Home Finance Limited 2,000 2,500 2,500
Total 5,000 5,500 4,250

Sundaram Finance Limited
128
Measurement of fair value
The fair values of the options issued have been arrived at using the Black Scholes Model.
The key assumptions used in computing the fair value are
Particulars Grant10 Grant 9 Grant 8
Risk free interest rate per annum 7.03% 6.76% 7.47%
Life of the option 372 days 368 days 367 days
Expected volatility 31.18% 29.80% 34.15%
Fair value of the option(`) 1,723.59 1,488.56 1,388.43
The expected volatility is based on historical share price volatility. The life of the option has been based on general option holder
behaviour.
Reconciliation of the outstanding share options - 2018-19:The number and weighted-average exercise prices of share options under various grants are as follows:
Grant details Grant 10 Grant 9
Particulars Weightedaverageexercise price per option
No of options
Weightedaverageexercise price per option
No of options
Outstanding at the beginning of the period – – – -
Granted during the period 10 20,000 10 18,550
Forfeited / expired during the period – – – –
Exercised during the period – – – –
Outstanding at the end of the period 10 20,000 10 18,550
Exercisable at the end of the period – – – –
Exercise price and Contractual life for the share options outstanding at the end of the period
Particulars 2019 2018 2017
Exercise Price (`) 10 10 10
Contractual life 2 months 2 months 2 months
Reconciliation of the outstanding share options - 2017-18:The number and weighted-average exercise prices of share options under various grants are as follows:
Grant details Grant 9 Grant 8
Particulars Weightedaverageexercise price per option
No of options
Weightedaverageexercise price per option
No of options
Outstanding at the beginning of the period – – 10 14,400
Granted during the period 10 18,550 – –
Forfeited / expired during the period – – – –
Exercised during the period – – 10 14,400
Outstanding at the end of the period 10 18,550 – –
Exercisable at the end of the period – – – –
NOTES TO THE ACCOUNTS (Contd.)

Annual Report2018-19129
Note 43: Leases
(`in lakhs)
Details
31-03-2019 31-03-2018 01-04-2017
Gross Investment
in Lease
Present value of
Minimum Lease
payments
Gross Investment
in Lease
Present value of
Minimum Lease
payments
Gross Investment
in Lease
Present value of
Minimum Lease
payments
Upto 1 Year 554,30.38 494,25.92 929,63.67 796,60.33 1124,09.67 928,49.36
1-5 Year 331,11.90 308,49.92 941,05.83 838,48.97 1610,33.02 1413,70.37
> 5 Year – – – – – –
Total 885,42.28 802,75.84 1870,69.50 1635,09.30 2734,42.69 2342,19.73
Less: Unearned Finance income 82,66.44 235,60.20 392,22.96
Present value of Minimum Lease payments 802,75.84 1635,09.30 2342,19.73
Operating lease as lessor
Maturity pattern of Minimum Lease payments:
(` in lakhs)
Year 31.03.2019 31.03.2018 01.04.2017
Less than 1 year 52,88.66 57,62.06 79,72.38
Later than 1 year and not later than 5 years 67,66.77 70,40.30 103,60.04
Later than 5 years – – –
Total 120,55.43 128,02.36 183,32.42
Operating lease as a lessee
The Company has taken certain premises for its business operations under cancellable operating lease agreements ranging from 11 months
to 15 years which are subject to renewal at mutual consent:
(`in lakhs)
Particulars 2018-19 2017-18
Total operating lease payment recognised as expense during the period 16,77.28 14,73.94
Finance lease as a lessee
Assets acquired under finance lease comprises Land which have a primary period of Ninety-eight years with an option to renew it.
(`in lakhs)
Particulars 31.03.2019 31.03.2018 01.04.2017
Carrying value of assets taken on finance lease 39.08 39.08 39.08
NOTES TO THE ACCOUNTS (Contd.)

Sundaram Finance Limited
130
Note 44: General
44.01 In February 2019, the company sold 11,62,91,000 equity shares of `10/- each (representing 25.90% stake) in Royal
Sundaram General Insurance Co. Limited (RSGI) for a consideration of ̀ 984,17.07 lakhs to Ageas Insurance International N.V,
The Netherlands, resulting in a profit before tax of `592,43.45 lakhs, disclosed as an exceptional item in the statement of Profit
and Loss. The profit is net of transaction expenses and provisions towards certain financial covenants, whereby the company
has agreed to indemnify the buyer. Subsequent to the transaction, the company holds 50% in the equity share capital of RSGI,
resulting in RSGI becoming a Joint Venture company with effect from 23rd February 2019.
44.02 Segment Information
Segment information is presented in the consolidated financial statements as per Ind AS 108.
44.03 The Company has spent an amount of ̀ 14,04.87 lakhs (2017-18 - ̀ 12,64.84 lakhs) towards Corporate Social Responsibility(CSR)
under Sec 135 of the Companies Act 2013, in the various areas covered under the regulatory provisions like healthcare, education,
environment and protection of art and culture.
44.04 The pending litigations as on 31st March 2019 have been compiled by the company and reviewed by the Statutory Auditors.
The current position of the litigation has been evaluated and the effect thereof has been appropriately disclosed in the financial
statements.
44.05 Provisions contingent liabilities and contingent asset
(` in lakhs)
Movement of provisions Amount
Carrying amount as on 31.03.2018 56,38.77
Add: Provisions made during the year 49.08
Less: Amount used or reversed during the year 16,99.63
Carrying amount as on 31.03.2019 39,88.22
(`in lakhs)
Contingent liabilities 31.03.2019 31.03.2018 01.04.2017
a) On Cheques discounted 1.38 27.80 99.79
b) Bank guarantee and Letter of credit 5,14.83 8,15.14 1,94.30
c) Claims against the company not acknowledged as debts 6,21.60 6,34.29 5,71.46
d) Tax disputes 60,23.16 74,14.68 98,87.90
Tax disputes in respect of Income Tax, Service Tax, VAT demands and Customs duty are pending before various appellate forums/
authorities and the cash flows would be determined only upon the receipt of decisions. The Company is of the opinion that the
demands are not sustainable and expects to succeed in its appeal.
The contested tax demands have been ascertained on the basis of relief allowed by the appellate authorities, on similar issues
in earlier assessment years.

Annual Report2018-19131
NOTES TO THE ACCOUNTS (Contd.)
44.06 RELATED PARTIES DISCLOSURES: Related Party Disclosures as per INDAS 24 for the year ended 31st March 2019, are given below:
Subsidiary Companies:Sundaram Asset Management Company Limited
Sundaram Asset Management Singapore Pte Limited
Sundaram Alternate Assets Limited
Sundaram Trustee Company Limited
Sundaram Finance Holdings Limited
Sundaram Business Services Limited
Sundaram BPO India Limited (Till 31.03.2018)
LGF Services Limited
Royal Sundaram General Insurance Co. Limited (Till 22/02/2019)
SundaramFinanceemployeeWelfaretrust
Joint Ventures:Sundaram BNP Paribas Home Finance Limited
Sundaram BNP Paribas Fund Services Limited
Royal Sundaram General Insurance Co. Limited (From 23/02/2019)
Associates:Flometallic India Private Limited
The Dunes Oman LLC (FZC)
Sundaram Hydraulics Limited
Axles India Limited
Turbo Energy Private Limited
Transenergy Limited
Sundaram Dynacast Private Limited
Key Management Personnel:Mr. T.T. Srinivasaraghavan, Managing Director
Mr. Harsha Viji, Deputy Managing Director
Mr. A.N Raju, Director (Operations)
Relatives of Key Management Personnel: (with whom the company has transactions)
Mr. T.T. Srinivasaraghavan Mr. Harsha Viji Mr. A.N. Raju
Father Mr. T.T. Rangaswamy Mr. S.Viji
Mother Mrs. Vimala Rangaswamy Mrs. Chitra Viji
Wife Mrs. Bagyam Raghavan Mrs. R.N. Mala
Daughter Miss. Anjana Raghavan
Son Mr T.T. Venkatraghavan
Brother Mr. T.T.Narendran Mr. Sriram Viji Mr. A.N. Sreeram
Enterprises over which Key Management Personnel (KMP) and his relatives can exercise significant influence
M/s. Azorius Holdings Private Limited
M/s. Uthirattadhi Sriram Holdings Private Limited

Sundaram Finance Limited
132
NOTES TO THE ACCOUNTS (Contd.)
All the arrangements and transactions entered into by the company with related parties, during the financial year 2018-19 were in ordinary
course of business and on arm’s length price.
The required statements and documents with respect to the related party transactions were placed before the Audit Committee and Board
of Directors.
Related Party Transactions for the Year Ended 31st March 2019The nature and volume of transactions for the year ended 31st March 2019 with the above related parties are as follows.
(` in lakhs)
Particulars Subsidiaries Associates Joint Ventures 2018-19 2017-18
INCOME
Lease Rental Income 28.37 73.11 58.48 1,59.96 1,50.76
Interest Income 0.04 – 10,74.98 10,75.02 10,85.97
Income from Services 22.28 33.89 14,98.03 15,54.20 13,39.35
Dividend 15,12.50 – 17,75.50 32,88.00 26,15.50
Rent Receipts 3,75.47 – 2,66.03 6,41.50 5,71.51
Income from other Financial Services 10,44.39 – 31,48.34 41,92.73 43,29.68
Other Non Operating Income 40.46 – 1,71.95 2,12.41 2,10.06
EXPENDITURE
Interest 5,02.62 5,02.62 4,39.73
Support Services 11,57.37 – – 11,57.37 7,36.35
Rent Paid 94.39 2.89 97.28 25.34
Insurance Premium 1,25.47 1,25.47 1,28.13
Brokerage Paid 3.44 3.44 1.10
ASSETS
Investments – – – – 226,45.50
Disinvestment – – 303,07.38 303,07.38 –
Loans and Advances Disbursed 3.33 – – 3.33 5.70
Repayment of Loans and Advances 3.62 – – 3.62 5.82
Insurance Premium paid in advance – – 1,42.83 1,42.83 1,19.37
Dividend Paid 1,78.71 – – 1,78.71 63.67
LIABILITIES
Issue of Non Convertible Debentures – – 15,02.34 15,02.34 –
Other Liabilities 1,62.35 – – 1,62.35 1,39.81
(` in lakhs)
Compensation paid to Key
Managerial Personnel
2018-19 2017-18
Short term benefits 10,87.47 10,18.28
Post retirement benefits 34.28 32.25
Share based payments 42.09 35.62
(` in lakhs)
Transactions with Key Managerial Personnel
2018-19 2017-18
Interest on deposits 57.07 83.95Dividend Paid 12,68.92 4,85.06Dividend Paid to Enterprises over which KMP and his relatives is exercising significant influence
3,96.05 1,51.43

Annual Report2018-19133
Disclosure Of Material Transactions With Related Parties(` in lakhs)
Particulars Related Parties 2018-19 2017-18
INCOME
Lease Rental Income Turbo Energy Private Limited 56.88 63.73
Sundaram BNP Paribas Fund Services Limited 40.71 15.48
Sundaram Asset Management Company Limited 28.37 28.55
Royal Sundaram General Insurance Co. Limited 17.77 28.28
Axles India Limited 16.23 14.72
Interest Income Royal Sundaram General Insurance Co. Limited 10,74.98 10,75.00
Sundaram Asset Management Company Limited 0.04 0.14
Sundaram Business Services Limited – 10.83
Income from Services Sundaram BNP Paribas Home Finance Limited 7,52.11 6,72.01
Royal Sundaram General Insurance Co. Limited 3,80.64 3,63.42
Sundaram BNP Paribas Fund Services Limited 3,65.28 2,59.58
Turbo Energy Private Limited 33.89 28.08
Sundaram Asset Management Company Limited 13.69 14.43
Sundaram Finance Holdings Limited 7.50 –
Sundaram Business Services Limited 1.09 1.82
Dividend Sundaram BNP Paribas Home Finance Limited 17,75.50 17,75.50
Sundaram Asset Management Company Limited 8,00.00 7,00.00
Sundaram Finance Holdings Limited 6,00.00 37.50
LGF Services Limited 62.50 62.50
Sundaram Trustee Company Limited 50.00 40.00
Rent Receipts Sundaram Asset Management Company Limited 2,33.12 1,99.97
Sundaram BNP Paribas Home Finance Limited 1,90.07 1,73.68
Sundaram Business Services Limited 1,10.02 1,26.29
Royal Sundaram General Insurance Co. Limited 47.91 43.52
Sundaram Finance Holdings Limited 32.32 –
Sundaram BNP Paribas Fund Services Limited 28.05 28.05
Income from other Financial Services Royal Sundaram General Insurance Co. Limited 18,45.81 14,81.10
Sundaram Asset Management Company Limited 10,21.45 15,43.40
Sundaram BNP Paribas Fund Services Limited 6,90.91 5,72.20
Sundaram BNP Paribas Home Finance Limited 6,11.62 6,65.77
Sundaram Alternate Assets Limited 22.94 –
LGF Services Limited – 67.20
NOTES TO THE ACCOUNTS (Contd.)

Sundaram Finance Limited
134
NOTES TO THE ACCOUNTS (Contd.)
Particulars Related Parties 2018-19 2017-18
Other Non Operating Income Sundaram BNP Paribas Home Finance Limited 1,29.98 1,10.99
Sundaram BNP Paribas Fund Services Limited 26.67 29.07
Sundaram Asset Management Company Limited 26.46 31.68
Royal Sundaram General Insurance Co. Limited 15.30 25.83
Sundaram Business Services Limited 10.00 6.00
Sundaram Finance Holdings Limited 4.00 0.50
Sundaram BPO India Limited – 6.00
EXPENDITURE
Interest Royal Sundaram General Insurance Co. Limited 502.62 4,39.73
Support Services Sundaram Finance Holdings Limited 11,57.37 2,44.20
Sundaram BPO India Limited – 4,92.15
Rent Paid Sundaram Finance Holdings Limited 94.39 21.02
Royal Sundaram General Insurance Co. Limited 2.67 2.91
Sundaram BNP Paribas Home Finance Limited 0.22 1.41
Insurance Premium Royal Sundaram General Insurance Co. Limited 1,25.47 1,28.13
Brokerage Paid Sundaram BNP Paribas Home Finance Limited 3.44 1.10
(` in lakhs)
Particulars Related Parties 2018-19 2017-18
Dividend Paid SundaramFinanceemployeeWelfaretrust 1,78.71 63.67
(` in lakhs)
Particulars Related Parties 2018-19 2017-18
ASSETS
Purchase of Fixed Assets Sundaram Business Services Limited 7.25 –
Investments Royal Sundaram General Insurance Co. Limited – 223,90.50
Sundaram BNP Paribas Fund Services Limited – 2,55.00
Disinvestments Royal Sundaram General Insurance Co. Limited 303,07.38 –
Loans and Advances Disbursed Sundaram Asset Management Company Limited 3.33 5.70
Repayment of Loans and Advances Sundaram Asset Management Company Limited 3.62 5.82
Insurance Pemium paid in advance Royal Sundaram General Insurance Co. Limited 1,42.83 1,19.37
LIABILITIES
Issue of Non Convertible Debentures Royal Sundaram General Insurance Co. Limited 15,02.34 –
Other Liabilities Sundaram Finance Holdings Ltd 1,62.35 1,39.81

Annual Report2018-19135
Balances With Related Parties as at 31st March 2019 (` in lakhs)
Balances Outstanding
Subsidiaries Associates Joint Ventures
Key Management Personnel
Relatives of Key
Management Personnel
Enterprises over which
KMP and his relatives is exercising significant influence
31.03.2019 31.03.2018 01.04.2017
ASSETS
Investments 208,19.21 – 863,67.18 – – – 1071,86.39 1374,02.29 1146,84.76
Loans and Advances 0.20 32.18 4,13.04 – – – 4,45.42 2,58.30 3,29.81
Other Assets 14.93 – 9,13.48 – – – 9,28.41 11,89.62 5,09.41
LIABILITIES
Equity Holdings 5,29.57 – 2,04.57 4,51.98 2,32.97 14,19.08 15,19.00 15,62.38
Non Convertible
Debentures
– – 53,02.33 – – – 53,02.33 54,16.51 52,45.02
Deposits – – – 31.10 6,82.81 – 7,13.91 7,03.19 10,64.61
Other Liabilities 1,89.30 – 1,79.69 – – – 3,68.99 3,48.23 2,58.48
Remuneration
payable
– – – 7,54.51 – – 7,54.51 7,07.48 5,50.21
NOTES TO THE ACCOUNTS (Contd.)
Disclosure of Material Balances with Related Parties as at 31st March 2019(` in lakhs)
Balances Outstanding Subsidiaries Joint Ventures 31.03.2019 31.03.2018 01.04.2017
ASSETS
Investments
a) Investments In Equity Shares
Royal Sundaram General Insurance Co. Limited – 585,37.34 585,37.34 888,32.08 664,31.12
Sundaram Asset Management Company Ltd. 185,70.41 – 185,70.41 185,32.51 185,01.70
Sundaram BNP Paribas Home Finance Ltd. – 152,57.75 152,57.75 152,22.82 151,86.03
Sundaram BNP Paribas Fund Services Ltd. – 22,95.15 22,95.15 22,95.15 20,40.15
Sundaram Trustee Company Ltd. 2,28.62 – 2,28.62 2,28.62 2,28.62
Sundaram Finance Holdings Ltd. 20,15.18 – 20,15.18 20,15.18 20,15.18
LGF Services Ltd. 5.00 – 5.00 5.00 5.00
Total 208,19.21 760,90.24 969,09.45 1271,31.36 1044,07.80
b) Investments In Non-Convertible Debentures
Royal Sundaram General Insurance Co. Limited – 102,76.94 102,76.94 102,70.93 102,76.96

Sundaram Finance Limited
136
Disclosure of Material Balances with Related Parties as at 31st March 2019 (` in lakhs)
Balances Outstanding Subsidiaries Associates Joint Ventures
Key Management
Personnel
Relatives of Key
Management Personnel
Enterprises over which KMP and
his relatives is exercising significant influence
31.03.2019 31.03.2018 01.04.2017
Loans and Advances
a) Intercorporate Loans
Sundaram Business Services Ltd. – – – – – – – – 2,00.00
b) Lease Receivables
Sundaram BNP Paribas Fund Services Ltd. – – 4,13.04 – – – 4,13.04 2,47.42 89.49
Axles India Ltd. – 32.18 – – – – 32.18 10.43 15.36
c) Fleet
Sundaram Asset Management Company Ltd. 0.20 – – – – – 0.20 0.45 0.46
Sundaram Business Services Ltd. – – – – – – – – 0.13
d) Hypothecation Loans
Sundaram Hydraulics Ltd. – – – – – – – – 24.37
Total 0.20 32.18 4,13.04 – – – 4,45.42 2,58.30 3,29.81
Other Assets
Royal Sundaram General Insurance Co. Ltd. – – 7,58.28 – – – 7,58.28 4,84.42 2,28.04
Sundaram Business Services Limited 13.16 – – – – – 13.16 15.34 13.83
Sundaram Asset Management Company Ltd. 0.37 – – – – – 0.37 3,52.97 1,77.32
Sundaram Alternate Assets Limited 1.40 – – – – – 1.40 – –
Sundaram BNP Paribas Fund Services Ltd. – – 93.79 – – – 93.79 88.81 50.89
Sundaram BNP Paribas Home Finance Ltd. – – 61.41 – – – 61.41 2,37.74 39.33
Sundaram Finance Holdings Ltd. – – – – – – – 0.33 –
Sundaram BPO India Ltd. – – – – – – – 1.77 –
Turbo Energy Private Ltd. – – – – – – – 8.24 –
Total 14.93 – 9,13.48 – – – 9,28.41 11,89.62 5,09.41
LIABILITIES
Equity Holdings 5,29.57 – – 2,04.57 4,51.98 2,32.97 14,19.08 15,19.00 15,62.38
Non Convertible Debentures
Royal Sundaram General Insurance Co. Ltd. – – 53,02.33 – – – 53,02.33 54,16.51 52,45.02
Deposits 31.10 6,82.81 7,13.91 7,03.19 10,64.61
Other Liabilities
Sundaram BNP Paribas Home Finance Ltd. – – 1,43.44 – – – 1,43.44 1,43.58 1,44.02
Royal Sundaram General Insurance Co. Ltd. – – 36.25 – – – 36.25 36.25 36.25
Sundaram Asset Management Company Ltd. 26.95 – – – – – 26.95 26.95 26.95
Sundaram BPO India Ltd. – – – – – – – – 51.26
Sundaram Finance Holdings Ltd 1,62.35 – – – – – 1,62.35 1,39.81 –
LGF Services Ltd – – – – – – – 1.64 –
Remuneration payable – – – 7,54.51 – – 7,54.51 7,07.48 5,50.21
Total 1,89.30 – 1,79.69 7,54.51 – – 11,23.50 10,55.71 8,08.69
NOTES TO THE ACCOUNTS (Contd.)
(` in lakhs)
Maximum amount outstanding in respect of Loans and Advances 2018-19 2017-18
Sundaram BNP Paribas Fund Services Ltd 4,22.90 2,47.42
Axles India Ltd 49.21 54.77

Annual Report2018-19137
NOTES TO THE ACCOUNTS (Contd.)
44.07 Estimated amount of contracts remaining to be executed on capital account
(`in lakhs)
Particulars 31.03.2019 31.03.2018 01.04.2017
Estimated Amount of contracts remaining to be executed on capital account
(net of advance)
1,52.56 3,24.86 6,11.15
Uncalled commitment in Alternative Investment Fund Schemes 8,88.92 33,61.22 13,50.00
44.08 Interim dividend paid during the year is `5/- per share. Final dividend of `7.5/- per share and Special dividend of `5/- per
share have been recommended by the Board for the year ended 31st March 2019 in May 2019.
44.09 Administrative and other expenses include payment to Auditors towards:
(`in lakhs)
Particulars 2018-19 2017-18
Statutory Audit 60.00 60.00
Tax Audit 15.00 15.00
Certification 21.00 29.70
Reimbursement of expenses 2.00 0.09
44.10 Disclosure under the MSME Act 2006, (As per the intimation received form the vendor)
(` in lakhs)
Particulars 31.03.2019 31.03.2018 31.03.2017
i) a) Principal amount remaining unpaid* 85.84 NIL NIL
b) Interest amount remaining unpaid NIL NIL NIL
ii) Interest and principal amount paid beyond appointed date NIL NIL NIL
iii) Amount of interest due and payable for the period of delay
in making payment (which have been paid but beyond the
appointment day during the year) but without adding the
interest specified under this Act.
NIL NIL NIL
iv) Interest accrued and remaining unpaid NIL NIL NIL
v) Interest remaining due and payable even in the succeeding years,
until such date when the interest dues as above are actually paid
to the small enterprise
NIL NIL NIL
* Subsequently paid in Apr-19 as per the agreed terms

Sundaram Finance Limited
138
NOTES TO THE ACCOUNTS (Contd.)
44.11 Based on the current assessment of the long-term contracts in the ordinary course of business, the Company has made adequate
provision for losses where required. The derivative contracts have been entered into for hedging the foreign currency liability
and interest liability. Derivative contracts being in the nature of hedge contracts, the Company does not anticipate any material
losses from the same.
44.12 Scheme of arrangement
The National Company Law Tribunal, Division Bench, Chennai vide Order No. CP/210-214/CAA/2017 dated 12th January 2018
approved the Composite Scheme of Arrangement and Amalgamation (Scheme) between the Company and its four subsidiaries,
viz., Sundaram Insurance Broking Services Limited, Infreight Logistics Solutions Limited, Sundaram BPO India Limited and
Sundaram Finance Holdings Limited which was received on 18th January 2018. The Scheme was to be effective from the
Appointed Date, i.e. 01st April 2016, and is operative from the Effective Date, i.e. 18th January 2018. The scheme envisages the
following
• AmalgamationofSundaramInsuranceBrokingServicesLimited(SIBSL)andInfreightLogisticsSolutionsLimited(ILSL)into
the Company. Pursuant to the scheme, the authorised equity share capital of the Company stands increased by 1,11,00,000
equity shares of `10 each aggregating to `1110 lakhs. Consequent to the merger, the entire issued, subscribed and paid
up capital of SIBSL & ILSL, held by the company and its nominees would stand cancelled. The net amount debited to
reserves on account of the amalgamation amounts to `173.43 lakhs;
• DemergerofthesharedservicesofSundaramBPOIndiaLimited(SBPO)intotheCompany;andsubsequently
• Demergerof thenon-coreinvestmentsandsharedservicesof theCompanyintoSundaramFinanceHoldingsLimited
(SFHL). All shareholders of the company have been allotted shares in SFHL, in the ratio of 1:1 and the shares have been
listed in NSE.
44.13 Earnings per Share
Particulars
Year Ended
31.03.2019
Year Ended
31.03.2018
Profit /(Loss) attributable to equity shareholders ( ` in lakhs) 1126,30.88 563,43.65
Weightedaveragenumberofequityshares 11,11,03,860 11,11,03,860
Earnings per share – Basic & Diluted (in `) 101.37 50.71
Face value of Share 10 10

Annual Report2018-19139
Note 45 : Disclosures as per Non-Banking Financial Company - Systemically Important Non-Deposit Taking Company and Deposit taking Company (Reserve Bank) Directions, 2016 (based on Ind AS financial statements)
45.01 Capital to Risk (weighted) Assets Ratio
31.03.2019 31.03.2018
CRAR (%) 19.46 18.03
CRAR - Tier I Capital (%) 14.65 12.46
CRAR - Tier II Capital (%) 4.81 5.57
Subordinated debt considered as Tier II Capital (` in lakhs) 1437,06.51 1410,38.82
45.02 Investments
(` in lakhs)
31.03.2019 31.03.2018
Value of Investments
Gross Value of Investments
a) In India 1879,27.84 2215,27.60
b) Outside India – –
Provisions for Depreciation
a) In India 12,94.86 8,47.60
b) Outside India – –
Net Value of Investments
a) In India 1866,32.98 2206,80.00
b) Outside India – –
Movement of provisions held towards depreciation on investments
Opening balance 8,47.60 8,24.20
Add : Provisions made during the year 4,48.53 26.50
Less : Reversal of provisions during the year 1.27 3.10
Closing balance 12,94.86 8,47.60
NOTES TO THE ACCOUNTS (Contd.)

Sundaram Finance Limited
140
45.03 Derivatives
45.03.01 Forward Rate Agreement / Interest Rate Swap (FRA / IRS)
(` in lakhs)
31.03.2019 31.03.2018
The notional principal of swap agreements 300,00.00 –
Losses which would be incurred if counterparties failed to
fulfill their obligations under the agreements
13,22.83 –
Collateral required by NBFC upon entering into swaps – –
Concentration of credit risk arising from the swaps 100% with Banks
The fair value of the swap book 10,06.30 –
The details and terms of IRS / FRA are set out below:
(` in lakhs)
Derivatives 31.03.2019 31.03.2018 Benchmark Terms
Notional Principal
Interest Rate Swap 125,00.00 – OIS Fixed Receivable v/s Floating Payable
Interest Rate Swap 125,00.00 – OIS Fixed Payable v/s Floating Receivable
Forward Rate Agreement 50,00.00 – OIS Fixed Receivable v/s Floating Payable
45.03.02 Exchange Traded Interest Rate (IR) Derivaties : NIL
45.03.03 Qualitative disclosures on risk exposure of derivatives
i) Qualitative disclosures:
The Company has a Board approved policy for entering into derivative transactions. Derivative transaction comprises
Forward Rate Agreements, Interest Rate Swaps, Coupon Only Swaps, Currency and Interest Rate Swap and Forward Exchange
contracts. The Company undertakes such transactions for hedging balance sheet assets and liabilities. The Asset Liability
Management Committee and Risk Management Committee periodically monitors and reviews the risks involved.
ii) Quantitative disclosures
(` in lakhs)
Currency Derivatives Interest Rate Derivatives
31.03.2019 31.03.2018 31.03.2019 31.03.2018
i) Derivatives (Notional Principal Amount)
For Hedging 888,05.16 1795,59.42 300,00.00 –
ii) Marked to Market Position
- Asset (+) 62,35.34 11,87.90 13,22.83 –
- Liability (-) – 25,66.45 3,16.53 –
iii) Credit Exposure 17,76.10 102,95.60 6,50.00 –
iv) Unhedged Exposures – – – –
NOTES TO THE ACCOUNTS (Contd.)

Annual Report2018-19141
45.04 Disclosures relating to Securitisation
45.04.01 Special Purpose Vehicles (SPVs) and Minimum Retention Requirements
(` in lakhs)
31.03.2019 31.03.2018
No. of SPVs Sponsored by the NBFC for Securitisation Transactions 16 15
Total amount of securitised assets as per books of the SPVs sponsored 4225,72.50 4395,51.72
Total amount of exposures retained by the NBFC to comply with MRR as on the date
of balance sheet
Off-balance sheet exposures
First loss – –
Others – –
On-balance sheet exposures
First loss 608,42.77 597,94.66
Others 77,18.27 91,73.62
Total amount of exposures to securitisation transactions other than MRR
Off-balance sheet exposures
Exposures to own securitisations
First loss – –
Others – –
Exposure to third party securitisations
First loss – –
Others – –
On-balance sheet exposures
Exposures to own securitisations
First loss – –
Others – –
Exposure to third party securitisations
First loss – –
Others – –
45.04.02 Details of Assignment transactions undertaken
(` in lakhs)
2018-19 2017-18
No. of accounts 9316 5829
Aggregate consideration on sale 656,29.28 489,64.01
Aggregate value (net of provisions) of accounts sold 645,38.49 476,84.62
Additional consideration realized in respect of accounts transferred in earlier years – –
Aggregate gain / (loss) over net book value 10,90.79 12,79.39
45.04.03 Details of Financial Assets Sold to Securitisation / Reconstruction Company for Asset Reconstruction: NIL
45.04.04 Details of non-performing financial assets purchased / sold : NIL
NOTES TO THE ACCOUNTS (Contd.)

Sundaram Finance Limited
142
45.05 Maturity Pattern of certain items of Assets and Liabilities as at March 31, 2019:(` in lakhs)
Upto 30/
31 days
Over 1
month
upto
2 months
Over 2
months
upto
3 months
Over 3
months
& upto
6 months
Over 6
months
& upto
1 year
Over 1
year
& upto
3 years
Over 3
years
& upto
5 years
Over 5
years
Total
Deposits 138,37.93 125,00.22 125,71.52 422,63.31 679,71.04 1608,55.17 – – 3099,99.19
Borrowings 923,26.37 586,64.74 1165,14.22 1653,42.37 5120,57.01 9678,80.19 697,40.35 1208,65.55 21033,90.79
Foreign
Currency
Liabilities
– – – – 907,85.94 – – – 907,85.94
Advances 1551,39.31 1288,69.90 1419,88.73 3416,45.38 6121,98.16 14915,72.14 2798,88.53 10,68.94 31523,71.10
Investments 151,87.13 44,64.60 20,18.88 66,65.84 143,39.51 267,57.98 60,96.25 1111,02.80 1866,32.98
Foreign
Currency
Assets
1,27.79 – – – – – – – 1,27.79
NOTES TO THE ACCOUNTS (Contd.)
45.06 Exposures
45.06.01 Exposure to Real Estate Sector
(` in lakhs)
31.03.2019 31.03.2018
Residential Mortgages -
Lending fully secured by mortgages on residential property that is or will be occupied
by the borrower or that is rented
16,31.83 17,83.45
Commercial Real Estate -
Lending secured by mortgages on commercial real estates (office buildings, retail
space, multi purpose commercial premises, multi-family residential buildings, multi-
tenanted commercial premises, industrial or warehouse space, hotels, land acquisition,
development and construction, etc). Exposure would also include non-fund based limits
21,63.48 10,00.24
Investments in Mortgage Backed Securities (MBS) and other securitised exposures
- Residential – –
- Commercial Real Estate – –
Total Exposure to Real Estate Sector 37,95.31 27,83.69

Annual Report2018-19143
45.06.02 Exposure to Capital Market
(` in lakhs)
31.03.2019 31.03.2018
Direct investment in equity shares, convertible bonds, convertible debentures and units of
equity-oriented mutual funds the corpus of which is not exclusively invested in corporate
debt; (listed Securities)
23,15.42 23,15.18
Advances against shares / bonds / debentures or other securities or on clean basis to
individuals for investment in shares (including IPOs/ESOPs), convertible bonds, convertible
debentures, and units of equity-oriented mutual funds;
– –
Advances for any other purposes where shares or convertible bonds or convertible debentures
or units of equity oriented mutual funds are taken as primary security;
– –
Advances for any other purposes to the extent secured by the collateral security of shares
or convertible bonds or convertible debentures or units of equity oriented mutual funds i.e
where the primary security other than shares / convertible bonds / convertible debentures
/ units of equity oriented mutual funds does not fully cover the advances;
– –
Secured and unsecured advances to stockbrokers and guarantees issued on behalf of
stockbrokers and market makers;
– –
Loans sanctioned to corporates against the security of shares / bonds / debentures or
other securities or on clean basis for meeting promoter's contribution to the equity of new
companies in anticipation of raising resources;
– –
Bridge loans to companies against expected equity flows / issues – –
All exposures to Venture Capital Funds (both registered and unregistered) – –
Total Exposure to Capital Market 23,15.42 23,15.18
45.06.03 Details of financing of parent company products : NIL
45.06.04 Details of Single Borrower Limit (SBL) / Group Borrower Limit (GBL) exceeded by the company : NIL
45.07 Registration obtained from other financial sector regulators during the year : NIL
45.08 Disclosure of penalties imposed by RBI and other regulators : NIL
45.09 Rating Assignment by Credit Rating Agencies and migration of ratings during the year
Instrument ICRA CRISIL
Deposits AAA AAA
Debentures AAA AAA
Subordinated Debentures AAA AAA
Long Term Bank Loans AAA AAA
Consortium Bank Facilities AAA –
Commercial Paper A1+ A1+
Short Term Bank Loans A1+ –
Migration of ratings during the year : NIL
NOTES TO THE ACCOUNTS (Contd.)

Sundaram Finance Limited
144
NOTES TO THE ACCOUNTS (Contd.)
45.10 Provisions and Contingencies(` in lakhs)
Break up of 'Provisions and Contingencies' shown under the head Expenditure in Profit
and Loss Account
2018-19 2017-18
Provisions for depreciation on Investments 4,47.26 23.40
Provisions towards Stage III assets (incl. write offs) 78,42.53 68,56.98
Provisions for Stage I & II assets 24,43.35 16,70.46
Provisions made towards Income Tax 361,40.20 286,27.75
45.11 Concentration of Deposits(` in lakhs)
31.03.2019 31.03.2018
Total Deposits of twenty largest depositors 121,12.49 105,65.16
% of Twenty largest depositors 4.07% 4.23%
45.12 Concentration of Advances(` in lakhs)
2018-19 2017-18
Total Advances to twenty largest borrowers 419,36.11 250,74.62
% of Twenty largest borrowers 2.45% 1.60%
45.13 Concentration of Exposures(` in lakhs)
31.03.2019 31.03.2018
Total Exposure to twenty largest borrowers 530,50.29 516,20.29
% of Twenty largest borrowers 1.92% 2.33%
45.14 Concentration of Stage III assets(` in lakhs)
31.03.2019 31.03.2018
Total Exposure to top four Stage III assets 22,74.50 16,37.09
45.15 Sector-wise Stage III assets as a percentage to Total Advances(` in lakhs)
Sector 31.03.2019 31.03.2018
Truck Operators 1.03 0.96
Auto Loans 1.39 1.14
Infrastructure Loans 0.91 0.96
Agriculture 4.12 5.12
Others 1.79 1.72

Annual Report2018-19145
NOTES TO THE ACCOUNTS (Contd.)
45.16 Movement of Stage III assets(` in lakhs)
2018-19 2017-18
Net Stage III assets to Net Advances (%) 0.83% 0.66%
Movement of Stage III assets (Gross)
Opening balance 283,50.46 280,59.18
Additions during the year 280,07.80 198,61.24
Reductions during the year 196,61.70 195,69.97
Closing balance 366,96.56 283,50.46
Movement of Net Stage III assets
Opening balance 145,57.15 145,54.50
Additions during the year 165,71.55 90,10.88
Reductions during the year 82,68.42 90,08.23
Closing balance 228,60.28 145,57.15
Movement of ECL on Stage III assets
Opening balance 137,93.31 135,04.69
Provisions made during the year 114,36.26 108,50.36
Write-off/Write-backofexcessprovisions 113,93.28 105,61.74
Closing balance 138,36.29 137,93.31
45.17 Overseas Assets (for those with Joint Ventures and Subsidiaries abroad) : NIL
45.18 Off-balance sheet SPVs sponsored (which are required to be consolidated as per accounting norms) : NIL
45.19 Customer Complaints
2018-19 2017-18
No. of complaints pending at the beginning of the year – 2
No. of complaints received during the year 639 162
No. of complaints redressed during the year 639 164
No. of complaints pending at the end of the year – –

Sundaram Finance Limited
146
NOTES TO THE ACCOUNTS (Contd.)
Note 46: Disclosure on Restructured Accounts(` in lakhs)
Type of Restructuring Others Total
Details Stage III assets
Restructured Accounts as on April 1, 2018 No. of borrowers 3 3
Amount outstanding 4,15.49 4,15.49
Provision thereon 1,75.64 1,75.64
Fresh restructuring during the year No. of borrowers – –
Amount outstanding – –
Provision thereon – –
Upgradations to restructured standard category during the year No. of borrowers – –
Amount outstanding – –
Provision thereon – –
Restructured standard advances which cease to attract higher
provisioning and / or additional risk weight at the end of the year and
hence need not be shown as restructured standard advances at the
beginning of the next year
No. of borrowers – –
Amount outstanding – –
Provision thereon – –
Downgradations of restructured accounts during the year No. of borrowers – –
Amount outstanding – –
Provision thereon – –
Write-offsofrestructuredaccountsduringtheyear No. of borrowers 1 1
Amount outstanding 1,34.25 1,34.25
Provision thereon 1,34.25 1,34.25
Restructured Accounts as on March 31, 2019 No. of borrowers 2 2
Amount outstanding 1,62.32 1,62.32
Provision thereon 14.24 14.24
Note 47: Disclosure on frauds During the year, frauds committed by four borrowers, in the nature of criminal breach of trust, to the extent of `3,49.42 lakhs
in aggregate were detected and reported to Reserve Bank of India. The company has provided for / written off the amount and
has proceeded legally to recover the dues from the respective borrowers.
Signatures to Note 1-47
S Viji S Prasad Chairman Director
T T Srinivasaraghavan Harsha Viji A N Raju Managing Director Deputy Managing Director Director (Operations)
M Ramaswamy P Viswanathan Chief Financial Officer Secretary & Compliance Officer
As per our report of even date attachedFor Sundaram & SrinivasanChartered AccountantsRegistration No.004207SK SrinivasanPartnerMembership No.5809Place : ChennaiDate : 30th May, 2019

Annual Report2018-19147
SCHEDULE(as required under Annexure II of Master Direction - Non-Banking Financial Company - Systemically Important Non-Deposit taking
Company and Deposit taking Company (Reserve Bank) Directions, 2016)(` in lakhs)
Particulars Amount
outstanding
Amount
overdueLiabilities side:
(1) Loans and advances availed by the NBFCs @a Debentures : Secured 8739,46.43 –
: Unsecured 1725,16.68 –(other than falling within the meaning of public deposits)
b Deferred Credits – –c Term Loans 8622,33.44 –d Inter-corporate loans and borrowings – –e Commercial paper 1740,06.86 –f Public Deposits 3098,49.29 3595.25 #g Other loans
- Bank Borrowing 1114,73.32 –- Deposits from Corporates 1,49.90 –
(2) Break-up of 1 (f) above (Outstanding public deposits)@a In the form of Unsecured debentures – –b In the form of partly secured debentures i.e. debentures where – –
there is a shortfall in the value of securityc Other public deposits 3098,49.29 35,95.25 #
@ Includes interest accrued thereon but not due and hence not paid # Represents unrenewed deposits and interest accrued thereon
(` in lakhs)
Particulars Amount outstanding
Assets side:
(3) Break-up of Loans and Advances including bills receivables(other than those included in (4) below) :
a Secured 209,89.06
b Unsecured (including Advance for Business Assets) 247,40.20
(4) Break-up of Leased Assets and Stock on hire andhypothecation loans counting towards AFC activities:
(i) Lease assets including lease rentals under sundry debtors
a Financial Lease –
b Operating Lease 119,18.81
(ii) Net Stock on hire including hire charges under sundry debtors
a Assets on hire 800,81.76
b Repossessed Assets 2,38.47
(iii) Hypothecation loans counting towards AFC activities
a Loans where assets have been repossessed 10,21.00
b Loans other than (a) above 26102,64.60

Sundaram Finance Limited
148
Particulars Amount outstanding Market Value *(5) Break-up of Investments :
Current Investments:1. Quoted: – –2. Unquoted:
(i) Units of mutual funds 130,15.52 130,15.52(ii) Others
- Investment in Commercial paper 47,14.12 47,21.87Long Term Investments:
1. Quoted:(i) Equity Shares 20,15.18 341,40.00
(ii) Government Securities 408,51.42 413,73.29(iii) Units of mutual funds 3,00.24 3,00.24
2. Unquoted:(i) Equity Shares 973,64.27 1424,54.24(ii) Debentures and Bonds 102,76.94 93,47.97
(iii) Units of mutual funds 13,20.50 13,20.50(iv) Others
- Investment in Pass Through Certificates 77,31.21 76,75.43 - Investment in Alternative Investment Fund 103,38.45 103,38.45Total 1879,27.85 2646,87.51
(` in lakhs)
* Unquoted investments disclosed at break up / fair value / NAV.(` in lakhs)
(6) Borrower group-wise classification of all leased assets, stock-on-hire and loans and advances :Category Amount net of provisions
Secured Unsecured Total1. Related Parties**
a Subsidiaries 0.20 12.02 12.22b Companies in the same group 4,45.22 29.07 4,74.29c Other related parties – – –
2. Other than related parties 27110,93.85 238,37.25 27349,31.10Total 27115,39.27 238,78.34 27354,17.61
(` in lakhs)(7) Investor group-wise classification of all investments (current and long term) in shares and securities
(both quoted and unquoted):Category Market Value / Break
up or fair value or NAVBook Value (Net of
Provisions)1. Related Parties**
a Subsidiaries 552,29.98 208,19.21b Companies in the same group 1307,12.23 875,73.60c Other related parties - -
2. Other than related parties 787,45.30 782,40.17Total 2646,87.51 1866,32.98
** As per Ind AS(` in lakhs)
(8) Other InformationParticulars Amount
(i) Stage III assetsa Related Parties –b Other than related parties 366,96.57
(ii) Stage III assets (Net of ECL)a Related Parties –b Other than related parties 228,60.28
(iii) Assets acquired in satisfaction of debt (during the year) 1,20.32Note: All figures in this schedule are based on Ind AS financial statements.

Annual Report2018-19149
Consolidated
Financial
Statements

Sundaram Finance Limited
150
S Viji S Prasad Chairman Director
T T Srinivasaraghavan Harsha Viji A N Raju Managing Director Deputy Managing Director Director (Operations)
M Ramaswamy P Viswanathan Chief Financial Officer Secretary & Compliance Officer
As per our report of even date attachedFor Sundaram & SrinivasanChartered AccountantsRegistration No.004207SK SrinivasanPartnerMembership No.5809Place : ChennaiDate : 30th May, 2019
Consolidated Balance Sheet as at 31st March, 2019 (` in lakhs)
Particulars Note March 31,2019 March 31,2018 April 01,2017 ASSETS Financial Assets Cash and cash equivalents 7 150,16.77 203,40.47 176,17.42 Bank Balances 8 708,91.93 870,89.95 660,50.22 Derivative financial instruments 9 75,27.82 Receivables 10
(I) Trade receivables 44,27.90 44,53.53 27,94.16 (II) Other receivables 11.95 631,44.32 411,18.27
Loans 11 27272,33.93 22003,85.86 15608,51.81 Investments 12 4539,31.63 8693,09.22 6546,73.52 Other Financial assets 13 18,49.04 121,61.01 106,32.67 Non-Financial Assets Current tax assets (Net) 14 159,53.00 304,95.59 227,23.51 Investment Property 15 57,03.42 47,88.05 47,91.13 Property, Plant and Equipment 16 244,19.19 268,84.71 316,13.61 Capital work-in-progress – 3.56 5.79 Intangible assets under development 17 – 3,15.91 2,52.91 Goodwill 137,61.82 491,44.05 491,44.05 Other intangible assets 17 12,58.20 12,56.65 17,96.47 Other non-financial assets 18 250,96.67 288,28.22 189,91.37 Total Assets 33670,83.27 33986,01.10 24830,56.91 LIABILITIES AND EQUITY Liabilities Financial Liabilities Derivative financial instruments 9 – 12,56.21 48,66.72 Payables 19 (I) Trade Payables (i) Total outstanding dues of micro enterprises and small enterprises 85.84 – – (ii) Total outstanding dues of creditors other than micro enterprises and small enterprises 103,09.57 98,61.53 108,52.98 (II) Other Payables (i) Total outstanding dues of micro enterprises and small enterprises – – – (ii) Total outstanding dues of creditors other than micro enterprises and small enterprises 8,46.47 4002,37.47 3205,74.13 Debt securities 20 10479,53.29 9190,69.27 9521,49.17 Borrowings (Other than debt securities) 21 9744,20.77 7704,13.72 1305,62.55 Deposits 22 3064,03.94 2579,08.80 2484,44.77 Subordinated liabilities 23 1725,16.68 1594,68.96 890,11.37 Deferred tax liabilities 20,92.67 39,11.34 23,80.85 Other financial liabilities 24 432,92.59 651,72.99 590,82.55 Non-Financial Liabilities
Provisions 25 64,53.03 101,97.52 63,33.83 Other non-financial liabilities 26 28,87.57 54,71.65 100,98.08
Equity Equity share capital 27 110,14.29 110,12.44 110,11.00 Other equity (Refer Statement of Changes in equity) 6149,15.13 5539,12.10 4744,03.41 Non Controlling Interest 1738,91.43 2307,07.10 1632,85.50
Total Liabilities and Equity 33670,83.27 33986,01.10 24830,56.91Significant Accounting policies and Impact of First time adoption of Ind AS 1-6Balance sheet, Statement of Profit and Loss and Other disclosures 7-44

Annual Report2018-19
Consolidated Financial Statements
151
Consolidated Statement of Profit and Loss for the Year Ended 31st March, 2019
S Viji S Prasad Chairman Director
T T Srinivasaraghavan Harsha Viji A N Raju Managing Director Deputy Managing Director Director (Operations)
M Ramaswamy P Viswanathan Chief Financial Officer Secretary & Compliance Officer
As per our report of even date attachedFor Sundaram & SrinivasanChartered AccountantsRegistration No.004207SK SrinivasanPartnerMembership No.5809Place : ChennaiDate : 30th May, 2019
(` in lakhs)Particulars Note 2018-19 2017-18
Revenue from operations Interest Income 28 2941,42.59 2669,00.96Insurance Premium earned – 2818,45.04Lease Rental income (Net) 56,80.46 74,23.70Fees and Commission Income 29 222,02.24 179,64.34Dividend Income 22,83.11 19,43.90Income from other Services 399,89.29 406,56.49Recovery of Bad debts 21,72.26 18,67.25Net gain on fair value changes 30 98,38.35 94,21.43 Net gain on derecognition of financial instruments under amortised cost category 6,10.61 9,51.84Total Revenue from operations 3769,18.91 6289,74.96Other Income 31 19,04.93 54,27.39Total Income 3788,23.84 6344,02.35
Expenses Finance cost 32 1766,35.14 1344,43.71Employee benefit expenses 33 429,13.40 513,92.09Insurance claims incurred – 2303,98.82Fees and commission expenses 153,81.73 412,46.24Administrative & other expenses 34 325,63.31 577,84.10Depreciation & amortisation 58,07.34 78,81.76Impairment on financial instruments 35 103,30.02 86,91.76Net loss on fair value changes – 11,22.52Total expenses 2836,30.94 5329,61.00Profit/(loss) before exceptional items and tax 951,92.90 1014,41.34Exceptional item 44.01 465,85.34Profit before tax 1417,78.24 1014,41.34Tax expense: Current tax 418,86.19 344,86.32MAT Credit Entitlement (1,28.36) (49.89)Deferred tax (29,61.26) 3,57.79Net Profit (before adjustment for non-controlling interest) 1029,81.67 666,47.13Add: Share of Profit in Associates 107,24.44 111,77.83Add: Share of Profit in Joint Ventures 121,44.07 65,07.03Profit after Tax 1258,50.18 843,31.99Other Comprehensive Income A (i) Items that will not be reclassified to profit or loss Remeasurements of the defined benefit plans (6,74.98) (1,58.82) Equity Instruments through Other Comprehensive Income (608,70.32) 715,80.30 Share of other comprehensive income from associates & Joint Ventures using equity method (19.68) 15.81 (ii) Income tax relating to items that will not be reclassified to profit or loss 43,46.89 32,99.72
Sub-total (A) = (i)-(ii) (572,18.09) 681,37.57B (i) Items that will be reclassified to profit or loss
Change in fair value of derivative instrument 11,32.63 60.41Net gain/(loss) on debt securities measured at fair value through OCI – (61,94.25)Share of other comprehensive income from associates & Joint Ventures using equity method 3,64.64 (3,08.38)Foreign currency Translation Reserve 4,12.72 (9.20)
(ii) Income tax relating to items that will be reclassified to profit or loss (3,89.51) 21,27.18 Sub-total (B)= (i)-(ii) 15,20.48 (43,24.24)
Other Comprehensive Income (A + B) (556,97.61) 638,13.33Total Comprehensive Income for the period 701,52.57 1481,45.32Profit for the year attributable to Owners of the Company 1160,85.39 729,91.20Non-controlling interests 97,64.79 113,40.79Other Comprehensive Income for the year attributable to Owners of the Company (148,05.94) 147,95.55Non-controlling interests (408,91.67) 490,17.78Total Comprehensive Income for the year attributable to: Owners of the Company 1012,79.45 877,86.75Non-controlling interests (311,26.89) 603,58.57Earnings per equity share (on PAT) 1,05.40 66.28Basic & diluted

Sundaram Finance Limited
152
A)
Equi
ty s
hare
cap
ital
Part
icul
ars
(` in
lakh
s)Ba
lanc
e as
at 0
1st A
pril
2017
110,
11.0
0Ad
d: A
llotm
ent o
f Sha
res
by E
SOP
Tru
st to
Em
ploy
ees
1.4
4 Ba
lanc
e as
at 3
1st M
arch
, 201
811
0,12
.44
Add:
Allo
tmen
t of S
hare
s by
ESO
P T
rust
to E
mpl
oyee
s 1
.85
Bala
nce
as a
t 31s
t Mar
ch 2
019
110,
14.2
9B
) O
ther
equ
ity
( ` in
lakh
s)
Reser
ves an
d Sur
plus
Items
of O
ther C
ompr
ehen
sive I
ncom
eTo
talPa
rticu
lars
Capit
al Re
serve
Share
Opti
ons
Outst
andin
g Ac
coun
t
Statut
ory
Reser
veGe
neral
Re
serve
Retai
ned
Earn
ings
Forei
gn
Curre
ncy
Trans
lation
Re
serve
Debt
instru
ments
thr
ough
Othe
r Co
mpreh
ensiv
e Inc
ome
Equit
y ins
trume
nt thr
ough
Othe
r Co
mpreh
ensiv
e Inc
ome
Effec
tive
porti
on of
ca
sh flo
w he
dge
Total
Othe
r Eq
uity
Non
Contr
olling
Int
erest
Balan
ce as
at 0
1st A
pril
2017
15,27
.73
1,66
.61
889,8
3.46
2067
,36.82
14
23,55
.00
90.13
9,
00.27
33
6,43.3
8 47
44,03
.41
1632
,85.50
63
76,88
.90
Add/
(Les
s) :
Shar
es is
sued
by s
ubsid
iary C
ompa
ny o
n ac
coun
t of S
chem
e of A
rrang
emen
t and
Amalg
amati
on (1
,87.71
) (1
1,75.1
1)13
,62.82
71,12
.02
71,12
.02
(A) P
rofit
After
tax fo
r the
year
729,3
9.23
51.97
72
9,91.2
0 11
3,40.7
9 84
3,31.9
9 (
B) O
ther c
ompr
ehen
sive i
ncom
e:(i)
Items
that
will n
ot be
recla
ssifie
d to p
rofit
or lo
ss
Rem
easu
remen
ts of
the de
fined
bene
fit pla
ns (1
,16.65
) (1
,16.65
) 7.
86
(1,08
.79)
Ch
ange
in Fa
ir val
ue of
equit
y ins
trume
nts18
0,61.8
9 18
0,61.8
9 50
1,68.6
5 68
2,30.5
5
Share
of ot
her c
ompr
ehen
sive i
ncom
e fro
m ass
ociat
es us
ing eq
uity m
ethod
6.75
6.
75
18.75
25
.50
(ii) I
tems t
hat w
ill be
recla
ssifie
d to p
rofit
or lo
ss
Chan
ge in
fair
value
of de
rivati
ve ins
trume
nt 11
.59
11.59
32
.18
43.77
Net g
ain/(l
oss)
on Fa
ir val
ue of
debt
secur
ities
(307
4.28)
(30,7
4.28)
(9,76
.15)
(40,5
0.43)
Sh
are
of oth
er c
ompr
ehen
sive
incom
e fro
m ass
ociat
es us
ing eq
uity m
ethod
(91.3
2) (9
1.32)
(2,26
.75)
(3,18
.07)
Fo
reign
curre
ncy T
ransla
tion R
eserve
(2.44
) (2
.44)
(6.76
) (9
.20)
Total
Comp
rehe
nsive
inco
me fo
r the
year
(A)+
(B)
onaccountofSundaramFinanceEmployees'WelfareTrust
91.71
91
.71
(48.9
8) 42
.73
Divid
ends
(Inc
luding
divid
end d
istrib
ution
tax)
(86,2
8.29)
(86,2
8.29)
(86,2
8.29)
Optio
ns Gr
anted
durin
g the
year
2,76
.13
2,76
.13
2,76
.13
Cost
of sh
ares t
ransfe
rred o
n exe
rcise
of op
tion
(4.93
) (4
.93)
(4.93
)De
ferred
Emplo
yee Co
mpen
sation
Cost
(12.6
8) (1
2.68)
(12.6
8)Tra
nsfer
to ge
neral
reser
ve (1
,95.00
) (2
43,39
.02)
(245
,34.02
) (2
45,34
.02)
Trans
fer to
Statu
tory r
eserve
(106
,59.02
) (1
06,59
.02)
(106
,59.02
)Tra
nsfer
from
Share
Opti
ons O
utstan
ding a
ccou
nt 1,
95.00
1,
95.00
1,
95.00
Tra
nsfer
from
Retai
ned e
arning
s 10
6,59.0
2 24
3,39.0
2 34
9,98.0
4 34
9,98.0
4

Annual Report2018-19
Consolidated Financial Statements
153
Balan
ce as
at 3
1st M
arch
, 201
8 13
,40.02
2,
30.13
99
6,42.4
8 23
00,95
.74
1730
,05.78
1,
39.66
(2
1,74.0
0) 51
6,20.7
0 11
.59
5539
,12.09
23
07,07
.11
7846
,19.20
Ad
d: On
accou
nt of
schem
e of ar
rangem
ent an
d ama
lgama
tion
2.13
2.13
2.
13
Add
(Les
s) :
Dilut
ion o
f stak
e in
Subs
idiar
y Com
pany
(re
fer no
te no
44.01
) (1
81,03
.80)
(181
,03.80
) (2
56,87
.88)
(437
,91.69
)
(A) P
rofit
Afte
r tax
for t
he ye
ar11
59,50
.99
1,34
.39
1160
,85.38
97
,64.79
12
58,50
.17
(B) O
ther
comp
rehe
nsive
inco
me:
(i) It
ems t
hat w
ill no
t be r
eclas
sified
to pr
ofit o
r los
sRe
measu
remen
ts of
the de
fined
bene
fit pla
ns (4
,34.22
) (4
,34.22
) (2
0.47)
(4,54
.69)
Chan
ge in
Fair
value
of eq
uity i
nstru
ments
(150
,21.12
) (1
50,21
.12)
(417
,22.60
) (5
67,43
.72)
Shar
e of
oth
er c
ompr
ehen
sive
inco
me fr
om
assoc
iates
using
equit
y meth
od 20
.81
20.81
(4
0.48)
(19.6
7)
(ii) I
tems t
hat w
ill be
recla
ssifie
d to p
rofit
or lo
ssCh
ange
in fa
ir val
ue of
deriv
ative
instru
ment
6,96
.34
6,96
.34
46.78
7,
43.12
Sh
are
of o
ther
com
preh
ensiv
e in
come
from
ass
ociat
es us
ing eq
uity m
ethod
(1,77
.00)
(1,77
.00)
5,41
.64
3,64
.64
Forei
gn cu
rrenc
y Tran
slatio
n Rese
rve 1,
09.26
1,
09.26
3,
03.47
4,
12.72
To
tal Co
mpre
hens
ive in
come
for t
he ye
ar (A
)+(B
)OnaccountofSundaramFinanceEmployees'WelfareTrust
52.35
52
.35
52.35
Di
viden
ds (I
nclud
ing di
viden
d dist
ributi
on ta
x) (2
25,54
.03)
(225
,54.03
) (2
25,54
.03)
Optio
ns Gr
anted
durin
g the
year
3,44
.72
3,44
.72
3,44
.72
Cost
of sh
ares t
ransfe
rred o
n exe
rcise
of op
tion
(6.35
) (6
.35)
(6.35
)De
ferred
Emplo
yee Co
mpen
sation
Cost
(11.4
3) (1
1.43)
(11.4
3)Tra
nsfer
to ge
neral
reser
ve (2
,69.79
) (9
97,30
.12)
(999
,99.91
) (9
99,99
.91)
Trans
fer to
Statu
tory r
eserve
(225
,26.18
) (2
25,26
.18)
(225
,26.18
)Tra
nsfer
from
Share
Opti
ons O
utstan
ding a
ccou
nt 2,
69.79
2,
69.79
2,
69.79
Tra
nsfer
from
Retai
ned e
arning
s 22
5,26.1
8 99
7,30.1
2 12
22,56
.30
1222
,56.30
Ba
lance
as at
31s
t Mar
ch 2
019
13,42
.14
2,87
.28
1221
,68.66
33
00,95
.65
1256
,60.78
3,
83.30
(2
1,74.0
0) 36
4,43.4
0 7,
07.93
61
49,15
.13
1738
,91.43
78
88,06
.56
S
Viji
S Pr
asad
Chai
rman
D
irec
tor
T T
Srin
ivas
arag
hava
n H
arsh
a Vi
ji A
N Ra
ju
Man
agin
g D
irec
tor
Dep
uty
Man
agin
g D
irec
tor
Dir
ecto
r (O
pera
tions
)
M R
amas
wam
y
P Vi
swan
atha
n
Chie
f Fin
anci
al O
ffice
r
Secr
etar
y &
Com
plia
nce
Offi
cer
As p
er o
ur r
epor
t of e
ven
date
atta
ched
For
Sund
aram
& S
rini
vasa
nCh
arte
red
Acco
unta
nts
Regi
stra
tion
No.0
0420
7SK
Sri
niva
san
Part
ner
Mem
bers
hip
No.5
809
Plac
e : C
henn
aiD
ate
: 30
th M
ay, 2
019
Des
crip
tion
of n
atur
e an
d pu
rpos
e of
oth
er e
quity
:a)
Ca
pita
l Res
erve
: Rep
rese
nts
rese
rve
crea
ted
on a
ccou
nt o
f am
alga
mat
ions
and
arr
ange
men
tsb)
Sh
are
Opt
ions
Out
stan
ding
Acc
ount
: Rep
rese
nts
rese
rve
on g
rant
of o
ptio
n to
em
ploy
ees
of th
e co
mpa
ny /
grou
p co
mpa
ny u
nder
Em
ploy
ee S
tock
opt
ion
Sche
me.
c)
Gene
ral r
eser
ve: R
epre
sent
s am
ount
app
ropr
iate
d fr
om r
etai
ned
earn
ings
.d)
St
atut
ory
rese
rve:
Rep
rese
nts
rese
rve
crea
ted
as p
er S
ectio
n 45
-IC
of th
e Re
serv
e Ba
nk o
f Ind
ia A
ct, 1
934.

Sundaram Finance Limited
154
(` in lakhs)Consolidated Cash Flow Statement
2018-19 2017-18
A. CASH FLOW FROM OPERATING ACTIVITIES:
Profit before tax 1417,78.24 1014,41.34
Add: Finance costs 176,256.71 3180,34.95 1356,88.87 2371,30.21
Depreciation and Amortisation expense 58,07.35 78,81.76
Impairment on financial instruments 107,33.14 86,48.36
(Gain)/loss on sale of property, plant and equipment 6,64.81 5,54.17
Share-based payment expense 2,85.73 3,12.46
Net foreign exchange differences 1,35.53 51.02
Derivatives MTM (76,13.89) (35,59.96)
Exchange loss on foreign currency translations 80,11.55 31,66.29
Interest Income (0.21) (293,27.81)
On scheme of amalgamation 5,97.05 –
Fair value adjustment of Investments (13,24.13) 2,39.30
Net Actuarial gain/(loss) on defined benefit plan (17.44) (10.79)
Dividend income 43,41.24 31,42.90
(Gain) / Loss on disinvestment of shares - Exceptional item (465,85.34) –
(Gain) / Loss on sale of Investment (12,81.86) (48,85.45)
OPERATING PROFIT BEFORE WORKING CAPITAL CHANGES 2917,88.47 2233,42.45
(Increase)/ Decrease in Leased assets - net of sales (32,96.04) 3,54.12
(Increase)/ Decrease in Bank deposits 192,17.76 (306,92.15)
(Increase)/ Decrease in SLR Investments (net) (60,61.37) (26,60.01)
(Increase)/ Decrease in trade and other receivables (1,28.62) (20,33.69)
(Increase)/ Decrease in Loans (5371,14.26) (6483,04.98)
(Increase)/ Decrease in Other financial assets 35,21.42 79,26.59
(Increase)/ Decrease in Other non-financial assets 8,24.28 (161,53.23)
Increase/ (Decrease) in trade and other payables 4,96.62 269,83.57
Increase/(Decrease) in financial liabilities (78,97.51) (77,17.30)
Increase/(Decrease) in other non-financial liabilities and provisions (10,69.45) (5315,07.18) 367,38.59 (6355,58.49)
Cash generated from Operations (2397,18.70) (4122,16.03)
Financial costs (1423,41.15) (1074,58.48)
Direct Taxes Paid (377,62.19) (1801,03.34) (349,99.33) (1424,57.81)
NET CASH FROM OPERATING ACTIVITIES (A) (4198,22.04) (5546,73.85)

Annual Report2018-19
Consolidated Financial Statements
155
Consolidated Cash Flow Statement (Contd.)(` in lakhs)
B. CASH FLOW FROM INVESTING ACTIVITIES:
Purchase and construction of property, plant and equipment (29,12.83) (34,10.59)
Purchase and construction of investment properties (9,79.10) –
Purchase and generation of intangible assets (9,33.98) (5,61.84)
Sale of Equity instruments 973,22.69 (226,45.50)
Purchase of other investments (8271,76.43) (11641,84.41)
Sale of other investments 8305,36.05 10430,40.59
Proceeds from sale of property, plant and equipment, intangible assets
and investment property
6,91.65 3,16.54
Dividend income/Interest 34,85.30 292,58.94
NET CASH FROM INVESTING ACTIVITIES (B) 1000,33.35 (1181,86.27)
C. CASH FLOW FROM FINANCING ACTIVITIES:
Increase / (decrease) Debt securities, deposits, sub-ordinated liabilities
and other borrowings
Availment 27980,71.58 28621,76.70
Repayment (24504,84.64) (22063,68.95)
Dividend Paid (including dividend distribution tax) (265,65.28) (86,38.06)
Transaction costs related to loans and borrowings (5.76) (11.52)
Increase in Share capital /premium – 295,00.00
Interest Expense – (10,75.00)
NET CASH FROM FINANCING ACTIVITIES (C) 3210,15.90 6755,83.17
NET INCREASE IN CASH AND CASH EQUIVALENTS (A)+(B)+(C) 12,27.20 27,23.05
CASH AND CASH EQUIVALENTS AT THE BEGINNING OF THE YEAR 137,89.57 176,17.42
CASH AND CASH EQUIVALENTS AT THE END OF THE YEAR 150,16.77 203,40.47
COMPONENTS OF CASH AND CASH EQUIVALENTS
AT THE END OF THE YEAR
Balances with Banks 68,43.53 131,01.69
Cash, Cheques & drafts on hand 81,73.24 72,38.78
150,16.77 203,40.47
S Viji S Prasad Chairman Director
T T Srinivasaraghavan Harsha Viji A N Raju Managing Director Deputy Managing Director Director (Operations)
M Ramaswamy P Viswanathan Chief Financial Officer Secretary & Compliance Officer
As per our report of even date attachedFor Sundaram & SrinivasanChartered AccountantsRegistration No.004207SK SrinivasanPartnerMembership No.5809Place : ChennaiDate : 30th May, 2019

Sundaram Finance Limited
156
Note 1: SIGNIFICANT ACCOUNTING POLICIES AND IMPACT OF FIRST TIME ADOPTION OF INDIAN ACCOUNTING STANDARDS
1.1 Reporting Entity
Sundaram Finance Limited (the “Company”) is domiciled
in India, with its registered office located at No 21 Patullous
road, Chennai 600002, The Company has been incorporated
under the provisions of the Indian Companies Act 1913 and
its equity shares are listed on the National Stock Exchange
(NSE) in India.
The consolidated financial statement comprises the
company, its subsidiaries and the Group’s interest in joint
ventures (referred collectively as the Group). The Company,
together with its subsidiaries and joint venture is engaged
in the business of financing of Commercial vehicles, Cars,
construction equipment, other vehicles and Housing Finance
in the retail segment, business of Investments, Mutual Funds,
General Insurance, Retail Distribution of a wide array of
financial services and products, Information Technology,
Business Processing and support services.
1.2 Statement of Compliance
The financial statements have been prepared on a going
concern basis and for the first time in accordance with
the Indian Accounting Standard (‘Ind AS’), notified under
section 133 of the Companies Act, 2013 read together with
Rule 3 of the Companies (Indian Accounting Standards)
Rules, 2015 and Companies (Indian Accounting Standards)
amendments Rules, 2016 issued by the Ministry of Corporate
Affairs (MCA). The financial statement of the previous year
ended 31st March 2018 which was previously prepared in
accordance with the accounting standards notified under
section 133 of the Companies Act 2013, read together with
para 7 of the Companies(Accounts) rules 2014(herein
referred to as Previous GAAP) have been now restated as
per Ind AS to provide comparability. The date of transition
to Ind AS being 1st April 2017, the financial statements for
the year ended 31st March 2017 prepared under Previous
GAAP has now been restated as per Ind AS as on 01st April
2017.
In addition, the guidance notes and announcements issued
by the Institute of Chartered Accountants of India are also
applied, except where the compliance with other statutory
provisions requires different treatment.
All the amounts included in Consolidated Financial Statements
are reported in Indian Rupees (`) and all values are rounded
off to the nearest lakhs except where otherwise indicated.
1.3 Accounting Convention
The consolidated financial statements have been prepared
and presented on the historical cost basis except for certain
financial instruments that are measured at fair value at the
end of each reporting period. Historical cost is generally
based on the fair value of the consideration given in exchange
of goods and services.
1.4 Measurement of fair value
The accounting policies and disclosures require the
measurement of financial and non-financial assets and
liabilities at fair values. The group has established policies
and procedures with respect to measurement of fair values.
Fair value measurements are categorised into different levels
in a fair value hierarchy based on the inputs used in the
valuation techniques as follows:
Level 1: Quoted prices (unadjusted) in active markets for
identical assets and liabilities.
Level 2: Inputs other than quoted prices included in Level
1, which are observable for the asset or liability,
either directly or indirectly.
Level 3: Inputs for the asset and liability that are not based
on observable market data.
1.5 Basis of Consolidation The financial statements of the following subsidiary have
been consolidated as per Ind AS 110 “Consolidated Financial
Statements”
Notes to the Consolidated Financial Statements

Annual Report2018-19
Consolidated Financial Statements
157
Name of the Company
% of Holdings As On
31.03.2019 31.03.2018 01.04.2017
Sundaram Asset Management Company#
100.00 100.00 100.00
Sundaram Trustee Company
100.00 100.00 100.00
LGF Services Limited 100.00 100.00 100.00
Royal Sundaram General Insurance Company Limited (till 22nd February 2019)
Joint Venture
75.90 75.90
Sundaram Finance EmployeeWelfareTrust
100.00 100.00 100.00
Sundaram Finance Holdings Limited *
26.47 26.47 26.47
# The investments in the following subsidiaries of Sundaram Asset
Management Company (SAMC) have been considered for the
Company’s consolidation
Name of the
Company
% of Holdings As On
31.03.2019 31.03.2018 01.04.2017
Sundaram Asset
Management Singapore
Pte Ltd
100.00 100.00 100.00
Sundaram Alternate
Assets Limited
100.00 100.00 –
*Sundaram Finance Holdings Limited
The Company along with its promoters holds more than 53.34 % in
Sundaram Finance Holdings Limited and hence treated as subsidiary
for Consolidation purpose. The Investments in the following
subsidiaries/ Associates companies of Sundaram Finance Holdings
Limited have been considered for the company’s consolidation.
NOTES TO THE CONSOLIDATED FINANCIAL STATEMENTS (Contd.)
Name of the
Company
% of Holdings As On
31.03.2019 31.03.2018 01.04.2017
Subsidiaries
Sundaram Business
Services Limited
100.00 100.00 100.00
Sundaram BPO India
Limited
– 100.00 100.00
Associates
Flometallic India
Private Limited
40.63 40.63 40.63
The Dunes Oman LLC
(FZC)
43.69 43.69 43.69
Sundaram Hydraulics
Limited
27.44 31.25 31.25
Axles India Limited 38.81 38.81 38.81
Turbo Energy Private
Limited
32.00 32.00 32.00
Transenergy Limited 42.31 42.31 42.31
Sundaram Dynacast
Private Limited
26.00 26.00 26.00
The investment in the following Joint Ventures have been consolidated
as per Ind AS 28” Investment in Associates and Joint Ventures”.
% of Holdings As On
Name of the Company 31.03.2019 31.03.2018 01.04.2017
Sundaram BNP Paribas
Home Finance Limited
50.10 50.10 50.10
Sundaram BNP Paribas
Fund Services Limited
51.00 51.00 51.00
Royal Sundaram General
Insurance Company
Limited (From 23rd
February 2019)
50.00 Subsidiary Subsidiary
The consolidated financial statement of the subsidiaries
has been prepared on the following basis:
The consolidated financial statements incorporate the financial
statements of the Company and the entities controlled by the
Company. Control is achieved when the Company has the power

Sundaram Finance Limited
158
NOTES TO THE CONSOLIDATED FINANCIAL STATEMENTS (Contd.)
over the investee and is exposed or has right to variable returns
from its involvement with the investee and has the ability to use its
power to affect its returns.
The consolidated financial statement of the group combines the
financial statement of the parent and its subsidiaries line by line by
adding together the like items of the assets, liabilities, income and
expenses. All the intra group assets, liabilities, income, expenses,
unrealised profits/losses on intra group transaction are eliminated
on consolidation.
Non-controlling interest represents that part of the total
comprehensive income and net assets of the subsidiaries,
attributable to interests which are not owned directly or indirectly
by the Company.
The consolidated financial statements of the Joint ventures
have been prepared on the following basis:
Interest in Joint ventures is accounted for using the equity method.
An investment in Joint venture is initially recognised at cost and
adjusted thereafter to recognise the Group’s share of profit or loss
and other comprehensive income. Gain or loss in respect of changes
in other equity of Joint ventures resulting in dilution of stake in the
Joint Ventures is recognised in the Statement of Profit and Loss.
Note 2 : Significant Accounting Policies
2.1 Revenue recognition
Revenue is recognized when it is probable that economic
benefits associated with a transaction flows to the Company
in the ordinary course of its activities and the amount of
revenue can be measured reliably. Revenue is measured at
the fair value of the consideration received or receivable,
taking into account contractually defined terms of payment.
A) Interest Income
As per Ind AS 109, Financial Instruments, Interest income
from financial assets is recognised on an accrual basis using
Effective Interest Rate method (EIR). The effective interest
method is the rate that exactly discounts estimated future
cash receipts (including all fees, transaction costs and
other premiums or discounts paid or received) through
the expected life of the financial instrument to the carrying
amount on initial recognition.
B) Service income
Revenue is recognised upon transfer of control of promised
services to customer in an amount that reflects the
consideration we expect to receive as per the agreement
with the customer.
Where the performance obligation is satisfied over time
and where there is no uncertainty as to measurement or
collectability of consideration, revenue is recognised as per
the percentage of completion method.
The Company has applied revenue recognition criteria
for each distinct performance obligation in relation to
service income. The transaction price is allocated to each
performance obligation based on the standalone selling
price.
C) Fee and commission income
Fee and commission income and expense that are integral
to the effective interest rate on a financial asset or liability
are included in the effective interest rate.
D) Dividend Income
Dividend income from investments is recognized when the
right to receive payment has been established.
E) Lease income: Refer Note 2.3
F) Insurance Premium Income
• GrossPremium
Premium (net of GST) in respect of insurance contracts
(direct business) is recognized as income over the
contract period or the period of risk, whichever is
appropriate, and for instalment cases, it is recognized
on instalment due dates, after adjusting for reserve
for unexpired risk. Any subsequent revisions to or
cancellations of premiums are recognised in the year
in which they occur.
• ReinsurancePremium
Premium (net of GST) in respect of insurance contracts
(reinsurance business) is recognized as income over
the contract period or the period of risk, whichever is
appropriate, after adjusting for reserve for unexpired

Annual Report2018-19
Consolidated Financial Statements
159
NOTES TO THE CONSOLIDATED FINANCIAL STATEMENTS (Contd.)
risk. Any subsequent revisions to or cancellations
of premiums are recognised in the year in which
they occur.
G) Claims
Claims paid include claims settlement cost, comprising survey
legal and other directly attributable expenses.
Estimated liability for outstanding claims in respect of direct
business is provided on the basis of claims reported till the
end of the financial year.
The estimated liability for claims incurred but not reported
(“IBNR”) and claims incurred but not enough reported
(“IBNER”) is based on available statistical data and is
certified by the appointed actuary.
H) Reinsurance
Reinsurance premium ceded is accounted for in the year in
which the risk commences and over the period of risk in
accordance with the treaty arrangements with the reinsurers.
Unearned premium on reinsurance ceded is carried forward
to the period of risk and set off against related unearned
premium.
Premium on excess of loss reinsurance cover is accounted as
per the reinsurance arrangements. Claims recoverable from
reinsurers are accounted for in the same period as claims.
Commission on reinsurance ceded is recognised as income
during the year in which the reinsurance premium is ceded,
profit commission is accounted when due.
I) Trusteeship Fee, investment management and advisory
fees
The trusteeship fee, investment management and advisory
fee are accounted on accrual basis.
2.2 Financial instruments A financial instrument is any contract that gives rise to a
financial asset for one entity and a financial liability or
equity instrument for another entity. Financial instruments
also include derivative contracts such as foreign currency
forward contracts and cross currency swaps. Financial
assets and financial liabilities are recognized when the
Group becomes a party to the contractual provisions of the
instruments.
Financial assets and financial liabilities are initially measured
at fair value. Transaction costs that are directly attributable
to the acquisition or issue of financial assets and financial
liabilities (other than financial assets and financial liabilities
at fair value through profit or loss) are added to or deducted
from the fair value of the financial assets or financial
liabilities, as appropriate, on initial recognition. Transaction
costs directly attributable to the acquisition of financial assets
or financial liabilities measured at fair value through profit
or loss are recognised immediately in profit or loss.
Financial assets
Classification
The Group classifies its financial assets as subsequently measured
at either amortized cost or fair value depending on the Group’s
business model for managing the financial assets and the contractual
cash flow characteristics of the financial assets.
All regular way purchases or sales of financial assets are recognised
and de-recognised on a settlement date basis. Regular way
purchases or sales are purchase or sales of financial assets that
require delivery of assets within the time frame established by
regulation or convention in the market place.
At Amortised Cost
A financial asset is measured at amortised cost only if both of the
following conditions are met:
• Theassetisheldwithinabusinessmodelwhoseobjectiveis
to hold them in order to collect contractual cash flows
and
• The contractual terms of the financial asset give rise on
specified dates to cash flows that are solely payments of
principal and interest on the amount outstanding.
Such Financial assets are subsequently measured at amortised cost
using the Effective Interest rate method.
The effective interest rate method is a method of calculating the
amortised cost of a financial instrument and of allocating interest
income over the relevant period. The effective interest rate is the
rate that exactly discounts estimated future cash receipts (including

Sundaram Finance Limited
160
all fees and points paid or received that form an integral part of
the effective interest rate, transaction costs and other premiums or
discounts) through the expected life of the financial instrument, or,
where appropriate, a shorter period, to the net carrying amount on
initial recognition. The interest income, foreign exchange gains and
losses are recognized in the profit or loss. The losses arising from
impairment are recognised in the profit or loss and the amortised
cost is reduced by impairment losses.
Financial assets at fair value through other comprehensive income: (FVTOCI)
Financial assets are subsequently measured at fair value through
other comprehensive income if these financial assets are held
within a business model whose objective is achieved by both
collecting contractual cash flows and selling financial assets and
the contractual terms of financial asset give rise on specified dates
to cash flows that are solely payments of principal and interest on
principal and the interest on the principal outstanding.
Financial instrument at Fair Value through Profit and Loss (FVTPL)
Any financial instrument, which does not meet the criteria for
categorization as at amortized cost or as FVTOCI, is classified as at
FVTPL. In addition, the Group may elect to classify a debt instrument,
which otherwise meets amortized cost or FVTOCI criteria, as at
FVTPL. However, such election is allowed only if doing so reduces
or eliminates a measurement or recognition inconsistency (referred
to as ‘accounting mismatch’). Debt instruments included within
the FVTPL category are measured at fair value with all changes
recognized in the profit and loss.
Amortization Policy on Brokerage Expenses – Mutual Fund:Incurred Towards Amortized over a period of
• EquityLinkedSavingsSchemes36Months
• OpenEndedEquitySchemes-Lumpsum12Months
• OpenEndedEquitySchemes-SIP36Months
Amortization Policy on Brokerage Expenses – AIF:Brokerage is amortized in proportion to Fees charged on AUM or
Fees Charged on commitment amount as the case may be.
Equity InvestmentsAll equity investments (i.e. other than equity investments in
subsidiaries / associates / joint ventures) are designated at Fair Value
through OCI. The fair value changes on the instrument, excluding
dividends, are recognized in the OCI. There is no recycling of the
amounts from OCI to profit and loss on sale of investment.
Impairment of Financial Assets
The Group applies the Expected Credit Loss (ECL) model for
recognizing impairment losses on financial assets.
12 months ECL represents the expected default events on the
financial asset that are possible within 12 months after the
reporting date.
Where the credit risk on the financial assets has not increased
significantly since initial recognition, the loss is measured at an
amount equal to 12 months ECL.
Where the credit risk on the financial assets has increased
significantly since initial recognition, the loss is measured at an
amount equal to the lifetime expected credit loss.
Financial liabilities
All financial liabilities are subsequently measured at amortised
cost using the effective interest rate method except for financial
liabilities at FVTPL. A financial liability is classified as FVTPL if it
is held-for-trading or it is a derivative or it is designated as FVTPL
on initial recognition. Interest expense, foreign exchange gains
(losses) and any gains and losses on de-recognition are recognized
in the profit or loss.
Contract Asset and Contract Liability
Revenue in excess of invoicing is classified as contract assets while
invoicing in excess of revenue is classified as contract liability.
Value of contract Asset/liability is determined based on the time
spent on each project or on period basis for Annual maintenance
contract.
NOTES TO THE CONSOLIDATED FINANCIAL STATEMENTS (Contd.)

Annual Report2018-19
Consolidated Financial Statements
161
De-recognition of financial assets and financial liabilities
Financial asset
A financial asset or a part thereof is primarily derecognized
when:
The right to receive contractual cash flows from the asset has
expired, or
The Group has transferred its right to receive cash flows from the
asset or has assumed an obligation to pay the received cash flows
in full without material delay to a third party under a ‘pass-through’
arrangement; and either (a) the Group has transferred substantially
all the risks and rewards of the asset, or (b) the Group has neither
transferred nor retained substantially all the risks and rewards of
the asset, but has transferred control of the asset.
If the Group enters into transactions whereby it transfers assets
recognized on its balance sheet, but retains all or substantially all
of the risks and rewards of the transferred assets, the transferred
assets are not derecognized.
On derecognition of a financial asset, the difference between
the carrying amount of the asset and the consideration received
including any cumulative gain or loss accounted in OCI till now, is
recognised in profit or loss.
Financial liabilities
The Group derecognises a financial liability when its contractual
obligations are discharged or cancelled, or expired.
Offsetting of financial instruments
Financial assets and financial liabilities are offset and the net amount
is reported in the balance sheet when the Group has a legally
enforceable right to offset the recognised amounts and there is an
intention to settle on a net basis, or realise the asset and settle the
liability simultaneously.
2.3 Leases
A lease is classified at the inception of the lease as finance
or operating lease.
Leases are classified as finance leases whenever the terms
of the lease transfer substantially all the risks and rewards
incidental to ownership to the lessee. All other leases are
classified as operating leases.
A. Finance lease (as a lessor): Amount due from lessees
under finance leases are recorded in balance sheet as
receivables, being the amount equal to net investment in
lease. The net investment in lease is the gross investment in
lease less unearned finance income.
The lease income earned are recognised in the profit and
loss account based on pattern reflecting constant periodic
return on the Group’s net investment in lease.
B. Finance lease (as a lessee): The Group recognises finance
lease as an asset and liability in the balance sheet, at the
inception date fair value of the leased property or, if lower,
at the present value of the minimum lease payments.
Lease payments are accounted as finance charge in statement
of profit and loss.
At the end of every reporting period the Group determines
whether the asset has become impaired and provides for
impairment loss if necessary.
C. Operating lease (as a lessor): Assets leased out on
operating lease are recognised as an asset under Property,
Plant and equipment in the balance sheet.
Lease income from operating lease is recognised as income
onstraightlinebasisovertheleaseterm.Wheretherentals
are structured solely to increase in line with expected general
inflation to compensate for the Group’s expected inflationary
cost increases, such increases are recognised in the year in
which such benefits accrue.
D. Operating Lease (as a lessee): Operating lease payments
are recognised as expense in the profit & loss Account on
a straight-line basis over the lease term unless another
systematic basis is more representative of the time pattern
or the payments to the lessor are structured to increase in
line with the expected general inflation.
2.4 Employee Benefits Short Term Employee Benefits
Short term employee benefits for services rendered by
employees are recognized during the period when the
services are rendered.
NOTES TO THE CONSOLIDATED FINANCIAL STATEMENTS (Contd.)

Sundaram Finance Limited
162
Post-Employment Benefits Defined contribution plans
1. Superannuation
The Group contributes to the Superannuation fund,
which is administered by trustees and managed by
the Life Insurance Corporation of India (LIC). The
contributions are charged to the Statement of Profit
and Loss.
2 Employees’ Pension Scheme and Employees’ State
Insurance Scheme
The Group also contributes to a government
administered Employees’ Pension Scheme under the
Employees Provident Fund Act and to Employees’ State
Insurance Schemes on behalf of its employees.
3. Provident Fund
Contributions of the subsidiaries and associates of
the Group are made to the Government administered
Provident Fund and Employees pension scheme
under the Employees Provident Fund Act and through
Employees State Insurance scheme on behalf of its
employees. The contributions are charged to statement
of Profit and Loss.
Defined benefit plans
1. Gratuity
The Group makes an annual contribution to a Gratuity
Fund administered by trustees and managed by LIC. The
Group accounts its liability based on actuarial valuation
as at the balance sheet date using the Projected Unit
Credit method.
The change in defined benefit plan liability is split
into changes arising out of service, interest cost and
re-measurements and the change in defined benefit
plan asset is split between interest income and re-
measurements. Changes due to service cost and net
interest cost / income is recognized in the statement of
profit and loss.
Re-measurement of the net defined benefit liability/
(asset) comprising actuarial gains and losses and the
return on the plan assets (excluding amounts included
in net interest on the net defined benefit liability /asset)
are recognised in other comprehensive income.
Provident Fund
Contributions of the Company are made to the Company’s
Employees Provident Fund Trust in accordance with the
fund rules. The interest rate payable by the trust to the
beneficiaries every year is notified by the Government.
The Company has an obligation to make good the
shortfall, if any, between the return from the Investment
of the trust and the notified interest rate. The monthly
contribution made by the Company is recognised as
employee benefit expense in the Statement of Profit and
Loss.
2. Retired Medical care plan
The Post-retirement medical benefit plan provides for
reimbursement of health care costs to certain categories
of employees post their retirement. The reimbursement
is subject to an overall ceiling sanctioned based on
cadre of the employee at the time of retirement. The
plan is unfunded. Employees do not contribute to the
plan.
Other Long-Term Employee Benefits
1. Leave Encashment:
The Group contributes to a staff leave encashment
scheme managed by SBI Life Insurance Company
Limited. The Group accounts its liability based on an
actuarial valuation, as at the balance sheet date, using
the Projected Unit Credit method.
2. Employee Assured Bonus Scheme & Sick leave:
The estimated liability in respect of other long-term
benefits like Employee Assured Bonus Scheme and
entitlement of sick leave has been provided on the basis
of actuarial valuation.
NOTES TO THE CONSOLIDATED FINANCIAL STATEMENTS (Contd.)

Annual Report2018-19
Consolidated Financial Statements
163
3. Share Based Payments:
Employee Stock Options
The Group has an employee stock option scheme in
accordance with SEBI guidelines 1999. It recognises the
compensation expense relating to share based payments
in accordance with IND AS 102 - Share based payments.
The equity settled share based payments to employees is
measured at the fair value of the equity instrument at the
grant date.
The fair value determined on the grant date of equity
settled share payment is expensed on straight line basis
over the vesting period based on Group’s estimate
of equity instruments that will eventually vest with a
corresponding increase in equity. At the end of each
financial year, the Group revises its estimate of the
number of equity instruments that are expected to vest.
The impact of the revision of the original estimates, if
any, is recognised in profit and loss in such a way that
the cumulative expense reflects the revised estimate with
a corresponding adjustment to equity
The Option carries neither right to Dividend nor voting
rights.
2.5 Income Taxes Income tax expense comprises current and deferred income
tax. Income tax expense is recognized in net profit in the
Consolidated Statement of Profit and Loss except to the extent
that it relates to items recognized directly in equity, in which
case it is recognized in other comprehensive income.
a) Current income tax Current income tax for current and prior periods is
recognized at the amount expected to be paid to or
recovered from the tax authorities, using the tax rates
and tax laws that have been enacted or substantively
enacted by the Balance Sheet date. The Group offsets
current tax assets and current tax liabilities, where it
has a legally enforceable right to set off the recognized
amounts and where it intends either to settle on a net
basis, or to realize the asset and settle the liability
simultaneously.
b) Deferred income tax
Deferred income tax assets and liabilities are recognized
for all temporary differences arising between the tax
bases of assets and liabilities and their carrying amounts
in the financial statements.
Deferred income tax assets and liabilities are measured using
tax rates and tax laws that have been enacted or substantively
enacted by the Balance Sheet date and are expected to apply
to taxable income in the years in which those temporary
differences are expected to be recovered or settled. The effect
of changes in tax rates on deferred income tax assets and
liabilities is recognized as income or expense in the period
that includes the enactment or the substantive enactment
date.
A deferred income tax asset is recognized to the extent that it
is probable that future taxable profit will be available against
which the deductible temporary differences and tax losses
can be utilized.
Deferred tax assets are reviewed at each reporting date and
are reduced to the extent that it is no longer probable that
the related tax benefit will be realized.
MAT Credit Entitlement are in the form of unused tax credits
and are accordingly grouped under Deferred Tax Assets.
2.6 Property plant and equipment (PPE)
The property plant and equipment are the assets held for the
use in the supply of services.
Property, plant and equipment’s are stated in the balance
sheet at cost (net of duty/ tax credit availed) less accumulated
depreciation and accumulated impairment losses.
Cost of acquisition is inclusive of freight, non-refundable
duties & taxes and other directly attributable cost of bringing
the asset to its working condition for the intended use.
The present value of the expected cost for the decommissioning
of an asset after its use is included in the cost of the respective
asset, if the recognition criteria for a provision are met.
Freehold land is not depreciated.
NOTES TO THE CONSOLIDATED FINANCIAL STATEMENTS (Contd.)

Sundaram Finance Limited
164
An item is recognized as property plant and equipment if and
only if it is probable that future economic benefits associated
with the item will flow to the Group and its costs can be
measured reliably
Subsequent expenditure is added to the carrying amount or
recognized as separate asset, when the Group expects future
economic benefits from that item
Depreciation commences when the asset is ready for their
intended use and is recognized to write off, the cost of
assets less their residual values over their useful lives, using
the written down value method. The estimated useful lives,
residual values and depreciation method are reviewed at the
end of each reporting period, with the effect of any changes
in estimate accounted for on a prospective basis.
Estimated useful lives of the assets, based on technical
assessment, which are different in certain cases from those
prescribed in Schedule II of the Companies Act 2013, are as
follows:
(In Years)
Assets Own Operating Lease
Plant and Machinery 15 5
Computer and end user devices
7 3
Computer servers and network
10 6
Vehicles 5 4
Office equipment 3-8 –
Electrical installations 15 –
Furniture and Fixtures 3-10 –
Improvement to lease hold premises
Equally over the maximum period of the lease initially agreed upon and in case of improvement to existing leased premises, over the balance lease period
The property plant and equipment with definite life are
reviewed for impairment whenever the events or changes
indicate that their carrying value may not be recoverable
Depreciation charge for impaired assets is adjusted in future
periods in such a manner that the revised carrying amount
of the asset is allocated over its remaining useful life.
An item of the property plant equipment is derecognized
upon disposal or when no future economic benefits are
expected to arise from the continued use of asset. Any gain
or loss arising on the disposal or retirement of the item of
property plant equipment is determined as the difference
between the sale proceeds and carrying amount of the asset
andisrecognizedinprofitandloss.Whentheuseofproperty
changes from owner-occupied to investment property, the
property is reclassified as investment property at its Carrying
amount on the date of reclassification.
2.7 Investment property
Properties held to earn rental income or for capital
appreciation or both and that is not occupied by the Group
is classified as Investment Property.
It is measured initially at cost of acquisition including
transaction costs, borrowing cost and other directly
attributable cost in bringing the asset to its working condition
for its intended use.
Subsequent expenditure is capitalized to the asset carrying
amount only when it is probable that the future economic
benefit associated with the expenditure will flow to the Group.
The fair value of investment property has been determined by
property valuer, having appropriate recognized professional
qualifications and recent experience in the location and
category of the property being valued.
Depreciation is provided on written down value method
by adopting useful life prescribed under schedule II to the
Companies Act, 2013 after retaining 5% of Original cost as
residual value for Buildings. The useful life of buildings is
between 30 to 60 years
An investment property is derecognised upon disposal or
when the investment property is permanently withdrawn
from use and no future economic benefit are expected from
the disposal. Any gain or loss arising on derecognition of the
property is recognised in the statement of profit and loss in
the same period.
NOTES TO THE CONSOLIDATED FINANCIAL STATEMENTS (Contd.)

Annual Report2018-19
Consolidated Financial Statements
165
2.8 Intangible assets
Intangible assets are identified non-monetary assets without
physical existence.
Intangible assets with finite useful lives that are acquired
separately are capitalized and carried at cost less
accumulated amortization and accumulated impairment
losses. Amortization is recognized on a straight-line basis
over the estimated useful life of the asset.
Intangible assets are recognized in books only when it is
probable that future economic benefits associated with the
asset will flow to the Group and the cost can be measured
reliably.
The cost of the intangible asset shall include the purchase
price, including non-refundable duties and taxes, all the
directly attributable costs to bring the intangible to the
present location, working condition and intended use.
Intangible assets represent Computer software whose cost
is amortized over their expected useful life 2 to 5 years on a
straight-line basis.
The estimated useful life and amortization method are
reviewed at the end of each reporting period, with the effect of
any changes in estimate being accounted for on a prospective
basis.
Impairment loss, if any, is provided to the extent, the
carrying amount of assets exceeds their recoverable amount.
Recoverable amount is the higher of an assets net selling
price and the present value of estimated future cash flows
expected to arise from the continuing use of the asset and
from its disposal at the end of its useful life. The impairment
loss recognised in prior accounting period is reversed if there
has been a change in the estimate of recoverable amount.
Intangible Assets under development
Development expenditure on new products is capitalized as
intangible asset if all the following are demonstrated.
• Technicalfeasibilityofcompletingtheasset
• Intentiontocompletetheasset
• Theabilitytouseorselltheasset
• Probability that the intangible asset will generate future
economic benefits
• Availabilityoftheadequatetechnical,financialandother
resources to complete the intangible asset
• The ability to measure reliably the expenditure
attributable during the development stage
2.9 Impairment of non-financial assets
The carrying amounts of assets are reviewed at each balance
sheet date to ascertain impairment based on internal /
external factors. An impairment loss is recognized when the
carrying amount of an asset exceeds its recoverable amount.
The recoverable amount is the higher of the net selling price
of the assets and their value in use.
2.10 Foreign Currency transaction
Transactions in foreign currency are accounted at the
exchange rates prevailing on the date of the transaction.
The foreign currency borrowing being a monetary liability
is restated to INR (being the functional currency of the
group) at the prevailing rates of exchange at the end of every
reporting period with the corresponding exchange gain/
loss being recognized in profit or loss. The group enters
into forward exchange contracts, forward rate agreements,
coupon only swaps and interest rate swaps. The group
undertakes such transactions for hedging its balance sheet.
The foreign currency borrowing and derivative swaps are
treated as separate transactions.
The derivatives (swaps, forward rate agreements and forward
contracts) are classified at fair value through profit or loss
(FVTPL) under Ind AS 109, Financial Instruments with the
resultant gain or loss being taken to profit or loss.
2.11 Dividend
The final Dividend on shares is recorded as a liability on the
date of approval by the Shareholders and interim dividends
are recorded as a liability on the date of declaration by the
Company's Board of Directors
NOTES TO THE CONSOLIDATED FINANCIAL STATEMENTS (Contd.)

Sundaram Finance Limited
166
2.12 Cash flow Statement
Cash flows are reported using the indirect method, whereby
net profit after tax is adjusted for the effects of transactions
of non-cash nature, tax and any deferrals or accruals of
past or future cash receipts or payments. The cash flows are
prepared for the operating, investing and financing activities
of the group.
2.13 Provisions, Contingent Liabilities and Contingent Assets
Provisions are recognized only when the group has a present
obligation (legal or constructive) as a result of past event, and
it is probable that it is required to settle the obligation, and
a reliable estimate can be made of the amount of obligation.
The amount recognized as a provision is the best estimate
of the consideration required to settle the obligation at
the reporting date, considering the risk and uncertainties
surrounding the obligation.
Contingent liabilities
Contingent liabilities are disclosed when there is a possible
obligation arising from past events, the existence of which
will be confirmed only by the occurrence or non-occurrence
of one or more future uncertain events not wholly within the
control of the group (or)
There is a present obligation that arises from past events
where it is either not probable that an outflow of resources
will be required to settle the obligation or a reliable estimate
of the amount cannot be made.
2.14 Earnings Per Share
The basic earnings per share have been computed by
dividing the net income attributable to equity shareholders
by weighted average number of shares outstanding during
the year.
The diluted earnings per share have been computed using
weighted average number of shares adjusted for effects of
all potentially dilutive equity shares.
2.15 Operating Segments
An operating segment is a component of the Group that
engages in business activities from which it may earn
revenues and incur expenses, including revenues and
expenses that relate to transactions with any of the Group's
other components, and for which discrete financial
information is available. Operating segments are reported in
a manner consistent with the internal reporting provided to
the Chief Operating Decision Maker (CODM). The Chairman
of the Company is responsible for allocating resources
and assessing performance of the operating segments and
accordingly is identified as the CODM. The Group's CODM
reviews financial information presented, for purposes
of making operating decisions and assessing financial
performance of the Group.
Note 3: Approach on exemptions under Ind AS 101 First Time Adoption of Indian Accounting Standards (Ind AS) Mandatory exceptions adopted by the company
The group has availed the following mandatory exceptions
that are provided to the first-time adopters.
1) De recognition of financial assets and financial
liabilities
The group has opted to apply de recognition
requirements as per Ind AS 109 prospectively for
transactions on or after 1 April 2017.
2) Classification and measurement of Financial
assets
Ind AS 101 requires the entity to assess classification of
financial assets on the basis of facts and circumstances
existing as on the date of transition. Further the standard
permits measurement of financial assets accounted at
amortised cost based on the facts and circumstances
existing at the date of transition if retrospective
application is impracticable.
Accordingly, the group has determined the classification
of financial assets based on facts and circumstances
that exist on the date of transition. Measurement of
the financial assets accounted at amortised cost have
been done retrospectively except where the same is
impracticable.
NOTES TO THE CONSOLIDATED FINANCIAL STATEMENTS (Contd.)

Annual Report2018-19
Consolidated Financial Statements
167
Optional exemptions availed by the company
The group has availed the following optional exemptions
available to Ind AS upon first time adoption:
1) Share based payment transaction
The group has opted to apply the requirements of
Ind AS 102 only to the employee stock options that are
yet to be vested as at 1 April 2017.
2) Leases
The group has evaluated whether an arrangement
existing at the transition date contains a lease on the
basis of the facts and circumstances existing on the
transition date except where the effect is expected to
be immaterial.
3) Business combination
The group has elected not to apply Ind AS 103 –
Business Combinations retrospectively to past business
combinations that occurred before the transition date.
4) Deemed cost
The group has elected to measure its property plant
equipment, intangibles and investment property at the
previous GAAP carrying amounts as its deemed cost on
the date of transition to Ind AS.
5) Deemed cost of investment in subsidiaries and associate
The group has elected to measure its investment in
subsidiary and associates at the previous GAAP carrying
amounts as its deemed cost on the date of transition to
Ind AS.
Critical accounting judgments and key sources of estimation uncertainty
On assessment of the estimates made under the Previous
GAAP financial statements, the group has concluded that
there is no necessity to revise the estimates under Ind AS, as
there is no objective evidence of an error in those estimates.
However, estimates that were required under Ind AS but not
required under Previous GAAP are made by the group for
the relevant reporting dates reflecting conditions existing as
at that date.
The preparation of financial statements in accordance with
Ind AS requires use of estimates and assumptions for some
items, which might have an effect on their recognition and
measurement in the balance sheet and statement of profit
and loss. The estimates and associated assumptions are
based on historical experience and other factors that are
considered to be relevant. The actual results may differ from
these estimates. The group’s management believes that the
estimates used in preparation of the financial statements
are prudent and reasonable. Any revision to the accounting
estimates is recognized prospectively in the current and
future periods.
Note 4: Standards issued but not yet effective
The amendments to the standard that are issued but not
yet effective up to the date of issuance of the standard are
disclosed below. The Group intends to adopt these standards,
if applicable as and when it becomes effective.
The Ministry of Corporate Affairs has issued the Companies
(Indian Accounting Standard) amendments rules 2019
amending the following standards:
Ind AS116 Leases
Ind AS 116 was issued on 30th March 2019, which shall come
into force from 1st April 2019. The standard sets out the
principle for the recognition, measurement and disclosure
of leases. Principles of IND AS 116 for lessor are substantially
same. However, there is significant change in the way a lessee
shall account for leases in its books.
It provides that an entity, being a lessee, shall treat almost
all leases, except leases for short-term and leases of low
value assets, as finance leases. The entity shall recognise a
right-of-use asset and a lease liability whenever it takes any
asset on lease. The right-of-use asset shall be measured at
cost that comprises of initial value of lease liability, lease
payments made on or before the commencement of lease,
initial direct costs incurred by the entity and an initial
estimated cost of dismantling and removing the leased asset
and restoring the site on which the asset is located. The
lease liability shall be measured at the present value of the
lease payments due. The interest rate implicit in the lease
or lessee’s incremental borrowing may be used to arrive at
the present value. Subsequently, at each balance sheet date,
the right-of-use asset shall be depreciated and lease liability
NOTES TO THE CONSOLIDATED FINANCIAL STATEMENTS (Contd.)

Sundaram Finance Limited
168
shall be increased by interest amount and decreased by
amount paid. The right-of-use asset may also be measured
at revalued amount under revaluation model.
The Group is currently evaluating the impact of the new Lease
standard.
Note 5: Amendments to the Ind AS notified by Ministry of Corporate Affairs, not yet effective
Ind AS12 Income taxes
The first amendment requires an entity to create a
corresponding liability for Dividend Distribution Tax (DDT)
when it recognises a liability to pay a dividend. The liability
for DDT shall be recorded in statement of profit & loss, other
comprehensive income or equity, as the case may be.
The second amendment relates to tax consequence of an item
whose tax treatment is uncertain. Tax treatment of an item is
considered as uncertain when there is uncertainty whether
the relevant taxation authority will accept the tax treatment
of that item or not.
If there is uncertainty over tax treatment of an item an
entity should predict the resolution of the uncertainty. If it
is probable that the taxation authority will accept the tax
treatment, there will be no impact on the amount of taxable
profits/losses, tax bases, unused tax losses/credits and tax
rates. In vice-versa case, the entity shall show the effect of the
uncertainty for each uncertain tax treatment on number of
related items by using either the most likely outcome or the
expected outcome of the uncertainty. The Group is currently
evaluating the effect of this amendment.
Ind AS 109 Financial Instruments
The amendments notified to Ind AS 109 pertain to
classification of financial instruments with prepayment
feature with negative compensation. Negative compensation
arises where the terms of the contract of the financial
instrument permit the holder to make repayment or permit
the lender or issuer to put the instrument to the borrower
for repayment before the maturity at an amount less than the
unpaid amounts of principal and interest. Earlier, there was
no guidance on classification of such instruments.
According to the amendments, these types of instruments can
be classified as measured at amortised cost, or measured at
fair value through profit or loss, or measured at fair value
through other comprehensive income by the lender or issuer
if the respective conditions specified under Ind AS 109 are
satisfied
Ind AS19 “Employee Benefits”
The amendments to Ind AS 19, Employee Benefits relate
to effects of plan amendment, curtailment and settlement.
Whenanentitydeterminesthepastservicecostatthetime
of plan amendment or curtailment, it shall remeasure the
amount of net defined benefit liability/asset using the current
value of plan assets and current actuarial assumptions which
should reflect the benefits offered under the plan and plan
assets before and after the plan amendment, curtailment and
settlement.
Ind AS 28 “Long term interests in Associates and Joint
ventures”
Paragraph 14 A is inserted to clarify that an entity has to
apply Ind AS109 including its impairment requirements to
long term interests in associates or joint ventures, to which
equity method is not applied.
Ind AS 111 Joint Agreements
The amendments states that where the party that participates
in, but does not have joint control of , a joint operation
might obtain joint control of the joint operation in which the
activity of the joint operation constitutes a business defined in
Ind AS 103, in such cases previously held interest in the joint
operation are not remeasured.
IndAS103 “Business Combinations”
When a party to a joint arrangement (as defined in Ind
AS111-Joint arrangement ), obtains control of business that
is a joint operation and had rights to the assets and obligation
for the liabilities relating to that joint operation immediately
before the acquisition date, the transaction is a business
combination achieved in stages .The acquirer shall therefore
apply the requirements for a business combination achieved
in stages, including remeasuring its previously held interest
in the joint operation in the manner as prescribed as per para
42 of Ind AS 103. In doing so the acquirer shall remeasure
its entire previously held interest in joint operation.
NOTES TO THE CONSOLIDATED FINANCIAL STATEMENTS (Contd.)

Annual Report2018-19
Consolidated Financial Statements
169
Note 6: Reconciliation between Previous GAAP and Ind AS
(i) Equity reconciliation(` in lakhs)
Particulars Note 31.03.2018 01.04.2017
Equity as per Previous GAAP 4902,33.66 4809,21.00
Change in relationship of Consolidated entity (513,84.09)
Adjusted Equity as per Previous GAAP 4902,33.66 4295,36.91
On application of Effective Interest Rate method
Financial assets (a) 105,11.34 68,43.16
Financial liabilities (a) 17,86.25 14,02.06
Impact on account of Expected credit loss (b) 81,38.44 86,53.33
Fair Value of Investments (FVTOCI) 518,09.33 375,59.67
Fair Value of Financial assets / Liabilities (FVTPL) (c) 15,91.48 1,06.56
Impact on recognition of securitised loan portfolio (d) 1,55.81 –
Derecognition of Financial asset (e) 23,19.50 23,68.08
Others (f) 10,44.92 7,66.10
Tax impact on above adjustments (g) (91,75.99) (83,36.56)
Consolidation Adjustments 65,68.18 65,15.09
Equity as per Ind AS 5649,82.92 4854,14.41
(ii) Total Comprehensive income reconciliation for the year ended 31st March, 2018(` in lakhs)
Particulars Note Apr-Mar 18
Profit as per Previous GAAP 711,53.59
Adjustments increasing / (decreasing) net profit after tax as reported in the Previous GAAP:
Amortisation of net income under EIR method for financial assets (a) 36,68.17
Amortisation of expenses under EIR method for financial liabilities (a) 3,52.01
Application of Expected Credit Loss method for loan loss provisions (b) (5,15.17)
Fair Value of Financial assets / Liabilities (FVTPL) (c) 6,78.82
Impact on recognition of securitised loan portfolio (d) 1,55.81
Derecognition of Financial asset (e) (5,39.24)
Remeasurement of defined benefit plans (h) (1,73.41)
Others (f) (2,81.58)
Tax adjustments on above items (g) (4,30.97)
Other Comprehensive income (Net of Taxes)
Fair Value of Investments (FVTOCI) 149,87.62
Others (1,92.07)
Consolidation Adjustments (10,76.82)
Total Comprehensive income as per Ind AS 877,86.75
NOTES TO THE CONSOLIDATED FINANCIAL STATEMENTS (Contd.)

Sundaram Finance Limited
170
(iii) Effect of Ind AS adoption on Cash flow statement for the year ended 31.03.2018 (` in lakhs)
Particulars Note no. Previous GAAP Effect of transition
to Ind AS
Ind AS
Net Cash flow from operating activities (a), (c), (d),
(e) & (f)
(2989,41.78) (2557,32.07) (5546,73.85)
Net Cash flow from investing activities (475,30.34) (706,55.93) (1181,86.27)
Net Cash flow from financing activities (a), (c), (d), (e) 3478,52.16 3277,31.01 6755,83.17
Effect of foreign exchange rates (2.71) 2.71 –
Net increase in cash and cash equivalents 13,77.33 13,45.72 27,23.05
Cash and cash equivalents at the beginning of the year 235,48.70 (59,31.28) 176,17.42
Cash and cash equivalents at the end of the year 249,26.03 (45,85.56) 203,40.47
(a) Under Ind AS, the income from financial assets are
recognised under Effective Interest Rate (EIR) method under
which the transaction costs, fee income, etc. have been
amortised over the underlying period. Similarly, financial
expenses are accounted considering the transaction cost
under EIR method. Under Previous GAAP, these were
accounted upfront.
(b) Under Ind AS, impairment loss is provided on Financial Assets
as per the expected credit loss method prescribed under
Ind AS 109, whereas under Previous GAAP the provisioning/
income deferment was made as per the RBI guidelines.
(c) Under Ind AS, certain financial assets are measured at fair
value through profit or loss (FVTPL), whereas under Previous
GAAP, the same was measured at cost / lower of cost or market
value, depending on the instrument.
(d) Under Ind AS, securitisation fails to satisfy the criteria for
de-recognition specified under Ind AS 109, whereas under
Previous GAAP, Securitised assets were derecognised in the
books. The Company has opted the above change only for the
transactions after 01.04.2017 in line Ind AS 101.
(e) Under Ind AS, the Profit on Direct assignment transactions are
accounted upfront as per Ind AS 109 whereas, under Previous
GAAP the profit on assignment were recognised over the tenor
of transaction as per RBI guidelines.
(f) Under Ind AS, Rental deposits, lease deposits and loan given
to employees at concessional rates are initially measured at
Fair value and subsequently accounted under amortization
method as per Ind AS 109 whereas as per Previous GAAP,
measuring at fair value was not required.
(g) Tax adjustments include deferred tax impact on account of
the above differences between Previous GAAP and Ind AS.
(h) Under Ind AS, re-measurements i.e Actuarial gains and losses
and the return on plan assets, excluding amount included in
the net interest expenses on the net defined benefit liability
are recognised in Other Comprehensive income instead of
profit and loss account as accounted in Previous GAAP.
The Cumulative impact of the above changes as on the transition date
is adjusted against the reserves as on 01.04.2017. The subsequent
effect of changes for the financial year 2017-18 is disclosed under
profit and loss reconciliation.
Notes to reconciliation between Previous GAAP and Ind AS
NOTES TO THE CONSOLIDATED FINANCIAL STATEMENTS (Contd.)

Annual Report2018-19
Consolidated Financial Statements
171
Note 7: Cash and cash equivalents(` in lakhs)
March 31, 2019 March 31, 2018 April 1, 2017
Cash on hand 20,65.47 15,75.13 14,52.60
Balances with Banks 68,42.05 126,29.27 101,94.74
Cheques, drafts on hand 61,09.26 61,36.07 59,70.09
TOTAL 150,16.77 203,40.47 176,17.42
Note 8: Bank Balance other than specified in Note 7 above(` in lakhs)
March 31, 2019 March 31, 2018 April 1, 2017
Unpaid dividend account 2,84.62 2,25.33 2,44.28
Balances with banks* 706,07.31 868,64.62 658,05.95
TOTAL 708,91.93 870,89.95 660,50.22
* Bank deposits include,
a) ̀ 611,58.00 lakhs (as on 31.03.2018 `601,11.00 lakhs and as on 31.03.2017 `499,97.10 lakhs) provided as collateral for assets
securitised.
b) In accordance with the Reserve Bank of India directives, the company has created a floating charge on the statutory liquid assets
comprising bank deposits of `36,50.00 lakhs (as on 31.03.2018 `12,44.00 lakhs and as on 31.03.2017 `121,72.00 lakhs) in favour
of trustees representing the deposit holders of the Company.
c) A deposit amounting to ̀ Nil (as on 31.03.2018 ̀ 0.90 lakhs and as on 31.03.2017 ̀ 0.90 lakhs) has been provided for legal purposes.
NOTES TO THE CONSOLIDATED FINANCIAL STATEMENTS (Contd.)
Note 9: Derivative Financial InstrumentsThe details of the outstanding derivative instruments and their fair values are as below;Part I (` in lakhs)
Particulars 31st March 2019 31st March 2018 1st April 2017
Notional amount
Fair Value Notional amount
Fair Value Notional amount
Fair Value
Assets Liabilities Assets Liabilities Assets Liabilities
(i) Currency derivatives:
- Currency swaps 888,05.16 64,83.33 – 1592,42.93 1,22.34 13,04.40 842,44.14 71.76 28,09.15
- Forward Contracts – – – 203,16.49 - 74.15 220,45.42 - 21,29.36
Subtotal (i) 888,05.16 64,83.33 – 1795,59.42 1,22.34 13,78.55 1062,89.56 71.76 49,38.51
(ii) Interest rate derivatives:
- Forward Rate Agreements & Interest Rate Swaps
300,00.00 10,44.49 – – – – – – –
Subtotal (ii) 300,00.00 10,44.49 – – – – – – –
Total Derivative Financial Instruments (i)+(ii)
1188,05.16 75,27.82 - 1795,59.42 1,22.34 13,78.55 1062,89.56 71.76 49,38.51

Sundaram Finance Limited
172
NOTES TO THE CONSOLIDATED FINANCIAL STATEMENTS (Contd.)
Part II - Included in above (Part I) are derivatives held for hedging and risk management purposes as follows:(` in lakhs)
Particulars 31st March 2019 31st March 2018 1st April 2017
Notional amount
Fair Value Notional amount
Fair Value Notional amount
Fair Value
Assets Liabilities Assets Liabilities Assets Liabilities
(i) Cash flow hedging:
- Interest rate derivatives
300,00.00 10,44.49 – – – – – – –
- Currency Swaps 2,47.99 – – 1,22.34 – – 71.76 –
(ii) Undesignated derivatives
888,05.16 62,35.34 – 1795,59.42 - 13,78.55 1062,89.56 – 49,38.51
Total Derivative Financial Instruments (i)+(ii)
1188,05.16 75,27.82 – 1795,59.42 1,22.34 13,78.55 1062,89.56 71.76 49,38.51
Note 10: Receivables(` in lakhs)
March 31, 2019 March 31, 2018 April 1, 2017
Trade receivables
- Secured, considered good – – –
- Unsecured, considered good 44,16.97 44,34.87 27,80.65
- Receivables which have significant increase in Credit Risk 24.71 19.84 10.59
- Receivables - credit impaired 33.89 73.55 25.59
Less: Impairment loss on the above 47.67 74.73 22.66
Sub-total - Trade receivables 44,27.90 44,53.53 27,94.16
Other receivables
- Secured, considered good
- Unsecured, considered good 11.95 22.59 4,46.85
- Reinsurance Assets – 631,21.73 406,71.42
Less: Impairment loss on the above
Sub-total - Other receivables 11.95 631,44.32 411,18.27
TOTAL 44,39.86 675,97.85 439,12.43

Annual Report2018-19
Consolidated Financial Statements
173
Note 11: Loans(` in lakhs)
March 31, 2019 March 31, 2018 April 1, 2017
Hypothecation loans # 25929,22.68 19954,02.31 12927,05.93
Net Investment in hire purchase 789,22.67 1619,81.20 2323,29.64
Term Loans 311,20.09 191,53.76 138,17.66
Advance for business assets 191,50.85 196,33.79 111,25.81
Amount retained on Assets securitised / assigned 111,90.94 140,15.47 194,18.50
Loans repayable on Demand 43,50.08 – –
Bills Purchased and Bills Discounted 16,32.28 12,60.94 6,70.17
Net investment in lease 13,53.17 15,28.11 18,90.09
Other loans @ 44,27.83 39,44.38 39,78.35
Total Loans - Gross 27450,70.60 22169,19.95 15759,36.15
Less: Impairment loss allowance 178,36.67 165,34.09 150,84.34
Total Loans - Net 27272,33.93 22003,85.86 15608,51.81
Of the above
Secured by tangible assets 27198,49.99 21921,79.33 15606,18.45
Covered by Bank/Government Guarantees 1,72.61 1,59.17 14.26
Secured by Deposits placed 3,49.71 3,67.52 3,65.38
Unsecured 246,98.29 242,13.92 149,38.07
Total Loans - Gross 27450,70.60 22169,19.95 15759,36.16
Less: Impairment loss allowance 178,36.67 165,34.09 150,84.34
Total Loans - Net 27272,33.93 22003,85.85 15608,51.82
Loans in India
Public Sector – – –
Others * 27450,70.60 22169,19.95 15759,36.16
Total Loans - Gross 27450,70.60 22169,19.95 15759,36.16
Less: Impairment loss allowance 178,36.67 165,34.09 150,84.34
Total Loans in India - Net - (A) 27272,33.93 22003,85.85 15608,51.82
Loans outside India – – –
Less: Impairment loss allowance – – –
Total Loans outside India - Net - (B) – – –
Total loans (A) + (B) 27272,33.93 22003,85.85 15608,51.82
# includes repossessed assets at market value
@ includes loans to employees and loan against deposits
* includes loans to Individuals, Sole proprietorship, Partnership, LLPs, Private and Public Limited Companies.
NOTES TO THE CONSOLIDATED FINANCIAL STATEMENTS (Contd.)

Sundaram Finance Limited
174
NOTES TO THE CONSOLIDATED FINANCIAL STATEMENTS (Contd.)Note 12: Investments (` in lakhs)
ParticularsAs at 31.03.2019 As at 31.03.2018 As at 01.04.2017
Carrying AmountMeasured as per equity methodInvestments in Equity Instruments- Joint Ventures
Royal Sundaram General Insurance Co. Limited 551,12.32 – –Sundaram BNP Paribas Home Finance Limited* 639,20.44 587,51.11 536,42.65Sundaram BNP Paribas Fund Services Limited 10,52.45 14,94.78 16,07.97
1200,85.21 602,45.89 552,50.62- Associates*
Flometallic India Private Limited 63,74.22 55,79.08 48,65.31The Dunes Oman LLC (FZC) 85,83.48 102,55.92 100,97.68Sundaram Hydraulics Limited – 1,10.54 1,20.15Axles India Limited 53,59.28 42,45.79 36,12.95Turbo Energy Private Limited 449,42.87 399,71.15 347,58.29Transenergy Limited 3,94.52 3,88.07 3,66.63Sundaram Dynacast Private Limited 11,77.13 8,31.99 7,34.01
668,31.50 613,82.54 545,55.02Total - A 1869,16.70 1216,28.43 1098,05.64
At fair value through other comprehensive income:Investment in Equity Investments 1529,38.27 2138,08.62 1422,21.68Investment in Government Securities – 1339,37.99 1154,49.77Investment in Debentures & Bonds – 2445,08.23 1891,12.95
Total - B 1529,38.27 5922,54.84 4467,84.40At fair value through profit or loss:
Investment in Equity Investments – 316,48.50 198,71.15Investment in Mutual Funds 352,69.13 454,74.68 342,69.49Investment in Alternative Investment Funds 105,12.98 141,90.12 51,15.30
Total - C 457,82.11 913,13.29 592,55.93At amortised cost:
Investment in Preference Shares – 1,53.39 2,90.61Investment in Collateralized Borrowing and Lending
Obligation
– 52,53.21 18,29.79
Investment in Government Securities 408,74.04 392,90.67 255,00.37Investment in Non-Convertible Debentures 102,76.94 – –Investment in Pass Through Certificates 77,31.21 91,91.99 29,11.04Investment in Commercial Paper 94,64.52 102,42.77 83,04.49
683,46.71 641,32.02 388,36.31Less: Allowance for Impairment loss 52.16 19.37 8.77
Total - D 682,94.55 641,12.65 388,27.54Total Investments A+B+C+D (Net of allowance for impairment loss)
4539,31.63 8693,09.22 6546,73.52
* includes goodwill amounting to `14,24.31 lakhs and Capital Reserve of `6,81.19 lakhsDuring the year the company divested 25.90% stake in Royal Sundaram General Insurance Co. Limited to Ageas Insurance International N.V., the Netherlands. Subsequent to the sale, the company holds 50% in the Equity capital of Royal Sundaram General Insurance Co. Limited, and has become a Joint Venture company with effect from 23rd February 2019.

Annual Report2018-19
Consolidated Financial Statements
175
Note 13 : Other Financial assets(` in lakhs)
March 31, 2019 March 31, 2018 April 1, 2017
Carried at amortised cost
- Security deposits 11,45.17 14,20.98 13,92.23
- Other advances 7,28.70 8,33.44 7,05.88
- Unbilled Revenue 29.61 55.62 25.55
- Balance with Terrorisim Pool – 77,64.79 67,03.17
- Due from policyholders – 11,76.35 10,65.23
Amount Receivable on Merger – –
- Due from insurers – 9,81.19 8,11.79
Less: Impairment loss on the above 54.45 71.36 71.19
TOTAL 18,49.04 121,61.01 106,32.67
NOTES TO THE CONSOLIDATED FINANCIAL STATEMENTS (Contd.)
NOTE 14: Tax ReconciliationDisclosure pursuant to Ind AS 12 "Income Taxes"(a) Major components of tax expense/(income) :
(` in lakhs)
2018-19 2017-18
(a) Profit or Loss section :
(i) Current income tax :
Current income tax expense 417,57.83 344,36.43
Tax expense of prior periods
417,57.83 344,36.43
(ii) Deferred tax :
Tax expense on origination and reversal of temporary differences (26,13.17) 1,89.81
Effect of previously unrecognised tax losses used to reduce tax expense (3,48.09) 1,67.98
(29,61.26) 3,57.79
Income tax expense reported in Profit or Loss [(i) + (ii)] 387,96.57 347,94.22
(b) Other Comprehensive Income (OCI) section :
(i) Items not to be reclassified to profit or loss in subsequent periods :
Current tax expense/(income) : (2,11.39) 32,99.82
On remeasurement of defined benefit plans – (0.09)
(ii) Items to be reclassified to profit or loss in subsequent periods :
(A) Deferred tax expense/(income) :
On MTM of cash flow hedges 37,37.09 (21,27.18)
Income tax expense reported in Other Comprehensive Income [(i) + (ii)] 35,25.70 11,72.55
Retained earnings :
Current income tax 415,46.44 377,36.16
Deferred tax 7,75.83 (17,69.39)
Income tax expense reported in retained earnings 423,22.27 359,66.77

Sundaram Finance Limited
176
b) Reconciliation of tax expense and the tax on accounting profit at applicable tax rate(` in lakhs)
2018-19 2017-18(a) Profit before tax and exceptional items 977,30.73 1035,75.92 (b) Profit on exceptional items 592,43.45 –(c) Profit before tax 1569,74.18 1035,75.92 (d) Tax on Accounting profit 339,24.22 356,29.96 (e) (i) Tax on income exempt from tax :
(A) Dividend income 18,44.78 13,85.80 (ii) Tax on expenses not tax deductible : (A) CSR expenses/Donations 1,85.28 1,20.98 (B) Expenses in relation to exempt income 2,16.12 1,27.25 (iii) Tax effect on various other items 7,01.30 (3,01.81)
(f) Total effect of tax adjustments [(i) to (iii)] (f)=(i)-(ii)+(iii) 21,44.68 8,35.76 (g) Tax on exceptional items @ 23.296% 70,17.05 –(h) Tax expense recognised during the year (h )=(d)-(f)+(g) 387,96.59 347,94.20
NOTES TO THE CONSOLIDATED FINANCIAL STATEMENTS (Contd.)
c) Reconciliation of Deferred Taxes For The Year Ended 2018-19
(` in lakhs)
Particulars 01-04-2018 Recognised
Through Profit and
Loss Account
Recognised Through
Other Comprehensive
Income
31.03.2019
Difference between Book Depreciation
and Tax depreciation
(55,78.19) (7.34) – (55,85.53)
Provisions for doubtful debts and advances (44,98.19) 3,90.96 – (41,07.23)Investments (14,36.28) (4,92.51) – (19,28.79)Hire Purchase Income 68,91.94 5,57.07 – 74,49.01 Utilisation of MAT Credit 1,11.06 Others 135,22.28 (35,20.50) (37,36.58) 62,65.20 Total 89,01.57 (29,61.26) (37,36.58) 20,92.67
For The Year Ended 2017-18(` in lakhs)
Particulars 01.04.2017 Recognised
Through Profit and
Loss Account
Recognised Through
Other Comprehensive
Income
31.03.2018
Difference between Book depreciation and
Tax depreciation
(68,87.55) (36,80.87) – (105,68.42)
Provisions for doubtful debts and advances (45,21.86) 23.68 – (44,98.19)Investments (11,64.87) (2,71.41) – (14,36.28)Hire Purchase Income 64,65.85 4,26.09 – 68,91.94 Others 84,89.27 38,60.30 11,72.54 135,22.28 Total 23,80.85 3,57.79 11,72.54 39,11.34
Note : Deferred tax impact due to dilution in control in Royal Sundaram General Insurance Co Limited - Refer Note 44.01

Annual Report2018-19
Consolidated Financial Statements
177
Note 15: Investment Property(` in lakhs)
Particulars Land Building TotalGROSS BLOCK AT DEEMED COST
As at 31.03.2017 46,38.35 1,52.79 47,91.14Additions – 76.18 76.18Deductions 45.68 6.15 51.83As at 31.03.2018 45,92.67 2,22.82 48,15.49
DEPRECIATIONUpto 31.03.2017 – – –Additions – 27.43 27.43Deductions – – –Upto 31.03.2018 – 27.43 27.43
GROSS BLOCK AT COST As at 31.03.2018 45,92.67 2,22.82 48,15.49Additions 5,46.39 4,32.71 9,79.10Deductions 40.27 0.62 40.89As at 31.03.2019 50,98.79 6,54.91 57,53.70
DEPRECIATIONUpto 31.03.2018 – 27.43 27.43Additions – 23.29 23.29Deductions – 0.44 0.44Upto 31.03.2019 – 50.28 50.28
Carrying Value as at 31.03.2019 50,98.79 6,04.63 57,03.42Carrying Value as at 31.03.2018 45,92.67 1,95.39 47,88.06Carrying Value as at 31.03.2017 46,38.35 1,52.79 47,91.14
Investment Property
The fair value measurement for all the investment property has been categorized as Level 2 based on the inputs to the valuation technique,
taking into consideration the prevailing market price of similar property/locality.
(` in lakhs)
Particulars 31.03.2019 31.03.2018 01.04.2017Fair value of the Investment property 691,88.95 682,73.33 688,93.25
Items relating to investment property recognised in Profit & Loss Account for the year ended are given below:(` in lakhs)
Particulars 2018-19 2017-18Rental income from Investment property 8,50.40 7,01.62Direct Operating expenses on properties generating rental income 60.26 50.62Direct Operating expenses on properties not generating rental income 3.85 1.38
The investment properties are freely realisable.
(` in lakhs)
Particulars 31.03.2019 31.03.2018 01.04.2017Contractual obligation to purchase, construct or develop
investment property
– 15.10 10.42
NOTES TO THE CONSOLIDATED FINANCIAL STATEMENTS (Contd.)

Sundaram Finance Limited
178
Note
16:
Pro
pert
y, P
lant
and
Equ
ipm
ent
(` in
lakh
s)Pa
rtic
ular
sFr
eeho
ld
Land
Free
hold
Bu
ildin
gsLe
aseh
old
offic
e /
Resid
entia
l Pr
emise
s
Plan
t and
M
achi
nery
&
Com
pute
rs
Furn
iture
and
Fi
xtur
esVe
hicl
esOf
fice
Equi
pmen
tAs
sets
on O
pera
ting
Le
ase
Asse
ts Ta
ken
unde
r Fi
nanc
e Le
ase
Tota
l
Plan
t and
M
achi
nery
&
Com
pute
rs
Vehi
cles
Leas
ehol
d La
nd
GROS
S BL
OCK
AT D
EEM
ED C
OST
As a
t 31.
03.2
017
42,7
1.74
18,6
3.99
16,4
7.27
23,8
9.72
6,34
.21
11,1
1.97
9,20
.19
81.9
518
653.
4939
.08
3161
3.61
Addi
tions
96
.52
30.2
43,
91.7
314
,49.
232,
16.0
66,
17.4
32,
51.8
4–
4018
.75
–70
71.8
0D
educ
tions
–76
.18
1,20
.10
64.4
25.
602,
37.6
823
.49
1.71
5370
.58
–58
99.7
6Tr
ansl
atio
n Ad
just
men
ts–
–2.
800.
430.
31–
0.26
––
–3.
80As
at 3
1.03
.201
843
,68.
26
18,
18.0
5 1
9,21
.70
37,
74.9
6 8
,44.
98
14,9
1.72
1
1,48
.80
80.
24
17,3
01.6
6 3
9.08
32
,789
.45
DEP
RECI
ATIO
NUp
to 3
1.03
.201
7–
––
––
––
––
––
Addi
tions
–88
.71
3,73
.75
9,52
.18
1,80
.70
3,32
.06
3,09
.50
4.35
42,9
2.75
–65
,34.
00D
educ
tions
––
1,20
.10
53.9
12.
4413
.32
16.8
90.
594,
24.6
5–
6,31
.90
Tran
slat
ion
Adju
stm
ents
––
1.9
0 0.
370.
15–
0.22
––
–2.
64Up
to 3
1.03
.201
8–
88.
71
2,5
5.55
8
,98.
64
1,7
8.41
3
,18.
74
2,9
2.83
3
.76
38,6
8.10
–
59,0
4.74
GRO
SS B
LOCK
AT
COST
As a
t 31.
03.2
018
43,6
8.26
18,1
8.05
19,2
1.70
37,7
4.96
8,44
.98
14,9
1.72
11,4
8.80
80.2
417
3,01
.66
39.0
832
7,89
.45
Addi
tions
2,
38.6
52,
39.3
43,
07.7
211
,75.
182,
33.9
15,
38.1
81,
87.3
96,
63.6
547
,66.
64–
83,5
0.66
Ded
uctio
ns2,
40.3
298
.15
–25
.86
10.3
91,
45.8
333
.87
59.3
040
,86.
43–
47,0
0.15
Tran
sfer
of S
hare
s - R
oyal
Su
ndar
am–
–11
,81.
1610
,03.
781,
35.6
148
.89
3,74
.79
––
–27
,44.
23
Adju
stm
ent o
n ac
coun
t of
Dem
erge
r (S
AMC)
––
11.8
95.
55–
0.55
4.10
––
–22
.09
Tran
slat
ion
Adju
stm
ents
––
1.56
0.24
0.23
–0.
16–
––
2.19
As a
t 31.
03.2
019
43,6
6.59
1
9,59
.24
10,
37.9
3 3
9,15
.19
9,3
3.12
18
,34.
63
9,2
3.59
6
,84.
59
179,
81.8
7 3
9.08
33
6,75
.83
DEP
RECI
ATIO
NUp
to 3
1.03
.201
8–
88.7
12,
55.5
589
8.64
1,78
.41
3,18
.74
2,92
.83
3.76
38,6
8.10
–59
,04.
74Ad
ditio
ns–
1,27
.39
1,48
.68
823.
001,
70.4
43,
45.2
31,
63.0
81,
54.4
733
,94.
84–
53,2
7.13
Ded
uctio
ns–
8.28
–8.
484.
3946
.87
13.7
80.
4411
,67.
66–
12,4
9.90
Tran
sfer o
f Sha
res -
Roy
al Su
ndar
am–
–2,
64.0
028
4.15
19.8
28.
591,
40.7
2–
––
7,17
.28
Adju
stm
ent o
n ac
coun
t of
Dem
erge
r (S
AMC)
––
4.62
3.49
–0.
431.
23–
––
9.77
Tran
slat
ion
Adju
stm
ents
––
1.12
0.33
0.08
–0.
19–
––
1.72
Upto
31.
03.2
019
– 2
,07.
82
1,3
6.73
1
,425
.84
3,2
4.72
6
,08.
08
3,0
0.38
1
,57.
79
60,9
5.28
–
92,
56.6
4 Ca
rryi
ng V
alue
as
at 3
1.03
.201
943
,66.
59
17,
51.4
2 9
,01.
20
2,4
89.3
5 6
,08.
40
12,2
6.55
6
,23.
21
5,2
6.80
11
8,86
.59
39.
08
244,
19.1
9Ca
rryi
ng V
alue
as
at 3
1.03
.201
843
,68.
26
17,
29.3
4 1
6,66
.15
2,8
76.3
2 6
,66.
57
11,7
2.98
8
,55.
97
76.
48
134,
33.5
6 3
9.08
26
8,84
.71
Carr
ying
Val
ue a
s at
31.
03.2
017
42,7
1.74
1
8,63
.99
16,
47.2
7 2
,389
.72
6,3
4.21
11
,11.
97
9,2
0.19
8
1.95
18
6,53
.49
39.
08
316,
13.6
1
NOTE
S TO
TH
E CO
NSO
LID
ATED
FIN
ANCI
AL S
TATE
MEN
TS (
Cont
d.)

Annual Report2018-19
Consolidated Financial Statements
179
Note 17: Other Intangibles assets and Intangible assets under development(` in lakhs)
Particulars Computer Software Total Intangibles Under
DevelopmentPurchased Self Generated
GROSS BLOCK AT DEEMED COST
As at 31.03.2017 11,82.71 6,13.76 17,96.47 2,52.91
Additions 5,83.46 1,97.10 7,80.56 2,84.02
Deductions – – – 2,21.02
As at 31.03.2018 17,66.17 8,10.86 25,77.04 3,15.91
DEPRECIATION
Upto 31.03.2017 – – – –
Additions 8,32.77 4,87.61 13,20.38 –
Deductions – – – –
Upto 31.03.2018 8,32.77 4,87.61 13,20.38 –
GROSS BLOCK AT COST
As at 31.03.2018 17,66.17 8,10.86 25,77.04 3,15.91
Additions 8,86.13 1,59.41 10,45.53 1,38.47
Deductions – – – 1,59.41
Transfer of Shares - Royal Sundaram 9,18.14 – 9,18.14 2,94.97
Adjustment on account of Demerger (SAMC) 96.82 – 96.82
As at 31.03.2019 16,37.33 9,70.27 26,07.61 –
DEPRECIATION
Upto 31.03.2018 8,32.77 4,87.61 13,20.38 –
Additions 4,31.16 82.97 5,14.13 –
Deductions – – – –
Transfer of Shares - Royal Sundaram 4,37.69 – 4,37.69 –
Adjustment on account of Demerger (SAMC) 47.41 – 47.41
Upto 31.03.2019 7,78.82 5,70.58 13,49.41 –
Carrying Value as at 31.03.2019 8,58.51 3,99.69 12,58.20 –
Carrying Value as at 31.03.2018 9,33.40 3,23.25 12,56.65 3,15.91
Carrying Value as at 31.03.2017 11,82.71 6,13.76 17,96.47 2,52.91
Note:
The Company has, with effect from 1st April 2018, revised the estimated useful life of intangible asset resulting in amortisation expenses
for the year 2018-19 being lower by `1,14.54 lacs.
NOTES TO THE CONSOLIDATED FINANCIAL STATEMENTS (Contd.)

Sundaram Finance Limited
180
Note 18: Other Non-Financial Assets(` in lakhs)
March 31, 2019 March 31, 2018 April 1, 2017
Stamp and stamp papers on hand 1,88.88 1,23.07 91.90
Mat Credit Entitlement – – 2,70.88
Prepaid expenses 195,95.59 225,36.54 145,31.66
Balances with Government authorities 51,90.82 56,10.51 37,27.15
Capital Advances 52.02 1,98.25 1,05.84
Other advances* 69.34 3,59.84 2,63.94
Total 250,96.67 288,28.22 189,91.37
* Amount paid for which goods / services are to be received.
Note 19: Payables(` in lakhs)
March 31, 2019 March 31, 2018 April 1, 2017
Trade payables
(i) Total outstanding dues of micro enterprises and small
enterprises
Outstanding Liability 85.84 – –
(ii) Total outstanding dues of creditors other than micro
enterprises and small enterprises
– – –
Dealer Balances 84,69.15 53,71.91 62,43.27
Outstanding Liability 18,40.42 44,89.62 46,09.71
Total 103,95.41 98,61.53 108,52.98
Other payables
(i) Total outstanding dues of micro enterprises and small
enterprises
– – –
(ii) Total outstanding dues of creditors other than micro
enterprises and small enterprises
– – –
Insurance Contract Liabilities – 3866,19.30 3096,79.24
Reinsurers share in insurance contracts liabilities – 21,75.08 22,47.74
Others 8,46.47 114,43.10 86,47.16
Total 8,46.47 4002,37.47 3205,74.13
NOTES TO THE CONSOLIDATED FINANCIAL STATEMENTS (Contd.)

Annual Report2018-19
Consolidated Financial Statements
181
Note 20: Debt Securities(` in lakhs)
March 31, 2019 March 31, 2018 April 1, 2017
Carried at amortised cost
Non-Convertible debentures 8739,46.43 7188,34.02 5983,41.40
Commercial paper 1740,06.86 2002,35.25 3538,07.77
Total 10479,53.29 9190,69.27 9521,49.17
Of the above
Debt securities in India 10479,53.29 9190,69.27 9521,49.17
Debt securities in outside India
Total 10479,53.29 9190,69.27 9521,49.17
The Secured Non - Convertible Debentures are secured by mortgage of immovable property ranking pari passu with charges created
in favour of the trustees and Hypothecation of specific Loan receivables / Hire purchase/ Lease agreements with a cover of 100%, as per
the terms of issue.
Note 21: Borrowings other than debt securities(` in lakhs)
March 31, 2019 March 31, 2018 April 1, 2017
Carried at amortised cost
Secured
Term Loan from banks 8629,31.33 5258,26.46 744,20.54
WorkingcapitaldemandloansandCashcredit 1114,34.27 1903,44.59 238,51.68
Unsecured
Credit facilities from banks – 541,87.50 322,51.25
Finance lease obligation 39.08 39.08 39.08
Preference Share Capital 16.09 16.09 –
Total 9744,20.77 7704,13.72 1305,62.55
Of the above
Borrowings in India 9744,20.77 7704,13.72 1305,62.55
Borrowings in Outside India – – –
Total 9744,20.77 7704,13.72 1305,62.55
The Term loans from banks are secured by hypothecation of specific assets covered by a charge on Hypothecation Loan Receivables /
Hire purchase / Lease agreements.
Working capital demand loans andcash credit are securedby a chargeonHypothecation LoanReceivables/HirePurchase / Lease
agreements, ranking pari passu, excluding assets which are specifically charged to others.
NOTES TO THE CONSOLIDATED FINANCIAL STATEMENTS (Contd.)

Sundaram Finance Limited
182
Note 22: Deposits
(` in lakhs)
March 31, 2019 March 31, 2018 April 1, 2017
Carried at amortised cost
- Public Deposits 3064,03.94 2579,08.80 2484,44.77
Total 3064,03.94 2579,08.80 2484,44.77
Note 23: Subordinated Liabilities
(` in lakhs)
March 31, 2019 March 31, 2018 April 1, 2017
Carried at amortised cost
Subordinated Non Convertible Debentures
- India 1725,16.68 1594,68.96 890,11.37
- Outside India – – –
Total 1725,16.68 1594,68.96 890,11.37
Reconciliation of movement in borrowings to cash flows from financing activities
(` in lakhs)
2018-19 2017-18
Opening Balance
Debt securities 9190,69.27 9521,49.17
Borrowings (Other than debt securities) 7704,13.72 1305,62.55
Deposits 2579,08.80 2484,44.77
Subordinated liabilities 1594,68.96 890,11.37
Total opening balance 21068,60.74 14201,67.86
a) Cash flow movements:
Proceeds from borrowings (net of repayment) 3475,86.94 6558,07.75
3475,86.94 6558,07.75
b) Non-cash movements
Difference between the amortised cost balance and principal outstanding 468,46.99 308,85.13
468,46.99 308,85.13
Closing Balance
Debt securities 10479,53.29 9190,69.27
Borrowings (Other than debt securities) 9744,20.77 7704,13.72
Deposits 3064,03.94 2579,08.80
Subordinated liabilities 1725,16.68 1594,68.96
25012,94.68 21068,60.74
NOTES TO THE CONSOLIDATED FINANCIAL STATEMENTS (Contd.)

Annual Report2018-19
Consolidated Financial Statements
183
Note 24: Other Financial liabilities
(` in lakhs)
March 31, 2019 March 31, 2018 April 1, 2017
Amounts due on assets securitised or assigned 132,07.36 192,33.46 290,71.83
Unpaid matured deposits and interest accrued thereon 35,95.25 37,91.19 45,39.46
Unpaid dividend 2,77.16 2,25.33 2,44.28
Payable to Employees 58,66.51 56,10.46 49,46.03
Other liabilities 149,36.40 105,90.99 75,73.49
Advance received from customers 54,09.91 43,36.61 59,16.82
Balances due to Agents and other Intermediaries – 20,20.90 8,45.24
Balances due to Other Insurers – 169,15.34 30,38.88
Payable on account of Merger – – –
Unclaimed amounts – 11,18.14 15,12.31
Claims approved under settlement – 13,30.57 13,94.21
Total 432,92.59 651,72.99 590,82.55
** Other liabilities include amount payable to creditors for expenses, payable to customers for security deposit received and commission
payable to non-whole time directors.
Note 25: Provisions(` in lakhs)
March 31, 2019 March 31, 2018 April 1, 2017
Provision for employee benefits 24,49.81 27,01.93 20,71.82
Provision for Other expenses^ 40,03.22 74,95.59 42,62.02
TOTAL 64,53.03 101,97.52 63,33.83
^ Provision for other expenses include provision made for legal cases / claims
Note 26: Other Non-Financial liabilities(` in lakhs)
March 31, 2019 March 31, 2018 April 1, 2017
Other Liabilities # 26,68.00 16,03.45 14,21.48
Revenue received in advance 2,19.57 19,24.16 27,85.66
Unallocated Premium – 19,44.04 58,90.94
TOTAL 28,87.57 54,71.65 100,98.08
# Others mainly include government dues, taxes payable, GST payable and salary deductions payable
NOTES TO THE CONSOLIDATED FINANCIAL STATEMENTS (Contd.)

Sundaram Finance Limited
184
Note 27: Equity Share capital(` in lakhs)
March 31, 2019 March 31, 2018 April 1, 2017
Authorised capital
27,81,00,000 Equity Shares of `10/- each 278,10.00 278,10.00
25,00,00,000 Equity Shares of `10/- each* 250,00.00
Issued and Subscribed :
11,11,03,860 Equity Shares of `10/- each fully paid up 111,10.39 111,10.39 111,10.39
Less:
9,60,960 (2018-9,79,510 and 2017- 9,93,910) Equity
Shares of `10/- each held by ESOP trust but not yet alloted
to Employees
96.10 97.95 99.39
Adjusted, Issued and Subscribed Share Capital 110,14.29 110,12.44 110,11.00
* Authorised share capital has been increased pursuant to the Scheme of Arrangement and Amalgamation
a) Reconciliation of the number of shares outstanding at the beginning and at the end of the period :
March 31, 2019 March 31, 2018 April 1, 2017
Issued and Subscribed :
Balance at the beginning of the Year 11,11,03,860 11,11,03,860 11,11,03,860
Less:SharesheldbySundaramFinanceEmployees'Welfare
Trust
9,60,960 9,79,510 9,93,910
Adjusted, Issued and Subscribed Share Capital 11,01,42,900 11,01,24,350 11,01,09,950
b) Rights, preferences and restrictions in respect of equity shares:
The Equity share holders are entitled to receive dividends as and when declared; a right to vote in proportion to holding etc.
and their rights, preferences and restrictions are governed by / in terms of their issue under the provisions of the Companies
Act, 2013.
c) No shareholder of the company holds more than 5% of the Equity shares.
NOTES TO THE CONSOLIDATED FINANCIAL STATEMENTS (Contd.)

Annual Report2018-19
Consolidated Financial Statements
185
STATEMENT OF PROFIT AND LOSS - NOTES
Note 28: Interest Income(` in lakhs)
2018-19 2017-18
On Financial assets measured at amortised cost:
Loans 2835,79.24 2288,76.70
Investments 52,39.85 31,16.24
Deposit with Banks 47,11.69 62,16.89
On Financial assets classified at Fair value through profit or loss :
Investments 6,11.81 2,03.64
On Financial assets classified at Fair value through other comprehensive income:
Investments – 284,87.49
Total 2941,42.59 2669,00.96
Note 29: Fees and Commission Income(` in lakhs)
2018-19 2017-18
Relating to
- Loans 10829.04 9142.44
- Selldown servicing fee 5828.85 6398.05
- Income from other Financial Services 5404.19 2275.39
- Trusteeship Fees 140.16 148.46
TOTAL 22202.24 17964.34
Note 30: Net gain on Fair Value Changes(` in lakhs)
2018-19 2017-18
A . Net gain on financial instruments at fair value through profit or loss
(i) On trading portfolio – –
(ii) On Financial instruments designated at fair value through profit or loss – –
B. Others
Net gain on financial instruments at fair value through profit or loss on
- Investments 22,24.46 58,61.47
- Derivatives 76,13.89 35,59.96
C. Total Net gain on fair value changes (A + B) 98,38.35 94,21.43
Of the above, fair value changes:
- Realised 19,29.77 53,78.30
- Unrealised 79,08.58 40,43.13
Total 98,38.35 94,21.43
NOTES TO THE CONSOLIDATED FINANCIAL STATEMENTS (Contd.)

Sundaram Finance Limited
186
Note 31: Other Income(` in lakhs)
2018-19 2017-18
Net gain/(loss) on
- Derecognition of property, plant and equipment 1,78.28 20.41
- Foreign currency transaction and translation (other than considered as finance cost) 44.92 1,27.86
Others
- Interest income 2,74.68 40,98.87
- Rental income 4,23.70 3,64.58
- Other non-operating income 9,83.35 8,15.66
Total 19,04.93 54,27.39
Note 32: Finance Costs(` in lakhs)
2018-19 2017-18
On Financial liabilities carried at amortised cost:
Interest on
Deposits 216,18.47 208,28.97
Term loans 519,19.06 191,17.92
Debt securities 877,53.26 810,41.55
Subordinated liabilities 145,50.40 111,25.86
Other interest expense and borrowing cost 7,93.95 23,29.41
Total 1766,35.14 1344,43.71
NOTES TO THE CONSOLIDATED FINANCIAL STATEMENTS (Contd.)

Annual Report2018-19
Consolidated Financial Statements
187
Note 35: Impairment on Financial Instruments(` in lakhs)
2018-19 2017-18
On Financial instruments measured at amortised cost:
Loans 91,02.41 80,30.67
Investments 33.57 10.59
Repossessed assets 11,59.53 4,96.77
Others 34.51 1,53.73
Total 103,30.02 86,91.76
Note 33: Employee Benefits Expenses(` in lakhs)
2018-19 2017-18
SalariesandWages 394,67.61 473,09.97
Contribution to provident and other funds 24,20.48 32,04.87
Share Based Payments to employees 2,85.73 2,26.63
Staff welfare expenses 7,39.58 6,50.62
Total 429,13.40 513,92.09
Note 34: Administrative and Other Expenses(` in lakhs)
2018-19 2017-18
Rent, taxes and energy costs 31,39.98 56,97.30
Repairs and maintenance 26,21.13 47,25.64
Communication Costs 15,97.07 26,95.65
Printing and stationery 5,22.13 9,98.94
Advertisement and publicity 5,94.50 21,46.13
Director’s fees, allowances and expenses 1,89.50 1,95.57
Auditor’s fees and expenses 1,69.81 2,05.29
Legal and Professional charges 12,31.64 11,06.11
Insurance 2,33.46 (28.66)
Outsourcing cost 76,46.37 277,21.79
Travel and conveyance 21,71.10 28,05.09
Donations 12,96.53 11,99.05
Exchange loss on foreign currency transactions and translations 80,17.17 31,85.18
Derivatives MTM (37.51) 9.82
Other expenditure 31,70.43 51,21.20
Total 325,63.31 577,84.10
NOTES TO THE CONSOLIDATED FINANCIAL STATEMENTS (Contd.)

Sundaram Finance Limited
188
Note 36: Capital Management:
The Group’s capital management strategy is to ensure that it has sufficient capital for business operations, strategic investment, regulatory
requirements and to provide reasonable return to the shareholders. Equity share capital and other equity are considered for Capital
management.
The Group endeavour to source diversified borrowing, depending on asset liability duration and interest rate sensitivities.
The Group monitors the Capital adequacy ratio, Debt equity ratio and Solvency ratio for the purpose of adequacy of capital.
Note 37: Revenue
Disaggregate revenue information:
Since the requirement of application of Ind AS 115 on Group’s revenue is insignificant, the Group believes that disaggregation of data about
the nature, amount, timing of our revenues is not required.
Remaining performance obligation:
The remaining performance obligation disclosure provides aggregate amount of transaction price yet to be recognised at the end of
reporting period and an explanation as to when the Group expects to recognise these amounts in revenue.
The aggregate value of performance obligations that are completely or partially unsatisfied as at March 31,2019 is `50.36 lakhs (2017-18
is `44.62 lakhs) which the Group expects to recognise in next year.
Note 38: Financial instruments – Fair value measurements
The following table shows an analysis of financial instruments recorded at fair value by level of the fair value hierarchy:
a. Financial Assets / Liabilities that are measured at Fair value through P&L /OCI(` in lakhs)
Fair Value
Hierarchy
March 31, 2019 March 31, 2018 April 1, 2017
Financial Assets
Derivatives Level 2 75,27.82 – –
Investments
Mutual Funds Level 1 352,69.13 454,74.66 342,69.49
Alternative Investment Funds Level 1 105,12.99 141,90.12 51,15.30
Equity Instruments Level 1 – 316,48.50 198,71.15
Equity Instruments Level 2 14.30 14.30 9.40
Government Securities Level 1 – 1339,37.99 1154,49.76
Debt Securities Level 2 – 2499,24.74 1943,57.97
Financial Liabilities
Derivatives Level 2 – 12,56.21 4866.72
Fair value is estimated based on the market inputs for the classification as per level 2
NOTES TO THE CONSOLIDATED FINANCIAL STATEMENTS (Contd.)

Annual Report2018-19
Consolidated Financial Statements
189
b. Equity Shares designated at Fair value through Other Comprehensive Income As on 1st April 2017, the group designated the following investments in equity shares (other than Subsidiaries, Associates and
Joint ventures) at FVTOCI, because the group intends to hold these investments for long-term strategic purpose.
(` in lakhs)
Fair Value Hierarchy March 31, 2019 March 31, 2018 April 1, 2017 * Equifax Credit Information Services Pvt. Ltd. Level 3 13,50.00 13,50.00 13,50.00* Experian Credit Information Company of India Pvt. Ltd. Level 3 11,20.00 11,20.00 11,20.00WheelsIndiaLimited Level 1 249,22.39 258,29.10 164,32.49Brakes India Private Limited Level 3 273,49.69 382,51.13 318,88.63India Motor Parts & Accessories Limited Level 1 135,93.51 160,53.58 120,77.90Sundaram Clayton Limited Level 1 744,66.64 1184,68.68 700,47.72Sundaram Investments Limited Level 3 22,15.57 22,15.57 19,83.81Lucas-TVS Limited Level 3 66,78.49 93,88.60 62,83.89Delphi TVS Diesel Systems Limited Level 3 11,21.84 10,11.71 9,16.43Techtran Polylenses Limited Level 1 – – 8.80Vishnu Forge Industries Limited Level 3 1,05.84 1,05.84 1,02.59*UMWIndustriesLimited Level 3 0.02 0.02 0.02* Senbonzakura Consultancy Private Ltd Level 3 – 0.10 –Total 1529,23.97 2137,94.32 1422,12.28
* As per Ind AS 109, Cost has been considered as the best estimate of the fair value There were no disposal of investments and `2266.26 lakhs and `1641.53 lakhs were recognised as dividends during the financial years
2018-19 and 2017-18 respectively.
c. The following table shows the carrying amounts and fair values of financial assets and financial liabilities measured at amortised cost, including their levels in the fair value hierarchy.
(` in lakhs)
Carrying amount Fair Value Hierarchy
Fair value March 31, 2019 March 31, 2018 April 1, 2017 March 31, 2019 March 31, 2018 April 1, 2017
Financial assetsCash and cash equivalents 150,16.78 203,40.47 176,17.42 Level 1 150,16.78 203,40.47 176,17.42Bank Balances 708,91.93 870,89.95 660,50.22 Level 3 711,29.59 873,42.52 668,85.85Receivables 44,39.85 675,97.85 439,12.44 Level 3 44,39.85 675,97.85 439,12.44Loans 27272,33.93 22003,85.86 15608,51.81 Level 3 26889,24.24 21844,86.97 15492,86.03Investments in Government Securities
408,51.42 392,68.05 254,77.74 Level 1 413,73.29 392,78.08 261,74.31
Investments (Others) 274,43.13 194,28.43 81,04.76 Level 3 264,66.12 193,87.45 81,24.78Other Financial assets 18,49.04 121,61.01 106,32.67 Level 3 18,48.07 121,71.23 106,46.07Total 28877,26.08 24462,71.62 17326,47.06 28491,97.94 24306,04.57 17226,46.90Financial LiabilitiesPayables 112,41.88 4100,99.00 3314,27.12 Level 3 112,41.88 4100,99.00 3314,27.12Debt Securities 10479,53.29 9190,69.27 9521,49.17 Level 3 10533,06.99 9181,33.54 9577,39.39Borrowings (Other than Debt Securities)
9744,20.76 7704,13.71 1305,62.55 Level 3 9715,02.56 7680,07.69 1377,16.48
Deposits 3064,03.94 2579,08.80 2484,44.77 Level 3 3051,73.18 2582,87.95 2502,09.25Subordinated Liabilities 1725,16.68 1594,68.96 890,11.37 Level 3 1769,52.37 1670,73.29 980,86.85Other Financial Liabilities 432,92.59 651,72.99 590,82.55 Level 3 432,41.62 654,50.47 593,38.42Total 25558,29.14 25821,32.73 18106,77.53 25614,18.60 25870,51.94 18345,17.51
Fair value is arrived at using discounted future cash flows at market rates for the classification as per level 3 hierarchy.
NOTES TO THE CONSOLIDATED FINANCIAL STATEMENTS (Contd.)

Sundaram Finance Limited
190
Note 39: Financial Risk Management framework
Risk is an inherent and integral part of the financial services business and the Group has been judiciously managing this through an efficient
risk mitigation system, with a view to achieve the Group’s stated objectives of Growth with Quality and Profitability. The risks primarily
include credit risk, liquidity risk and market risk.
The policies and procedures laid down by the Group for the purpose of risk identification, measurement and management, compare well
with contemporary best practices followed by industry peers. The various committees constituted by the respective Group’s Boards such
as Risk Management Committee, Asset Liability Management Committee, Investment Committee etc. have enunciated detailed policies for
assessment of various types of risks, and fixed tolerance limits as appropriate.
39.1 Credit Risk
Credit risk is the risk of financial loss to the Group if a customer fails to meet his contractual obligations, and arises principally from the
Group’s loan receivables.
The Group has in place a robust credit policy which clearly defines the credit filters and the terms of acceptance of proposals for financing
different categories of borrowers and asset classes. The credit appraisal process, inter alia, includes filters for stratification of customers,
compliance with Know Your Customer (KYC) norms, Field investigation, Credit bureau verification, exposure ceilings, asset risk and segment
and geography risks. The risk metrics also address Loan to Value, loan tenure, based on the useful life of the asset, end-use of the asset
and credit enhancements, as appropriate. The Group’s exposure is primarily to retail customers, thereby making for a well diversified
risk portfolio. The time tested monitoring and recovery mechanism ensures timely recovery of instalments and where required, necessary
action for resolution of delinquent accounts is initiated, including legal proceedings. Finally, physical presence and in-depth knowledge
of the markets in which the Group operates enables early identification of emerging risks thereby facilitating prompt remedial action.
Impairment - Expected Credit Loss (ECL):
The application of Ind AS 109 has necessitated fundamental changes to the accounting for expected default risk (risk provisioning).
Specifically, the incurred loss model has been replaced by the Expected Credit Loss model (ECL). Consequent to this change, the Expected
Credit Losses on financial instruments are classified under three stages.
Stage 1: Every financial asset is classified as stage 1, upon initial recognition. In addition, stage 1 contains all transactions with limited
default risk.
Stage 2: Financial assets whose default risk has risen significantly since initial recognition and which are not classified as cases with
limited default risk.
Stage 3: Financial assets that display objective evidence of impairment at the reporting date.
The accounting standard, Ind AS 109 does not specifically prescribe any methodology for computing ECL. However, entities are required
to adopt sound and market acceptable methodologies which are in line with the size, complexity and risk-profile of the financial entity for
computing the ECL. The Group uses three main components to measure ECL. These are, Exposure at Risk (EAR), Probability of Default
(PD) and Loss Given Default (LGD). Exposure at Risk (EAR) is defined as the sum of Principal outstanding and interest accrued at the
reporting date. PD is defined as the probability of borrowers defaulting on their obligations. LGD represents the economic loss, adjusted
for cure rate, as a percentage of exposure at the time of default.
Accordingly, loan assets are categorised under three different stages, as under:
Stage 1: WhereinstalmentsareCurrentand1-30daysoverdue
Stage 2: Whereinstalmentsare31-90daysoverdueand
Stage 3: Whereinstalmentsareoverduebeyond90days
NOTES TO THE CONSOLIDATED FINANCIAL STATEMENTS (Contd.)

Annual Report2018-19
Consolidated Financial Statements
191
The Group is required to provide 12-month Expected Credit Loss (12-month ECL) for stage 1 assets and the Life Time Expected Credit Loss (LECL) for stage 2 & stage 3 assets.
12-month ECL is the expected credit loss that results from default events that are possible within 12 months after the reporting date. LECL
represents the expected credit loss from default events over the expected life of a financial asset.
As prescribed under para 5.5 in Ind AS 109, 12-months PD is required to be computed for financial instruments which are in stage 1, and
life time PD for those in stage 2 & 3. 12 months PD is the likelihood of the borrower defaulting in the 12 months following the reporting
date while life time PD is the likelihood of the borrower defaulting during the residual tenor.
The PD model has been developed for all the major asset classes using a statistical and iterative approach. The design and construction
of the model involves identification of various credit parameters and variables that have a strong and direct correlation to propensity
of default. The PD model reflects to the probability of default, taking into consideration the inherent credit quality of the borrower and
the residual tenor of each contract. It relies not only historical information and the current economic environment, but also considers
forward-looking information such as the forecasts on the macroeconomic outlook, including emerging risks. The PD for stage 3 contracts
isconsideredat100%.Whereacustomerhasonecontractinstage3andoneormorecontractsinstage1/stage2,thePDforallthe
contracts is considered at 100%.
LGD
LGD represents the economic loss, adjusted for cure rate, as a percentage of exposure at the time of default. Economic loss is the estimated
shortfall in realisation of dues, in the event of default. Contracts that have turned delinquent do not necessarily involve ultimate losses,
since many of them are resolved through corrective actions. The cure rate is the probability of a ‘non performing’ (i.e. defaulted) contract
reverting to a ‘performing’ (i.e. non-default) status in a year.
Following tables provide an overview of gross carrying amount and credit loss allowance broken down into stages.
a. Loans and Advances:(` in lakhs)
Gross Carrying amount
31.03.2019 31.03.2018
Stages -> 1 2 3 Total 1 2 3 Total
Balance at the beginning of the year
21111,94.55 809,07.33 283,04.53 22204,06.42 15014,56.11 536,65.17 280,24.33 15831,45.61
New business - net of recovery
6391,59.62 (388,95.53) (52,08.19) 5950,55.90 7239,78.91 (242,40.50) (82,24.63) 6915,13.79
Trfs. due to change in creditworthiness
(971,26.45) 757,67.46 213,58.99 – (665,55.85) 514,82.66 150,73.19 –
Fin. assets that have been derecognised
645,38.49 – – 645,38.49 476,84.62 – – 476,84.62
Writeoffduringtheyear
– – 77,99.55 77,99.55 – – 65,68.36 65,68.36
Balance at the end of the year
25886,89.24 1177,79.26 366,55.78 27431,24.28 21111,94.55 809,07.33 283,04.53 22204,06.42
NOTES TO THE CONSOLIDATED FINANCIAL STATEMENTS (Contd.)

Sundaram Finance Limited
192
(` in lakhs)
Expected Credit Loss31.03.2019 31.03.2018
Stages - > 1 2 3 Total 1 2 3 TotalBalance at the beginning of the year
12,99.56 13,98.66 137,63.46 164,61.67 9,55.39 5,87.47 134,82.03 150,24.88
New business - net of recovery
15.67 9,77.39 81,66.76 91,59.83 28.31 9,41.53 70,44.88 80,14.72
Trfs. due to change in creditworthiness
5,00.06 (1,79.16) (3,20.90) – 3,25.43 (1,30.34) (1,95.09) –
Fin. assets that have been derecognised
57.44 – – 57.44 9.57 – – 9.57
Writeoffduringtheyear
– – 77,99.55 77,99.55 – – 65,68.36 65,68.36
Balance at the end of the year
17,57.85 21,96.89 138,09.77 177,64.51 12,99.56 13,98.66 137,63.46 164,61.67
Concentration of credit risk %
(i) Concentration by Geographical risk
31.03.2019 31.03.2018 01.04.2017
South 65.27 65.33 66.70
North 19.00 18.34 16.93
West 12.24 12.87 13.16
East 3.49 3.46 3.21
Total 100.00 100.00 100.00
(ii) Concentration by Asset class
31.03.2019 31.03.2018 01.04.2017
Commercial Vehicles 50.39 46.99 39.84
Cars 27.32 32.29 39.60
Construction Equipments 10.26 9.42 9.12
Tractors & Farm Equipments 5.43 5.01 4.21
Others 6.60 6.29 7.23
Total 100.00 100.00 100.00
b. Other assets The Group computes Expected credit loss on other financial assets including trade receivables based on a provision matrix which
is constructed using historical credit loss experience as adjusted to reflect current conditions.
(` in lakhs)
31.03.2019 31.03.2018 01.04.2017
Stages - > 1 2 3 Total 1 2 3 Total 1 2 3 Total
Gross carrying
amount
70,24.24 53.59 1,50.53 72,28.37 70,96.53 64.59 1,89.77 73,50.89 60,27.08 49.24 1,33.68 62,10.00
Expected Credit Loss 40.56 0.06 1,14.84 1,55.46 38.62 0.09 1,63.35 2,02.06 38.79 0.07 1,04.27 1,43.13
Net Carrying amount 69,83.69 53.53 35.69 70,72.91 70,57.91 64.50 26.42 71,48.84 59,88.29 49.17 29.41 60,66.87
c. Loan Commitments and Financial Guarantees(` in lakhs)
31.03.2019 31.03.2018 01.04.2017
Stages - > 1 2 3 Total 1 2 3 Total 1 2 3 Total
Gross carrying
amount
102,82.93 – – 102,82.93 99,88.39 – – 99,88.39 68,53.66 – – 68,53.66
Expected Credit Loss 73.60 – – 73.60 29.00 – – 29.00 15.00 – – 15.00
Net Carrying amount 102,09.33 – – 102,09.33 99,59.39 – – 99,59.39 68,38.66 – – 68,38.66
NOTES TO THE CONSOLIDATED FINANCIAL STATEMENTS (Contd.)

Annual Report2018-19
Consolidated Financial Statements
193
Credit risk management practices
(i) Policy on write off Loans are written off when the value of underlying security/other collateral is not sufficient to cover the loan exposure or where
the underlying security / customer is not traceable. In such cases, the Group takes legal recourse for recovery of shortfall of dues, if any.
(ii) Narrative description of collateral The underlying assets, which are financed, are the primary collateral held. These are typically commercial vehicles, cars,
construction equipment, farm equipment etc. Additional collateral, by way of credit enhancement, is obtained based on the management’s credit evaluation of the customer.
d. Debt Securities All debt investments are allocated to stage 1 under initial recognition. If the rating assigned to the security at the time of investment
is downgraded by two notches and / or where there is a delay in interest servicing by more than 30 days, this would result in stage 2 classification. Further downgrade of rating and/or delay in interest servicing by more than 90 days/default of payment of principal would result in stage 3 classification.
For investment in debt instruments, one-year transition matrix provided by the rating agencies is used as the PD. Loss given default (LGD) parameters assume a recovery rate of 65%, 75% and 50% for unsecured senior, unsecured subordinated and secured debt securities respectively.
A breakup of investment in debt securities into different stages is given as under:(` in lakhs)
31.03.2019 31.03.2018 01.04.2017
Gross Carrying amount Gross Carrying amount Gross Carrying amount
FVTPL FVOCI Amortised
Cost*
FVTPL FVOCI Amortised
Cost*
FVTPL FVOCI Amortised
Cost*
Government securities – – 408,51.42 – 1339,37.99 392,68.05 – 1154,49.76 254,77.74
Mutual Fund 146,36.26 – – 265,88.03 – – 273,98.66 – –
Alternative Investment Funds 103,38.45 – – 159,83.88 – – 51,01.30 – –
Pass through certificates – – 77,31.21 – – 91,91.99 – – 29,11.04
Non - Convertible Debentures – – 102,76.94 – – 102,70.93 – – 102,76.96
Commercial paper – – 47,14.12 – – 154,96.27 – – 101,35.29
Fixed Deposit – – – – – 1,54.35 – – –
Equity Instruments – – – 316,48.50 – – 198,71.15 – –
Debt Securities – – – – 2499,24.74 – – 1943,57.97 –
Total 249,74.71 – 635,73.69 742,20.41 3838,62.73 743,81.59 523,71.11 3098,07.74 488,01.03* Represents Investments under Stage 1 Category
(` in lakhs)
Expected Credit Loss
31.03.2019 31.03.2018
Stages - > 1 2 3 Total 1 2 3 Total
Balance at the beginning of the year 40.53 – – 40.53 29.65 – – 29.65
New investments - net of recovery 13.96 – – 13.96 14.36 – – 14.36
Transfers due to change in creditworthiness – – – – – – – –
Financial assets that have been derecognised 1.27 – – 1.27 3.10 – – 3.10
Writeoffduringtheyear – – – – 0.38 – – 0.38
Balance at the end of the year 53.22 – – 53.22 40.53 – – 40.53
NOTES TO THE CONSOLIDATED FINANCIAL STATEMENTS (Contd.)

Sundaram Finance Limited
194
39.2 Liquidity Risk
Liquidity risk relates to our potential inability to meet all payment obligations when they fall due or only being able to meet them
at excessive costs. The objective of the liquidity risk management framework is to ensure that the Group can fulfil its payment
obligations at all times and can manage liquidity and funding risks within its risk appetite. The Asset Liability Committee regularly
monitors the liquidity position and the duration of assets/liabilities and ensures that liquidity is strictly managed as per the policy.
Following are the contractual maturities of financial liabilities / financial assets at the reporting date. The amounts are gross and
undiscounted and include estimated interest payments / receipts and exclude the impact of netting agreements.
(` in lakhs)
Contractual Cash Flows
31st March 2019 Upto 3 months Over 3 months & upto 6 months
Over 6 months & upto 1 year
Over 1 year & upto 3 years
Over 3 years & upto 5 years
Over 5 years
Total
Non-derivative fin. liabilities
Payables 101,92.01 5,99.94 – 367.17 82.77 – 112,41.89
Debt Securities 2010,03.88 1107,47.25 2298,96.49 577904.48 36830.00 – 11563,82.10
Borrowings (Other than Debt
Securities)
870,09.32 831,98.06 5904,98.99 457463.94 15901.81 39.08 12341,11.20
Deposits 381,17.51 455,66.20 743,34.24 178691.36 – – 3367,09.31
Subordinated Liabilities 40,66.95 37,99.02 77,17.25 533,24.34 481,88.68 1518,25.71 2689,21.96
Other Financial Liabilities 417,22.13 1,92.01 2,62.50 11,46.48 5,95.68 – 439,18.80
Derivative financial liabilities
7,14.90 6,47.82 – 1,34.80 – – 14,97.52
Total 3828,26.70 2447,50.30 9027,09.47 12690,32.57 1015,98.94 1518,64.79 30527,82.78
Non-derivative financial assets
Cash and cash equivalents 150,16.78 – – – – – 150,16.78
Bank Balances 46,73.47 162,99.39 386,62.71 154,20.03 – – 750,55.60
Receivables 37,38.10 – 7,01.75 – – – 44,39.85
Loans 4262,86.95 3418,67.46 6126,74.17 14940,07.44 2814,69.75 39,09.70 31602,15.47
Investments 369,70.80 35,76.27 152,35.45 168,72.63 173,21.72 542,22.89 1441,99.76
Other Financial assets 8,45.90 32.07 5,36.32 3,33.82 1,09.47 3,93.89 22,51.48
Derivative financial assets – – 78,71.21 4,77.24 2,91.97 5,83.93 92,24.35
Total 4875,32.00 3617,75.19 6756,81.61 15271,11.16 2991,92.91 591,10.41 34104,03.29
NOTES TO THE CONSOLIDATED FINANCIAL STATEMENTS (Contd.)

Annual Report2018-19
Consolidated Financial Statements
195
(` in lakhs)
31st March 2018Contractual cash flows
Upto 3 months Over 3 months & upto 6 months
Over 6 months & upto 1 year
Over 1 year & upto 3 years
Over 3 years & upto 5 years
Over 5 years Total
Non-derivative fin. liabilitiesPayables 655,56.34 418,70.45 1872,14.53 925,84.16 463,52.83 619,17.54 4954,95.85Debt Securities 1739,86.42 576,41.65 2374,27.93 4677,51.42 672,15.07 – 10040,22.48Borrowings (Other than Debt Securities)
1373,06.38 366,70.38 3147,37.76 3093,42.23 158,58.64 39.08 8139,54.47
Deposits 318,18.26 385,83.73 626,21.61 1490,85.34 – – 2821,08.94Subordinated Liabilities 39,75.08 37,81.07 62,03.45 422,74.22 585,56.42 1410,61.66 2558,51.90Other Financial Liabilities 602,40.19 82.56 8,71.84 27,38.99 15,94.44 – 655,28.03Derivative financial liabilities 29,34.50 8,08.31 16,95.26 – – – 54,38.07Total 4758,17.17 1794,38.15 8107,72.38 10637,76.36 1895,77.40 2030,18.28 29223,99.74Non-derivative financial assetsCash and cash equivalents 203,40.47 – – – – – 203,40.47Bank Balances 103,24.41 10,98.09 578,37.07 233,09.19 – – 925,68.76Receivables 128,39.64 66,76.80 311,05.10 149,84.31 75,25.50 100,52.47 831,83.82Loans 3402,03.66 2697,54.70 4871,50.85 12058,63.91 2289,53.48 38,78.76 25358,05.36Investments 766,78.12 170,39.67 398,63.14 1701,85.29 1032,13.70 2347,27.18 6417,07.10Other Financial assets 27,64.73 1,05.25 6,40.63 7,20.88 3,23.03 80,14.12 125,68.64Derivative financial assets 9.06 85.95 – 40,19.35 – – 41,14.36Total 4631,60.09 2947,60.46 6165,96.79 14190,82.93 3400,15.71 2566,72.53 33902,88.51
(` in lakhs)
1st April 17Contractual cash flows
Upto 3 months Over 3 months & upto 6 months
Over 6 months & upto 1 year
Over 1 year & upto 3 years
Over 3 years & upto 5 years
Over 5 years Total
Non-derivative fin. liabilities
Payables 572,11.31 346,10.86 1554,91.76 760,59.61 404,19.18 446,20.72 4084,13.44
Debt Securities 1812,98.55 1102,01.60 3522,46.53 3660,57.90 167,24.65 – 10265,29.23
Borrowings (Other than Debt Securities)
9,25.95 5,40.93 719,84.41 640,58.82 – 39.08 1375,49.19
Deposits 325,60.81 415,76.52 613,01.33 1376,54.50 – – 2730,93.16
Subordinated Liabilities 11,33.48 37,83.57 32,75.74 164,15.81 386,86.34 758,66.99 1391,61.93
Other Financial Liabilities 558,65.61 97.36 50.92 29,56.86 2,42.93 – 592,13.68
Derivative financial liabilities 12,51.17 8,16.50 33,34.85 79.07 – – 54,81.59
Total 3302,46.88 1916,27.34 6476,85.54 6632,82.57 960,73.10 1205,26.79 20494,42.22Non-derivative financial assets
Cash and cash equivalents 176,17.42 – – – – – 176,17.42
Bank Balances 14,56.82 12,12.54 468,96.59 222,10.39 – – 717,76.34
Receivables 87,56.69 43,81.33 208,22.19 98,81.94 52,70.16 58,17.99 549,30.30
Loans 2523,80.73 1996,01.65 3547,23.38 8433,49.82 1734,02.19 27,07.92 18261,65.69
Investments 468,63.09 120,22.69 357,59.48 1314,43.16 773,27.31 2030,92.99 5065,08.72
Other Financial assets 25,91.69 1,03.79 4,39.54 5,96.50 2,87.57 71,76.33 111,95.42
Derivative financial assets 1.43 3.22 – 71.76 – – 76.41
Total 3296,67.87 2173,25.22 4586,41.18 10075,53.57 2562,87.23 2187,95.23 24882,70.30
NOTES TO THE CONSOLIDATED FINANCIAL STATEMENTS (Contd.)

Sundaram Finance Limited
196
39.3 Market Risk Market risk is the risk of loss arising from potential adverse changes in the value of the firm’s assets and liabilities from fluctuation
in market variables like liquidity, interest rate, foreign exchange (currency risk) and equity prices.
a. Interest rate risk The Group’s exposure to changes in interest rates relates to its investment in debt securities/outstanding floating rate liabilities. Most
oftheGroup’soutstandingliabilityinlocalcurrencyisonfixedratebasisandhencenotsubjecttointerestraterisk.Whereastheforeign currency liability is linked to international rate benchmarks like LIBOR and hence subject to interest rate risk. The Group hedges these risks by way entering into derivative transactions.
Fair value sensitivity analysis for fixed rate instruments
The Group’s fixed rate instruments which are carried at amortised cost are not measured for interest rate risk. In respect of other
instruments, the risks are measured through fair value.
Cash flow sensitivity analysis for variable rate instrumentsA reasonably possible change of 100 basis points in interest rates at the reporting date would have increased (decreased) equity and
profit or loss by the amounts shown below. This analysis assumes that all other variables, in particular foreign currency exchange rates,
remain constant.
(` in lakhs)
Profit or loss Profit or loss
100 bp increase 100 bp decrease 100 bp increase 100 bp decrease
31st March 2019 31st March 2018
Variable rate instruments (16,53.31) 16,53.31 (10,64.03) 10,64.03
Cross currency Interest Rate swap (7,83.72) 7,83.72 (6,99.14) 6,99.14
Cash flow sensitivity (net) (8,69.59) 8,69.59 (3,64.89) 3,64.89
The interest rate profile of the Group's interest bearing financial instruments is as follows:
(` in lakhs)
As at March 31, 2019 As at March 31, 2018 As at April 01, 2017Financial assetsFixed-rate instrumentsLoans 27257,94.86 21987,71.53 15591,02.30
Investments 634,69.37 4393,74.45 3432,57.17
Bank Balances 708,84.47 921,20.18 737,80.6528601,48.70 27302,66.16 19761,40.12
Variable rate instrumentsLease assets 137,66.57 150,38.15 206,25.58Total 28739,15.27 27453,04.31 19967,65.70Financial liabilitiesFixed-rate instrumentsDebt securities 12204,69.97 10839,75.08 10466,82.52
Borrowings (Other than debt securities) 4973,99.89 4531,18.86 393,39.80
Deposits 3099,99.19 2616,99.99 2529,84.2320278,69.05 17987,93.93 13390,06.55
Variable rate instrumentsFinancial liabilities with floating interest rate 4763,06.87 3159,13.48 912,01.74
25041,75.92 21147,07.41 14302,08.29
NOTES TO THE CONSOLIDATED FINANCIAL STATEMENTS (Contd.)

Annual Report2018-19
Consolidated Financial Statements
197
Interest rate sensitivity
The major lending of the Group is in the form of Hypothecation loans at fixed rates. The loans are financed by various fixed / floating Rate
borrowings.Whiletheassetsfinancedaregenerallyrecoveredoverthetenureoftheunderlyingcontractequally,theliabilitiesarein
general repayable on maturity. Hence, the interest rate risk and liquidity (mismatches in the duration of assets and liabilities) are inherent
and inevitable.
To measure the above risk in respect of lending business, the Group adopts the duration gap analysis which is measured for assets and
liabilities maturing in next 12 months as well as for the overall assets and liabilities. Also, for Interest rate risk management, the Duration
Gap model is used on assets and liabilities maturing in the next 12 months, to assess the change in Net Interest Income (NII) for a 1%
increase in interest rate. The change in NII for 1% increase in interest rate as on 31.03.2019 is ` -32.95 Cr.
b. Currency Risk The Group is exposed to currency risk to the extent that there is a mismatch between the currencies in which borrowings are
denominated and the respective functional currency, i.e. INR. The transactions of the Group are primarily denominated in INR.
i) Exposure to currency risk on account of foreign currency loans: The summary quantitative data about the Group's exposure to currency risk (based on notional amounts) as reported:
(` in lakhs)
As at March 31, 2019 As at March 31, 2018 As at April 01, 2017USD INR USD INR USD INR
Total foreign currency exposure in respect of recognised assets and liabilities
13,12.30 907,73.77 25,40.68 1652,61.98 12,50.28 810,66.16
Cross currency Interest Rate swap/ Forward exchange contracts
(13,12.30) (907,73.77) (25,40.68) (1652,61.98) (12,50.28) (810,66.16)
Net exposure – – – – – –
Sensitivity
Currency risks related to the amounts of foreign currency loans are fully hedged using derivatives that mature on the same
dates as the loans are due for repayment.
ii) Exposure to currency risk on account of Services business:
As at March 31, 2019 As at March 31, 2018
Currency Foreign Currency ` in lakhs Foreign Currency ` in lakhs
Cash and Cash Equivalents AUD 800577 3,92.44 145050 72.59
Trade Receivables AUD 1044507 5,12.01 788713 3,94.71
Trade Payable AUD 585 28.67 806 40.32
Trade Receivables SGD 8392 5.88 8392 5.53
Cash and Cash Equivalents AED 50760 11.92 50760 10.96
The foreign currency risk is mitigated by derivative contracts. The outstanding contracts as at the Balance Sheet date are as follows:
31st March 2019 31st March 2018
Buy Sell Buy Sell
Forward Contract: Cashflow Hedge
AUD/INR (in A$ '000) – 76,20.00 – 81,07.79
AUD/INR (in ` Lakhs) – 41,35.80 – 42,99.74
NOTES TO THE CONSOLIDATED FINANCIAL STATEMENTS (Contd.)

Sundaram Finance Limited
198
As at the Balance Sheet date, the group's net foreign exchange exposures that are not hedged by a derivative instrument or otherwise
is below:
GBP ` in LakhsHedged – –Unhedged 2020.75 1.83Total 2020.75 1.83
c. Equity Risk The Group has investments in listed/unlisted companies, which are measured at FVTPL and FVTOCI. The valuation is dependent
on market conditions.
Note 40: Financial Instruments - Transferred financial assets that are not derecognised in their entirety Securitisation: The Group as part of its business model periodically enters into securitisation transactions via Pass Through Certificates (PTC) route
and/or Direct Assignment (DA). As per RBI guidelines, the Group maintained credit enhancement for securitisation transactions
which covers the expected losses and thereby retains the risk associated with the assets.
(` in lakhs)
31st March 2019 31st March 2018 1st April 2017
Carrying amount of transferred assets 3646,47.50 2745,44.68 –
Carrying amount of associated liabilities 3815,13.06 2895,71.87 –
Fair value of assets 3569,13.67 2762,01.36 –
Fair value of associated liabilities 3793,57.79 2877,76.54 –
Net position at Fair value (224,44.12) (115,75.18) –
Note 41: Employee benefitsPost-employment benefits: Defined Contribution plan
(` in lakhs)
Amount recognised as expense in Employee benefit expense 2018-19 2017-18
Contribution to Provident Fund 3,76.57 2,57.87
Contribution to Pension Fund 6,36.53 6,09.04
Contribution to Superannuation Fund 2,10.67 1,84.07
Contribution to State Insurance Scheme 8.20 14.60
ContributiontoLabourWelfareFund 0.52 0.71
Total 12,32.49 10,66.29
Defined benefit plans
Defined benefit plan exposes the Group to a number of risks, the most significant of which are detailed below:
Investment risk: This may arise from volatility in Asset value due to market fluctuations and impairment of assets due to credit losses. The defined benefit plans may hold equity type assets, which may carry volatility and associated risk.
Interest risk: A decrease in bond yields will increase plan liabilities, although this is expected to be partially offset by an increase in the value of the plan's investment in debt instruments.
Salary cost Inflation risk: The present value of some of the defined benefit plan obligations are calculated with reference to the future salaries of plan participants. Increase in salary due to adverse Inflationary pressures might lead to higher liabilities.
Longevity risk: The present value of defined benefit plan obligation is calculated by reference to the best estimate of the mortality of plan participants. Increase or decrease in such rate will affect the plan liability.
NOTES TO THE CONSOLIDATED FINANCIAL STATEMENTS (Contd.)

Annual Report2018-19
Consolidated Financial Statements
199
Details of defined benefit plans as per actuarial valuation are as below: (`in lakhs)
ParticularsFUNDEDGratuity
UNFUNDEDRetired Employee Medical Scheme
31.03.2019 31.03.2018 01.04.2017 31.03.2019 31.03.2018 01.04.2017Amounts recognised in profit or loss
Current service cost 4,39.87 5,22.88Past Service cost – 84.97Net interest expense/(income) (6.42) 32.32 7.13 7.67
Total amount included in employee benefits expense 4,33.45 6,40.17 7.13 7.67Amounts recognised in other comprehensive income
Re-measurement (gains)/losses: Actuarial (gains)/losses arising from changes in- Financial assumptions 1,74.59 20.80 0.69 (0.71)- Experience adjustments 4,64.23 1,91.71 9.64 (2.58)Return on plan assets, excluding amount included in net interest expense/ (income)
21.29 (59.01)
Total amount recognised in other comprehensive income 6,60.11 1,53.50 10.33 (3.29)Changes in the defined benefit obligation
Opening defined benefit obligation 45,94.09 49,70.90 35,16.03 1,02.55 1,05.95 1,09.77Add/(less) on account of business combination/transfers – (0.59) – – – –Current service cost 4,39.87 5,22.89 3,44.65 – – –Past Service cost 42.83 1,23.78 – – – –Interest expense 3,10.15 3,26.13 2,84.72 7.13 7.67 7.96Re-measurement (gains)/losses arising from changes in - Demographic assumptions (2.03) 3.00 1,94.92 – – – - Financial assumptions 1,74.59 16.61 1,40.74 0.69 (0.71) 0.07 - Experience adjustments 4,64.22 1,91.71 53.65 9.64 (2.58) (4.73)Benefits paid (1,86.04) (2,93.40) (1,88.50) (19.10) (7.78) (7.12)Liabilities assumed / (settled) – 0.65 – – – –
Closing defined benefit obligation 58,37.68 58,61.69 43,46.21 1,00.91 1,02.55 1,05.95
Details of defined benefit plans as per actuarial valuation are as below: (`in lakhs)
ParticularsFUNDEDGratuity
UNFUNDEDRetired Employee Medical Scheme
31.03.2019 31.03.2018 01.04.2017 31.03.2019 31.03.2018 01.04.2017
Opening fair value of plan assets 44,03.10 44,74.82 32,32.50 – – –
Add/(less) on account of business combination – 1.69 – – – –
Return on plan assets excluding interest income 3,76.56 3,44.73 2,70.82 – – –
Contribution by employer 8,70.07 9,31.71 6,55.21 19.10 7.78 7.12
Benefits paid (1,86.03) (2,93.38) (1,88.51) (19.10) (7.78) (7.12)
Actuarial gain / (loss) on plan assets (31.29) 40.73 6.44 – – –
Assets acquired / (settled)
Closing fair value of plan assets 54,32.41 55,00.29 39,76.46 – – –
Net asset / (liability) recognised in balance sheet
Defined benefit obligation 58,20.79 58,48.52 43,46.21 1,00.91 1,02.55 1,05.95
Fair value of plan assets 54,33.01 55,00.93 39,76.46 – – –
Surplus/(Deficit) (3,87.78) (3,47.59) (3,69.75) (1,00.91) (1,02.55) (1,05.95)
NOTES TO THE CONSOLIDATED FINANCIAL STATEMENTS (Contd.)

Sundaram Finance Limited
200
Actuarial assumptions (in %)
Particulars
FUNDEDGratuity
UNFUNDEDRetired Employee Medical Scheme
31.03.2019 31.03.2018 01.04.2017 31.03.2019 31.03.2018 01.04.2017
Discount rate 7.36 - 7.62 7.55-8.05 7.25 - 8.00 6.5-7.5 6.36-7.67 6.35-7.51
Expected Return on plan assets 7.62 7.50-8.05 7.25 - 8.25 – – –
Attrition rate (Age based) 1-10 1-21 1-21 – – –
Salary escalation 6 - 8 5 - 9 7-8 – – –
In the absence of detailed information regarding plan assets which is funded with Insurance Companies, the composition of each major category of plan assets, the percentage or amount for each category to the fair value of plan assets & the description of the Asset-Liability matching strategies used by the plan has not been disclosed.
Provident Fund
The provident fund contributions to trust are managed through trust investments in addition to contribution of a portion of its provident fund liability relating to Employees Pension Scheme to Employees Provident Fund Organisation.
The fund has a relatively balanced mix of investments in order to manage the risks. The investment strategy is designed based on the interest rate scenario, liquidity needs of the Plans and pattern of investment as prescribed under the statute.
The trustees regularly monitor the funding and investment, there are systems in place to ensure that the health of the portfolio is regularly reviewed and investments do not pose any significant risk of impairment.
The trust also holds reserves in its Balance sheet which can be used to provide for shortage in yield, if any, in the future years.
Major Category of Plan Assets as a % of the Total Plan Assets
Particulars 31.03.2019 31.03.2018 01.04.2017Central Government Securities 13.7 17.1 20.4State Government Securities 34.1 27.9 23.7Public Sector Bonds 41.9 46.1 46.4Private Sector Bonds 3.2 1.8 2.2Special Deposits 3.8 4.5 5.2Short Term Deposits – – 0.3Equity Fund 3.3 2.6 1.8TOTAL 100 100 100
Note 42: Share Based PaymentsThe Group grants ESOP to Senior Management employees in accordance with the terms of the Plan.
Description of the plan that existed during the period
Particulars Grant 10 Grant 9 Grant 8
Board meeting date 25-May-2018 29-May-2017 30-May-16
Options granted 20000 18550 14400
Exercise price (per share) 10 10 10
Date of grant 25-May-2018 29-May-2017 30-May-2016
Vesting date 31-May-2019 31-May-2018 31-May-2017
Vesting period 12 months 12 Months 12 Months
Exercise period 01-06-2019 to 31-08-2019 01-06-2018 to 31-08-2018 01-06-2017 to 31-08-2017
Market price immediately prior to grant date 1732.90 1497.90 1397.70
Intrinsic value 1722.90 1487.90 1387.70
NOTES TO THE CONSOLIDATED FINANCIAL STATEMENTS (Contd.)

Annual Report2018-19
Consolidated Financial Statements
201
Group share based payments
The Group as a part of ESOP scheme, has issued share options to employees of the Group. The Group does not get reimbursed for the cost of such group share options and such costs are treated as investment in the group companies.
Effect of Share based payments transactions on Entities Financials:(` in lakhs)
Particulars 2018-19 2017-18Expenses recognised in Profit & Loss account 2,85.73 2,26.63Amount recognised as Investment in Group companies 47.56 36.80
Unvested share options issued to the various group companies are as under: (in nos)
ParticularsGrant 10 Grant 9 Grant 8
31-03-2019 31-03-2018 01-04-2017Sundaram Asset Management Company Limited 2,250 2,250 1,250Royal Sundaram General Insurance Co. Limited 750 750 500Sundaram BNP Paribas Home Finance Limited 2,000 2,500 2,500TOTAL 5,000 5,500 4,250
Measurement of fair value
The fair values of the options issued have been arrived at using the Black Scholes Model.
The key assumptions used in computing the fair value are
Particulars Grant10 Grant 9 Grant 8
Risk free interest rate per annum 7.03% 6.76% 7.47%
Life of the option 372 days 368 days 367 days
Expected volatility 31.18% 29.80% 34.15%
Fair value of the option(`) 1,723.59 1,488.56 1,388.43
The expected volatility is based on historical share price volatility. The life of the option has been based on general option holder behaviour.
Reconciliation of the outstanding share options - 2018-19:
The number and weighted-average exercise prices of share options under various grants are as follows:
Grant details Grant 10 Grant 9
Particulars Weightedaverage(in`) exercise price per option
No of options
Weightedaverage(in`) exercise price per option
No of options
Outstanding at the beginning of the period – – 10 18,550
Granted during the period 10 20,000 – –
Forfeited / expired during the period – – – –
Exercised during the period – – – –
Outstanding at the end of the period 10 20,000 10 18,550
Exercisable at the end of the period – – – –
Exercise price and Contractual life for the share options outstanding at the end of the period
Particulars 2019 2018 2017
Exercise Price (in `) 10 10 10
Contractual life 2 months 2 months 2 months
NOTES TO THE CONSOLIDATED FINANCIAL STATEMENTS (Contd.)

Sundaram Finance Limited
202
Reconciliation of the outstanding share options - 2017-18:The number and weighted-average exercise prices of share options under various grants are as follows:
Grant details Grant 9 Grant 8
Particulars Weightedaverage(in`) exercise price per option
No of options
Weightedaverage(in`) exercise price per option
No of options
Outstanding at the beginning of the period – – 10 14,400
Granted during the period 10 18,550 – –
Forfeited / expired during the period – – – –
Exercised during the period – – 10 14,400
Outstanding at the end of the period 10 18,550 – –
Exercisable at the end of the period – – – –
Note 43: Leases (` in lakhs)
Note 44: General44.01 In February 2019, the company sold 11,62,91,000 equity shares of ̀ 10/- each (representing 25.90% stake) in Royal Sundaram
General Insurance Co. Limited (RSGI) for a consideration of `984,17.07 lakhs to Ageas Insurance International N.V, The Netherlands, resulting in a profit before tax of `465,85.34 lakhs, disclosed as an exceptional item in the statement of Profit and Loss. The profit is net of transaction expenses and provisions towards certain financial covenants, whereby the company has agreed to indemnify the buyer. Subsequent to the transaction, the company holds 50% in the equity share capital of RSGI, resulting in RSGI becoming a Joint Venture company with effect from 23rd February 2019.
Details
31-03-2019 31-03-2018 01-04-2017Gross
Investment in Lease
Present value of Minimum Lease
payments
Gross Investment in
Lease
Present value of Minimum Lease
payments
Gross Investment in
Lease
Present value of Minimum Lease
paymentsUpto 1 Year 554,30.38 494,25.92 929,63.67 796,60.33 1124,09.67 928,49.361-5 Year 331,11.90 308,49.92 941,05.83 838,48.97 1610,33.02 1413,70.37> 5 Year – – – – – –Total 885,42.28 802,75.84 1870,69.50 1635,09.30 2734,42.69 2342,19.73Less: Unearned Finance income 82,66.44 235,60.20 392,22.96 Present value of Minimum Lease payments 802,75.84 1635,09.30 2342,19.73
Operating lease as lessorMaturity pattern of Minimum Lease payments (` in lakhs)
Year 31.03.2019 31.03.2018 01.04.2017Less than 1 year 52,88.66 69,02.62 91,32.84Later than 1 year and not later than 5 years 67,66.77 92,64.51 126,79.08Later than 5 years – 2,13.68 2,61.94Total 120,55.43 163,80.81 220,73.86
Operating lease as a lesseeThe Group has taken certain premises for its business operations under cancellable operating lease agreements ranging from 11 months to 15 years which are subject to renewal at mutual consent.
(` in lakhs)
Particulars 2018-19 2017-18Total operating lease payment recognised as expense during the period 16,77.28 28,41.43
Finance lease as a lesseeAssets acquired under finance lease comprises Land which have a primary period of Ninety-eight years with an option to renew it.
(` in lakhs)
Particulars 31.03.2019 31.03.2018 01.04.2017Carrying value of assets taken on finance lease 39.08 39.08 39.08
NOTES TO THE CONSOLIDATED FINANCIAL STATEMENTS (Contd.)

Annual Report2018-19
Consolidated Financial Statements
203
44.0
2 Se
gmen
t Rep
ortin
g (`
in la
khs)
Busin
ess S
egme
ntsAs
set F
inanc
ingIn
sura
nce
Othe
r Ope
ratio
nsEli
mina
tions
Cons
olida
ted To
tal20
18-1
920
17-1
820
18-1
920
17-1
820
18-1
920
17-1
820
18-1
920
17-1
820
18-1
920
17-1
8RE
VENU
ESe
gmen
t Rev
enue
3744
,57.85
2659
,15.58
––
3156
,15.25
–49
0,46.4
147
4,44.1
4–
––
–42
35,04
.2662
89,74
.96–
Inter
segm
ent s
ales
25,77
.7359
,93.56
––
–92
,98.03
94,13
.94–
118,7
5.77
154,0
7.50
––
––
Total
Rev
enue
3770
,35.58
2719
,09.14
––
3156
,15.25
–58
3,44.4
456
8,58.0
8–
118,7
5.77
154,0
7.50
–42
35,04
.2662
89,74
.96–
RESU
LTSe
gmen
t Res
ult14
43,33
.1885
9,75.2
1–
– 11
3,15.1
1 –
57,01
.18
94,06
.67
– 83
,37.32
92
,22.66
–
1416
,97.04
974,7
4.33
–Un
alloc
ated i
ncom
e (n
et of
expe
nse)
81.19
39,67
.02–
Profi
t befo
re ta
x14
17,78
.2310
14,41
.35–
Less:
Inco
me ta
x38
7,96.5
734
7,94.2
2–
Profi
t afte
r tax b
efore
1029
,81.66
666,4
7.13
–sh
are o
f res
ults o
f As
socia
tes/Jo
int
contr
ol En
tities
Add:
Shar
e of P
rofit
in As
socia
tes/Jo
int
contr
ol En
tities
228,6
8.51
176,8
4.86
–
Less:
Non
-co
ntroll
ing In
teres
t97
,64.79
113,4
0.79
–
Profi
t afte
r Tax
1160
,85.39
729,9
1.20
–OT
HER
INFO
RMAT
ION
31.03
.2019
31.03
.2018
01.04
.2017
31.03
.2019
31.03
.2018
01.04
.2017
31.03
.2019
31.03
.2018
01.04
.2017
31.03
.2019
31.03
.2018
01.04
.2017
31.03
.2019
31.03
.2018
01.04
.2017
Segm
ent A
ssets
3082
1,73.0
125
935,2
8.91
1878
6,45.6
0–
5246
93.09
4104
62.37
2731
57.63
3238
,97.58
2306
,27.12
218,7
6.61
1275
,76.44
1130
,79.37
3333
4,54.0
333
145,4
3.14
2406
6,55.7
1Un
alloc
ated A
ssets
336,2
9.24
840,5
7.97
764,0
1.20
Total
Asse
ts33
670,8
3.27
3398
6,01.1
024
830,5
6.91
Segm
ent L
iabilit
ies25
605,6
5.63
2167
5,90.2
715
045,0
1.50
–43
78,81
.9834
75,72
.8263
,71.98
118,0
3.04
60,66
.8417
,36.07
182,1
7.17
261,3
1.26
2565
2,01.5
425
990,5
8.13
1832
0,09.9
1Un
alloc
ated
Liabil
ities
20,60
.8739
,11.33
23,47
.11
Total
Liab
ilities
2567
2,62.4
126
029,6
9.46
1834
3,57.0
2Ca
pital
Expe
nditu
re99
,89.92
63,67
.69–
– 9,
68.39
–
3,85.3
75,9
2.48
––
––
103,7
5.29
79,28
.56–
Depr
eciat
ion53
,96.77
63,61
.64–
–11
,61.19
–4,1
0.57
3,58.9
3–
––
–58
,07.34
78,81
.76–
Non-c
ash ex
pense
soth
er tha
n dep
reciat
ion10
2,95.5
185
,38.03
––
––
34.51
1,
53.73
–
––
–10
3,30.0
286
,91.76
–
NOTE
S TO
TH
E CO
NSO
LID
ATED
FIN
ANCI
AL S
TATE
MEN
TS (
Cont
d.)

Sundaram Finance Limited
204
44.03 The Group has spent an amount of `15,28.26 lakhs (2017-18 `16,16.76 lakhs) towards Corporate Social Responsibility
(CSR) under Sec 135 of the Companies Act 2013, in the various areas covered under the regulatory provisions like healthcare,
education, environment and protection of art and culture.
44.04 The pending litigations as on 31st March 2019 have been compiled by the Group and reviewed by the Statutory Auditors. The
current position of the litigation has been evaluated and the effect thereof has been appropriately disclosed in the financial
statements.
44.05 Provisions contingent liabilities and contingent asset
(` in lakhs)
Movement of provisions Amount
Carrying amount as on 31.03.2018 74,95.59
Add: Provisions made during the year 49.08
Less: Amount used or reversed during the year 35,41.45
Carrying amount as on 31.03.2019 40,03.22
(` in lakhs)
Contingent liabilities 31.03.2019 31.03.2018 01.04.2017
a) On Cheques discounted 1.38 27.80 99.79
b) Bank guarantee and Letter of credit 5,64.83 8,15.14 1,94.30
c) Claims against the Group not acknowledged as debts 6,21.60 6,34.29 5,71.46
d) Tax disputes 79,08.26 274,33.93 265,95.08
e) Others – 74.19 68.53
Tax disputes in respect of Income Tax, Service Tax, VAT demands and Customs duty are pending before various appellate forums/
authorities and the cash flows would be determined only upon the receipt of decisions. The Group is of the opinion that the
demands are not sustainable and expects to succeed in its appeal.
The contested tax demands have been ascertained on the basis of relief allowed by the appellate authorities, on similar issues
in earlier assessment years.
NOTES TO THE CONSOLIDATED FINANCIAL STATEMENTS (Contd.)

Annual Report2018-19
Consolidated Financial Statements
205
44.0
5 A.
Add
ition
al in
form
atio
n, a
s re
quir
ed u
nder
Sch
edul
e II
I to
the
Com
pani
es A
ct, 2
013,
of e
nter
pris
es c
onso
lidat
ed a
s Su
bsid
iary
/Join
t Ven
ture
s (`
in la
khs)
Name
of
the
entity
Net A
ssets,
i.e., T
otal a
ssets
minu
s tota
l liab
ilities
Shar
e in p
rofit
or lo
ssSh
are i
n Othe
r Com
preh
ensiv
e Inc
ome (
OCI)
Shar
e in T
otal C
ompr
ehen
sive I
ncom
e (TC
I)
31.03
.2019
31.03
.2018
2018
-19
2017
-18
2018
-19
2017
-18
2018
-19
2017
-18
As %
of
cons
olida
ted
net a
ssets
Amou
ntAs
% of
co
nsoli
dated
ne
t asse
ts
Amou
ntAs
% of
co
nsoli
dated
pr
ofit o
r los
s
Amou
ntAs
% of
co
nsoli
dated
pr
ofit o
r los
s
Amou
ntAs
% of
co
nsoli
dated
OC
I
Amou
ntAs
% of
co
nsoli
dated
OC
I
Amou
ntAs
% of
co
nsoli
dated
TC
I
Amou
ntAs
% of
co
nsoli
dated
TC
I
Amou
nt
Sund
aram
Fi
nanc
e Lim
ited
57.14
5043
,81.09
47.31
4133
,63.14
79.47
1126
,30.88
64.50
563,4
3.65
(0.50
)27
7.66
(0.24
)(1
,50.99
)1,3
1.25
1129
,08.55
37.17
56
1,92.6
7
Subs
idia
ries:
Roya
l Sun
dara
m Ge
nera
l Ins
uran
ce
Co. L
imite
d*
––
8.65
755,7
1.04
––
6.53
57,07
.89–
–(4
.74)
(30,2
6.49)
––
1.77
26,81
.40
Sund
aram
Fina
nce
Holdi
ngs L
imite
d (C
onso
lidate
d)
7.17
626,2
2.30
8.52
744,2
8.72
2.57
36,38
.633.9
334
,32.23
26.43
(1
47,20
.93)
28.20
17
9,92.2
6(1
2.88)
(110
,82.30
)14
.17
214,2
4.49
Sund
aram
Asse
t Ma
nage
ment
Comp
any L
imite
d (C
onso
lidate
d)
2.27
197,9
3.95
2.03
177,2
5.34
2.03
28,83
.633.5
531
,02.14
0.04
(25.0
1)(0
.02)
(10.5
5)3.3
2 28
,58.62
2.05
30,91
.59
Sund
aram
Trus
tee
Comp
any L
td.0.0
21,8
0.07
0.02
1,59.9
80.0
680
.360.1
085
.11–
––
–0.0
9 80
.360.0
6 85
.11
LGF S
ervic
es Lt
d0.0
43,6
7.46
0.05
4,17.8
40.0
224
.960.0
434
.36–
–(0
.00)
(0.26
)0.0
3 24
.960.0
2 34
.10
Sund
aram
Emplo
yee
WelfareTrust
0.16
13,86
.410.1
411
,96.98
0.13
1,89.4
30.0
978
.50–
––
–0.2
2 1,8
9.43
0.05
78.50
Non-
cont
rolli
ng
Inte
rest
in
Subs
idia
ries
19.90
1738
,91.43
26.40
2307
,07.10
6.89
97,64
.7912
.9811
340.7
973
.42
(408
,91.67
)76
.81
490,1
7.78
(36.1
8)(31
1,26.8
9)39
.93
603,5
8.57
Join
t Con
trol
Entit
ies
Sund
aram
BNP
Pa
ribas
Hom
e Fin
ance
Limi
ted
7.32
639,2
1.01
6.72
587,5
1.65
5.14
72,88
.478.2
872
,36.02
(0.01
)3.8
2 (0
.01)
(7.26
)8.4
8 72
,92.29
4.78
72,28
.76
Roya
l Sun
dara
m Ge
nera
l Ins
uran
ce
Co. L
imite
d*
6.31
551,1
2.07
––
4.00
56,62
.73–
–0.6
1 (3
,41.03
)–
–6.1
9 53
,21.70
––
Sund
aram
BNP
Pa
ribas
Fund
Se
rvice
s Lim
ited
0.12
10,52
.450.1
714
,94.79
(0.31
)(4
,42.78
)(0
.01)
(7.46
)0.0
0 (0
.44)
(0.00
)(1
.16)
(0.52
)(4
,43.22
)(0
.01)
(8.62
)
100.0
088
27,08
.2410
0.00
8738
,16.59
100.0
014
17,21
.0910
0.00
873,5
3.24
100.0
0 (5
56,97
.59)
100.0
0 63
8,13.3
310
0.00
860,2
3.50
100.0
0 15
11,66
.57
Adju
stmen
t aris
ing
out o
f Con
solid
ation
(828
,87.39
)(7
81,84
.95)
(158
,70.93
)(3
0,21.2
5)(15
8,70.9
3)(3
0,21.2
5)
7998
,20.85
7956
,31.64
1258
,50.17
843,3
1.99
(556
,97.59
)63
8,13.3
370
1,52.5
814
81,45
.32
* Re
fer
Note
No.
44.
01
NOTE
S TO
TH
E CO
NSO
LID
ATED
FIN
ANCI
AL S
TATE
MEN
TS (
Cont
d.)

Sundaram Finance Limited
206
RELATED PARTIES DISCLOSURES:
44.06 Related Party Disclosures as per Ind AS 24 for the year ended 31st March 2019 , are given below:
RELATED PARTIES:
Associates:
Flometallic India Private Limited
The Dunes Oman LLC (FZC)
Sundaram Hydraulics Limited
Axles India Limited
Turbo Energy Private Limited
Transenergy Limited
Sundaram Dynacast Private Limited
Joint Ventures :
Sundaram BNP Paribas Home Finance Limited
Sundaram BNP Paribas Fund Services Limited
Royal Sundaram General Insurance Co. Limited (From 23/02/2019)
Key Management Personnel:
Mr. T.T.Srinivasaraghavan, Managing Director
Mr. Harsha Viji, Deputy Managing Director
Mr. A.N. Raju, Director (Operations)
Relatives of Key Management Personnel: (with whom the company has transactions)
Mr. T.T. Srinivasaraghavan Mr. Harsha Viji Mr. A.N. Raju
Father Mr. T. T. Rangaswamy Mr. S.Viji
Mother Mrs. Vimala Rangaswamy Mrs. Chitra Viji
Wife Mrs. Bagyam Raghavan Mrs. R.N. Mala
Daughter Miss. Anjana Raghavan
Son Mr T. T. Venkatraghavan
Brother Mr. T.T. Narendran Mr. Sriram Viji Mr. A.N. Sreeram
Enterprises over which Key Management Personnel (KMP) and his relatives can exercise significant influence
M/s. Azorius Holdings Private Limited
M/s. Uthirattadhi Sriram Holdings Private Limited
NOTES TO THE CONSOLIDATED FINANCIAL STATEMENTS (Contd.)

Annual Report2018-19
Consolidated Financial Statements
207
All the arrangements and transactions entered into by the company with related parties, during the financial year 2018-19
were in ordinary course of business and on arm’s length price
The required statements and documents with respect to the related party transactions were placed before the audit committee
and board of directors
Related Party Transactions for the Year Ended 31st March 2019
The nature and volume of transactions for the year ended 31st March 2019 with the above related parties are as follows.
(` in lakhs)
Particulars Associates Joint Ventures 2018-19 2017-18INCOME
Lease Rental Income 73.11 58.48 1,31.59 93.93Interest Income – 10,74.98 10,74.98 –Income from Services 34.79 22,66.80 23,01.59 11,83.47Dividend 41,64.28 17,75.50 59,39.78 58,33.72Rent Receipts 39.39 2,66.03 3,05.42 2,51.10Income from other Financial Services – 31,48.34 31,48.34 12,37.97Other Non Operating Income – 1,71.95 1,71.95 1,40.06
EXPENDITUREInterest – 5,02.62 5,02.62 6,14.03Rent Paid – 2.89 2.89 1.41Insurance Premium – 1,37.39 1,37.39 21.12Brokerage Paid – 3.44 3.44 1.10Fund Accounting Charges – 19,24.32 19,24.32 33,68.84
ASSETSInvestments – – – 2,55.00Disinvestment 22,05.50 303,07.38 325,12.88 –Insurance Premium paid in advance 1,42.83 1,42.83 11.22Redemption of Preference Shares 1,66.67 1,66.67 1,66.67
LIABILITIESIssue of Non Convertible Debentures 15,02.34 15,02.34 57,57.50
(` in lakhs)
Compensation paid to Key Managerial Personnel 2018-19 2017-18Short term benefits 10,87.47 10,18.28Post retirement benefits 34.28 32.25Share based payments 42.09 35.62
(` in lakhs)
Transactions with Key Managerial Personnel 2018-19 2017-18Interest on deposits 57.07 83.95Dividend Paid 12,68.92 4,85.06Dividend Paid to Enterprises over which KMP and his relatives is exercising significant influence
3,96.05 1,51.43
NOTES TO THE CONSOLIDATED FINANCIAL STATEMENTS (Contd.)

Sundaram Finance Limited
208
Disclosure Of Material Transactions With Related Parties(` in lakhs)
Particulars Related Parties 2018-19 2017-18
INCOME
Lease Rental Income Turbo Energy Private Limited 56.88 63.73
Sundaram BNP Paribas Fund Services Limited 40.71 15.48
Royal Sundaram General Insurance Co. Limited 17.77 –
Axles India Limited 16.23 14.72
Interest Income Royal Sundaram General Insurance Co. Limited 10,74.98 –
Income from Services Royal Sundaram General Insurance Co. Limited 10,61.46 –
Sundaram BNP Paribas Home Finance Limited 7,99.28 7,23.25
Sundaram BNP Paribas Fund Services Limited 4,06.06 4,31.48
Turbo Energy Private Limited 34.79 28.73
Dividend Dunes Oman LLC (FZC) 26,92.23 26,07.72
Sundaram BNP Paribas Home Finance Limited 17,75.50 17,75.50
Turbo Energy Private Limited 5,12.00 7,16.80
Flometallic India Private Limited 4,87.50 4,06.25
Axles India Limited 2,96.75 1,78.05
Sundaram Dynacast Private Limited 1,63.80 1,40.40
Transenergy Limited 12.00 9.00
Rent Receipts Sundaram BNP Paribas Home Finance Limited 1,90.07 1,73.68
Royal Sundaram General Insurance Co. Limited 47.91 –
Turbo Energy Private Limited 39.39 49.37
Sundaram BNP Paribas Fund Services Limited 28.05 28.05
Income from other Financial Services Royal Sundaram General Insurance Co. Limited 18,45.81 –
Sundaram BNP Paribas Fund Services Limited 6,90.91 5,72.20
Sundaram BNP Paribas Home Finance Limited 6,11.62 6,65.77
Other Non Operating Income Sundaram BNP Paribas Home Finance Limited 1,29.98 1,10.99
Sundaram BNP Paribas Fund Services Limited 26.67 29.07
Royal Sundaram General Insurance Co. Limited 15.30 –
EXPENDITURE
Interest Royal Sundaram General Insurance Co. Limited 5,02.62 6,14.03
Rent Paid Royal Sundaram General Insurance Co. Limited 2.67 –
Sundaram BNP Paribas Home Finance Limited 0.22 1.41
Insurance Premium Royal Sundaram General Insurance Co. Limited 1,37.39 21.12
Brokerage Paid Sundaram BNP Paribas Home Finance Limited 3.44 1.10
Fund Accounting Charges Sundaram BNP Paribas Fund Services Limited 19,24.32 33,68.84
NOTES TO THE CONSOLIDATED FINANCIAL STATEMENTS (Contd.)

Annual Report2018-19
Consolidated Financial Statements
209
(` in lakhs)
Particulars Related Parties 2018-19 2017-18
ASSETS
Investments Sundaram BNP Paribas Fund Services Limited - 255.00
Disinvestments Royal Sundaram General Insurance Co. Limited 30307.38 -
Dunes Oman LLC (FZC) 2205.50 -
Insurance Pemium paid in advance Royal Sundaram General Insurance Co. Limited 142.83 11.22
Redemption of Preference Shares Sundaram Hydraulics Limited 166.67 166.67
LIABILITIES
Issue of Non Convertible Debentures Royal Sundaram General Insurance Co. Limited 1502.34 5757.50
Balances With Related Parties as at 31st March 2019(` in lakhs)
Balances Outstanding
Associates Joint Ventures
Key Management Personnel
Relatives of Key
Management Personnel
Enterprises over which
KMP and his relatives is exercising significant influence
31.03.2019 31.03.2018 01.04.2017
ASSETS
Investments 80,39.50 863,67.18 944,06.68 262,63.11 261,37.98
Loans and Advances 32.18 4,13.04 4,45.22 2,57.85 1,29.23
Other Assets 10,10.48 10,10.48 4,18.98 1,00.53
LIABILITIES
Equity Holdings 2,04.57 4,51.98 232.97 8,89.51 9,79.21 9,79.01
Non Convertible Debentures
53,02.33 53,02.33 – –
Deposits 31.10 6,82.81 7,13.91 7,03.19 10,64.61
Other Liabilities 2,69.64 2,69.64 1,79.13 3,96.95
Remuneration payable 7,54.51 7,54.51 7,07.48 5,50.21
NOTES TO THE CONSOLIDATED FINANCIAL STATEMENTS (Contd.)

Sundaram Finance Limited
210
Disclosure of Material Balances with Related Parties as at 31st March 2019(` in lakhs)
Balances Outstanding Associates Joint Ventures 31.03.2019 31.03.2018 01.04.2017
ASSETS
Investments
a) Investments In Equity Shares
Royal Sundaram General Insurance Co. Limited 585,37.34 585,37.34 – –
Sundaram BNP Paribas Home Finance Limited 152,57.75 152,57.75 152,22.82 151,86.03
Sundaram BNP Paribas Fund Services Limited 22,95.15 22,95.15 22,95.15 20,40.15
Flometallic India Private Limited 32,50.00 32,50.00 32,50.00 32,50.00
Dunes Oman LLC (FZC) 21,55.89 21,55.89 26,94.86 26,94.86
Sundaram Hydraulics Limited 11,25.00 11,25.00 11,25.00 11,25.00
Axles India Limited 10,15.70 10,15.70 10,15.70 10,15.70
Turbo Energy Private Limited 1,88.41 1,88.41 1,88.41 1,88.41
Transenergy Limited 1,87.50 1,87.50 1,87.50 1,87.50
Sundaram Dynacast Private Limited 1,17.00 1,17.00 1,17.00 1,17.00
Total 80,39.50 760,90.24 841,29.74 260,96.44 258,04.65
b) Investments In Non-Convertible Debentures
Royal Sundaram General Insurance Co. Limited 102,76.94 102,76.94 – –
c) Investment in Preference Shares
Sundaram Hydraulics Limited 1,66.67 3,33.33
NOTES TO THE CONSOLIDATED FINANCIAL STATEMENTS (Contd.)

Annual Report2018-19
Consolidated Financial Statements
211
Balances With Related Parties as at 31st March 2019(` in lakhs)
Balances Outstanding
Associates Joint Ventures
Key Management Personnel
Relatives of Key
Management Personnel
Enterprises over which
KMP and his relatives is exercising significant influence
31.03.2019 31.03.2018 01.04.2017
Loans and Advances
a) Lease Receivables
Sundaram BNP Paribas Fund Services Ltd.
4,13.04 4,13.04 2,47.42 89.49
Axles India Ltd. 32.18 32.18 10.43 15.36
b) Hypothecation Loans
Sundaram Hydraulics Ltd. – – 24.37
32.18 4,13.04 4,45.22 2,57.85 1,29.23
Other Assets
Royal Sundaram General Insurance Co. Ltd.
8,44.83 8,44.83 – –
Sundaram BNP Paribas Fund Services Ltd.
95.69 95.69 1,56.52 50.98
Sundaram BNP Paribas Home Finance Ltd.
69.96 69.96 2,54.21 49.55
Turbo Energy Private Ltd. – – 8.24 –
Total – 10,10.48 10,10.48 4,18.98 1,00.53
LIABILITIESEquity Holdings 204.57 4,51.98 2,32.97 8,89.51 9,79.21 9,79.01
Non Convertible Debentures
Royal Sundaram General Insurance Co. Ltd.
53,02.33 53,02.33 – –
Deposits 31.10 6,82.81 7,13.91 7,03.19 10,64.61
Other Liabilities
Sundaram BNP Paribas Fund Services Ltd
89.95 89.95 35.55 2,52.93
Sundaram BNP Paribas Home Finance Ltd.
1,43.44 1,43.44 1,43.58 1,44.02
Royal Sundaram General Insurance Co. Ltd.
36.25 36.25 – –
Key Management Personnel
Remuneration payable 7,54.51 7,54.51 7,07.48 5,50.21
Total 2,69.64 7,54.51 10,24.15 8,86.61 9,47.16
(` in lakhs)
Maximum amount outstanding in respect of Loans and Advances 2018-19 2017-18
Sundaram BNP Paribas Fund Services Ltd 4,22.90 2,47.42
Axles India Ltd 49.21 54.77
NOTES TO THE CONSOLIDATED FINANCIAL STATEMENTS (Contd.)

Sundaram Finance Limited
212
44.07 Estimated amount of contracts remaining to be executed on capital account
(` in lakhs)
Particulars 31.03.2019 31.03.2018 01.04.2017
Estimated Amount of contracts remaining to be executed on capital account
(net of advance)
1,52.56 12,50.28 12,66.84
Uncalled commitment in Alternative Investment Fund Schemes 8,88.92 33,61.82 13,50.00
Commitments made and outstanding for Loans and Investments – 17,74.30 24,41.55
44.08 Interim dividend paid during the year is `5/- per share. Final dividend of `7.50 per share and Special dividend of `5/- per
share have been recommended by the Board for the year ended 31st March 2019 in May 2019
44.09 Administrative and other expenses include payment to Auditors towards:
(` in lakhs)
Particulars 2018-19 2017-18
Statutory Audit 1,01.21 1,18.29
Tax Audit 25.21 25.47
Certification 29.00 46.30
Reimbursement of expenses 2.00 3.23
44.10 Disclosure under the MSME Act 2006, (As per the intimation received form the vendor)
(` in lakhs)
Particulars 31.03.2019 31.03.2018 31.03.2017
i) a) Principal amount remaining unpaid* 85.84* – –
b) Interest amount remaining unpaid – – –
ii) Interest and principal amount paid beyond appointed date – – –
iii) Amount of interest due and payable for the period of delay in making
payment (which have been paid but beyond the appointment day during
the year) but without adding the interest specified under this Act.
– – –
iv) Interest accrued and remaining unpaid – – –
v) Interest remaining due and payable even in the succeeding years, until
such date when the interest dues as above are actually paid to the small
enterprise
* Subsequently paid in April 2019 as per the agreed terms
44.11 Based on the current assessment of the long-term contracts in the ordinary course of business, the Company has made adequate
provision for losses where required. The derivative contracts have been entered into for hedging the foreign currency liability
and interest liability.
Derivative contracts being in the nature of hedge contracts, the Company does not anticipate any material losses from the same.
Derivative contracts being in the nature of hedge contracts, the Company does not anticipate any material losses from the same.
NOTES TO THE CONSOLIDATED FINANCIAL STATEMENTS (Contd.)

Annual Report2018-19
Consolidated Financial Statements
213
44.12 Scheme of arrangement
Sundaram Finance Limited
The National Company Law Tribunal, Division Bench, Chennai vide Order No. CP/210-214/CAA/2017 dated 12th January 2018
approved the Composite Scheme of Arrangement and Amalgamation (Scheme) between the Company and its four subsidiaries,
viz., Sundaram Insurance Broking Services Limited, Infreight Logistics Solutions Limited, Sundaram BPO India Limited and
Sundaram Finance Holdings Limited which was received on 18th January 2018. The Scheme was to be effective from the Appointed
Date, i.e. 1st April 2016, and is operative from the Effective Date, i.e. 18th January 2018. The scheme envisages the following
•AmalgamationofSundaramInsuranceBrokingServicesLimited(SIBSL)andInfreightLogisticsSolutionsLimited(ILSL)into
the Company. Pursuant to the scheme, the authorised equity share capital of the Company stands increased by 1,11,00,000
equity shares of `10/- each aggregating to `11,10 Lakhs. Consequent to the merger, the entire issued, subscribed and paid
up capital of SIBSL & ILSL, held by the company and its nominees would stand cancelled. The net amount debited to reserves
on account of the amalgamation amounts to `1,73.43 lakhs;
•DemergerofthesharedservicesofSundaramBPOIndiaLimited(SBPO)intotheCompany;andsubsequently
•Demergerofthenon-coreinvestmentsandsharedservicesoftheCompanyintoSundaramFinanceHoldingsLimited(SFHL).
All shareholders of the company have been allotted shares in SFHL, in the ratio of 1:1 and the shares have been listed in NSE.
Sundaram Asset Management Company - Subsidiary During the year, the company hived off the Alternative Investment Funds (AIF) and Portfolio Management Services (PMS)
divisions and these operations were brought under a separate entity, Sundaram Alternate Assets Limited (resulting company).
The order of the National Company Law Tribunal (NCLT) approving demerger was received on 29th May, 2018 with effect from
1st April 2018. The Net Assets of the resulting entity of `35,97,87,483 was transferred at for a consideration of `36,00,00,000
and difference of ̀ 2,12,517 has been recognised as Capital Reserve. Consideration has been received in the form of 3,60,00,000
equity shares of face value `10/- per share of the resulting company.
The Balance Sheet and Statement of Comprehensive Income for the previous year ending 31.03.2018 includes the assets and
liabilities, income and expenditure of the resulting company and to this extent is not comparable with the current year financials.
Sundaram Finance Holdings Limited (SFHL) - Subsidiary The National Company Law Tribunal, Single Bench, Chennai, vide Order No. CP/403/CAA/2019 dated 22nd April 2019 approved
the Scheme of Amalgamation of Sundaram BPO India Limited, a wholly-owned subsidiary of SFHL with Sundaram Business
Services Limited another wholly-owned subsidiary of SFHL w.e.f the Appointed Date, i.e. 1st April 2018.
44.13 Earnings per Share
ParticularsYear Ended
31.03.2019 31.03.2018Profit /(Loss) attributable to equity shareholders (` in lakhs) 1258,50.18 843,31.99Number of equity shares 11,01,42,900 11,01,24,350Earnings per share – Basic & Diluted (in `) 105.40 66.28Face value of Share 10 10
S Viji S Prasad Chairman Director
T T Srinivasaraghavan Harsha Viji A N Raju Managing Director Deputy Managing Director Director (Operations)
M Ramaswamy P Viswanathan Chief Financial Officer Secretary & Compliance Officer
As per our report of even date attachedFor Sundaram & SrinivasanChartered AccountantsRegistration No.004207SK SrinivasanPartnerMembership No.5809Place : ChennaiDate : 30th May, 2019
NOTES TO THE CONSOLIDATED FINANCIAL STATEMENTS (Contd.)

Sundaram Finance Limited
214
Independent Auditor’s Report to the Members of Sundaram Finance Limited
Report on the Audit of the Consolidated Ind AS Financial Statements
Opinion
Wehaveaudited theaccompanyingconsolidated IndASfinancial statementsof SundaramFinanceLimited(“theCompany”)and its
subsidiaries (the Company and its subsidiaries together referred to as “the Group”) and its associates and joint ventures, which comprise
the Consolidated Balance Sheet as at March 31, 2019, the Consolidated Statement of Profit and Loss (including Other Comprehensive
Income), the Consolidated Statement of Changes in Equity and the Consolidated Statement of Cash Flows for the year ended on that date,
and a summary of the significant accounting policies and other explanatory information (hereinafter referred to as “the consolidated
financial statements”).
In our opinion and to the best of our information and according to the explanations given to us, the aforesaid consolidated financial
statements give the information required by the Companies Act, 2013 (the “Act”) in the manner so required and give a true and fair view
in conformity with Indian Accounting Standards prescribed under section 133 of the Act read with the Companies (Indian Accounting
Standards) Rules, 2015, as amended (“Ind AS”) and other accounting principles generally accepted in India, of the consolidated state
of affairs of the Group as at March 31, 2019, the consolidated profit, consolidated total comprehensive income, consolidated changes in
equity and its consolidated cash flows for the year ended on that date.
Basis for Opinion
WeconductedourauditoftheconsolidatedfinancialstatementsinaccordancewiththeStandardsonAuditing(SAs)specifiedunder
section 143(10) of the Act (SAs). Our responsibilities under those Standards are further described in the Auditor’s Responsibilities for
theAuditoftheConsolidatedFinancialStatementssectionofourreport.WeareindependentoftheGroupinaccordancewiththeCode
of Ethics issued by the Institute of Chartered Accountants of India (ICAI) together with the independence requirements that are relevant
to our audit of the consolidated financial statements under the provisions of the Act and the Rules made thereunder, and we have fulfilled
our other ethical responsibilities in accordance with these requirements and the ICAI’s Code of Ethics.
Webelievethattheauditevidencewehaveobtainedissufficientandappropriatetoprovideabasisforourauditopinionontheconsolidated
financial statements.
Key Audit Matters
Key audit matters are those matters that, in our professional judgment, were of most significance in our audit of the consolidated financial
statements of the current period. These matters were addressed in the context of our audit of the consolidated financial statements as a
whole,andinformingouropinionthereon,andwedonotprovideaseparateopiniononthesematters.Wehavedeterminedthematters
described below to be the key audit matters to be communicated in our report.

Annual Report2018-19
Consolidated Financial Statements
215
Key Audit Matter How our audit addressed the key audit matter
Adoption of New Accounting framework (Ind AS)
Effective 1st April 2018, the Company adopted the Indian Accounting Standards
('Ind AS") notified by the Ministry of Corporate Affairs with the transition date of
1st April 2017.
The following are the major impact areas for the Company upon transition:
- Classification and measurement of Financial Assets and Financial Liabilities
- Measurement of Loan losses (expected credit losses)
- Accounting for Securitization and Assignment
- Accounting for Loan Fees and Costs
- Accounting for Employee stock options
- Accounting for Derivative instruments
The migration to the new accounting framework (Ind AS) is a process involving
multiple decision points upon transition. Ind AS 101, First Time Adoption prescribes
choices and exemptions for first time application of Ind AS principles at the transition
date.
WeidentifiedtransitiondateaccountingasaKeyAuditMatterbecauseofsignificant
degree of management judgment and application on the areas noted above.
•WeconfirmedtheapprovalsofAuditCommitteefor
the choices and exemptions made by the Company
for compliance/acceptability under IND AS 101.
•Evaluatedmanagement'stransitiondatechoices
and exemptions for compliance/acceptability
under Ind AS 101.
•Understood, themethodology implementedby
management to give impact on the transition
and assessed the accuracy of the computations.
We confirm the accuracy of accounting and
adequacy of disclosures in the Financial statements.
Impairment Loss AllowanceManagement’s judgements in the calculation of impairment allowances have
significant impact on the financial statements. The estimates regarding impairment
allowances are complex and require a significant degree of judgement, which
increased with implementation of Expected Credit Loss (“ECL”) approach starting
from 1st April 2017 as required by Ind AS 109 relating to “Financial instruments.”
Management is required to determine the expected credit loss that may occur
over either a 12-month period or the remaining life of an asset, depending on the
categorisation of the individual asset.
The key areas of judgement include:
1. Categorisation of loans in Stage 1, 2 and 3 based on identification of:
(a) exposures with significant increase in credit risk since their origination and
(b) Individually impaired / default exposures.
2. Techniques used to determine Loss Given Default (‘LGD’) and Probability of
Default (‘PD’) to calculate an ECL based on past experience.
3. The impact of different future macroeconomic conditions in the determination
of ECL.
These judgements required new models to be built and implemented to measure
the expected credit losses on certain financial assets measured at amortised cost.
Management has made a number of interpretations and assumptions when designing
and implementing models that are compliant with the new standard.
The accuracy of data flows and the implementation of related controls is critical
for the integrity of the estimated impairment provisions. Given the significance of
judgements and the high complexity related particularly to the calculation of ECL
we considered this area as a Key Audit Matter.
•Weobtainedanunderstandingofmanagement’s
assessment of impairment of loans and advances
including the Ind AS109 implementation process,
internal rating model, impairment allowance
policy and ECL modelling methodology.
•Weassessedthedesignandimplementation,and
tested the operating effectiveness of controls over
the modelling process including governance
over monitoring of the model and approval of
key assumptions
•WealsoassessedtheapproachoftheCompany
for categorisation of the loans in various stages
reflecting the inherent risk in the respective
loans.
•Forasampleoffinancialassets,we tested the
correctness of Staging, reasonableness of PD,
accuracy of LGD and ECL computation.
As a result of the above audit procedures no
material differences were noted.
Weconfirmtheadequacyofdisclosuresmadein
the Financial statements.

Sundaram Finance Limited
216
Key Audit Matter How our audit addressed the key audit matter
Divestment of shares During the year the Company has divested 25.90% of its share in Royal Sundaram
General Insurance Company Limited.
Weconsideredtheaccountingtreatmentinthefinancialstatementsofthiseventasa
Key Audit Matter because of its size and the judgment required in calculating some
of the amounts included in the profit on divestment of shares
WeverifiedtheProfitondisposalbyreconciling
the consideration to the Share Purchase Agreement
(SPA), bank accounts and by verifying the
investments disposed to underlying accounting
records.
In addition we verified whether the Profit on
disposal was calculated in accordance with the
relevant clauses of the SPA.
We confirm the accuracy of accounting and
adequacy of disclosures in the Financial statements.
Fair Value of Unquoted Equity Investments (Other than Investments in Subsidiaries and Joint Ventures)Investment in Unquoted equity shares are measured at Fair value.
The Fair value of these financial assets involved managements judgement because
these securities are not traded in an active market .
As per Ind AS 109, Cost has been considered as the best estimate of Fair value by
the Management.
Since this valuation is a Level 3 type of valuation in accordance with Ind AS 113
Fair Value Measurement where one or more significant inputs to the fair value
measurement is unobservable .
Accordingly this item is considered to be a Key Audit Matter due to significant
judgments associated with estimating the fair value of investment.
Wediscussedwithmanagement the basis used
in determining the fair value and evaluated the
appropriateness of the valuation methodologies
used by management and compared it to industry
norms and the requirements in Ind AS.
Weconfirmtheadequacyofthedisclosuresmade
in the Financial statements.
Impairment testing of investments in Subsidiaries / Joint Ventures:Impairment testing of investments in Subsidiaries/Joint venture is considered as a
Key Audit Matter since impairment of these investments may have an impact on the
equity of the Company.
Testing for impairment depends on the future results of the companies concerned.
In addition, there is significant scope for judgement in determining the assumptions
underlying forecast results of the entities.
Wecomparedthebookvalueof the investments
in the year under review with their prorata share
of the respective company’s equity based on
their financials, evaluated the internal sources
and external sources of information to identify
impairment indications, if any.
Where indicators of impairment have been
identified, assessing the reasonableness of the
recoverable amount of each of the relevant
subsidiaries and joint ventures, obtained an
understanding from management of their financial
position and future prospects.
The same has been evaluated and appropriately
dealt in the books of accounts..
Based on the audit procedures performed, we
found the key judgements and assumptions used
in the impairment identification and assessments
were duly supported by the available evidence.

Annual Report2018-19
Consolidated Financial Statements
217
Key Audit Matter How our audit addressed the key audit matter
IT Systems and ControlsThe Company's key financial accounting and reporting processes are highly
dependent on the automated controls in information systems,
Wehave considered this as Key AuditMatter as any control lapses, Validation
failures, incorrect input data and wrong extraction of data may result in the financial
accounting and reporting records being misstated.
Wehavefocusedonuseraccessmanagement,changemanagement,segregation
of duties, system reconciliation controls and system application controls over key
financial accounting and reporting systems.
Wetestedasampleofkeycontrolsoperatingover
the information technology in relation to financial
accounting and reporting systems, including system
access and system change management, program
development and computer operations.
Wetestedthedesignandoperatingeffectivenessof
key controls over user access management which
includes granting access right, new user creation,
removal of user rights and preventative controls
designed to enforce segregation of duties.
Reliance was also placed on the System Audit report
of the Company.
Based on our review no weakness was found in the
IT Systems and Controls.
Key Audit Matters relating to Subsidiary: Sundaram Finance Holdings LimitedValuation of Unquoted investments fair valued through OCI The investment portfolio is valued at Rs.1,84,633 lakhs which represents almost
100% of the total assets, where unquoted equity investments fair valued through
OCI amounts to Rs.37,471 lakhs ("Investment") covering about 20% of investment
value as at 31st March 2019. As the above investment are not traded in the active
market, fair value of these investments involved significant management judgement
and estimate and were valued by Independent valuer / Valuation Expert in the
Group in the absence of an observable market price of these investments.
For determination of Fair Value, the market approach has been considered by the
valuer according to which the earnings and book value based market multiples
of listed peer companies in the same sector as that of the investments have been
used to determine the fair value of unquoted equity investments after adjusting
for illiquidity discount as determined by the valuer.
This valuation is a Level 3 type of valuation in accordance of Ind AS 113 Fair Value
Measurement where one or more significant inputs to the fair value measurement
are unobservable. Accordingly, the valuation of unquoted investment was considered
to be a Key Audit Matter, due to significant judgments associated with determining
the fair value of investment.
Reviewed the Accounting Policies used by the
Company for accounting and disclosing Investments
for compliance with the accounting framework.
Evaluating Independent Valuer / Valuation Expert's
competency, capabilities and objectivity.
Verified the correctness of market inputs used and
mathematical accuracy of the valuation analysis.
Assessed the adequacy of internal controls,
evaluated the design and tested the operating
effectiveness of such controls for initial recognition,
subsequent measurement and disclosure of
investments as on the reporting date as per
applicable regulations.
Our team was supported by our in-house valuation
specialist, especially in determining whether such
valuation methodology is consistent with the market
practice.
We also assessed whether the disclosures in
relation to investments are compliant with the
relevant Indian accounting requirements.

Sundaram Finance Limited
218
Management’s Responsibility for the Consolidated Financial Statements
The Company’s Board of Directors is responsible for the matters stated in section 134(5) of the Act with respect to preparation of these
consolidated financial statements that give a true and fair view of the consolidated financial position, consolidated financial performance,
consolidated total comprehensive income, consolidated changes in equity and consolidated cash flows of the Group including its Associates
and Joint ventures in accordance with the Ind AS and other accounting principles generally accepted in India . The respective Board of
Directors of the companies included in the Group and of its associates and Joint ventures are responsible for maintenance of the adequate
accounting records in accordance with the provisions of the Act for safeguarding the assets of the Group and for preventing and detecting
frauds and other irregularities; selection and application of appropriate accounting policies; making judgments and estimates that are
reasonable and prudent; and design, implementation and maintenance of adequate internal financial controls, that were operating effectively
for ensuring the accuracy and completeness of the accounting records, relevant to the preparation and presentation of the consolidated
financial statements that give a true and fair view and are free from material misstatement, whether due to fraud or error, which have
been used for the purpose of preparation of the consolidated financial statements by the Directors of the Holding Company, as aforesaid.
In preparing the consolidated financial statements, the respective Board of Directors of the companies included in the Group and of its
associates and
Joint ventures are responsible for assessing the Group’s ability to continue as a going concern, disclosing, as applicable, matters related
to going concern and using the going concern basis of accounting unless management either intends to liquidate the Group or to cease
operations, or has no realistic alternative but to do so.
The respective Board of Directors of the companies included in the Group and of its associates and Joint ventures is also responsible for
overseeing the financial reporting process of the Group and of its associates and Joint ventures.
Auditor’s Responsibilities for the Audit of the Consolidated Financial Statements
Our objectives are to obtain reasonable assurance about whether the consolidated financial statements as a whole are free from material
misstatement, whether due to fraud or error, and to issue an auditor’s report that includes our opinion. Reasonable assurance is a high
level of assurance, but is not a guarantee that an audit conducted in accordance with SAs will always detect a material misstatement when
it exists. Misstatements can arise from fraud or error and are considered material if, individually or in the aggregate, they could reasonably
be expected to influence the economic decisions of users taken on the basis of these consolidated financial statements.
As part of an audit in accordance with SAs, we exercise professional judgment and maintain professional skepticism throughout the audit.
Wealso:
a) Identify and assess the risks of material misstatement of the consolidated financial statements, whether due to fraud or error, design
and perform audit procedures responsive to those risks, and obtain audit evidence that is sufficient and appropriate to provide a basis
for our opinion. The risk of not detecting a material misstatement resulting from fraud is higher than for one resulting from error, as
fraud may involve collusion, forgery, intentional omissions, misrepresentations, or the override of internal control.
b) Obtain an understanding of internal financial controls relevant to the audit in order to design audit procedures that are appropriate in
the circumstances. Under section 143(3)(i) of the Act, we are also responsible for expressing our opinion on whether the Company
and its subsidiary companies which are companies incorporated in India, has adequate internal financial controls system in place
and the operating effectiveness of such controls.
c) Evaluate the appropriateness of accounting policies used and the reasonableness of accounting estimates and related disclosures
made by management.
d) Conclude on the appropriateness of management’s use of the going concern basis of accounting and, based on the audit evidence
obtained, whether a material uncertainty exists related to events or conditions that may cast significant doubt on the ability of the Group,
its associates and joint ventures to continue as a going concern. If we conclude that a material uncertainty exists, we are required to

Annual Report2018-19
Consolidated Financial Statements
219
draw attention in our auditor’s report to the related disclosures in the consolidated financial statements or, if such disclosures are
inadequate, to modify our opinion. Our conclusions are based on the audit evidence obtained up to the date of our auditor’s report.
However, future events or conditions may cause the Group, its associates and joint ventures to cease to continue as a going concern.
e) Evaluate the overall presentation, structure and content of the consolidated financial statements, including the disclosures, and whether
the consolidated financial statements represent the underlying transactions and events in a manner that achieves fair presentation.
f) Obtain sufficient appropriate audit evidence regarding the financial information of the entities or business activities within the Group,
itsassociatesandjointventurestoexpressanopinionontheconsolidatedfinancialstatements.Weareresponsibleforthedirection,
supervision and performance of the audit of the financial statements of such entities included in the consolidated financial statements
of which we are the independent auditors. For the other entities included in the consolidated financial statements, which have been
audited by other auditors, such other auditors remain responsible for the direction, supervision and performance of the audits carried
outbythem.Weremainsolelyresponsibleforourauditopinion.
WecommunicatewiththosechargedwithgovernanceoftheHoldingCompanyandsuchotherentitiesincludedintheconsolidatedfinancial
statements of which we are the independent auditors regarding, among other matters, the planned scope and timing of the audit and
significant audit findings, including any significant deficiencies in internal financial control that we identify during our audit.
Wealsoprovidethosechargedwithgovernancewithastatementthatwehavecompliedwithrelevantethicalrequirementsregarding
independence, and to communicate with them all relationships and other matters that may reasonably be thought to bear on our
independence, and where applicable, related safeguards.
From the matters communicated with those charged with governance, we determine those matters that were of most significance in the
auditoftheconsolidatedfinancialstatementsofthecurrentperiodandarethereforethekeyauditmatters.Wedescribethesemattersin
our auditor’s report unless law or regulation precludes public disclosure about the matter or when, in extremely rare circumstances, we
determine that a matter should not be communicated in our report because the adverse consequences of doing so would reasonably be
expected to outweigh the public interest benefits of such communication.
Other matters
(a) Wedidnotauditthefinancialstatements/financialinformationoffivesubsidiaries,whosefinancialstatements/financialinformation
reflect total assets of Rs.2,23,889.06 Lakhs as at 31st March, 2019, total revenues of Rs.47,565.11 Lakhs and net cash inflows amounting
to Rs.233.56 Lakhs for the year ended on that date, as considered in the consolidated financial statements. The consolidated financial
statements also include the Group’s share of net profit (including Other Comprehensive Income) of Rs.3,431.26 Lakhs for the year
ended 31st March, 2019, as considered in the consolidated financial statements, in respect of three associates, and a joint venture,
whose financial statements / financial information have not been audited by us. These financial statements / financial information have
been audited by other auditors whose reports have been furnished to us by the Management and our opinion on the consolidated
financial statements, in so far as it relates to the amounts and disclosures included in respect of these subsidiaries, joint venture
and associates, and our report in terms of sub-sections (3) and (11) of Section 143 of the Act, in so far as it relates to the aforesaid
subsidiaries, joint venture and associates, is based solely on the reports of the other auditors.
(b) The consolidated financial statements also include the Group’s share of net profit (including Other Comprehensive Income) of
Rs.5,322 Lakhs for the year ended 31st March, 2019, as considered in the consolidated financial statements in respect of a joint
venture, whose financial statements / financial information have not been audited by us. These statements have been audited by other
auditors under Indian GAAP and have been certified by the other auditors and the management of the said company under Ind AS
and have been furnished to us for the purpose of consolidation. Our opinion on the consolidated financial statements, in so far as it
relates to the amounts and disclosures included in respect of the above joint venture, and our report in terms of sub-sections (3) and
(11) of Section 143 of the Act in so far as it relates to the aforesaid joint venture, is based solely on such certified financial statements
/ financial information furnished to us by the management. In our opinion and according to the information and explanations given
to us by the Management, these financial statements / financial information are not material to the Group.

Sundaram Finance Limited
220
Our opinion on the consolidated financial statements, and our report on Other Legal and Regulatory Requirements below, is not modified
in respect of the above matters with respect to our reliance on the work done and the reports of the other auditors and the financial
statements / financial information furnished to us by the Management.
Report on Other Legal and Regulatory Requirements
1. As required by Section 143(3) of the Act, based on our audit we report that:
a) Wehavesoughtandobtainedalltheinformationandexplanationswhichtothebestofourknowledgeandbeliefwerenecessary
for the purposes of our audit of the aforesaid consolidated financial statements.
b) In our opinion, proper books of account as required by law relating to preparation of the aforesaid consolidated financial
statements have been kept so far as it appears from our examination of those books.
c) The Consolidated Balance Sheet, the Consolidated Statement of Profit and Loss (including Other Comprehensive Income),
Consolidated Statement of Changes in Equity and the Consolidated Statement of Cash Flows dealt with by this Report are in
agreement with the relevant books of account maintained for the purpose of preparation of the consolidated financial statements.
d) In our opinion, the aforesaid consolidated financial statements comply with the Ind AS specified under Section 133 of the Act,
read with Rule 7 of the Companies (Accounts) Rules, 2014.
e) On the basis of the written representations received from the directors of the Company as on March 31, 2019 taken on record by
the Board of Directors of the Company and its subsidiaries incorporated in India and the reports of the statutory auditors of its
subsidiary companies incorporated in India, none of the directors of the Group companies incorporated in India is disqualified
as on March 31, 2019 from being appointed as a director in terms of Section 164 (2) of the Act.
f) Withrespecttotheadequacyoftheinternalfinancialcontrolsoverfinancialreportingandtheoperatingeffectivenessofsuch
controls, refer to our separate Report in “Annexure A” which is based on the auditor’s reports of the Company and its subsidiary
companies incorporated in India. Our report expresses an unmodified opinion on the adequacy and operating effectiveness of
the internal financial control over financial reporting of those companies, for reasons stated therein.
g) The managerial remuneration has been paid and provided in accordance with the requisite approvals mandated by the provisions
of Section 197 of the Act read with Schedule V to the Act.
h) WithrespecttotheothermatterstobeincludedintheAuditor’sReportinaccordancewithRule11oftheCompanies(Auditand
Auditors) Rules, 2014, as amended in our opinion and to the best of our information and according to the explanations given to us:
i. The consolidated financial statements disclose impact of pending litigations on the consolidated financial position of the Group.
Refer Note 38.05 of the Consolidated Financial Statements.
ii. Based on the current assessment of the long term contracts, in the ordinary course of business, the holding company has
made adequate provision for losses where required as explained in Note 38.11 of the Notes to Accounts. The derivative
contracts being in the nature of the hedge contracts, the company does not anticipate any material losses from the same.
The subsidiaries, associates and joint ventures did not have any material foreseeable losses on long-term contracts including
derivative contracts.
iii. During the year, there has been no delay in transferring amounts, required to be transferred, to the Investor Education and
Protection Fund by the group and its associates and joint ventures incorporated in India.
For Sundaram & SrinivasanChartered Accountants
Firm Registration No.004207S
K.SrinivasanPlace: Chennai Partner
Date : 30th May 2019 Membership No. 5809

Annual Report2018-19
Consolidated Financial Statements
221
ANNEXURE “A” TO THE INDEPENDENT AUDITOR’S REPORT (Referred to in paragraph 1 (f) under ‘Report on Other Legal and Regulatory Requirements’
section of our report to the Members of Sundaram Finance Limited of even date)
Report on the Internal Financial Controls Over Financial Reporting under Clause (i) of Sub-section 3 of Section 143 of the Companies Act, 2013 (“the Act”)
In conjunction with our audit of the consolidated financial statements of the Company as of and for the year ended March 31, 2019, we
have audited the internal financial controls over financial reporting of Sundaram Finance Limited (hereinafter referred to as “Company”),
its subsidiary companies incorporated in India (the Holding Company and its Indian subsidiaries together referred to as “the Group”),
its associates and joint ventures, which are companies incorporated in India, as of that date.
Management’s Responsibility for Internal Financial Controls
The Board of Directors of the Holding Company, its subsidiary companies, associates and joint venture, which are companies incorporated
in India, are responsible for establishing and maintaining internal financial controls based on the internal control over financial reporting
criteria established by the respective Companies considering the essential components of internal control stated in the Guidance Note on
Audit of Internal Financial Controls Over Financial Reporting issued by the Institute of Chartered Accountants of India (“ the ICAI”). These
responsibilities include the design, implementation and maintenance of adequate internal financial controls that were operating effectively
for ensuring the orderly and efficient conduct of its business, including adherence to the respective company’s policies, the safeguarding
of its assets, the prevention and detection of frauds and errors, the accuracy and completeness of the accounting records, and the timely
preparation of reliable financial information, as required under the Companies Act, 2013.
Auditor’s Responsibility
Our responsibility is to express an opinion on the internal financial controls over financial reporting of the group and its associates and joint
ventures,whicharecompaniesincorporatedinIndia,basedonouraudit.WeconductedourauditinaccordancewiththeGuidanceNote
on Audit of Internal Financial Controls Over Financial Reporting (the “Guidance Note”) issued by the Institute of Chartered Accountants
of India and the Standards on Auditing, prescribed under Section 143(10) of the Companies Act, 2013, to the extent applicable to an
audit of internal financial controls. Those Standards and the Guidance Note require that we comply with ethical requirements and plan
and perform the audit to obtain reasonable assurance about whether adequate internal financial controls over financial reporting was
established and maintained and if such controls operated effectively in all material respects.
Our audit involves performing procedures to obtain audit evidence about the adequacy of the internal financial controls system over
financial reporting and their operating effectiveness. Our audit of internal financial controls over financial reporting included obtaining
an understanding of internal financial controls over financial reporting, assessing the risk that a material weakness exists, and testing and
evaluating the design and operating effectiveness of internal control based on the assessed risk. The procedures selected depend on the
auditor’s judgement, including the assessment of the risks of material misstatement of the financial statements, whether due to fraud or error.
Webelievethattheauditevidencewehaveobtainedandtheauditevidenceobtainedbytheotherauditorsintermsoftheirreportsreferred
to in the Other Matters paragraph below, is sufficient and appropriate to provide a basis for our audit opinion on the internal financial
controls system over financial reporting of the group and of its associates and joint ventures, which are companies incorporated in India.

Sundaram Finance Limited
222
Meaning of Internal Financial Controls Over Financial Reporting
A company’s internal financial control over financial reporting is a process designed to provide reasonable assurance regarding the reliability
of financial reporting and the preparation of financial statements for external purposes in accordance with generally accepted accounting
principles. A company’s internal financial control over financial reporting includes those policies and procedures that
(1) pertain to the maintenance of records that, in reasonable detail, accurately and fairly reflect the transactions and dispositions of the
assets of the company;
(2) provide reasonable assurance that transactions are recorded as necessary to permit preparation of financial statements in accordance
with generally accepted accounting principles, and that receipts and expenditures of the company are being made only in accordance
with authorisations of management and directors of the company; and
(3) provide reasonable assurance regarding prevention or timely detection of unauthorised acquisition, use, or disposition of the company’s
assets that could have a material effect on the financial statements.
Inherent Limitations of Internal Financial Controls Over Financial Reporting
Because of the inherent limitations of internal financial controls over financial reporting, including the possibility of collusion or improper
management override of controls, material misstatements due to error or fraud may occur and not be detected. Also, projections of any
evaluation of the internal financial controls over financial reporting to future periods are subject to the risk that the internal financial
control over financial reporting may become inadequate because of changes in conditions, or that the degree of compliance with the
policies or procedures may deteriorate.
Opinion
In our opinion and to the best of our information and according to the explanations given to us, the group, its associates and its joint
ventures which are companies incorporated in India, have, in all material respects, an adequate internal financial controls system over
financial reporting and such internal financial controls over financial reporting were operating effectively as at March 31, 2019, based
on the internal control over financial reporting criteria established by the respective companies considering the essential components of
internal control stated in the Guidance Note on Audit of Internal Financial Controls Over Financial Reporting issued by the ICAI.
Other Matters
Our aforesaid reports under Section 143(3)(i) of the Act on the adequacy and operating effectiveness of the internal financial controls
over financial reporting with reference to financial statements insofar as it relates to four Indian subsidiaries, two associates and two joint
ventures, which are companies incorporated in India, is based on the corresponding reports of the auditors of such companies.
For Sundaram & Srinivasan
Chartered Accountants
Firm Registration No.004207S
K.Srinivasan
Place: Chennai Partner
Date : 30th May 2019 Membership No. 5809

Annual Report2018-19
Consolidated Financial Statements
223
Form AOC-I(Pursuant to first provision to sub-section (3) of section 129 of the Companies Act, 2013,
read with rule 5 of Companies (Accounts) Rules, 2014)
Statement containing salient features of the financial statement of Subsidiaries/Associate companies/Joint Ventures
Part “A”: Subsidiaries(` in lakhs)
1 Sl. No. 1 2 3 4
2. Name of the subsidiary Sundaram Asset
Management
Company Limited
and it's subsidiaries
Sundaram Finance
Holdings Limited and
it's subsidiaries
Sundaram Trustee
Company Limited
LGF Services Limited
3. Date since when the Subsidiary
was acquired
26-02-1996 13-10-1993 02-12-2003 23-01-2004
4. Reporting period for the
subsidiary concerned, if
different from the holding
company’s reporting period
NA NA NA NA
5. Repor t ing currency and
Exchange rate as on the last date
of the relevant Financial year in
the case of foreign subsidiaries.
NA NA NA NA
6. Share capital 20,00.00 75,55.19 5.00 25.00
7. Other Equity 177,93.95 2290,06.59 1,75.06 3,42.46
8. Total assets 275,03.42 2452,51.83 2,00.76 3,72.66
9. Total Liabilities 77,09.48 86,90.04 20.70 5.21
10. Investments 11,75.30 2419,66.87 1,73.67 1,95.22
11. Turnover 330,28.47 102,65.23 1,54.67 38.00
12. Profit/(Loss) before taxation 42,80.46 42,04.41 1,11.43 33.74
13. Tax Expense 13,96.83 11,82.60 31.07 8.78
14. Profit/(Loss) after taxation 28,83.63 137,46.24* 80.36 24.97
15. Other Comprehensive Income (25.01) (556,13.64) – –
16. Total Comprehensive Income 28,58.62 (418,67.39) 80.36 24.97
17. Proposed Dividend 15,00.00 26,44.32 60.00 15.00
18. % of shareholding 1,00.00 26.47 1,00.00 1,00.00
Subsidiaries yet to commence operations : Nil
Subsidiaries liquidated or sold during the year : Nil
* Includes Share of profit from Associates `107,24.44 lakhs

Sundaram Finance Limited
224
Part “B”: Associates and Joint Ventures
Statement pursuant to Section 129 (3) of the Companies Act, 2013 related to Associate Companies and Joint Ventures(` in lakhs)
Name of Associates/Joint Ventures Sundaram BNP Paribas
Home Finance Ltd
Sundaram BNP Paribas
Fund Services Ltd
Royal Sundaram General
Insurance Company
Limited*
1. Latest audited Balance Sheet Date 31-03-2019 31-03-2019 31-03-2019
2. Date on which the associate/JV was acquired 02-07-1999 27-06-2008 22-08-2000
3. Shares of Associate/Joint Venture held by the
company on the year end
Number 507,28,473 229,51,530 2245,00,000
Amount of Investment in Joint Venture 152,57.75 22,95.15 585,37.34
Extend of Holding % 50.10 51.00 50.00
4. Description of how there is significant
influence
Joint Venture Joint Venture Joint Venture
5. Reason why the Associate/Joint Venture is not
consolidated
NA NA NA
6. Networth attributable to Shareholding as per
latest audited Balance Sheet
627,29.77 10,52.45 551,12.07
7. Total Comprehensive Income for the year
i. Considered in Consolidation 72,92.29 (4,43.22) 53,22.46
ii. Not Considered in Consolidation 72,63.18 (4,25.83) 53,22.46
S Viji S Prasad Chairman Director
T T Srinivasaraghavan Harsha Viji A N Raju Managing Director Deputy Managing Director Director (Operations)
M Ramaswamy P Viswanathan Chief Financial Officer Secretary & Compliance Officer
As per our report of even date attachedFor Sundaram & SrinivasanChartered AccountantsRegistration No.004207SK SrinivasanPartnerMembership No.5809Place : ChennaiDate : 30th May, 2019
Associates/Joint ventures yet to commence operations : NIL
Associates/Joint ventures liquidated or sold during the year : NIL
* Refer Note No. 44.01

Pondicherry
Goa
chhattisGarh
Bihar
Jharkhand
assam
naGaland
maniPur
uttar Pradesh
uttarakhand
GuJarat
himachal Pradesh
Jammu & kashmir
Sundaram Finance Branch Network – 658 Branches
delhi
West BenGal
haryana
orissa
PunJaB
telanGana
raJasthan
maharashtra
madhya Pradesh
kerala
andhra Pradesh
karnataka
tamil nadu