Embed Size (px)
DESCRIPTION
hgjhffg
Citation preview

7/21/2019 64-242-2-PB (1)
http://slidepdf.com/reader/full/64-242-2-pb-1 1/10
The analysis of May 29, 2012 flood phenomena in the lower sector of Slănic drainage basin (case of Cernăteşti locality area)
Romulus COSTACHE1 and Remus PRĂVĂLIE1*
1University of Bucharest, Faculty of Geography
* Correspondence to: Remus Prăvălie, University of Bucharest, Faculty of Geography, Romania. E-mail:[email protected].
©2013 University of Suceava and GEOREVIEW. All rights reserved.doi: 10.4316/GEOREVIEW.2013.22.1.64
Article history
Received: April 2013
Received in revised form: July
2003
Accepted: August 2013
Available online: Sept. 2013
KEY WORDS: Cernăteşti, Slănic catchment, flash-floods, flooding, socio-economic elements, impact.
1. Introduction
In the current stage, the rigorous forecast of hydrological risk phenomena such as floods andflash-floods is a very difficult task. Most of the speciality studies appeals to a range of
hydrological models (Reed et al., 2007, Looper & Vieux, 2012 etc.), meteorological (Koutroulis &Tsanis, 2010, Villarini et al., 2010 etc.) or hydrometeorological (Alfieri et al., 2012) related to thepattern of manifestation of flash-floods and floods, but these models have a series of drawbacksrelated to the precise predictability of intensity and frequency of these hydrological riskphenomena. In Romania, many specialty studies regarding surface runoff occurrence on theslopes and its potential to generate flash-floods and floodings, as a consequence, were realized(Bilaşco, 2008; Drobot & Chendeş, 2008; Mătreaţă& Mătreaţă, 2010; Teodor & Mătreaţă 2011;Zaharia et al, 2012 and others). Though, the compelling prediction of the areas with highpotential to hidric risk phenomena is limited. Therefore, methodology approach is beingcontinously improved.
At European level, Romania is among the first countries in terms of floods risk along with othercountries in Central and South-Eastern Europe (Roo et al., 2007). The main causes of floods are
ABSTRACT: This paper aims to analyze, especially in terms of space,the flood phenomenon in Cernăteşti locality, on May 29, 2012. In thecontext of high intensity torrential rains over a short period of time, inthis period occurred flash-floods of high intensity on Slănic river,
producing catastrophic floods in Cernăteşti locality. Thus, for a rigorousanalysis of spatial occurrence of these hydrological risk phenomena,were used detailed cartographic materials, such as the 1:5000topographic plans overlapped to the analyzed territory. Also, weanalyzed the synoptic conditions directly responsible for the extent of the flooding process, which resulted in disastrous effects on the socio-economic component. The results certified that, due to the synergybetween torrential rainfall and the local morphometry, 60 ha of theSlănic flood plain sector was flooded in the area of Cernăteşti locality,with more than 20 buildings and almost 500 m of the local accessiblityinfrastucture damaged.

7/21/2019 64-242-2-PB (1)
http://slidepdf.com/reader/full/64-242-2-pb-1 2/10
The analysis of May 29, 2012 flood phenomena in the lower sector of Slănic drainage basin (Cernăteşti area) 79
GEOREVIEW, Vol. 22 (2013)
linked in most situations to flash-floods that occur upstream of the affected localities. This is alsothe situation for the area of locality Cernăteşti, described in the present work, an area which wasintensely affected by floods in 2012, this event being possible in the synergistic context both of favourable factors from upstream for flash-floods occurrence on Slănic river (later it turns intoflooding downstream) and the lack of a viable system of forecasting and warning from the
competent authorities.This paper aims to investigate both synoptic conditions directly responsible for triggering floodsphenomena on May 29, 2012 in the locality Cernăteşti, but especially the spatial delimitation of areas affected by these extreme hydrometeorological phenomena with negative impact on socio-economic elements.
2. The study area in the context of floods phenomena occurrence
The study area, space of the Cernăteşti locality, is in the lower sector of Slănic catchment in thevicinity of the confluence of rivers Slănic and Buzău (figure 1). Slănic catchment is part of Buzăucatchment and it occupies in the Subcarpathian sector an area of approximately 320 km². Slăniccatchment is predisposed to hydrological risk phenomena such as flash-floods and floods in thesynergistic context of favourable factors such as low grade of hydrotechnical arrangement, largeslopes with spread potential of flash-floods and flooding in downstream areas, highdeforestation, etc.

7/21/2019 64-242-2-PB (1)
http://slidepdf.com/reader/full/64-242-2-pb-1 3/10
80 ROMULUS COSTACHE and REMUS PRĂVĂLIE
GEOREVIEW, Vol. 22 (2013)
Figure 1. Location of Cernăteşti locality in Slănic catchment. This figure is available in colour online atwww.georeview.ro.
A main component that plays an essential role in forming flash-floods and floods is representedby topographical peculiarities. According to some speciality studies, Slănic catchment has amongthe highest values of surface runoff in entire Subcarpathian sector of Buzău catchment (Costache
& Prăvălie, 2013; Prăvălie & Costache, 2013). Thus, there is a high potential for triggering flash-floods, especially in the northern sector of the basin, causing to their turn a major potential totrigger flooding downstream. It represent the main cause of the events on May 29, 2012, when,after the occurrence of heavy rains in the upper sector of river Slănic, were triggered floodsdownstream where the peculiarities of the river bed (bed with small depths and large widths)favored and more the inundability of agricultural and built areas.
The substrate of the study area is generally composed of sandstone, schisty flysch, marl and clayformations, rocks which are generally characterised by low water permeability (Scrădeanu &Alexandru, 2007) and increase surface runoff. The most important harsh rocks which cause a lowwater infiltration and surface runoff are Răchitașu sandstones and the schisty flysch. These rocks
are found in the upper area of the basin, on a 49,07 sq m surface.
Slope is one of the morphometric factors that have a decisive role in surface runoff. In Slănic riverbasin, slopes are high, exceeding 15° on more than 13% of its area, especially on the upper areaof the basin. Flash-flood waves go towards water accumulation areas, with slope values less 3°along the major riverbeds of the main water flows. In this case, localities along Slănic river mustbe mentioned: Lopătari, Mânzălești, Vintilă Vodă, Beceni and Cernătești. Convex surfaces,
described by the profile curvature, where surface runoff occurrs, are found on almost 42% of thetotal area.
The shape of Slănic sub-basins is also very important for flash-flood waves genesis. The sub-
basins circularity ratio is high, exceeding 0.55 (Pecineaga, Coca, Plăvăț, Jghiab). The circularityratio was obtained by applying the following formula: 4πF / P2, where F is the basin surface and Pits perimeter (Pișota et al., 2010).
According to the land use dinamics in Slănic river basin, forests have considerably decreasedduring 1990-2006, with almost 4000 Ha (Corine Land Cover 1990, 2006). This is very importantfor the surface runoff balance, because forest areas have an important role in moderatingsurface runoff, by interception and water volume diminishing.
3. Methodology
In order to analize the metheorological conditions mainly responsible for the flash-floods thatoccured on the specific date, in a first stage the synoptic atmospheric conditions responsible forthe large amount of precipitations on 29 May were analyzed by using data on the relative barictopography between levels of 500-1000 hPa from the european (german) data platformwetter3.de. Data from hydrometric station Cernăteşti about level and flow of Slănic riverrecorded on 29 May, 2012, were used.
The second stage was to achieve a spatial model of the topography of the land for the space of locality Cernăteşti (figure 1). For a rigorous spatial analysis was used 1 : 5000 topographic plan
from mentioned space, being extracted contour lines with an equidistance of 2.5 m. Topographic
7/21/2019 64-242-2-PB (1)
http://slidepdf.com/reader/full/64-242-2-pb-1 4/10
The analysis of May 29, 2012 flood phenomena in the lower sector of Slănic drainage basin (Cernăteşti area) 81
GEOREVIEW, Vol. 22 (2013)
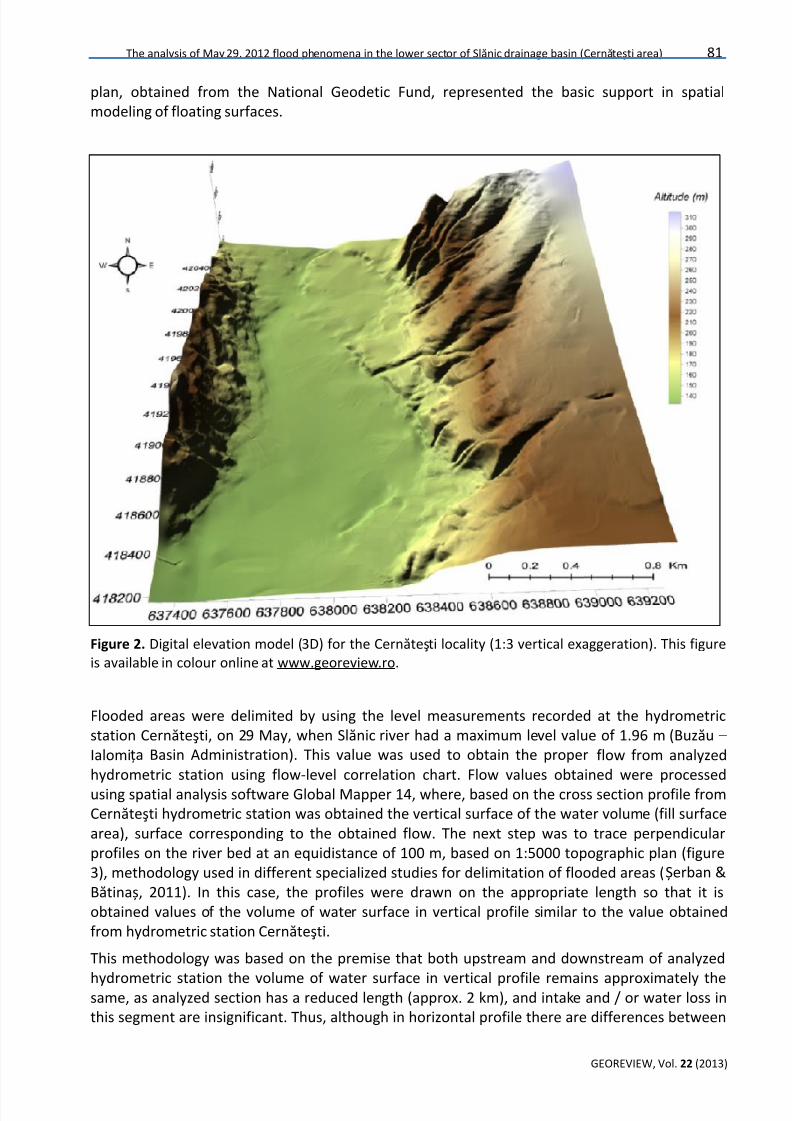
plan, obtained from the National Geodetic Fund, represented the basic support in spatialmodeling of floating surfaces.
Figure 2. Digital elevation model (3D) for the Cernăteşti locality (1:3 vertical exaggeration). This figureis available in colour online at www.georeview.ro.
Flooded areas were delimited by using the level measurements recorded at the hydrometricstation Cernăteşti, on 29 May, when Slănic river had a maximum level value of 1.96 m (Buzău –Ialomița Basin Administration). This value was used to obtain the proper flow from analyzedhydrometric station using flow-level correlation chart. Flow values obtained were processed
using spatial analysis software Global Mapper 14, where, based on the cross section profile fromCernăteşti hydrometric station was obtained the vertical surface of the water volume (fill surfacearea), surface corresponding to the obtained flow. The next step was to trace perpendicularprofiles on the river bed at an equidistance of 100 m, based on 1:5000 topographic plan (figure3), methodology used in different specialized studies for delimitation of flooded areas (Șerban &Bătinaș, 2011). In this case, the profiles were drawn on the appropriate length so that it isobtained values of the volume of water surface in vertical profile similar to the value obtainedfrom hydrometric station Cernăteşti.
This methodology was based on the premise that both upstream and downstream of analyzed
hydrometric station the volume of water surface in vertical profile remains approximately thesame, as analyzed section has a reduced length (approx. 2 km), and intake and / or water loss inthis segment are insignificant. Thus, although in horizontal profile there are differences between

7/21/2019 64-242-2-PB (1)
http://slidepdf.com/reader/full/64-242-2-pb-1 5/10
82 ROMULUS COSTACHE and REMUS PRĂVĂLIE
GEOREVIEW, Vol. 22 (2013)
the flooded areas, in vertical profile the water volume surface remains similar in the analyzedsegment of the river Slănic, as previously mentioned considerations. Joining the 20 profiles is thelast step in delimiting flooded areas.
Figure 3. Marking perpendicular profiles for Slănic river bed (100 m equidistance), in order to delimitthe flooded area on 29 May, 2012. This figure is available in colour online at www.georeview.ro.

7/21/2019 64-242-2-PB (1)
http://slidepdf.com/reader/full/64-242-2-pb-1 6/10
The analysis of May 29, 2012 flood phenomena in the lower sector of Slănic drainage basin (Cernăteşti area) 83
GEOREVIEW, Vol. 22 (2013)
To delimit the affected socio-economic elements were mapped based on 1:5000orthophotoplans, 2008 edition, houses and outbuildings, and also access infrastructure from thearea of the Cernăteşti locality. Even if many social-economical vulnerbaility to hidric riskphenomena indexes can be found in the specialty literature (Sorocovschi, 2010), the analysis inthe present study focuses on a spatial index of vulnerability, obtained by identifying the number
of buildings and the accessibility infrastructure (which are considered very important social-economical elements) from the study area.
4. Results and discussions
The end of May of 2012 meant for the south-eastern Romania a period of intense rainfall causingflash-floods and floods in several areas of rivers. Significant rainfall occurred in May 29 when thecore of cold air from altitude shown on the map of relative baric topography between 500-1000hPa , caused sharp instability of atmosphere (figure 4).
Figure 4. Representation of relative baric topography between 500-1000 hPa on the 29.V.2012(Source: wetter3.de). This figure is available in colour online at www.georeview.ro.
Thereby the type Cb convection cells that arose by strong upward convection of warmer air fromthe ground, generated torrential rains that have come to cumulate 78.2 mm in the weatherstation Bisoca, a value that represents approximately 10% of total average multiannual amountat this station (National Meteorology Administration).

7/21/2019 64-242-2-PB (1)
http://slidepdf.com/reader/full/64-242-2-pb-1 7/10
84 ROMULUS COSTACHE and REMUS PRĂVĂLIE
GEOREVIEW, Vol. 22 (2013)
The high intensity of rainfall recorded on this day, in the Curvature area of Carpathians,generated a flash-flood wave on Slănic river, causing flooding of several households in localitiesalong the river valley. Among these localities was the village Cernăteşti from the lower sector of Slănic, where the flash- floods peak flow of 92.4 m3 / s and the maximum corresponding level of 136 cm (reported to the 0-levelling rod level) were occurred at 17 o’clock (figure 6). According todata recorded at the Bisoca meteorological station located in the upper sector of Slăniccatchment (figure 1), the maximum hourly amount of rainfall was recorded at 6 o’clock, whichwas of 22.8 mm (figure 5).
Liquid flow had a simplistic character (a single top). According to Buzău – Ialomița BasinAdministration data, water discharge increased in 11 hours almost 10 times (from 8.36 m³/s to 92m³/s) (figure 5). Until the end of the day, water discharge decreased to 35,6 m³/s, the decreasingline being slower than the increasing line.
Figure 5. Evolution of hourly rainfall (mm) at the meteorological station Bisoca (right) and hourly
water flow (m3/s) at hydrometric station Cernăteşti (left) of 29 V 2012.
The measurements from the day of May 29, 2012, in the Cernăteşti hydrometric station revealedan increase of over 17 times of the level (from 8 cm to 136 cm, reported in 0-levelling rod level)and over 11 times for the flow of the river (from 8 , 36 m3 / s to 92.4 m3 / s) between the hours of 6 and 17 (figure 6) the time at which were recorded the maximum values of the two hydrologicalparameters (Buzău-Ialomiţa Basin Administration). Exponential increase in the level of riverrelative to its flow in the section of Cernăteşti hydrometric station was found and in thecorrelation chart (figure 6).

7/21/2019 64-242-2-PB (1)
http://slidepdf.com/reader/full/64-242-2-pb-1 8/10
The analysis of May 29, 2012 flood phenomena in the lower sector of Slănic drainage basin (Cernăteşti area) 85
GEOREVIEW, Vol. 22 (2013)
Figure 6. The correlation between the level of the river and the river flow of Slănic river in Cernăteştion the 29.V.2012.
From the point of view of flooded areas, after applying the above described methodology, wasdelineated a flooded area (corresponding to the maximum level at 17 o’clock) of approximately63 ha (figure 6). This area included most of Slănic river valley, where there are constructions and
road infrastructure elements. Thus, about 20 constructed elements were flooded (representingalmost 3% of all households in the village) on the left side of the river and a segment of 457 m of a communal way (figure 7) located on the right side of the river in its flow direction. Other riskelements affected by the flood in 29 May are agricultural lands (usually vegetable) located in theriver valley on the left of it (Corine Land Cover, 2006).
Figure 7. Delimitation based on terrain digital model (scale 1: 5000) of floated areas in the afferentspace of the Cernăteşti locality (1:2.5 vertical exaggeration). This figure is available in colour online atwww.georeview.ro.
Besides the climatic factor, which produced by its very high intensity the occurrence of a strongflash-flood wave, to the flood formation in the perimeter of Cernăteşti village contributed andthe riverbed configuration of Slănic river in this sector. Thus the shallow depth of minor riverbedcorroborated with its large width, frequently generate flooding of the river in the major riverbedas a result of flash-flood waves propagated from upstream.

7/21/2019 64-242-2-PB (1)
http://slidepdf.com/reader/full/64-242-2-pb-1 9/10
86 ROMULUS COSTACHE and REMUS PRĂVĂLIE
GEOREVIEW, Vol. 22 (2013)
5. Conclusions
The major cause of these hydric risk phenomena is the morphometric and hydrographical
peculiarities of Slănic catchment, taken together. These features, combined with extremeweather events such as torrential rains of short duration and high intensity are the triggeringprerequisites of the hydrometeorological risk phenomena with great potential for the productionof socio-economic damages. Particularly, the conditions of occurrence especially upstream of flash-flood waves (and to a lesser extent the surface runoff on the slopes corresponding to thevillage Cernăteşti) in the context of strong torrential rains have caused major floods in the lowersector of Slănic catchment, with Cernăteşti locality being among most affected villages in thefloodplain of the river. A major cause in the floods formation was represented also by theparticularities of the riverbed with large width and low depth in the sector of the studied village.
In these circumstances, is necessary therefore an anthropogenic intervention for the
arrangement of Slănic river in highly vulnerable areas, this responsibility belonging to thecompetent authorities regardless of projection costs involved.
AcknowledgementsThis paper has been financed through the contract POSDRU/86/1.2/S/57462, strategic project“Education and professional training in support of the economic growth and the development of theknowledge-based society”, “Quality in the higher education”, co-financed by the European SocialFund, through the Sectorial Operational Programme for the Human Resources Development 2007-2013.
References
Alfieri L., Thielen J., Pappenberger F. 2012. Ensemble hydro-meteorological simulation for flashflood early detection in southern Switzerland, Journal of Hydrology 424–425: 143–153.
Bilaşco Ş. 2008. Implementarea G.I.S. în modelarea viiturilor de versant , Casa Cărţii de Ştiinţă,Cluj-Napoca.
Costache R., Prăvălie R. 2013. Manifestation potential of surface runoff obtained on the basis of the digital elevation model. Case study: the Subcarpathian sector of Buzău Catchment (inpress), Studia Universitatis Babeș-Bolyai .
Drobot R. & Chendeş V. 2008. Metodologie simplificată pentru identificarea bazinelorgeneratoare de viituri rapide, Silvologie, vol. VI, Editura Academiei Române, p. 265-284.
Koutroulis A. G., Tsanis I. K. 2010. A method for estimating flash flood peak discharge in a poorlygauged basin. Case study for the 13–14 January 1994 flood, Giofiros basin, Crete, Greece,
Journal of Hydrology 385: 150–164.
Looper J. P., Vieux B. E. 2012. An assessment of distributed flash flood forecasting accuracy usingradar and rain gauge input for a physics-based distributed hydrologic model, Journal of
Hydrology 412–413: 114–132.

7/21/2019 64-242-2-PB (1)
http://slidepdf.com/reader/full/64-242-2-pb-1 10/10
The analysis of May 29, 2012 flood phenomena in the lower sector of Slănic drainage basin (Cernăteşti area) 87
GEOREVIEW, Vol. 22 (2013)
Mătreaţă M. & Mătreaţă S. 2010. Metodologie de estimare a potenţialului de producere de viiturirapide în bazine hidrografice mici , Comunicări de Geografie, Vol. XIV, Editura Universităţii dinBucureşti, Bucureşti.
Pișota I., Zaharia L., Diaconu D. 2010. Hidrologie, Editia a II-a revizuită și adăugită, EdituraUniversitară București.
Reed S., Schaake J., Zhang Z. 2007. A distributed hydrologic model and threshold frequency-based method for flash-flood forecasting at ungauged locations, Journal of Hydrology 337:402–420.
Roo A. D., Barredo J., Lavalle C., Bodis K. and Bonk R. 2007. Potential flood hazard and riskmapping at Pan-European scale, in Digital terrain modelling Development and applications in
a policy support environment , Peckham R. J. and Jordan G. (Eds), Springer Berlin Heidelberg,pag. 183-202.
Scrădeanu D., Alexandru Gh. 2007. Hidrogeologie generală, Editura Universităţii din Bucureşti,Bucureşti.
Şerban Gh., Bătinaş R.H. 2011. Iniţiere în G.I.S. şi aplicaţii în Hidrologie. Edit. Presa UniversitarăClujeană, ISBN 978-973-595-308-9, Cluj-Napoca.
Sorocovschi V. 2010. Vulnerabilitatea asezarilor rurale. Puncte de vedere, Riscuri si catastrofe, volVIII, nr. 1.
Teodor S. & Mătreaţă S. 2011. A way of determining how small river basins of Somes River aresusceptible to flash-floods, Carpathian Journal of Earth and Environmental Sciences 6(1): 89-98.
Villarini G., Krajewski W. F., Ntelekos A., Georgakakos K. P., Smith J. A. 2010. Towardsprobabilistic forecasting of flash floods: The combined effects of uncertainty in radar-rainfall
and flash flood guidance, Journal of Hydrology 394:275–284.Zaharia L., Minea G., Toroimac G. I., Barbu R., Sârbu I. 2012. Estimation of the Areas with
Accelerated Surface Runoff in the Upper Prahova Watershed (Romanian Carpathians),Balwois, Republic of Macedonia, available onhttp://ocs.balwois.com/index.php?conference=BALWOIS&schedConf=BW2012&page=paper&op=view&path%5B%5D=595&path%5B%5D=259.
*** 1986, Topographical plan, 1: 5000, Fondul Geodezic Național (National Geodetic Fund).
*** 1990, Corine Land Cover, raster data, European Environment Agency (eea.europa.eu).
*** 2006, Corine Land Cover, raster data, European Environment Agency (eea.europa.eu).
*** 2008, Orthophotomaps, 1:5000 scale, the National Agency of Cadastre and Real EstateAdvertising.
*** Buzău – Ialomița Basin Administration.
*** National Administration Meteorology.
*** http://www.bluemarblegeo.com/products/global-mapper.php (two weeks free licence).
*** http://www.wetter3.de/archiv/.


![mlit.go.jp · 2019. 2. 1. · [235] [235) 123 [24.2] [240] [240] [24.3] [242 [242 [242] [242) [245 43] [242 (242 [242] [24.2] [ú.2] [242] [242 [240] [242] 27 087 087 [24.6] [24.6]](https://img.dokumen.tips/doc/110x75/613019b41ecc51586943e0fb/mlitgojp-2019-2-1-235-235-123-242-240-240-243-242-242-242.jpg)


![Determination of Pb-210 and Po-210 in Water Using the Extractive … · 2013. 9. 4. · LLD Pb-210 Activity-concentration [mBq/L] Rn-222 242 · 103 Time between sampling and evaporation](https://img.dokumen.tips/doc/110x75/60c44fa0368dd31ca162a58a/determination-of-pb-210-and-po-210-in-water-using-the-extractive-2013-9-4-lld.jpg)