Embed Size (px)
Citation preview

61ST ANNUAL REPORT 2011MURRAY GOULBURN CO–OPERATIVE CO. LIMITED

MURRAY GOULBURN OVERVIEW
THE ANNUAL GENERAL MEETING OF MURRAY GOULBURN CO-OPERATIVE CO. LIMITED WILL BE HELD AT 1.30PM ON WEDNESDAY 30 NOVEMBER 2011 IN THE MEMBERS’ LOUNGE, MOONEE VALLEY RACECOURSE, MCPHERSON STREET, MOONEE PONDS
REGISTERED OFFICE & PRINCIPAL PLACE OF BUSINESS 140 DAWSON STREET, BRUNSWICK VICTORIA 3056, ACN 004 277 089, ABN 23 004 277 089
BANKERS ANZ BANKING GROUP LIMITED, THE BANK OF TOKYO MITSUBISHI UFJ LTD, BNP PARIBAS, COMMONWEALTH BANK OF AUSTRALIA, NATIONAL AUSTRALIA BANK LTD, WESTPAC BANKING CORPORATION
SOLICITORS GADENS LAWYERS, CORRS CHAMBERS WESTGARTH, BARBOUR ARNOLD & COUSINS
AUDITOR DELOITTE TOUCHE TOHMATSU
EQUITY $’000
PRIMARY PRODUCTION tonnes
SALES REVENUE $’000
MILK PROCESSED million litres

FACTS AT A GLANCE ($ MILLIONS)
EXPORT SALES REVENUE $AUD’000
EXPORT VOLUME tonnes
2011 2010 2009 2008 2007
SALES REVENUE 2,287 2,163 2,329 2,572 2,119PROFIT BEFORE INCOME TAX 40 25 [25] 101 26TOTAL EQUITY 788 719 727 759 657ISSUED CAPITAL 235 233 230 214 207RESERVES AND RETAINED EARNINGS 453 394 403 445 353TOTAL ASSETS 1,530 1,519 1,578 1,790 1,483MILK INTAKE (MILLION LITRES) 2,946 3,104 3,512 3,250 3,335TOTAL EXPORT REVENUE 1,163 1,155 1,197 1,437 1,206
TOTAL ASSETS $’000

02
CONTENTS
03 BOARD OF DIRECTORS
04 CHAIRMAN’S REPORT
10 OPERATIONS REVIEW
22 EXECUTIVE LEADERSHIP TEAM
31 FINANCIAL REPORT
MURRAY GOULBURN CO-OPERATIVE CO. LIMITED AND CONTROLLED ENTITIES 2011

03
IAN C. BIRD COMPANY SECRETARY B. BUS. CPA
KENNETH W. JONES DAIRYFARMER DIRECTOR SINCE 2008 ADVANCED DIPLOMA AGR. CHAIRMAN – AUDIT COMMITTEE
WILLIAM T. BODMAN DAIRYFARMER DIRECTOR SINCE 2009 B. AGR. SC., MAICD GAICD
GRANT J. DAVIES CHAIRMAN DAIRYFARMER DIRECTOR SINCE 2004 MAICD CHAIRMAN – REMUNERATION COMMITTEE
PETER J.O. HAWKINS NON–EXECUTIVE DIRECTOR SINCE 2009 BCA (HONS) FAICD SFFIN FAIM ACA (NZ)
STEPHEN J. O’ROURKE MANAGING DIRECTOR DIRECTOR SINCE 1993 B.COMM, ACA
MARTIN J. VAN DE WOUW DAIRYFARMER DIRECTOR SINCE 2010
STEPHEN T. MILLS DAIRYFARMER DIRECTOR SINCE 2001 FAICD DIRECTOR – DAIRY TECHNICAL SERVICES LTD
JOHN P. PYE DAIRYFARMER DIRECTOR SINCE 2005 ADVANCED DIPLOMA AGR. MAICD CHAIRMAN – SUPPLIER RELATIONS COMMITTEE
GRAHAM N. MUNZEL DAIRYFARMER DIRECTOR SINCE 2008 GAICD CHAIRMAN – ZONE COMMITTEE
PHILIP W. TRACY DAIRYFARMER DIRECTOR SINCE 2009 B. EC & COMM. CA. SIA. GAICD
JOHN T. VARDY DEPUTY CHAIRMAN DAIRYFARMER DIRECTOR SINCE 1998 DIP. COMPANY DIRECTORS (ANU) CHAIRMAN – FINANCE COMMITTEE
DONALD F. HOWARD DAIRYFARMER DIRECTOR SINCE 1997 DIP. COMPANY DIRECTORS (ANU), MAICD CHAIRMAN – COMPLIANCE COMMITTEE DIRECTOR – COBDEN & DISTRICTS COMMUNITY FINANCE LIMITED
BOARD OF DIRECTORS

There was continued improvement in international and domestic dairy prices during the year which Murray Goulburn Co–operative duly passed on through higher farmgate returns and dividends. I am pleased to report that the combination of better returns and improved seasonal conditions saw confidence start to return to the Australian dairy industry after one of the toughest decades in the industry’s proud history.
The continued improvement in market conditions was fuelled by relatively strong demand for dairy products around the world and some concerns about the ability of major suppliers of product to meet that demand. The strength of many Asian economies and the developing middle class remained a clear trend along with solid demand growth in the Australian market.
Higher hard commodity prices during the year driven by the Asian growth economies correlated positively with soft commodity prices like dairy products. This lift in dairy prices co–incided with an appreciation in the Australian dollar which placed downward pressure on Australian dollar returns.
Consequently Murray Goulburn ended the year paying its 2,580 dairy farmer / shareholders the second highest farmgate milk price on record. The final average milk price was A$5.64 per kg/milk solids (on an available weighted average basis) or about 42.5 cents per litre.
While some regions across the state experienced excellent seasonal conditions, severe wet conditions and flooding affected several key Murray Goulburn Co–operative districts in both the northern and southern part of the milk collection area.
These conditions, along with the shortage of dairy cattle in Australia brought about by years of drought, saw milk processed by Murray Goulburn reduced by about 6% to 2.9 billion litres. We expect to see recovery in milk supply in FY12.
Total revenue for the year was A$2.29 billion and net profit before tax was A$40 million. This reflected a continuing recovery of the financial performance of the co–operative since the GFC.
Murray Goulburn’s mission to maximise returns to our dairy farmer/suppliers was further evidenced just after year end when the Board declared a 12% dividend on all ordinary shares. This was in addition to the 1 for 10 bonus share offer on ordinary shares that took place in April 2011.
After 13 years as Managing Director and 24 years with Murray Goulburn Co–operative, Stephen O’Rourke retired from his role with the company in July 2011.
During this time Stephen provided the essential leadership for an extraordinary era of growth and development for Murray Goulburn Co–operative as Australia’s most important farmer–owned dairy company and a leader in both dairy ingredients and consumer goods.Under Stephen’s leadership over the last 13 years revenues increased by nearly $1.5 billion to peak at more than $2.5 billion; domestic sales more than doubled to over $1 billion and there was an almost three–fold increase in shareholder equity to more than $700 million.
Stephen led Murray Goulburn through some very difficult times including deregulation, drought and the Global Financial Crisis. Meanwhile he steadily implemented a guiding strategy to transform Murray Goulburn Co–operative from a commodity based business to a more customer–focused and value–adding dairy company.
Stephen’s operating principle was that the Co–operative’s relationships with supplier/shareholders came first. He was committed to face–to–face communication and believed strongly in the co–operative model. His focus has always been on maximizing the farmgate milk price and improving returns for dairy farmers.
We thank Stephen for his vision, commitment, passion to Murray Goulburn and the co–operative movement.
Neil Longstaff took on the role of interim CEO, in the period between Stephen retiring and the new Managing Director commencing. We also thank Neil for his commitment during this period.
On 15 June 2011 the Board announced the appointment of Mr Gary Helou as the new Managing Director. Gary comes with a wealth of experience in the co–operative movement, manufacturing and the development of fast moving consumer goods.
As Chief Executive of Ricegrowers Limited from 1999 to 2011, Gary led the transformation of Ricegrowers to an integrated global company with strong brands and processed products.
Gary’s appointment followed an extensive search process which the Board initiated following the announcement of Stephen O’Rourke’s retirement from the role in November 2010. The field of candidates was outstanding. At the conclusion of the process the Board was delighted to have secured a person of Gary’s calibre to the role.
The future demand for food and dairy products looks positive and we look forward to building on that outlook under Gary’s leadership.
Following the formation of the joint venture Danone – Murray Goulburn Pty Ltd to manufacture Danone products from our Kiewa site in northeast Victoria – I am pleased to report that after 10 months construction, yoghurt production commenced during March 2011. Following the initial launch of the Activia brand – the product has been ranged extensively throughout Australia and the enterprise is performing in line with our expectation.
Since Murray Goulburn’s very successful entry into Tasmania in 2007, the Co–operative has been active in pursuit of growth opportunities in that state.
Tasmanian milk production has been growing solidly in recent years and consequently new processing capacity is required in the state.
Murray Goulburn’s investment in TDP is a signal to the Tasmanian dairy industry of the Co–operative’s confidence in the State’s growth potential.
By investing in TDP, Murray Goulburn aims to have access to a growing milk supply region; access to ingredients via TDP to meet growing demands from key customers and achieve operational benefits via synergies with existing parts of the MG business.
04
CHAIRMAN’S REPORTGRANT J. DAVIESCHAIRMAN
MURRAY GOULBURN CO-OPERATIVE CO. LIMITED AND CONTROLLED ENTITIES 2011

05

During the year Murray Goulburn Co–operative contributed strongly to external matters that had the potential to significantly impact on the company and its farmers. The Australian Government’s proposed carbon tax and Murray Darling Basin reforms were high on our agenda and Murray Goulburn was a leader in the carbon tax debate with clear messages and policies. These matters will remain on the policy agenda for years to come and the company will continue to address them from a policy and business strategy standpoint.
After thirty years at our Brunswick site it was apparent in recent times that the offices were no longer suitable. Following a comprehensive review we decided to relocate to the Essendon Fields. The new building will be constructed and fitted out over the coming twelve months. The modern facility is expected to provide a productive work environment for both staff and visitors and will balance contemporary design principles with cost consciousness.
Constitutional changes made in 2009 rationalised zones from ten to three for director representation (now Western, Northern and Gippsland) – each region having three directors. The Western Region; stretching from Victoria into South Australia was the first region to have elections under the new structure. Don Howard and John Pye were re–elected to the Board and Martin Van de Wouw was newly elected.
Following a lengthy discussion at the AGM in November 2010, the consideration of proposed changes to the constitution was deferred and an extraordinary general meeting was called specifically for the purpose of considering the matters.
Amendments were duly adopted that modernised the qualifications for directors of the company. We sincerely thank members for their input into these matters.
During the year the directors commenced a board review process which is aimed at all board processes and performance requirements and is designed to yield recommendations that will improve Board operations into the future.
There have been many challenges at Murray Goulburn Co–operative this year, and I would like to acknowledge the support of our staff in guiding us all through these challenges. From late on Friday January 14 2011, it became apparent that Rochester township was going to receive a severe flood and that the Murray Goulburn site (located in the centre of town) would be impacted. There was a systematic shut down of the site and by Saturday morning water was entering many parts of the factory.
The Rochester Murray Goulburn Trading Store was also flooded but staff were able to save most of the stock by moving it above the flood level.
I also note the efforts of our Koroit Trading Store staff in dealing with a major fire during the year.
The Rochester factory remained closed for several weeks. Management and staff did an incredible job in the clean up and I note their efforts with my sincere thanks. Thanks to these efforts the site was restarted as soon as possible after subsidence of the floodwater without risk to staff safety or product integrity. In the same flood event about 125 Murray Goulburn farms across the state – particularly the northern and western districts suffered direct impacts. Some Murray Goulburn farms were inundated with flood water for several months. About 20 farms moved their milking herds to other properties. Many others lost pastures and fodder.
Events like these bring out the best in Murray Goulburn people. Our dairy farmers opened their dairies to their neighbours to milk their cows. Our field staff and transport drivers worked tirelessly to support affected farm businesses. The community rallied to protect houses, sheds and livestock. And the farming families affected fought to return to their farms and to face yet another challenge head on.
As I retire I would like to take the opportunity to thank all those that have supported me during my seven years as a director and more recently as chairman of Murray Goulburn.
Our business partners, staff, suppliers/shareholders have all made the position of director and chairman one that I have enjoyed particularly because of the friendships and relationships I have made. Importantly I have seen Murray Goulburn continue to grow its importance in the Australian dairy industry.
We have a great co–operative, one that plays a vital role in the Australian dairy industry, and if we all work together our industry and Murray Goulburn will continue to build wealth for all Australian dairy farmers.
06
CHAIRMAN’S REPORT[CONTINUED]
EVENTS LIKE THESE BRING OUT THE BEST IN MURRAY GOULBURN PEOPLE. OUR DAIRY FARMERS OPENED THEIR DAIRIES TO THEIR NEIGHBOURS TO MILK THEIR COWS. OUR FIELD STAFF AND TRANSPORT DRIVERS WORKED TIRELESSLY TO SUPPORT AFFECTED FARM BUSINESSES. THE COMMUNITY RALLIED TO PROTECT HOUSES, SHEDS AND LIVESTOCK. AND THE FARMING FAMILIES AFFECTED FOUGHT TO RETURN TO THEIR FARMS AND TO FACE YET ANOTHER CHALLENGE HEAD ON.
MURRAY GOULBURN CO-OPERATIVE CO. LIMITED AND CONTROLLED ENTITIES 2011

07

UNDER STEPHEN’S LEADERSHIP OVER THE LAST 13 YEARS REVENUES INCREASED BY NEARLY $1.5 BILLION TO PEAK AT MORE THAN $2.5 BILLION; DOMESTIC SALES MORE THAN DOUBLED TO OVER $1 BILLION AND THERE WAS AN ALMOST THREE–FOLD INCREASE IN SHAREHOLDERS EQUITY TO MORE THAN $700 MILLION. GRANT J. DAVIES CHAIRMAN
08MURRAY GOULBURN CO-OPERATIVE CO. LIMITED AND CONTROLLED ENTITIES 2011

UNDER STEPHEN’S LEADERSHIP OVER THE LAST 13 YEARS REVENUES INCREASED BY NEARLY $1.5 BILLION TO PEAK AT MORE THAN $2.5 BILLION; DOMESTIC SALES MORE THAN DOUBLED TO OVER $1 BILLION AND THERE WAS AN ALMOST THREE–FOLD INCREASE IN SHAREHOLDERS EQUITY TO MORE THAN $700 MILLION. GRANT J. DAVIES CHAIRMAN
09

The 20010/11 year was one of further improvement and consolidation for Murray Goulburn and the Australian dairy industry.
Key negative forces such as the GFC and drought had finally diminished in their impact and the Co–operative established its milk payment forecasts on a more positive outlook.
After the opening farmgate price was announced in early July 2010, dairy markets strengthened and so did the Australia dollar. Despite the negative influence of the currency, Murray Goulburn was able to lift milk prices on four occasions during the year delivering a final weighted average price of $5.64 per kilogram of milk solids.
This was 27% up on the previous year and represented the second highest farmgate price on record. Feedback from dairy farmers and formal industry analysis indicated that farm businesses could generate profits at this pricing and that consolidation or growth occurred for most dairy farm businesses during 2010/11. The recharging of river and ground water systems across all Australian dairy regions was positive news for dairy farmers.
Milk processed by the Co–operative was 2.9 billion litres for the year, down 6% from the 3.1 billion litres in 2009/10. Ironically after the ravages of a decade of drought, this reduction was mainly due to extremely wet conditions in southeastern Australia from late winter right through the summer months.
Due to our strong presence in the region, most of the farmers impacted by the severe floods in northwestern Victoria in January 2011 were Murray Goulburn Co–operative suppliers. Approximately 125 Murray Goulburn suppliers from across the state were severely impacted. The extent of impact ranged from severe inundation for several months to losses of pasture, hay, cow condition and milk supply.As severe flood waters approached the township of Rochester, the Co–operative implemented its crisis management plan to mitigate the effects of inundation at the Rochester factory. This decisive action minimized damage to the facility and ensured that production operations could resume quickly following the subsidence of flood waters without risk to occupational health and safety, product integrity or the environment.
Murray Goulburn Co–operative’s tradition of supporting farmers through natural disasters was again evident. On behalf of our shareholders the board donated directly to Queensland dairy farmers affected by the same rainfall system and we rallied behind our own dairy farmers with technical support, financial assistance and the provision of fodder.
Sales revenue for the year was $2.29 billion, an increase of 6% or $130 million on the previous year. profit before tax rose to $40 million from $24.8 million last year which represented further recovery from the dairy market collapse in 2008 as a result of the GFC.
A dividend of 12% was paid on ordinary shares in October 2011 in addition to the 1 for 10 bonus shares issued in April 2011. This dividend continues Murray Goulburn Co–operative’s strong record of dividend payment and represents an extremely important component of the total return from supplying and owning Murray Goulburn. The 2011 dividend represented $26 million in payments to Murray Goulburn Co–operative farm businesses.
In the past five years the dividend has been 12% in four of those years and 8% in one year namely 2009 following the Global Financial Crisis.
The 1 for 10 bonus issue in April 2011 reflected the growing value of the Co–operative and recognised the loyalty of dairy farmers who had supported Murray Goulburn through some difficult seasons.
10
OPERATIONS REVIEWSTEPHEN J. O’ROURKEMANAGING DIRECTOR
MURRAY GOULBURN CO-OPERATIVE CO. LIMITED AND CONTROLLED ENTITIES 2011

Export sales were $1.17 billion on decreased volumes but in a solid world market where dairy commodities traded towards historically high levels. The Co–operative’s domestic businesses including Devondale, Corporate Brands, Food Service, Murray Goulburn Nutritionals and Murray Goulburn Trading concluded the year with strong results and a combined domestic net revenue of $1.12 billion up 12% from $1 billion in the previous year.
Strong demand for Australian resources in Asia resulted in an Australia dollar that broke parity with the US dollar and then kept going, trading as high as US$1.093 during 2010/11. This placed significant downward pressure on Aussie dollar returns. Despite this pressure the Co–operative delivered its second highest farmgate price on record.
A sensible combination of milk price, dividends and other financial support to members including the provision of loans and rebates, whilst retaining profit in the Co–operative to support ongoing investment is key to Murray Goulburn’s success in continuing to protect and grow an enterprise which is 100% owned by the farmers who supply the milk.
Volatility remained the key feature of markets driven by factors operating totally outside the dairy industry. The upward movement of the Australian dollar demonstrated just how much key external factors can change rapidly. During the year we continued to monitor external factors like the European debt crisis, Asian growth and US economic conditions, and the Co–operative remained cautious in its forecasting of final farmgate prices.
Murray Goulburn’s balance sheet at year end was very healthy. Key indicators improved with debt down 7% and the Co–operative’s equity ratio improving 5 percentage points to 52%.
Capital expenditure for the year was $54 million and focussed on process efficiencies, occupational health and safety and the environment.
A multi million dollar investment at Kiewa in the export cream cheese and domestic pasteurised milk businesses provided valuable support for the strong growth the Co–operative has experienced in these market segments.
The Co–operative’s capital expenditure since 2000 has totalled almost $1 billion. This consistent commitment to investment in technology and renewal has ensured that Murray Goulburn’s manufacturing platform remains properly equipped to reliably and efficiently meet the ever increasing demands of a sophisticated and diverse domestic and export market.
Murray Goulburn continued to invest in support of key market initiatives in the Ingredients, Consumer, Nutritionals and Murray Goulburn Trading businesses.
At 9.1 billion litres in 2010/11 Australian milk production remained more than 2 billion litres below that of 2001/2002. Consequently a growing domestic market consumed a higher percentage of this production. Continued investment in the retail team including the flagship Devondale brand, aimed to improve the company’s capacity to grow market share in Australia.
On the retail front it was also pleasing to see the completion of the processing facility for the Danone Murray Goulburn joint venture at Kiewa. The Activia product was available in supermarkets from March 2011 and the Deputy Premier of Victoria, The Honourable Peter Ryan, formally opened the facility 24 June 2011. The joint venture provides Murray Goulburn with a strategic entry into Australia’s billion dollar yoghurt market.
The Danone TDP and Essendon Fields initiatives are clear examples of the Co–operative’s commitment to growth and continual improvement and are product of experienced and visionary management.
In delivering my final annual report may I say that it has been my privilege to work for such a great company for the past 24 years, 17 on the Board and 13 as Managing Director.
Together we have faced some very difficult issues over the past twenty years; complete deregulation of the dairy industry, gas crisis, drought, floods, fire, the Asia crisis, the GFC and subsequent world market collapse of dairy prices, AUD parity and the list goes on. We have taken on multi–national competition in Australia, we have battled on the unlevel playing field that is the world market, but through it all I am proud to say that Murray Goulburn Co–operative has grown substantially as a business to be one of Australia’s largest and most successful.
Importantly Murray Goulburn Co–operative is still 100% farmer owned, 100% Australian while most other dairy companies in Australia have been lost to corporate or foreign ownership.
Thank you to the many clever, dedicated and loyal people who have supported the Co–operative and myself during my time at Murray Goulburn. It has been my pleasure to work for so many passionate and extremely supportive MG suppliers.
11

SALES REVENUE FOR THE YEAR WAS $2.29 BILLION, AN INCREASE OF 6% OR $130 MILLION ON THE PREVIOUS YEAR. PROFIT BEFORE TAX ROSE TO $40 MILLION FROM $24.8 MILLION LAST YEAR WHICH REPRESENTED FURTHER RECOVERY FROM THE DAIRY MARKET COLLAPSE IN 2008 AS A RESULT OF THE GFC.
STEPHEN J. O’ROURKE MANAGING DIRECTOR
12MURRAY GOULBURN CO-OPERATIVE CO. LIMITED AND CONTROLLED ENTITIES 2011

SALES REVENUE FOR THE YEAR WAS $2.29 BILLION, AN INCREASE OF 6% OR $130 MILLION ON THE PREVIOUS YEAR. PROFIT BEFORE TAX ROSE TO $40 MILLION FROM $24.8 MILLION LAST YEAR WHICH REPRESENTED FURTHER RECOVERY FROM THE DAIRY MARKET COLLAPSE IN 2008 AS A RESULT OF THE GFC.
STEPHEN J. O’ROURKE MANAGING DIRECTOR
13

14MURRAY GOULBURN CO-OPERATIVE CO. LIMITED AND CONTROLLED ENTITIES 2011

DOMESTIC DIVISIONDuring the 2010 / 2011 financial year total product sales for the Branded, Corporate Brands, Food Service, Kiewa and Contract Pack Business Units across Australia reached $655 million with total growth of 5.0% compared to the previous year.
DEVONDALEThe year saw further growth in Devondale sales with overall value growth for the brand at 3.8%. Growth was achieved in both volume and value and ex factory sales exceeded $219 million for the full year. Devondale remains the market leading brand in both Long Life Milk and Dairy Blends and again grew its share of the Natural Cut Cheese category to reach 12% in those retailers we are ranged. The Liddells brand continued to perform well and remains the market leading brand in Lactose Free Long Life Milk with more than 70% market share in value terms.
Devondale’s marketing platform was supported by exciting new product launches and innovative communication initiatives.
Devondale Extra Light ‘lightest spread on the market’ was launched tapping into the consumer trends for low fat products.
The new Devondale Long Life Milk convenience 30sec television commercial was launched nationally with immediate success. The goal of this campaign is to turn occasional users into regular users by encouraging the consumer to store a pack of Devondale milk in the pantry and store one in the fridge and sell the benefits of never running out of milk.
Dora The Explorer and Thomas natural cheese shapes and IWS, expanded kids’ cheese consumption by using popular children’s character license properties to drive purchases and increase the number of occasions cheese is consumed.
The launch of Devondale into social networking via a facebook competition was aimed at building a closer relationship with the consumer and the Devondale brand in the most popular digital communities. This launch was in conjunction with a consumer competition called “Bring Back the Family Meal” sponsored by Devondale which achieved more than 6,000 facebook “likes” and held its fan base consistently post launch.
This initiative was a perfect fit for the Devondale Family website launched during the year. This is aimed at having a digital environment for consumers interested in Devondale as a Farmer Family Owned brand to come from the facebook “Bring Back the Family Meal” campaign and encourage them to interact with the Devondale brand by providing engaging content including recipes, family activity ideas and health and lifestyle tips. The next phase will focus on having a two way conversation with the consumer and the Devondale brand and our farmers shareholders via blogs on the site developing a stronger relationship with our consumers.
Devondale’s lead position in long life milk was enhanced with the launch of a 1L range of real honey flavoured long life milks into independent supermarkets. The range consisted of Real Honey and Cinnamon and Real Honey and Banana, Real Honey and French Vanilla, is to be launched later.
CORPORATE BRANDSThe Corporate Brands division achieved sales over the full year of $272 million, an increase of 5.4% on the prior year. Retail customers are increasingly following a growth strategy in this area, it remains an important part of our overall offering to our retail partners.
We continued to strengthen our relationships across all retailers supplying product into retailer own brands across all our major categories of milk, cheese and butter. This year was the first Murray Goulburn has supplied corporate branded chilled milk to Woolworths, gaining the contract to supply the NSW and ACT stores.
The strengthening of the Coles relationship opened up a number of opportunities for Murray Goulburn in 2010/11. We were awarded new ‘Coles’ Brand business in the categories of Dairy Blends, Powder & Cream Cheese, which contributed to achieving a strong sales result.
FOOD SERVICEThe Food Service division achieved sales growth in a very competitive market, with sales of $85.8 million. The year saw the roll out of Devondale Aerosol Whipped Cream into McDonalds. The recent natural disasters with floods in Queensland also saw McDonalds buy Devondale Milk for the first time.
The Barista’s Own Milk has seen a busy year at major national trade shows with ‘World Barista Judge’ Justin Metcalf, out the front of the shows making up World class coffees with Barista’s Own Milk.
Leveraging MG’s relationship with the Tatua Co–operative in NZ to source products not available from MG manufacturing plant, Devondale branded products such as Creme Fraiche, Mascarpone and the Whipped Cream continue to grow sales, adding value products to our strong base offering.
INGREDIENTSIngredients sales for the year totalled $1.3040 billion comprising $203 million from Australian domestic Ingredients and $1.1 billion from International sales. These results were 2% higher than the previous year. Sales volumes totalled 353,000 tonnes.
The year for dairy trade was much more orderly by comparison to the previous year. Prices commenced the year at the lower end of the range and gradually improved throughout the year peaking around February.
During the year record demand was recorded particularly during the September quarter which underpinned stronger prices. Fat prices reached almost record levels during the year on the back of strong demand and limited supply. In the January quarter strong buying of full cream milk powder (FCMP) in China to take advantage of the FTA China has with New Zealand caused prices for FCMP to peak strongly in February. This period of heavy buying was followed by a period of relatively weak demand as China ran down stocks to normal levels.
Overall a pleasing trend is that commodity prices are now trading in a much higher band than in past years demonstrating that the market has moved up a level and, for most buyers, these prices appear sustainable.
Currency exchange emerged in November as a challenge as the Australian dollar surged toward parity with the US equivalent. Having started the year at an exchange rate of around $0.85 to the US Dollar, the year ended at around $1.06 having reached parity in November. Despite this setback a combination of strong prices and sound hedging policies moderated the downside risk caused by the rapidly appreciating local currency.
On March 13 Japan, the Co–operative’s number one market suffered a devastating earthquake and Tsunami. Murray Goulburn made a donation of $50,000 to the Japanese Red Cross appeal which was appreciated by our customers. During this time we were able to continue shipping MG product to Japan to maintain essential food supplies. Our ties to Japan go back over 50 years and we wish a speedy and successful recovery for the Co–operative’s many customers and friends in Japan.
European milk production tracked approximately 2% ahead for the first half of 2011 compared to the same period last year. Production in the two largest contributor countries, Germany and France increased steadily, but output slowed from some of the Eastern member states.
15
OPERATIONS REVIEW[CONTINUED]

INGREDIENTS [CONTINUED]
Overall EU quota milk production for 2010/11 was down with average prices across all member countries increasing.
Intervention stocks of skim milk powder (SMP) and butter in July 2010 were 235,000t and 52,000t respectively and by year–end had fallen to 143,500t and 1,435t. During the year there were no further purchases to intervention. The tender system for selling SMP from Intervention was withdrawn and all remaining SMP intervention stocks allocated to charity programs for 2012. No butter was available from intervention.
Within Europe, domestic market prices were above intervention prices and the last time butter was accepted into intervention was September 2009, and October 2009 for SMP.
The last EU export subsidies were reduced to zero in November 2009 and had not been re–introduced by year end.
Externally, member EU states aggressively pursued bilateral agreements in Asia and Latin America. Apart from the obvious market access implications for Australia, the EU confirmed to insist that trading partners adopt their intellectual property regimes, which includes recognition for their Geographical Indications system. Effectively restraining Australia from using certain dairy product names when exporting to the countries concerned.
In USA the rate of milk production growth in the US traded lower before recovering to a growth phase half way through the year.
US farmgate milk prices were strong at US$22/cwt. However pressure on profit margins because of increased feed prices had the effect of limiting milk yields.
US dairy exports continued to grow from a low point in 2009 during the global financial crisis. The US dairy industry has become an increasingly significant supplier of butter, cheese, lactose, whey powder and SMP on the global market.
Cooperatives Working Together has been active this year, subsidising around 28,300t of cheese sales during the second half of the year.New Zealand Milk production during the 2010–11 season was 17.4bn litres, up almost 5% on the previous season.
During the year Fonterra announced it was planning to move the gDT platform to become a multi seller facility. New rules were developed with new suppliers including Dairy America announcing its plans to sell on the platform. It is clear that gDT is established in global dairy trade and is being used as a pricing benchmark.
Currently Australia is negotiating bilateral Free Trade Agreements with Korea, Japan, Indonesia, Malaysia, China and India. Regional FTAs are being negotiated under the Trans Pacific Partnership (USA, NZ, Chile, Peru, Vietnam, Brunei, Malaysia and Singapore), the Gulf Cooperation Council (UAE, Saudi Arabia, Bahrain, Oman, Qatar and Kuwait) and the Pacific Islands.
Of the FTAs currently under discussion, the Korea negotiations are the most advanced with strong expectations that negotiations will be concluded in time for implementation in 2012. This is important to the Australian dairy industry to maintain competitiveness as the Korean FTA with the EU came into force on 1 July 2011 and it is anticipated that the Korean FTA with the US will come into force early in 2012.The Australia–China FTA negotiations are also important to the Australian dairy industry. Our main competitor in China, New Zealand, has had an FTA in place since 2008 with generous quotas and tariffs which are phasing to zero for all dairy products by 2019. As the New Zealand tariff reduces and the quotas expand, it will become increasingly difficult for Australia to compete in this key market. It is of some concern to the Australian dairy industry that there is no conclusion yet in sight for negotiations for an Australia China FTA.
MG NUTRITIONALSAgainst the backdrop of Murray Goulburn’s strategic ambitions, MG Nutritionals has continued to review its strategic direction and business plans at regular intervals, to ensure they remain aligned with its Mission: “To create sustainable additional profits & wealth through global marketing & sales of branded, specialised nutritional products (ingredients, foods & supplements) that are backed by research & clinical trials.”
For the 2011 financial year, MG Nutritionals achieved continued growth and record revenues of approximately $75 million.
This result was underpinned by the sales of infant formula. The excellent quality performance of MG Nutritionals Cobram in manufacturing nutritional powders that met exacting customer specifications was very important in this overall success. During the year a large number of customer–driven new product developments were effectively completed.
Sales of MG Nutritionals own branded product range of infant nutrition powders, “NatraStart”, by MG China, Qingdao, continues to be a vital component of the business. Throughout the past 12 months MG Nutritionals has provided extensive support to MG China’s marketing activities. This extended to facilitating and supporting numerous visits of Chinese sales, marketing and promotional personnel associated with the business to some of Murray Goulburn shareholders’ farms. The willing and helpful support of these families was greatly appreciated.
ProForm Nutrition & Energy range of meal replacement products achieved strong growth, with record sales and a noteworthy gain in market share in Australia; largely in response to increased marketing activities. Sales growth was also assisted by continued activity with the brand in selected overseas markets.
ASCEND Proven Sports Protein range of protein nutritional supplements continued to build its distribution and sales structure throughout Australia. Customers from many overseas countries have also sought to purchase ASCEND products. ASCEND Rebound UHT beverage and ASCEND Recovery and Muscle Bars were successfully introduced to a limited number of convenience stores associated with petrol stations on a trial basis. The number of outlets continued to expand during the period as part of the division’s growth strategy.
MG Nutritionals is actively involved in a portfolio of research programs which extends from human clinical trials on MG Nutritionals proprietary and patented bioactive ingredients being conducted independently by Australian universities, Department of Primary Industries, Victoria and other organisations, through to active participation in the Dairy Health & Nutrition Consortium. The latter organisation is funded by member dairy companies and associated organisations. Initial research focussed largely on the beneficial effect of dairy consumption on risk factors associated with metabolic syndrome.
Colostrum collection continued during the year. The high quality of colostrum supply is important in ensuring the manufacture of first class powdered products for use in ASCEND products and also for the continued premium grade NatraLife Bovine Colostrum for sale to our discerning customers. NatraFerrin lactoferrin produced at Leongatha was in strong demand and prices remained firm throughout the period.
16
OPERATIONS REVIEW[CONTINUED]
MURRAY GOULBURN CO-OPERATIVE CO. LIMITED AND CONTROLLED ENTITIES 2011

BANGLADESH
BELGIUM
BAHRAIN
BRUNEI
BRAZIL
CANADA
CHILE
CHINA
COSTA RICA
DENMARK
DOMINICAN REPUBLIC
EGYPT
EL SALVADOR
FIJI
FRANCE
GERMANY
GHANA
GREAT BRITAIN (UK)
GUATEMALA
HONG KONG
INDONESIA
IRAN
IRELAND
IVORY COAST
JAMAICA
JAPAN
JORDAN
KUWAIT
LATVIA
MOROCCO
MYANMAR
MAURITIUS
MEXICO
MALAYSIA
NIGERIA
NETHERLANDS
NEW ZEALAND
OMAN
PANAMA
PERU
PHILIPPINES
PAKISTAN
PUERTO RICO
RUSSIAN FEDERATION
SAUDI ARABIA
SINGAPORE
SOUTH KOREA
SOUTH AFRICA
SPAIN
SRI LANKA
SWITZERLAND
THAILAND
TRINIDAD AND TOBAGO
TAIWAN
UNITED ARAB EMIRATES
UNITED STATES
VIETNAM
WESTERN SAMOA
YEMEN
17
COUNTRIES OF EXPORT

18
THE CO–OPERATIVE’S CAPITAL EXPENDITURE SINCE 2000 HAS TOTALLED ALMOST $1 BILLION. THIS CONSISTENT COMMITMENT TO INVESTMENT IN TECHNOLOGY AND RENEWAL HAS ENSURED THATMURRAY GOULBURN’S MANUFACTURING PLATFORM REMAINS PROPERLY EQUIPPED TO RELIABLY AND EFFICIENTLY MEET THE EVER INCREASING DEMANDS OF A SOPHISTICATED AND DIVERSE DOMESTIC AND EXPORT MARKET.
STEPHEN J. O’ROURKE MANAGING DIRECTOR
MURRAY GOULBURN CO-OPERATIVE CO. LIMITED AND CONTROLLED ENTITIES 2011
19
THE CO–OPERATIVE’S CAPITAL EXPENDITURE SINCE 2000 HAS TOTALLED ALMOST $1 BILLION. THIS CONSISTENT COMMITMENT TO INVESTMENT IN TECHNOLOGY AND RENEWAL HAS ENSURED THATMURRAY GOULBURN’S MANUFACTURING PLATFORM REMAINS PROPERLY EQUIPPED TO RELIABLY AND EFFICIENTLY MEET THE EVER INCREASING DEMANDS OF A SOPHISTICATED AND DIVERSE DOMESTIC AND EXPORT MARKET.
STEPHEN J. O’ROURKE MANAGING DIRECTOR

20
OPERATIONS REVIEW[CONTINUED]
QUALITY ASSURANCE
Significant changes were made during the year, both Corporately and at Manufacturing Sites, to strengthen Murray Goulburn’s capability in the critical area of food safety management.
An experienced Corporate Food Safety & HACCP (Hazard Analysis and Critical Control Point) Manager was appointed to lead and further develop the company’s comprehensive Food Safety & HACCP program.
Manufacturing sites also put additional focus on this important component of their QA system, with staff being dedicated to an expanded Food Safety & HACCP role at larger sites, and a greater percentage of the QA Manager’s time being devoted to HACCP in the smaller sites.
HACCP is the systematic approach to food safety used by Murray Goulburn to addresses physical, chemical, and biological hazards which focuses on prevention rather than final product inspection.
It is used in the food industry to identify potential food safety hazards at all points in the chain from raw material production, procurement and handling, to manufacturing, distribution and consumption of the finished product, so that action can be taken to reduce or eliminate risks.
In addition to addressing the human resourcing aspect of the system, the Co–operative implemented a common platform for managing and documenting every HACCP system across all manufacturing sites to ensure a more consistent and analytical approach and reducing unnecessary duplication.
HUMAN RESOURCES 2010/11 was a significant year in terms of Murray Goulburn’s people. We celebrated many successes and began the process of realigning our people practices and systems to ensure they are contributing to the achievement of all elements of the strategic plan. We achieved this with a full review of our current human resource systems and practices and an assessment against industry best practice. This enabled us to identify key priorities for improvement which have been included in a human resources strategic plan over a 3 year timeframe including the establishment of a Human Resources Department within Murray Goulburn.
131 people were eligible for service awards after reaching milestones of 15, 20, 25, 30, 35, 40 and 50 years of dedicated service to the Co–operative. Of particular note was William Dingwall from Rochester who completed 50 years of service with Murray Goulburn on 16 January 2011.
The Co–operative continued its commitment to the development of its human resources in a range of ways during the year. Ten Murray Goulburn managers were the first group of people to commence the new Victorian Graduate Certificate in Food Industry Management. Murray Goulburn had a significant contribution into the development of the curriculum for this qualification and the inclusion of a Dairy Technology subject to ensure the learning content was aligned with the Dairy sector. Key HR staff at Murray Goulburn worked in conjunction with the National Centre of Dairy Education, our preferred training provider for specialist dairy education, in the selection of electives and learning content to support the program.
We maintained our annual support for the Dairy Australia manufacturing and cheese scholarship programs in early 2011. Murray Goulburn was one of the host organisations for the scholarship winners and we had the good fortune to place two of the scholarship winners in our manufacturing division at the end of the scholarship program. Elaine Lees from Rochester was joint winner of the National Women at Work 2010 Study Award.
Fifteen of our most talented people, across all divisions, engaged in the Murray Goulburn Senior Leadership Development Program during the year. A key feature of the program involves the participants in critical project work that is directly aligned to objectives identified in the strategic plan.
The Co–operative’s commitment to traineeships and apprenticeships saw sixty–three trainees and apprentices employed across the organisation in areas including; transport and logistics, mechanical and vehicle maintenance, electrical, food processing, laboratory, competitive manufacturing and management.
131 PEOPLE WERE ELIGIBLE FOR SERVICE AWARDS AFTER REACHING MILESTONES OF 15, 20, 25, 30, 35, 40 AND 50 YEARS OF DEDICATED SERVICE TO THE CO–OPERATIVE.
MURRAY GOULBURN CO-OPERATIVE CO. LIMITED AND CONTROLLED ENTITIES 2011

21

IAN BIRD COMPANY SECRETARY
EXECUTIVE LEADERSHIP TEAM
NEIL LONGSTAFF GENERAL MANAGER DOMESTIC MARKETING AND SALES
DAVID MOFFATT GENERAL MANAGER TECHNICAL SERVICES / INNOVATION
DAMON PAGE GENERAL MANAGER FINANCE
MAL BENISTON GENERAL MANAGER INTERNATIONAL SALES AND MARKETING
ROSS GREENAWAY GENERAL MANAGER FIELD SERVICES AND STRATEGIC ISSUES
AMANDA SOLLY ACTING GENERAL MANAGER HUMAN RESOURCES
PAUL KERR CHIEF OPERATING OFFICER
PETER HOBMAN GENERAL MANAGER MG NUTRITIONALS
PAUL DE BOLFO GENERAL MANAGER TREASURY AND TAXATION
STEPHEN J. O’ROURKE MANAGING DIRECTOR
PETER DAZKIW GENERAL MANAGER MURRAY GOULBURN TRADING
22MURRAY GOULBURN CO-OPERATIVE CO. LIMITED AND CONTROLLED ENTITIES 2011
TONY CATANIA GENERAL MANAGER MANUFACTURING
IAN BIRD COMPANY SECRETARY

ENVIRONMENTThe corporate environment group saw the addition of two new highly qualified staff during this financial year to significantly boost the capability of the group into the future.
The role of Corporate Environment Manager, EMS Development & Implementation was created to enhance and refine our Environmental Management Systems across the group, to drive continued improvement in pollution control and to ensure compliance with the new EPA Licence reform programme and annual public reporting requirements.
The role of Corporate Wastewater Treatment Manager was created to ensure that MG continues to drive investment in the latest processes, technology, and plant & equipment focussed on factory waste water treatment and irrigation systems which are critical to the long term sustainability of manufacturing operations. This role builds on the Co–operative’s internal know–how and capability in the area of biological waste water treatment.
During the year Murray Goulburn participated in the EPA Licence reform programme which resulted in the standardisation of the Co–operative’s EPA Licences leading to a streamlining of environmental monitoring and ultimately more efficient lower cost compliance.
The implementation of the Co–operative’s revised environmental management system across all manufacturing sites represented a significant reform of Murray Goulburn’s environmental management discipline.
The corporate wide EMS is a much more strategic management approach which is designed to benefit the organisation and the communities in which we operate. Ultimately the framework will help ensure MG’s ongoing compliance with environmental legislation.
MG’s corporate environment group is committed to best practice environmental management in order to provide a more consistent management approach to increase operational efficiency and reduce the likelihood of non compliance with legislation, regulation and guidelines. This will provide a systematic platform to respond to the requirements under MG’s reformed EPA licenses to determine whether or not MG has complied with Victorian EPA legislation. The EMS is in line with ISO 14001 which EPA Licence reform guidelines recommend.
During the year, the environment group developed the Resource Efficiency Management System REMS, which builds on Resource Improvement Opportunity RIO system in use at all manufacturing sites.
The system co–ordinates relevant policies, targets, processes, tools and staff capacity to provide a better structured, more efficient and more effective resource efficiency management system across the group leading to improved project delivery, resource efficiency, emissions reduction and manufacturing cost reduction. This will satisfy future legislative requirements without having to develop one off special programs in response, and therefore reduce the cost burden of compliance and reduce the likelihood of non compliance with current and future legislation, regulations and guidelines in this area.
LOGISTICSStorage and Distribution in 2010/11 delivered a supply chain cost in line with budget expectation. This was achieved with a focus by the Logistics Leadership Team in the development and implementation of Supply Chain Roadmaps to deliver reduced operational costs whilst achieving high service levels to both Domestic and International Customers.
Continued focus on the development and implementation of quality systems delivered positive results in relation to ISO 9001:2000 accreditations. HACCP accreditation has continued to deliver food safety awareness and processes for operational staff, ensuring Murray Goulburn food safety standards are maintained at the highest levels.
The Division implemented a logistics solution for the Danone Murray Goulburn Joint Venture during the last year. Significant analysis and execution of operational procedures delivered an efficient, cost effective system for Danone Murray Goulburn; the logistics services include delivery of raw materials to the Kiewa facility including fruit totes from regional NSW, the transport from Kiewa to Laverton for storage and central distribution nationally.
The logistics team developed a renewed Safety Plan during 2011. The Plan includes a non negotiable focus on safety across the Logistics business units and has reinforces the need for strong communication and training in hazard analysis risk mitigation and incident investigation.
Robust information systems were further developed to meet ever changing customer and internal management requirements. The supply chain team provided innovative solutions with system enhancements to better control the end–to–end process with outcomes and deliverables to meet Customer demands.
The Logistics Team has developed robust reporting for Transport Partners in reference to on–time collection and delivery of products to all MG customers. This furthers MG’s commitment to ensuring that corporate governance is at the forefront of on–road legal compliance and therefore results in a safer environment for all road users.
23
OPERATIONS REVIEW[CONTINUED]

24
OPERATIONS REVIEW[CONTINUED]
MURRAY GOULBURN CO-OPERATIVE CO. LIMITED AND CONTROLLED ENTITIES 2011

AUD / USD EXCHANGE [* SOURCE DATA DAIRY AUSTRALIA LTD]
WORLD COMMODITY PRICES [* SOURCE DATA DAIRY AUSTRALIA LTD]
25
$AUST / TONNES FOB CHEDDAR WMP AMF BUTTER SMP
6,000
5,000
4,000
3,000
2,000

MURRAY GOULBURN CO-OPERATIVE CO. LIMITED AND CONTROLLED ENTITIES 26

27
28MURRAY GOULBURN CO-OPERATIVE CO. LIMITED AND CONTROLLED ENTITIES 2011

FIELD SERVICESMurray Goulburn Field Services again worked with suppliers to support and assist them through another challenging year. This support involved largely face–to–face meetings with shareholders and working with government and industry groups to provide much needed services in the areas of finance, income estimates, milk quality and industry updates. Close to 9,000 farm visits were completed during the year.
Murray Goulburn maintained an excellent record for farm milk quality with 84% of all milk supplied being of premium quality in a year severely challenged by environmental conditions ranging from floods through to bushfires. These challenges prompted Murray Goulburn to offer further assistance to suppliers in the form of both provision of feed and financial support.
The Co–operative’s Food Safety program, MG Milkcare, continued to be an industry leader and qualified field officers completed 604 on farm audits across Victoria, NSW and SA. Murray Goulburn employs 24 approved auditors in Victoria, two in New South Wales and seven in South Australia. These Auditors are required to have completed special areas of study included in the National Auditor Units of Competency covering all states of Australia.
It was another successful year for the colostrum program, with demand remaining strong. The volume fell by 11% compared to the previous record year, but was produced by 20% fewer suppliers, due mainly to an improved whole milk price. The average colostrum payment was $2.02 per litre.
Murray Goulburn presented at the Mystery Creek Field Days in the Waikato District of New Zealand, the largest agribusiness exhibition in the southern hemisphere. This presence was to demonstrate that Murray Goulburn offers a viable and more than competitive supply option for New Zealand dairy farmers considering relocating to Australia. The event was attended by Co–operative director Don Howard and three senior field staff.
Another successful Murray Goulburn study tour saw 32 participants visit Argentina and Brazil to gain an understanding of the size and scope of their dairy, beef, grain and sugar industries. This tour was lead by a senior field staff member and Co–operative director Graham Munzel.
MGC consolidated a number of current roles in Field Services with the establishment of the Field Services support group. This group manages support and development of MGF@rm and maintains a focus on assisting farmers to meet their on–farm compliance needs in food safety, environment, personal and animal welfare. The group also manages research, development and innovation for MGC suppliers and provides an additional resource in the area of dairy extension. This dairy extension resource will immediately concentrate its efforts in the Northern Victorian irrigation area to help suppliers grow their milk production after the drought and recent floods.
MGF@rm has continued to develop as a vital tool for Murray Goulburn suppliers wanting up–to–date information regarding their own business, Murray Goulburn and the dairy industry. More than half Murray Goulburn’s supplier/shareholders were regular users of MGF@rm during the year. Additional features were added to MGF@rm during the period including the MG FarmC@re program modules and a new Domestic Incentive Monitor, developed to assist suppliers when calculating milk payments.
Development of the MG FarmC@re program continued to progress well in 2010/11. MG FarmC@re aims to enable suppliers to meet and exceed regulatory standards in the areas of food safety, environment, people and animal welfare. MG FarmC@re represents Murray Goulburn’s flagship on–farm compliance program and the Co–operative continued to lead the Australian dairy industry in working with suppliers to lessen the regulatory burden. The MG FarmC@re pilot program was successfully completed with approximately 100 Murray Goulburn supplier/shareholders taking part in the program, providing valuable feedback to the company on the program’s workability.
Over the course of the year, the Field Services Division implemented the introduction of a new milk payment system, which offered suppliers a choice of three different payment options. This was the first major overhaul of the milk payment system in more than a decade and was well accepted across the supply area.
MURRAY GOULBURN TRADINGOne of Australia’s oldest rural retailers, Murray Goulburn Farm and Hardware Supplies finished the year more than 10% up on the previous 12 months with revenue of $168M with 57% of all business done with Murray Goulburn suppliers.
Sales growth was mainly attributed to an increase in custom from Murray Goulburn suppliers who were able to benefit from the company’s buying power which was aimed at keeping farm input costs as low as possible.
Fertilizer, pasture seed and herbicide prices were particularly keen and provided farmers with the opportunity of reducing their overall on–farm costs during the year.
MG Feed Solutions was successful in providing farmers easy access to a range of quality assured products including whole grain feed, fodder and special blends.
As the Western District growth continued at pace, the company launched its Milking Machine Installation and Maintenance business, the mobile dairy shop together with the renovation of the Simpson store to better support dairy growth in the area and ensure a more satisfying in–store shopping experience.
Agronomic services via the Trading stores were again expanded during the year building on the successful model aimed at increases to productivity and therefore the opportunity for a rise in on–farm margins.
29
OPERATIONS REVIEW[CONTINUED]
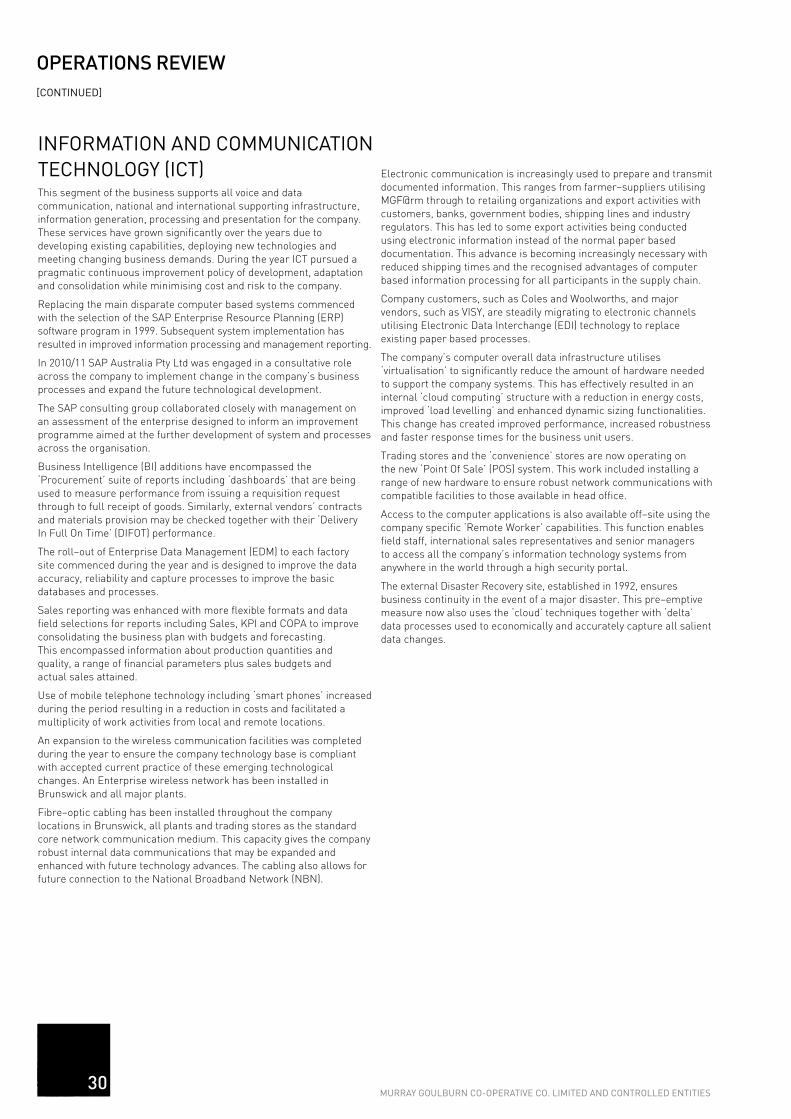
INFORMATION AND COMMUNICATION TECHNOLOGY (ICT)This segment of the business supports all voice and data communication, national and international supporting infrastructure, information generation, processing and presentation for the company. These services have grown significantly over the years due to developing existing capabilities, deploying new technologies and meeting changing business demands. During the year ICT pursued a pragmatic continuous improvement policy of development, adaptation and consolidation while minimising cost and risk to the company.
Replacing the main disparate computer based systems commenced with the selection of the SAP Enterprise Resource Planning (ERP) software program in 1999. Subsequent system implementation has resulted in improved information processing and management reporting.
In 2010/11 SAP Australia Pty Ltd was engaged in a consultative role across the company to implement change in the company’s business processes and expand the future technological development.
The SAP consulting group collaborated closely with management on an assessment of the enterprise designed to inform an improvement programme aimed at the further development of system and processes across the organisation.
Business Intelligence (BI) additions have encompassed the ‘Procurement’ suite of reports including ‘dashboards’ that are being used to measure performance from issuing a requisition request through to full receipt of goods. Similarly, external vendors’ contracts and materials provision may be checked together with their ‘Delivery In Full On Time’ (DIFOT) performance.
The roll–out of Enterprise Data Management (EDM) to each factory site commenced during the year and is designed to improve the data accuracy, reliability and capture processes to improve the basic databases and processes.
Sales reporting was enhanced with more flexible formats and data field selections for reports including Sales, KPI and COPA to improve consolidating the business plan with budgets and forecasting. This encompassed information about production quantities and quality, a range of financial parameters plus sales budgets and actual sales attained.
Use of mobile telephone technology including ‘smart phones’ increased during the period resulting in a reduction in costs and facilitated a multiplicity of work activities from local and remote locations.
An expansion to the wireless communication facilities was completed during the year to ensure the company technology base is compliant with accepted current practice of these emerging technological changes. An Enterprise wireless network has been installed in Brunswick and all major plants.
Fibre–optic cabling has been installed throughout the company locations in Brunswick, all plants and trading stores as the standard core network communication medium. This capacity gives the company robust internal data communications that may be expanded and enhanced with future technology advances. The cabling also allows for future connection to the National Broadband Network (NBN).
Electronic communication is increasingly used to prepare and transmit documented information. This ranges from farmer–suppliers utilising MGF@rm through to retailing organizations and export activities with customers, banks, government bodies, shipping lines and industry regulators. This has led to some export activities being conducted using electronic information instead of the normal paper based documentation. This advance is becoming increasingly necessary with reduced shipping times and the recognised advantages of computer based information processing for all participants in the supply chain.
Company customers, such as Coles and Woolworths, and major vendors, such as VISY, are steadily migrating to electronic channels utilising Electronic Data Interchange (EDI) technology to replace existing paper based processes.
The company’s computer overall data infrastructure utilises ‘virtualisation’ to significantly reduce the amount of hardware needed to support the company systems. This has effectively resulted in an internal ‘cloud computing’ structure with a reduction in energy costs, improved ‘load levelling’ and enhanced dynamic sizing functionalities. This change has created improved performance, increased robustness and faster response times for the business unit users.
Trading stores and the ‘convenience’ stores are now operating on the new ‘Point Of Sale’ (POS) system. This work included installing a range of new hardware to ensure robust network communications with compatible facilities to those available in head office.
Access to the computer applications is also available off–site using the company specific ‘Remote Worker’ capabilities. This function enables field staff, international sales representatives and senior managers to access all the company’s information technology systems from anywhere in the world through a high security portal.
The external Disaster Recovery site, established in 1992, ensures business continuity in the event of a major disaster. This pre–emptive measure now also uses the ‘cloud’ techniques together with ‘delta’ data processes used to economically and accurately capture all salient data changes.
30
OPERATIONS REVIEW[CONTINUED]
MURRAY GOULBURN CO-OPERATIVE CO. LIMITED AND CONTROLLED ENTITIES

32 DIRECTORS’REPORT36 CONSOLIDATEDINCOMESTATEMENT37 CONSOLIDATEDBALANCESHEET38 CONSOLIDATEDSTATEMENTOFCHANGESINEQUITY39 CONSOLIDATEDCHANGESOFCOMPREHENSIVEINCOME40 CONSOLIDATEDSTATEMENTOFCASHFLOWS41 NOTES71 DIRECTORS’DECLARATION72 INDEPENDENTAUDITOR’SREPORT73 AUDITINDEPENDENCEDECLARATION
31
FINANCIAL REPORT

INCOME STATEMENT FOR THE FINANCIAL YEAR ENDED 30 JUNE 2011
0032
Your Directors present the following report for the financial year ended 30 June 2011. DIRECTORS The directors listed on page 33 each held office as a director of the the company during or since the end of the financial year except for: MJ Van de Wouw – appointed 24 November 2010
COMPANY SECRETARYIC Bird (B.BUS. CPA), company secretary, joined the company in 1990. PRINCIPAL ACTIVITIESThe principal activities of the consolidated entity constituted by the company and the entities it controlled during the year have been: – The processing of the whole milk of its shareholder suppliers and the manufacture, marketing and distribution of dairy products. – The operation of retail stores as a service to the suppliers. No significant change in the nature of these activities occurred during the year. DIVIDENDS PAID OR RECOMMENDED The following dividends were paid or recommended during or since the financial year end:
a) In respect of the financial year ended 30 June 2010 as paid or recommended in the 2010 financial report: Final dividend paid on 20 October 2010 On ordinary shares at $0.12 per share unfranked 22,210 On A class preference shares at $0.08 per share unfranked 1,300 On B class preference shares at $0.05 per share unfranked 753 On C class preference shares at $0.08 per share unfranked 1,814 26,077
b) In respect of the financial year ended 30 June 2011: Final dividend recommended for payment during October 2011 (Dividends declared subsequent to 30 June 2011 and therefore not recognised) On ordinary shares at $0.12 per share unfranked 26,366 26,366
REVIEW OF OPERATIONS The consolidated entity recorded profit before income tax of $40,027,000 (2010: $24,772,000 profit) for the financial year ended 30 June 2011.
FUTURE DEVELOPMENTS Disclosure of information regarding likely developments in the operations of the consolidated entity in future financial years and the expected results of those operations is likely to result in unreasonable prejudice to the consolidated entity. Accordingly, this information has not been disclosed in this report. SIGNIFICANT CHANGES IN THE STATE OF AFFAIRSNo significant change in the state of affairs of the consolidated entity occurred during the financial year. REMUNERATION The remuneration report containing the remuneration of key management personnel is provided on pages 34 to 35.
EVENTS SUBSEQUENT TO BALANCE DATE Since 30 June 2011, the company has acquired a controlling interest in Tasmanian Dairy Products Co. Ltd, a company formed to undertake the construction, development and operation of a milk processing plant in Smithton, Tasmania. With the exception of this investment and the declaration of dividends detailed in Note 7 ‘Unrecognised Amounts’, no matters or circumstances have arisen since the end of the financial year which significantly affected or may significantly affect the operations of the consolidated entity, the results of those operations, or the state of affairs of the consolidated entity in financial years subsequent to the financial year ended 30 June 2011.
ENVIRONMENTAL REGULATIONS Murray Goulburn is licensed by EPA in relation to the operation of its eight manufacturing sites throughout Victoria and one site in Tasmania pursuant to each state’s relevant Environment Protection Act. The company has continued its policy of maintaining programs and systems, which will impact positively on the reduction to the environment through reductions in emissions, energy use and product losses, and the maximising of re–use and recycling initiatives.
Amongst Murray Goulburn’s achievements during the year the company participated in the EPA Licence reform programme. As a result of this, new standardised and outcome focused EPA Licences have been formally issued to all MG manufacturing sites and treatment farms located in Victoria.
During the 2011 financial year MG has been implementing & refining stage 1 of an environmental management system across all manufacturing sites located in both Victoria and Tasmania.
The corporate wide EMS is a much more strategic management approach which MG believes will benefit the organisation, communities and environment which we operate in. Ultimately the framework will help ensure MG’s ongoing compliance with environmental legislation. MG continues to manage an extensive demand side environmental resource efficiency program in response to both State and Federal Government Legislative requirements, and in line with MG objectives to reduce both operational cost and impact to the environment through continuous improvement. The company had no material events of non–compliance during the financial year. INSURANCE OF OFFICERS During the financial year the company paid a premium of $166,950 to insure the directors and senior managers of the company. The liabilities insured include costs and expenses that may be incurred in defending civil or criminal proceedings that may be brought against the officers in their capacity as officers of the consolidated entity. AUDITOR’S INDEPENDENCE DECLARATION Our auditors have provided the Board of Directors with a signed Independence Declaration in accordance with section 307C of the Corporations Act 2001. This declaration is included at page 73 of this financial report. ROUNDING OF AMOUNTS TO THE NEAREST THOUSAND DOLLARS The company is of the kind referred to in ASIC Class Order 98/0100 dated 10 July 1998, and in accordance with that Class Order amounts in the directors’ report and the financial report have been rounded off to the nearest thousand dollars.
$000
DIRECTORS’ REPORT

INCOME STATEMENT FOR THE FINANCIAL YEAR ENDED 30 JUNE 2011
31
DIRECTORS MEETINGS
MEETINGS ATTENDED
FULL MEETINGS OF DIRECTORS MEETINGS OF COMMITTEES
DIRECTOR 15 HELDAUDIT
3 HELDFINANCE
4 HELDZONE
1 HELDCOMPLIANCE
3 HELDREMUNERATION
1 HELD
SUPPLIER RELATIONS
7 HELD
GJ DAVIES ChairmanFish Point via Swan Hill 14 * * * * 1 7
JT VARDY Deputy ChairmanMaffra 15 * 4 * 3 1 7
WT BODMANWon Wron 15 * * 1 * * 7
PJO HAWKINSSouth Yarra 14 2 3 * * 1 5
DF HOWARDCamperdown 15 * 4 * 3 * 7
KW JONESGundowring 15 3 * 1 * * 7
ST MILLSNumurkah 15 * 4 * 3 * 7
GN MUNZELGunbower 13 3 * 1 * * 5
JP PYEBessiebelle 15 3 * * * * 7
PW TRACYYanakie 15 * 4 * * 1 7
MJ VAN DE WOUWTimboon 9 * * * * * 4 9 full Board meetings and 4 Supplier Relations meetings held whilst a member of the Board and committees
SJ O’ROURKE Managing DirectorGisborne 13 * 4 * * * *
* Not a member of the relevant committee For qualifications and experience refer to pages 2 to 3
DIRECTORS’ REPORT
33

34
DIRECTORS’ REPORT
REMUNERATION REPORT: COMPENSATION OF KEY MANAGEMENT PERSONNEL The key management personnel of the Murray Goulburn Co–operative Co. Limited consolidated entity including those responsible for planning, directing and controlling the activities of the consolidated entity during the year were:
SHORT TERM LONG TERM POST EMPLOYMENT
FEES & SALARY
$
(i) NON MONETARY
$
(i) NON MONETARY
$
RETIREMENT BENEFIT
$
SUPER- ANNUATION
$TOTAL
$
2011
GJDavies Chairman, non executive director 142,187 12,000 – 88,500 12,797 255,484
JTVardy Deputy chairman, non executive director 85,312 – – 40,000 7,678 132,990
WTBodman Non executive director 56,875 – – – 5,119 61,994
PJOHawkins Non executive director 56,875 – – – 5,119 61,994
DFHoward Non executive director 56,875 – – *(2,500) 5,119 59,494
KWJones Non executive director 56,875 – – – 5,119 61,994
STMills Non executive director 56,875 – – 25,500 5,119 87,494
GNMunzel Non executive director 56,875 – – – 5,119 61,994
JPPye Non executive director 56,875 – – 99,000 5,119 160,994
PWTracy Non executive director 56,875 – – – 5,119 61,994
MVandeWouw (ii) Non executive director 36,136 – – – 3,252 39,388
SJO’Rourke (vi) Managing Director 1,709,665 147,482 128,353 – 939,630 2,925,130
PKerr (vi) Chief Operating Officer 450,526 60,901 21,539 – 106,370 639,336
NLongstaff (vi) General Manager–Retail, Marketing, Sales 326,729 56,822 15,016 – 79,045 477,612
PHobman General Manager–MG Nutritionals 291,361 50,000 8,877 – 32,079 382,317
MBeniston General Manager–International Sales&Marketing 300,522 54,499 8,156 – 29,550 392,727
RGreenaway (vi) General Manager–Field Services&Strategic Issues 237,443 22,723 11,805 – 67,808 339,779
TOTAL 4,034,881 404,427 193,746 250,500 1,319,161 6,202,715
2010
GJDavies Chairman, non executive director 109,376 4,000 – 70,375 9,844 193,595
JTVardy Deputy chairman, non executive director 67,812 – – 33,750 6,103 107,665
WTBodman (iii) Non executive director 30,625 – – – 2,756 33,381
WMBrown (iv) Non executive director 21,875 – – – 1,969 23,844
PJOHawkins (v) Non executive director 42,395 – – – 3,816 46,211
DFHoward Non executive director 52,500 – – 7,500 4,725 64,725
KWJones Non executive director 52,500 – – *(15,018) 4,725 42,207
IWMacAulay (iv) Former Chairman, non executive director 54,687 5,000 – – 4,922 64,609
STMills Non executive director 52,500 – – 12,500 4,725 69,725
GNMunzel Non executive director 52,500 – – – 4,725 57,225
JPPye Non executive director 52,500 – – – 4,725 57,225
PWTracy (iii) Non executive director 30,625 – – – 2,756 33,381
WJAVerboon (iv) Non executive director 21,875 – – *(49,126) 1,969 (25,282)
SJO’Rourke (vi) Managing Director 1,417,747 47,912 23,033 – – 1,488,692
PKerr (vi) Chief Operating Officer 398,822 32,198 6,287 – 62,365 499,672
NLongstaff (vi) General Manager–Retail, Marketing, Sales 285,222 18,119 4,588 – 51,159 359,088
PHobman General Manager–MG Nutritionals / R&D 262,996 23,896 4,327 – 28,971 320,190
MBeniston General Manager–International Sales&Marketing 257,371 47,847 4,289 – 25,500 335,007
DMoffatt General Manager–Engineering Technical Services 207,215 43,966 3,347 – 22,755 277,283
TOTAL 3,471,143 222,938 45,871 59,981 248,510 4,048,443
* Negative remuneration represents a reversal of previous allocations to directors for which retirement benefit will not / has not been paid.
DIRECTORS’ REPORT
(i) Non monetary compensation includes the increased / decreased value of annual leave entitlements (short term) and long service leave entitlements (long term) accrued to employees in respect of leave not taken in the current and prior years.
Non monetary compensation also includes the provision of a motor vehicle, health insurance and notional interest on an interest free loan as disclosed in Note 31(d).
All key personnel listed above were employed by the company throughout the year ended 30 June 2011 and 30 June 2010 except for:(ii) M Van de Wouw appointed to the Board of Directors on 24 November 2010.(iii) WT Bodman and PW Tracy were appointed to the Board of Directors on 25 November 2009.(iv) WM Brown, IW MacAulay and WJA Verboon resigned from the Board of Directors on 25 November 2009.(v) PJO Hawkins appointed to the Board of Directors on 9 September 2009.(vi) SJ O’Rourke, P Kerr, N Longstaff and R Greenaway are all members of a defined benefit superannuation plan (refer Note 27). Total short term employee benefits for key management personnel of the consolidated entity is $4,439,308 (2010: $3,694,081).Total long term employee benefits for key management personnel of the consolidated entity is $193,746 (2010: $45,871).Total post employment employee benefits for key management personnel of the consolidated entity is $1,569,661 (2010: $308,491).
In accordance with the company’s constitution, a director must hold at least 10,000 ordinary shares in their own name, supply all the milk they produce to Murray Goulburn for a period of one year prior to their appointment as a director and be in good standing in their trading relationship with each member of the Murray Goulburn Group. Regional elections for non executive directors are held each three years.Directors must retire from office at the conclusion of each three year period but may nominate for further appointment at each subsequent election.
Non executive directors’ compensation consists of an annual fee approved by the members at the Annual General Meeting, amounts provided by the company for retirement benefits and superannuation at the statutory rate of 9.0%. The retirement benefit paid is equivalent to total emoluments received in the preceding 3 years for more than 10 years continuous board service or pro rata after 6 years continuous board service until the full benefit becomes payable. The company provides for retirement benefits on an accrual basis.
The managing director’s compensation is fixed and is set by the remuneration committee and approved by resolution of the board. The remuneration committee considers market related data and the overall continued performance of the consolidated entity in meeting the co–operative’s objectives when assessing the managing director’s salary and other entitlements. The company has not provided financial incentives directly in connection with the earnings or shareholder wealth of the consolidated entity or company in the past five years. Given the co–operative is committed, as a priority, to supporting supplier members through maximising the price paid for milk received and the provision of other on farm and financial services to supplier members, it is considered not appropriate to only measure performance directly against earnings and shareholder wealth.
Executives’ compensation is fixed and is assessed against market rates and individual performance and is determined by the Managing Director annually. The company has not provided financial incentives directly in connection with the earnings or shareholder wealth of the consolidated entity or company in the past five years.
The following table outlines the consolidated entity’s earnings and dividends paid in respect of the financial year over the past five years:
NET SALESREVENUE
$000
PROFITBEFORE
TAX$000
DIVIDENDS PAID IN
RESPECT OF
$000
Financial year ended 30 June 2011 2,287,492 40,027 26,366
Financial year ended 30 June 2010 2,163,441 24,772 26,077
Financial year ended 30 June 2009 2,329,285 (25,433) 17,813
Financial year ended 30 June 2008 2,571,863 101,282 26,391
Financial year ended 30 June 2007 2,119,342 25,748 24,106 All shares in the company are traded at a fixed $1.00 per share. A bonus issue of one for every ten shares held by members holding ordinary shares was made during the financial years ended 30 June 2008 and 30 June 2011. Signed in accordance with a resolution of the Board of Directors.
GJ Davies Director Melbourne, 28 September 2011
35

CONSOLIDATED INCOME STATEMENT FOR THE FINANCIAL YEAR ENDED 30 JUNE 2011
NOTE
2011 $000
2010 $000
Sales revenue 2 2,287,492 2,163,441
Cost of sales (1,971,145) (1,856,212)
Gross profit 316,347 307,229
Other income 2 4,885 5,147
Share of profit of associates 13 (3,583) 1,058
Distribution expenses (135,098) (141,551)
Marketing expenses 3 (20,717) (18,775)
Administration expenses (69,722) (67,589)
Finance costs 3 (24,073) (26,694)
Other expenses (28,012) (34,053)
Profit / (Loss) before income tax 40,027 24,772
Income tax (expense) / benefit 4 (3,708) 3,269
PROFIT FOR THE YEAR 36,319 28,041
Attributable to:
Equity holders of the parent 28,457 24,809
Minority interest 7,862 3,232
36,319 28,041
The accompanying Notes form part of these Financial Statements
36

37
CONSOLIDATED BALANCE SHEET AS AT 30 JUNE 2011
NOTE
2011 $000
2010 $000
CURRENTASSETS
Cash 5,697 10,755
Receivables 8 355,345 381,480
Inventories 9 389,158 377,979
Other 10 4,833 6,730
Total Current Assets 755,033 776,944
NONCURRENTASSETS
Receivables 8 45,792 44,919
Investments accounted for using the Equity Method 13 15,354 13,975
Other Financial Assets 11 29,799 14,020
Property, Plant & Equipment 14 666,044 651,063
Intangible Assets 15 9,359 10,603
Other 10 8,753 7,757
Total Non Current Assets 775,101 742,337
TOTAL ASSETS 1,530,134 1,519,281
CURRENTLIABILITIES
Payables 16 288,356 219,601
Borrowings 17 68,657 78,476
Current Tax Payable 18 – –
Provisions 19 43,183 38,597
Total Current Liabilities 400,196 336,674
NONCURRENTLIABILITIES
Payables 16 2,451 4,204
Borrowings 17 287,452 429,750
Provisions 19 6,381 7,336
Deferred Tax Liabilities 20 45,185 22,314
Total Non Current Liabilities 341,469 463,604
TOTAL LIABILITIES 741,665 800,278
NET ASSETS 788,469 719,003
EQUITY
Issued Capital 22 235,240 233,140
Reserves 23 200,407 144,505
Retained Earnings 24 252,197 249,817
Parent Entity Interest 687,844 627,462
Minority Interest 25 100,625 91,541
TOTAL EQUITY 788,469 719,003
The accompanying Notes form part of these Financial Statements

CO
NSO
LID
ATED
STA
TEM
ENT
OF
CH
ANG
ES IN
EQ
UIT
Y
FOR
TH
E FI
NAN
CIA
L YE
AR E
ND
ED 3
0 JU
NE
2011
ISSU
ED
CA
PIT
AL
$00
0
CA
PIT
AL
RES
ERVE
$00
0
ASS
ET
REV
ALU
ATI
ON
RES
ERVE
$00
0
GEN
ERA
L
RES
ERVE
$00
0
HED
GE
RES
ERVE
$00
0
INVE
STM
ENT
REV
ALU
ATI
ON
RES
ERVE
$00
0
SHA
RE
ALL
OTM
ENT
RES
ERVE
$00
0
FOR
EIG
N
CU
RR
ENC
Y
TRA
NSL
ATI
ON
RES
ERVE
$00
0
RET
AIN
ED
EAR
NIN
GS
$00
0
ATTR
IBU
TAB
LE
TO O
WN
ERS
OF
THE
PA
REN
T
$00
0
NO
N–
CO
NTR
OLL
ING
INTE
RES
TS
$00
0
TOTA
L
$00
0
BA
LAN
CE
AT
1 JU
LY 2
009
230
,021
3
6,91
6 1
03,2
60
5,2
57
12,
288
–
2,5
64
(11)
242
,821
6
33,1
16
93,
924
727
,040
Pro
fit o
r (L
oss)
for
the
year
–
–
–
–
–
–
–
–
24,
809
24,
809
3,2
32
28,
041
Oth
er c
ompr
ehen
sive
inco
me
–
–
(387
) –
(1
2,19
6) (4
,188
) –
(5
6) –
(1
6,82
7) –
(1
6,82
7)
Tota
l com
preh
ensi
ve in
com
e –
–
(3
87)
–
(12,
196)
(4,1
88)
–
(56)
24,
809
7,9
82
3,2
32
11,
214
Pay
men
t of d
ivid
ends
–
–
–
–
–
–
–
–
(17,
813)
(17,
813)
–
(17,
813)
Issu
e of
ord
inar
y sh
ares
to m
ilk s
uppl
iers
1,3
45
–
–
–
–
–
–
–
–
1,3
45
–
1,3
45
Div
iden
d re
inve
stm
ent p
lan
issu
es 1
,774
–
–
–
–
–
–
–
–
1
,774
–
1
,774
Shar
es b
ough
t bac
k an
d ca
ncel
led
–
–
–
–
–
–
–
–
–
–
(5,4
40)
(5,4
40)
Allo
tmen
t of s
hare
s to
sup
plie
rs –
–
–
–
–
–
(2
,564
) –
–
(2
,564
) –
(2
,564
)
Shar
es to
be
issu
ed in
lieu
of m
ilk p
aym
ents
–
–
–
–
–
–
3,6
22
–
–
3,6
22
–
3,6
22
Oth
er –
–
–
–
–
–
–
–
–
–
(1
75)
(175
)
BALANCEAT30JUNE2010
233,140
36,916
102,873
5,257
92
(4,188)
3,622
(67)
249,817
627,462
91,541
719,003
Pro
fit o
r (L
oss)
for
the
year
–
–
–
–
–
–
–
–
28,
457
28,
457
7,8
62
36,
319
Oth
er c
ompr
ehen
sive
inco
me
–
–
15,
326
–
33,
681
6,7
23
–
82
–
55,
812
–
55,
812
Tota
l com
preh
ensi
ve in
com
e –
–
1
5,32
6 –
3
3,68
1 6
,723
–
8
2 2
8,45
7 8
4,26
9 7
,862
9
2,13
1
Pay
men
t of d
ivid
ends
–
–
–
–
–
–
–
–
(26,
077)
(26,
077)
–
(26,
077)
Issu
e of
ord
inar
y sh
ares
to m
ilk s
uppl
iers
1,9
78
–
–
–
–
–
–
–
–
1,9
78
–
1,9
78
Div
iden
d re
inve
stm
ent p
lan
issu
es 1
22
–
–
–
–
–
–
–
–
122
–
1
22
Issu
e of
sha
re c
apita
l –
–
–
–
–
–
–
–
–
–
1
,109
1
,109
Allo
tmen
t of s
hare
s to
sup
plie
rs –
–
–
–
–
–
(3
,622
) –
–
(3
,622
) –
(3
,622
)
Shar
es to
be
issu
ed in
lieu
of m
ilk p
aym
ents
–
–
–
–
–
–
3,7
12
–
–
3,7
12
–
3,7
12
Oth
er –
–
–
–
–
–
–
–
–
–
1
13
113
BALANCEAT30JUNE2011
235,240
36,916
118,199
5,257
33,773
2,535
3,712
15
252,197
687,844
100,625
788,469
The
acco
mpa
nyin
g N
otes
form
par
t of t
hese
Fin
anci
al S
tate
men
ts
38

ISSU
ED
CA
PIT
AL
$00
0
CA
PIT
AL
RES
ERVE
$00
0
ASS
ET
REV
ALU
ATI
ON
RES
ERVE
$00
0
GEN
ERA
L
RES
ERVE
$00
0
HED
GE
RES
ERVE
$00
0
INVE
STM
ENT
REV
ALU
ATI
ON
RES
ERVE
$00
0
SHA
RE
ALL
OTM
ENT
RES
ERVE
$00
0
FOR
EIG
N
CU
RR
ENC
Y
TRA
NSL
ATI
ON
RES
ERVE
$00
0
RET
AIN
ED
EAR
NIN
GS
$00
0
ATTR
IBU
TAB
LE
TO O
WN
ERS
OF
THE
PA
REN
T
$00
0
NO
N–
CO
NTR
OLL
ING
INTE
RES
TS
$00
0
TOTA
L
$00
0
BA
LAN
CE
AT
1 JU
LY 2
009
230
,021
3
6,91
6 1
03,2
60
5,2
57
12,
288
–
2,5
64
(11)
242
,821
6
33,1
16
93,
924
727
,040
Pro
fit o
r (L
oss)
for
the
year
–
–
–
–
–
–
–
–
24,
809
24,
809
3,2
32
28,
041
Oth
er c
ompr
ehen
sive
inco
me
–
–
(387
) –
(1
2,19
6) (4
,188
) –
(5
6) –
(1
6,82
7) –
(1
6,82
7)
Tota
l com
preh
ensi
ve in
com
e –
–
(3
87)
–
(12,
196)
(4,1
88)
–
(56)
24,
809
7,9
82
3,2
32
11,
214
Pay
men
t of d
ivid
ends
–
–
–
–
–
–
–
–
(17,
813)
(17,
813)
–
(17,
813)
Issu
e of
ord
inar
y sh
ares
to m
ilk s
uppl
iers
1,3
45
–
–
–
–
–
–
–
–
1,3
45
–
1,3
45
Div
iden
d re
inve
stm
ent p
lan
issu
es 1
,774
–
–
–
–
–
–
–
–
1
,774
–
1
,774
Shar
es b
ough
t bac
k an
d ca
ncel
led
–
–
–
–
–
–
–
–
–
–
(5,4
40)
(5,4
40)
Allo
tmen
t of s
hare
s to
sup
plie
rs –
–
–
–
–
–
(2
,564
) –
–
(2
,564
) –
(2
,564
)
Shar
es to
be
issu
ed in
lieu
of m
ilk p
aym
ents
–
–
–
–
–
–
3,6
22
–
–
3,6
22
–
3,6
22
Oth
er –
–
–
–
–
–
–
–
–
–
(1
75)
(175
)
BALANCEAT30JUNE2010
233,140
36,916
102,873
5,257
92
(4,188)
3,622
(67)
249,817
627,462
91,541
719,003
Pro
fit o
r (L
oss)
for
the
year
–
–
–
–
–
–
–
–
28,
457
28,
457
7,8
62
36,
319
Oth
er c
ompr
ehen
sive
inco
me
–
–
15,
326
–
33,
681
6,7
23
–
82
–
55,
812
–
55,
812
Tota
l com
preh
ensi
ve in
com
e –
–
1
5,32
6 –
3
3,68
1 6
,723
–
8
2 2
8,45
7 8
4,26
9 7
,862
9
2,13
1
Pay
men
t of d
ivid
ends
–
–
–
–
–
–
–
–
(26,
077)
(26,
077)
–
(26,
077)
Issu
e of
ord
inar
y sh
ares
to m
ilk s
uppl
iers
1,9
78
–
–
–
–
–
–
–
–
1,9
78
–
1,9
78
Div
iden
d re
inve
stm
ent p
lan
issu
es 1
22
–
–
–
–
–
–
–
–
122
–
1
22
Issu
e of
sha
re c
apita
l –
–
–
–
–
–
–
–
–
–
1
,109
1
,109
Allo
tmen
t of s
hare
s to
sup
plie
rs –
–
–
–
–
–
(3
,622
) –
–
(3
,622
) –
(3
,622
)
Shar
es to
be
issu
ed in
lieu
of m
ilk p
aym
ents
–
–
–
–
–
–
3,7
12
–
–
3,7
12
–
3,7
12
Oth
er –
–
–
–
–
–
–
–
–
–
1
13
113
BALANCEAT30JUNE2011
235,240
36,916
118,199
5,257
33,773
2,535
3,712
15
252,197
687,844
100,625
788,469
The
acco
mpa
nyin
g N
otes
form
par
t of t
hese
Fin
anci
al S
tate
men
ts
NOTE2011 $000
2010 $000
Profit for the year 36,319 28,041
Other comprehensive income
Increment (decrement) on revaluation of land and buildings 23 21,894 (553)
Transfer to income statement on cash flow hedges 23 1,742 (7,584)
Gain (Loss) on cashflow hedges taken to equity 23 46,374 (9,839)
Gain (Loss) on revaluation of available–for–sale financial assets 23 7,809 (4,188)
Exchange differences arising on translation
of foreign operations 23 117 (80)
Income tax relating to components of other comprehensive income 4 (22,124) 5,417
TOTALCOMPREHENSIVEINCOMEFORTHEYEAR 92,131 11,214
ATTRIBUTABLE TO:
Equity holders of the parent 84,269 7,982
Minority interest 7,862 3,232
92,131 11,214
The accompanying Notes form part of these Financial Statements
CONSOLIDATED STATEMENT OF COMPREHENSIVE INCOME FOR THE FINANCIAL YEAR ENDED 30 JUNE 2011
39

CONSOLIDATED STATEMENT OF CASH FLOWS FOR THE FINANCIAL YEAR ENDED 30 JUNE 2011
NOTE2011 $000
2010$000
CASHFLOWSFROMOPERATINGACTIVITIES
Receipts from customers 2,346,439 2,156,636
Payments to suppliers and employees (2,132,737) (1,972,990)
213,702 183,646
Dividends received 1,120 604
Interest received 4,185 6,044
Interest paid (24,736) (25,561)
Income taxes paid (2,961) (2,038)
Net cash inflow from operating activities 32(b) 191,310 162,695
CASHFLOWSFROMINVESTINGACTIVITIES
Payments for property, plant and equipment (53,847) (55,451)
Investment in associated company 13 (5,500) (3,375)
Payments to acquire financial assets (7,969) (18,207)
Proceeds from the sale of property, plant, equipment and vehicles 733 364
Net cash (outflow) from investing activities (66,583) (76,669)
CASHFLOWSFROMFINANCINGACTIVITIES
Dividends paid (25,955) (15,323)
Proceeds from the issue of ordinary shares 1,978 1,345
Repayment of lease liabilities (509) (709)
Proceeds from borrowings – 439,400
Repayment of borrowings (105,299) (508,540)
Net cash (outflow) from financing activities (129,785) (83,827)
Net (decrease) increase in cash (5,058) 2,199
Cash at the beginning of the year 10,755 8,556
CASHATTHEENDOFTHEYEAR 32(a) 5,697 10,755
The accompanying Notes form part of these Financial Statements
CONSOLIDATED STATEMENT OF CASH FLOWS FOR THE FINANCIAL YEAR ENDED 30 JUNE 2011
40
NOTE 1: SUMMARY OF SIGNIFICANT ACCOUNTING POLICIES This general purpose financial report has been prepared in accordance with the Corporations Act 2001, Accounting Standards and Interpretations, and complies with other requirements of the law. Accounting Standards include Australian equivalents to International Financial Reporting Standards (‘A–IFRS’) which ensure that the consolidated financial statements and accompanying notes comply with International Financial Reporting Standards (‘IFRS’).
The financial statements were authorised for issue by the directors on 28 September 2011.
The financial report has been prepared on the basis of historical cost, except for the revaluation of certain non current assets and financial instruments.
The financial report is presented in Australian dollars and all values are rounded to the nearest thousand dollars ($000), unless otherwise indicated, in accordance with ASIC Class Order 98/0100 which does apply to the consolidated entity.
In applying the consolidated entity’s accounting policies, below, management continually evaluates judgments, estimates and assumptions based on experience and other factors, including expectations of future events that may have an impact on the consolidated entity. All judgments, estimates and assumptions made are believed to be reasonable based on the most current set of circumstances available to management. Actual results may differ from the judgments, estimates and assumptions.
A) PRINCIPLES OF CONSOLIDATION The consolidated financial statements incorporate the assets and liabilities of all entities controlled by Murray Goulburn Co–Operative Co. Limited (“company”) as at 30 June 2011 and the results of all controlled entities for the year then ended from the date on which the company obtained control. The effects of all transactions between entities in the consolidated entity are eliminated in full. The company and its controlled entities together are referred to in this financial report as the consolidated entity.
On acquisition, the assets, liabilities and contingent liabilities of a subsidiary are measured at their fair values at the date of acquisition. Any excess of the cost of acquisition over the fair values of the identifiable net assets acquired is recognised as goodwill. If, after reassessment, the fair values of the identifiable net assets acquired exceed the cost of acquisition, the deficiency is credited to profit and loss in the period of acquisition.
The interest of minority shareholders in the equity of controlled entities is shown separately in the consolidated balance sheet.
B) INCOME TAX Current tax represents income taxes payable or recoverable in respect of the taxable profit or loss for the period. Current tax is recognised in the income statement, except when it relates to items credited or debited directly to equity, and is calculated based on tax rates and tax laws current as at reporting date.
Deferred tax is accounted for using the comprehensive balance sheet liability method in respect of temporary differences arising from differences between the carrying amount of assets and liabilities in the financial statements and the corresponding tax base of those items. Deferred tax is recognised in the income statement except (i) when it relates to items credited or debited directly to equity, in which case the deferred tax is also recognised directly in equity or (ii) where it relates to items arising from the initial recognition of assets and liabilities, other than as a result of business combinations, which affects neither taxable income or accounting profit. Furthermore, a deferred tax liability is not recognised in relation to taxable temporary differences arising from goodwill.
Deferred tax assets are recognised to the extent that it is probable that sufficient taxable amounts will be available against which deductible temporary differences or unused tax losses can be utilised. Deferred tax is measured at the rate of income tax expected to apply in the period in which the benefit will be received or the liability will become payable based on applicable tax rates and tax laws. Deferred tax assets and liabilities are offset as the consolidated entity intends to settle its current tax assets and liabilities on a net basis. The company and its wholly–owned entities are part of a tax consolidated group. Murray Goulburn Co–operative Co. Limited is the head entity in the tax consolidated group. Tax expense/income, deferred tax assets and deferred tax liabilities arising from temporary differences of the members of the tax consolidated group are recognised in the separate financial statements of the members of the tax consolidated group using a ‘group allocation’ approach. Under this approach each entity prepares a notional taxable income or loss as if it were a taxpayer in its own right except that distributions made and received, capital gains and losses, gains or losses from intra–group debt forgiveness and similar items arising on transactions within the tax consolidated group are treated as having no tax consequence. The tax expense/income, deferred tax assets and deferred tax liabilities arising from temporary differences of the members of the tax consolidated group is allocated to each entity with reference to the individual entities notional tax calculation.
Current tax liabilities and assets and deferred tax assets arising from unused tax losses and tax credits of the members of the tax consolidated group are recognised by the company (as head entity in the tax consolidated group).
Due to the existence of a tax funding arrangement between the entities in the tax consolidated group, amounts are recognised as payable to or receivable by the company and each member of the group in relation to the tax contribution amounts paid or payable between the parent entity and the other members of the tax consolidated group in accordance with the arrangement. Further information about the tax funding arrangement is detailed in Note 4 to the financial statements. Where the tax contribution amount recognised by each member of the tax–consolidated group for a particular period is different to the aggregate of the current tax liability or asset and any deferred tax asset arising from unused tax losses and tax credits in respect of that period, the difference is recognised as a contribution from (or distribution to) equity participants.
C) DERIVATIVE FINANCIAL INSTRUMENTS The consolidated entity enters into a variety of derivative financial instruments to manage its exposure to foreign exchange and interest rate risk, including forward exchange contracts, currency options and interest rate swaps. Further details of derivative financial instruments are disclosed in Note 30.
Derivatives are initially recognised at fair value at the time of entering a derivative contract and are subsequently remeasured to fair value at each reporting date. The fair value calculation of derivative financial instruments is measured by using valuation techniques based on observable market prices or rates. The resulting gain or loss is recognised in profit or loss immediately unless the derivative is designated and effective as a hedging instrument, in which event, the timing of the recognition in profit or loss depends on the nature of the hedge relationship. The consolidated entity designates certain derivatives as either fair value hedges when they hedge the exposure to changes in the fair value of recognised assets, liabilities or firm commitments or cash flow hedges when they hedge exposure to variability in cash flows of highly probable forecast transactions.
NOTES TO THE FINANCIAL STATEMENTS FOR THE FINANCIAL YEAR ENDED 30 JUNE 2011
41
42
NOTE 1: SUMMARY OF SIGNIFICANT ACCOUNTING POLICIES (CONTINUED) Fair Value Hedge Changes in the fair value of derivatives that are designated and qualify as fair value hedges are recorded in profit or loss together with any changes in the fair value of the hedged asset or liability that is attributable to the hedged risk.
Hedge accounting is discontinued when the hedge instrument expires or is sold, terminated, exercised, no longer qualifies for hedge accounting or the consolidated entity revokes the hedge relationship. The adjustment to the carrying amount of the hedged item arising from the hedged risk is amortised to profit or loss from that date.
Cash Flow Hedge The effective portion of changes in the fair value of derivatives that are designated and qualify as cash flow hedges are deferred in equity. The gain or loss relating to the ineffective portion is recognised in profit or loss. Amounts deferred in equity are transferred to profit or loss in the period when the hedged item is recognised in profit or loss.
Hedge accounting is discontinued when the hedge instrument expires or is sold, terminated, exercised, no longer qualifies for hedge accounting or the consolidated entity revokes the hedge relationship. At that time, any cumulative gain or loss deferred in equity at that time remains in equity and is recognised when the forecast transaction is ultimately recognised in profit or loss. When a forecast transaction is no longer expected to occur, the cumulative gain or loss that was deferred in equity is recognised immediately in profit or loss.
Changes in the fair value of any derivative instruments that do not qualify for hedge accounting are recognised immediately in profit or loss.
D) FOREIGN CURRENCIES Foreign currency transactions during the year are converted to Australian currency at the exchange rate ruling at the date of the transaction. Foreign currency monetary items at balance date are translated at the exchange rate ruling at that date. Exchange differences are recognised in the income statement in the period in which they arise except for differences on transactions entered into to hedge certain foreign currency risks – refer Note 1 (c) above.
E) PROPERTY, PLANT AND EQUIPMENT Land and buildings are measured at fair value. Plant and equipment are included at cost being the purchase consideration determined as at the date of acquisition plus costs incidental to the acquisition less impairment. The cost of fixed assets constructed within the consolidated entity includes the cost of materials and direct labour. All fixed assets including buildings and capitalised leasehold assets, but excluding freehold land, are depreciated over their estimated useful lives commencing from the time the asset is held ready for use.
Any revaluation increase arising on the revaluation of land and buildings is credited to the asset revaluation reserve, except to the extent that it reverses a revaluation decrease for the same asset previously recognised as an expense in profit or loss, in which case the increase is credited to the income statement to the extent of the decrease previously charged. A decrease in carrying amount arising on the revaluation of land and buildings is charged as an expense in profit or loss to the extent that it exceeds the balance, if any, held in the asset revaluation reserve relating to a previous revaluation of that asset. When an item of land and buildings is revalued, any accumulated depreciation at the date of the revaluation is eliminated against the gross carrying amount of the asset and the net amount restated to the revalued amount of the asset. The amount of the adjustment arising on the restatement or elimination of accumulated depreciation forms part of the increase or decrease in carrying amount.
The gain or loss on disposal of all fixed assets, including revalued assets, is determined as the difference between the carrying amount of the asset at the time of disposal and the proceeds of disposal, and is included in the income statement of the group in the year of disposal. Any realised revaluation increment relating to the disposed asset which is included in the asset revaluation reserve is transferred to retained earnings.
F) DEPRECIATION OF PROPERTY, PLANT AND EQUIPMENT Depreciation is calculated using the diminishing value method to write off the net cost or revalued amount of each item of property, plant and equipment (excluding land) over its expected useful life to the consolidated entity.
The expected useful lives are as follows: Buildings– 30 to 40 years Vehicles – 3 to 8 years Plant and Equipment – 5 to 15 years Tankers – 10 to 20 years
G) IMPAIRMENT OF ASSETS The carrying amount of assets is reviewed each balance date to identify any impairment loss. Assets are written down to recoverable amount where the carrying value of the asset exceeds the recoverable amount, by reference to cash–generating units. The recoverable amount is the greater of fair value less costs to sell and value in use. In assessing value in use, the estimated future cash flows are discounted to their present value using a pre–tax discount rate that reflects current market assessments of the time value of money and the risks specific to the asset. Impairment losses are recognised in the income statement unless the asset is carried at valuation in which case the impairment loss is recognised as a revaluation decrease to the extent of any previous increase.
H) FINANCIAL ASSETS Investments in associated companies are accounted for under the equity method in the consolidated financial statements. Trade receivables, loans and other receivables are recorded at amortised cost, using the effective interest method, less impairment through the allowance account. The adjustment to employee loans has been capitalised as an asset to the extent that it relates to future employee services.
The effective interest method is a method of calculating the amortised cost of a financial asset and of allocating interest income over the relevant period. The effective interest rate is the rate that exactly discounts estimated future cash receipts (including fees and transaction costs) through the expected life of the financial asset, or, where appropriate, a shorter period.
Listed shares held by the consolidated entity that are traded in an active market are classified as “Available for Sale” and are stated at fair value. Gains and losses arising from changes in fair value are recognised in other comprehensive income and accumulated in the investments revaluation reserve, with the exception of impairment losses. Where the investment is disposed of or is determined to be impaired the cumulative gain or loss previously accumulated in the investments revaluation reserve is reclassified to profit or loss. Dividends are recognised in profit or loss when the consolidated entity’s right to receive the dividends is established.
NOTES TO THE FINANCIAL STATEMENTS FOR THE FINANCIAL YEAR ENDED 30 JUNE 2011

I) GOODS AND SERVICES TAX Revenues, expenses and assets are recognised net of the amount of goods and services tax (GST), except: i. where the amount of GST incurred is not recoverable from the taxation authority. In this case the GST is recognised as part of the cost of acquisition of an asset or as part of an item of expense; or ii. for receivables and payables which are recognised inclusive of GST.
The net amount of GST recoverable from, or payable to, the taxation authority is included as part of receivables or payables. Cash flows are included in the cash flow statement on a gross basis. The GST component of cash flows arising from investing and financing activities which is recoverable from, or payable to, the taxation authority is classified as operating cash flows.
J) INTANGIBLE ASSETS Intangible assets are recorded at cost less impairment. All potential intangible assets acquired in a business combination are identified and recognised separately from goodwill where they satisfy the definition of an intangible asset and their fair value can be measured reliably.
K) LEASED ASSETS Leased assets classified as finance leases are capitalised as fixed assets. A finance lease effectively transfers from the lessor to the lessee substantially all the risks and benefits incidental to the ownership of the leased asset. The amount initially brought to account is the fair value or, if lower, the present value of minimum lease payments. Capitalised leased assets are amortised on a reducing balance basis over the estimated useful life of the asset. Finance lease payments are allocated between interest expense and reduction of lease liability over the term of the lease. The interest expense is determined by applying the interest rate implicit in the lease to the outstanding lease liability at the beginning of each lease payment period.
Operating lease payments are recognised as an expense in the periods in which they are incurred, as this represents the pattern of benefits derived from the leased assets.
L) INVENTORIES Dairy produce stocks are valued at the lower of cost and net realisable value. Cost comprises direct materials, direct labour, maturation costs and an allocation of fixed factory overheads.
Stores, packing materials and Murray Goulburn Trading stocks, have been valued at the lower of cost and net realisable value. Costs have been allocated on the first in first out basis.
Net realisable value represents the estimated selling price less selling, marketing and distribution costs.
M) INVESTMENT IN ASSOCIATES An associate is an entity over which the consolidated entity has significant influence and that is neither a subsidiary nor an interest in a joint venture. Significant influence is the power to participate in the financial and operating policy decisions of the investee but has no control or joint control over those policies. The results and assets and liabilities of associates are incorporated in these financial statements using the equity method of accounting. Under the equity method, investments in associates are carried in the consolidated balance sheet at cost as adjusted for post–acquisition changes in the consolidated entity’s share of the net assets of the associate, less any impairment in the value of individual investments. Any excess of the cost of acquisition over the consolidated entity’s share of the net fair value of the identifiable assets, liabilities and contingent liabilities of the associate recognised at the date of acquisition is recognised as goodwill. The goodwill is included within the carrying amount of the investment and is assessed for impairment as part of that investment. Any excess of the consolidated entity’s share of the net fair value of the identifiable assets, liabilities and contingent liabilities over the cost of acquisition, after reassessment, is recognised immediately in profit or loss.
N) GOODWILL Goodwill, representing the excess of the cost of acquisition over the fair value of the assets and liabilities acquired, is recognised as an asset and, for the purpose of impairment testing, is allocated to the cash generating unit to which it relates. Goodwill is tested for impairment annually or where an indicator of impairment is identified. Goodwill is not amortised however, any impairment is recognised immediately in profit or loss.
O) ACCOUNTS PAYABLE Trade payables and other accounts payable are recognised when the consolidated entity becomes obliged to make future payments resulting from the purchase of goods and services. Payables are initially measured at fair value and subsequent to initial recognition are measured at amortised cost using the effective interest method with interest expense recognised on an effective yield basis.
The effective interest method is a method of calculating the amortised cost of a financial liability and of allocating interest expense over the relevant period. The effective interest rate is the rate that exactly discounts estimated future cash payments through the expected life of the financial liability, or, where appropriate, a shorter period.
P) PROVISIONS Provisions are recognised when the consolidated entity has a present obligation, the future sacrifice of economic benefits is probable and the amount of the provision can be measured reliably. The amount recognised as a provision is the best estimate of the consideration required to settle the present obligation at reporting date. Where a provision is measured using the cash flows estimated to settle the present obligation, its carrying amount is the present value of those cash flows.
Q) EMPLOYEE BENEFITS Provision is made for benefits accruing to employees in respect of wages and salaries, annual leave, long service leave and sick leave when it is probable that settlement will be required and they are capable of being measured reliably.
Provisions are measured at their nominal values using the remuneration rate expected to apply at the time of settlement where they are expected to be settled within twelve months. Provisions not expected to be settled within twelve months are measured at the present value of the estimated future cash outflows in respect of services provided up to balance date. For defined benefit superannuation plans, the cost of providing benefits is determined using the projected unit credit method, with actuarial valuations being carried out at each reporting date. Actuarial gains and losses are recognised immediately in profit or loss in the year in which they occur.
Past service cost is recognised immediately to the extent that the benefits are already vested, and otherwise is amortised on a straight–line basis over the average period until the benefits become vested.
The defined benefit obligation recognised in the balance sheet represents the present value of the defined benefit obligation, adjusted for unrecognised past service cost, net of the fair value of the plan assets. Any asset resulting from this calculation is limited to past service cost, plus the present value of available refunds and reductions in future contributions to the plan.
43
NOTES TO THE FINANCIAL STATEMENTS FOR THE FINANCIAL YEAR ENDED 30 JUNE 2011

44
NOTES TO THE FINANCIAL STATEMENTS FOR THE FINANCIAL YEAR ENDED 30 JUNE 2011
NOTE1: SUMMARY OF SIGNIFICANT ACCOUNTING POLICIES (CONTINUED) R) BORROWINGS Borrowings are recorded initially at fair value, net of transaction costs. Subsequent to initial recognition, borrowings are measured at amortised cost with any difference between the initial recognised amount and the redemption value being recognised in profit and loss over the period of the borrowing using the effective interest rate method.
S) BORROWING COSTS Interest expense is recognised using the effective interest rate method. Borrowing costs attributable to qualifying assets are capitalised as part of the cost of those assets.
T) REVENUE RECOGNITION Revenue from the sale of goods and disposal of assets is recognised when the consolidated entity has transferred to the buyer the significant risks and rewards of ownership of the goods. Interest revenue is recognised on a time proportion basis using the effective interest method. Dividend revenue is recognised when the consolidated entity’s right to receive the dividends is established.
U) CRITICAL ACCOUNTING ESTIMATES AND JUDGEMENTS Following are the critical estimates and judgements made by management in the process of applying the consolidated entity’s accounting policies: Inventories – the net realisable value of inventories is the estimated selling price in the ordinary course of business less estimated costs to sell. Key assumptions, including the expected selling price, require the use of management judgement and are reviewed semi–annually.
V) ADOPTION OF NEW AND REVISED STANDARDS In the current year, the consolidated entity adopted all of the new and revised standards and interpretations issued by the Australian Accounting Standards Board effective for the current annual reporting period. The adoption of these new and revised standards and interpretations did not have any material impact on the financial statements of the consolidated entity.
The consolidated entity has elected to early adopt AASB 9 ‘Financial Instruments’, as issued in December 2009, from 1 July 2010. AASB 9 specifies the basis for classifying and measuring financial assets. Classification is determined based on the contractual cash flow characteristics of the consolidated entity’s financial assets. Financial assets will be classified as either measured at amortised cost or fair value. AASB 9 replaces the classification and measurement requirements relating to financial assets in AASB 139 ‘Financial Instruments: Recognition and Measurement’. Under AASB 9 only equity instruments that are not held for trading are able to be classified as fair value through other comprehensive income rather than fair value through profit and loss. On disposal, in contrast to AASB 139, the cumulative gains or losses recognised in equity over the period the consolidated entity held the equity instrument are transferred directly to retained earnings and are not permitted to be recognised in profit and loss. The consolidated entity elected to designate its equity investments measured at fair value through other comprehensive income on adoption of AASB 9.
The adoption of this standard has not impacted on the consolidated entity’s current financial statements or comparatives as the accounting outcomes on the consolidated entity are consistent with those previously recognised under AASB 139 (on the basis that any diminution in the value of investments held for sale are not significant or prolonged).
Except for AASB 9 ‘Financial Instruments’, which the consolidated entity has early adopted, Australian Accounting Standards and Interpretations that have recently been issued or amended but are not yet effective have not been adopted by the consolidated entity for the annual reporting period ended 30 June 2011. In particular, the following relevant standards and interpretations were issued but not yet effective: Effective for annual reporting periods beginning on or after 1 January 2011> Revised AASB 124 Related Party Disclosures and AASB 2009–12 Amendments to Australian Accounting Standards> AASB 2009–14 Amendments to Australian Interpretation – Prepayments of a Minimum Funding Requirement> AASB 2010–4 Further Amendments to Australian Accounting Standards arising from the Annual Improvements Project> AASB 2010–5 Amendments to Australian Accounting Standards
Effective for annual reporting periods beginning on or after 1 July 2011> AASB 2010–6 Amendments to Australian Accounting Standards – Disclosures on Transfers of Financial Assets> AASB 1054 Australian Additional Disclosures> AASB 2011–1 & AASB 2011–2 Amendments to Australian Accounting Standards arising from Trans–Tasman Convergence
Effective for annual reporting periods beginning on or after 1 January 2012> AASB 2010–8 Amendments to Australian Accounting Standards – Deferred Tax: Recovery of Underlying Assets
Effective for annual reporting periods beginning on or after 1 July 2012> IAS 1 Presentation of Items of Other Comprehensive Income> AASB 2011–3 to AASB 2011–9 Amendments to Australian Accounting Standards
Effective for annual reporting periods beginning on or after 1 January 2013> AASB 9 Financial Instruments and AASB 2009–11 and AASB 2010–7 Amendments to Australian Accounting Standards arising from AASB 9 except for phase 1 as detailed above.> AASB 2010–10 Further Amendments to Australian Accounting Standards> AASB 10 Consolidated Financial Statements> AASB 11 Joint Arrangements> AASB 12 Disclosure of Interests in Other Entities> AASB 13 Fair Value Measurement> IAS 19 Employee Benefits> AASB 127 Separate Financial Statements (2011)> AASB 128 Investments in Associates and Joint Ventures (2011)> AASB 2011–8 Amendments to Australian Accounting Standards arising from AASB 13> AASB 2011–10 & AASB 2011–11 Amendments to Australian Accounting Standards arising from AASB 119
The directors anticipate that the adoption of these Standards and Interpretation in future periods will have no material impact on the financial statements of the consolidated entity.

45
NOTES TO THE FINANCIAL STATEMENTS FOR THE FINANCIAL YEAR ENDED 30 JUNE 2011
NOTE 2: REVENUE
NOTE2011 $000
2010 $000
REVENUE
Sales revenue 2,287,492 2,163,441
2,287,492 2,163,441
OTHER INCOME
Interest received or receivable from :
– other persons 4,302 5,147
Dividends received from other corporations 583 –
4,885 5,147
SALESANDOTHERINCOME 2,292,377 2,168,588
NOTE 3: PROFIT FROM OPERATIONS BEFORE INCOME TAX EXPENSE HAS BEEN DETERMINED AFTER:
CREDITING / CHARGING AS GAINS AND LOSSES:
Borrowing Costs
Interest paid or payable to :
– other persons 24,056 26,621
– finance charges on finance leases 17 73
Total borrowing costs expensed 24,073 26,694
Depreciation of :
– buildings 7,174 7,316
– plant and equipment and vehicles 51,179 49,694
14 58,353 57,010
Amortisation of :
– capitalised leases 156 378
14 156 378
Net loss on sale and scrapping of non–current assets 265 966
Write down of inventories to net realisable value 10,511 464
Rental expense on operating leases 21,217 18,763
Research and development expenditure 5,640 5,820
Employee benefits (excluding impact of defined benefit in Note 27) 194,479 197,541
Impairment of non current land and buildings 1,456 –
Impairment of intangible assets 1,244 –
COSTSINCURREDINTHECLOSUREOFTHELEITCHVILLESITE
Redundancy payments – 6,820
Impairment of non current assets (fair value less costs to sell) 14 – 3,572
– 10,392
Marketing expenses 20,717 18,775
Comparatives have been adjusted to reflect the 2011 practice of recording retail tradespend as a reduction to gross sales revenue rather than as a marketing expense. This adjustment has not impacted on net profit with both sales revenue and the associated expense decreasing by $79 million in 2010.

46
NOTES TO THE FINANCIAL STATEMENTS FOR THE FINANCIAL YEAR ENDED 30 JUNE 2011
NOTE 4: INCOME TAX (BENEFIT) / EXPENSE
a)Incometaxrecognisedinprofitorloss
NOTE2011 $000
2010 $000
Tax (benefit) / expense comprises:
Current tax expense 2,961 1,933
Deferred tax expense (benefit) 747 (5,202)
INCOMETAXEXPENSE(BENEFIT) 3,708 (3,269)
The prima facie income tax expense on pre–tax accounting profit reconciles to the income tax expense in the financial statements as follows:
Profit / (Loss) before income tax expense 40,027 24,772
Income tax calculated at the Australian statutory tax rate of 30% 12,008 7,432
Dividends as a co–operative (i) (7,823) (5,344)
Repayment of Rural Finance and State Government loans – (3,900)
Sundry items 50 (1,355)
Overprovision for income tax in prior year (527) (102)
INCOMETAXBENEFIT 3,708 (3,269)
(i) A tax deduction is obtained for unfranked dividends paid by the company. This amount does not include the benefit of tax deductions for dividends declared but not recognised, as disclosed in Note 7 below (the tax benefit of approximately $7,971,000 (2010: $8,032,000) at the corporate tax rate of 30% will be recognised in the financial year ending 30 June 2012 (30 June 2011)).

47
NOTES TO THE FINANCIAL STATEMENTS FOR THE FINANCIAL YEAR ENDED 30 JUNE 2011
b)Deferredincometaxat30Junerelatestothefollowing:
OPENINGBALANCE
$000
CHARGEDTO INCOME
$000
TRANSFER FROM EQUITY
TO INCOME$000
CHARGED TO EQUITY
$000
CLOSINGBALANCE
$000
2011
GROSS DEFERRED TAX LIABILITIES
Property, plant and equipment (57,573) 2,480 – (6,568) (61,661)
Consumables (7,855) (149) – – (8,004)
Investments – – – (1,086) (1,086)
Cash flow hedges (40) – (523) (13,912) (14,475)
Other (71) 5 – (6) (72)
(65,539) 2,336 (523) (21,572) (85,298)
GROSS DEFERRED TAX ASSETS
Provisions 15,483 447 – – 15,930
Tax losses 26,885 (4,165) – – 22,720
Other 857 635 – (29) 1,463
43,225 (3,083) – (29) 40,113
NETDEFERREDTAXLIABILITY (22,314) (747) (523) (21,601) (45,185)
2010
GROSS DEFERRED TAX LIABILITIES
Property, plant and equipment (59,994) 2,255 – 166 (57,573)
Consumables (7,791) (64) – – (7,855)
Cashflow hedges (5,267) – 2,275 2,952 (40)
Other (799) 728 – – (71)
(73,851) 2,919 2,275 3,118 (65,539)
GROSS DEFERRED TAX ASSETS
Provisions 15,014 469 – – 15,483
Tax losses 24,550 2,335 – – 26,885
Other 1,354 (521) – 24 857
40,918 2,283 – 24 43,225
NETDEFERREDTAXLIABILITY (32,933) 5,202 2,275 3,142 (22,314)
With the exception of pre tax–consolidation losses of $215,715 ($64,715 tax effected), all available tax losses have been brought to account and are included in the net deferred tax liability.
The company and its wholly–owned entities are part of a tax–consolidated group. The head entity within the tax–consolidated group is Murray Goulburn Co–operative Co. Limited. The members of the tax–consolidated group are identified in Note 12. Entities within the tax–consolidated group have entered into a tax funding arrangement and a tax sharing agreement with the head entity.Under the terms of the tax funding arrangement, each of the entities in the tax–consolidated group has agreed to pay a tax equivalent payment to or from the head entity, based on the current tax liability or current tax asset of the entity. Such amounts are reflected in amounts receivable from or payable to other entities in the tax–consolidated group.
NOTE 5 : COMPENSATION OF KEY MANAGEMENT PERSONNEL
Compensation of key management personnel is included in the Remuneration Report within the Directors’ Report. Total short term employee benefits for key management personnel of the consolidated entity is $4,439,308 (2010: $3,694,081). Total long term employee benefits for key management personnel of the consolidated entity is $193,746 (2010: $45,871). Total post employment employee benefits for key management personnel of the consolidated entity is $1,569,661 (2010: $308,491).

48
NOTES TO THE FINANCIAL STATEMENTS FOR THE FINANCIAL YEAR ENDED 30 JUNE 2011
NOTE 6: REMUNERATION OF AUDITORS
NOTE2011
$ 2010
$
Remuneration received by the auditor of the parent entity:
– auditing or reviewing the financial reports 342,000 326,000
– assurance related 79,710 15,100
– other consulting services 664,412 –
1,086,122 341,100
NOTE 7: DIVIDENDS PAID OR PROPOSED
2011 $000
2010 $000
RECOGNISEDAMOUNTS
Dividends in relation to the 2010 financial year (2009 financial year)
Fully Paid Ordinary Shares
Final dividend of 12 cents (2009: 8 cents) per share unfranked 22,210 14,872
Fully Paid A Class Non Cumulative Non–Redeemable Preference Shares
Final dividend of 8 cents (2009: 8 cents) per share unfranked 1,300 1,356
Fully Paid B Class Non Cumulative Non–Redeemable Preference Shares
Final dividend of 5 cents (2009: 2 cents) per share unfranked 753 352
Fully Paid C Class Non Cumulative Non–Redeemable Preference Shares
Final dividend of 8 cents (2009: 6 cents) per share unfranked 1,814 1,233
TOTALDIVIDENDSRECOGNISED 24 26,077 17,813
Dividends recognised during the current year differ to unrecognised amounts in the prior year below due to movements in issued capital during the period between 30 June 2010 and the actual payment of the dividend.
UNRECOGNISEDAMOUNTS
Dividends in relation to the 2011 financial year (2010 financial year)
Fully Paid Ordinary Shares
Final dividend of 12 cents (2010: 12 cents) per share unfranked 26,366 22,844
Fully Paid A Class Non Cumulative Non–Redeemable Preference Shares
Final dividend not declared (2010: 8 cents) per share unfranked – 1,311
Fully Paid B Class Non Cumulative Non–Redeemable Preference Shares
Final dividend not declared (2010: 5 cents) per share unfranked – 915
Fully Paid C Class Non Cumulative Non–Redeemable Preference Shares
Final dividend not declared (2010: 8 cents) per share unfranked – 1,703
TOTALDIVIDENDSUNRECOGNISED 26,366 26,773
ADJUSTEDFRANKINGACCOUNTBALANCE 9,676 8,809
The final dividends for Ordinary and A, B and C class preference shares, in respect of the financial year, were declared by the Board subsequent to the financial year end and have therefore not been recognised as a liability at 30 June. The value of the unrecognised dividends disclosed above are based on the respective dividend rates declared and the total of shares outstanding at 30 June and shares to be issued out of the share allotment reserve. The final value of the unrecognised dividends may change when paid dependent on movements in shareholdings between 30 June and the date of payment. Unrecognised dividends are unfranked and therefore do not impact on the adjusted franking account balance.

49
NOTES TO THE FINANCIAL STATEMENTS FOR THE FINANCIAL YEAR ENDED 30 JUNE 2011
NOTE 8: RECEIVABLES
NOTE2011 $000
2010 $000
CURRENT
Trade receivables 279,962 312,982
Less: allowance for doubtful debts (2,699) (3,107)
277,263 309,875
Other receivables 68,977 69,900
Foreign currency derivatives (i) 9,105 1,705
355,345 381,480
NONCURRENT
Other receivables 28 45,792 44,919
45,792 44,919
(i) Foreign currency derivatives represent unrealised gains on foreign exchange contracts that are hedges against sales. Unrealised gains and losses on foreign currency hedge contracts are deferred in equity or recognised in profit or loss as appropriate.Foreign currency derivatives are Level 2 financial instruments recorded at fair value using observable market inputs.
All receivables are recorded at amortised cost except for derivatives at (i) which are recorded at fair value.
Credit risk associated with these receivables is addressed in Note 30(c). The fair value of receivables is documented in Note 30(d).
The consolidated entity reviews the recoverability of receivables by reference to internal credit assessment and historical and ongoing customer payment trends. Trade receivables of $2,699,000 (2010: $3,107,000) in the consolidated entity have been assessed as impaired and provided for in the allowance for doubtful debts.
Movements in the allowance for doubtful debts
Balance at the beginning of the year 3,107 849
Impairment losses recognised on receivables – 3,285
Impairment losses reversed (241) –
Amounts written off as uncollectible (167) (1,027)
BALANCEATTHEENDOFTHEYEAR 2,699 3,107
Trade receivables of customers past due but considered recoverable are not provided for in the allowance for doubtful debts. The consolidated entity does not hold any collateral over these balances. Ageing of past due but not impaired trade receivables:
0 – 30 days 7,269 4,213
30 – 60 days 4,093 4,902
60 – 90 days 2,201 2,183
90+ days 4,741 5,536
18,304 16,834
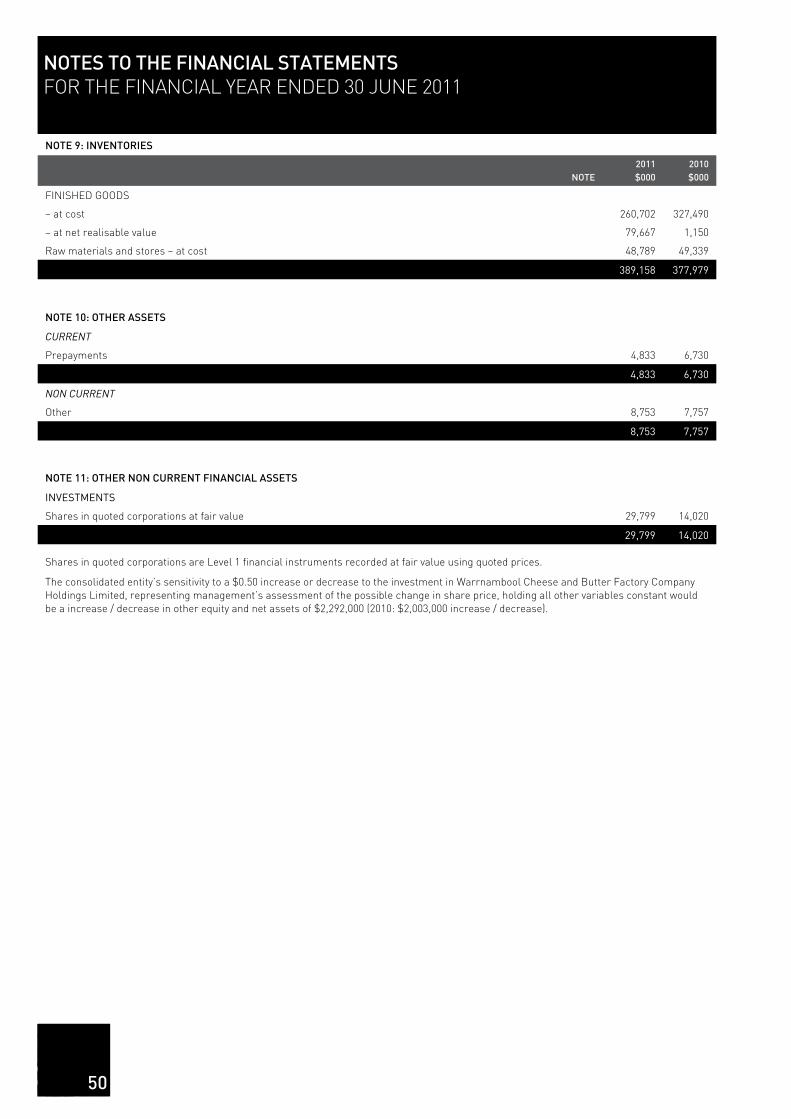
50
NOTES TO THE FINANCIAL STATEMENTS FOR THE FINANCIAL YEAR ENDED 30 JUNE 2011
NOTE 9: INVENTORIES
NOTE2011 $000
2010 $000
FINISHED GOODS
– at cost 260,702 327,490
– at net realisable value 79,667 1,150
Raw materials and stores – at cost 48,789 49,339
389,158 377,979
NOTE 10: OTHER ASSETS
CURRENT
Prepayments 4,833 6,730
4,833 6,730
NON CURRENT
Other 8,753 7,757
8,753 7,757
NOTE 11: OTHER NON CURRENT FINANCIAL ASSETS
INVESTMENTS
Shares in quoted corporations at fair value 29,799 14,020
29,799 14,020 Shares in quoted corporations are Level 1 financial instruments recorded at fair value using quoted prices. The consolidated entity’s sensitivity to a $0.50 increase or decrease to the investment in Warrnambool Cheese and Butter Factory Company Holdings Limited, representing management’s assessment of the possible change in share price, holding all other variables constant would be a increase / decrease in other equity and net assets of $2,292,000 (2010: $2,003,000 increase / decrease).

51
NOTES TO THE FINANCIAL STATEMENTS FOR THE FINANCIAL YEAR ENDED 30 JUNE 2011
NOTE 12: CONTROLLED ENTITIES All controlled entities, except for Murray Goulburn Investment Ltd, Qingdao Murray Goulburn Dairy Co., Ltd, Provico Pty Ltd and Murray Goulburn IFIS Pty Ltd, are wholly owned.
Control of all voting shares in Murray Goulburn Investment Ltd vests in Murray Goulburn Co-operative Co. Limited.
Murray Goulburn Co-operative Co. Limited holds 51% of all voting shares in Qingdao Murray Goulburn Dairy Co., Ltd, Provico Pty Ltd and Murray Goulburn IFIS Pty Ltd.
All controlled entities are incorporated in Victoria with the exception of Qingdao Murray Goulburn Dairy Co., Ltd (incorporated in China). Murray Goulburn Nominees Pty Ltd and Murray Goulburn Superannuation Pty Ltd are beneficially owned.
ENTITY NOTECLASS OF
SHARE
Parent Entity: Murray Goulburn Co–operative Co. Limited (a)
Controlled Entities of Murray Goulburn Co–operative Co. Limited:
Murray Goulburn Trading Pty Ltd (b) (e) Ordinary
Murray Goulburn Investment Limited Ordinary
MG Nutritionals Pty Ltd (b) (c) Ordinary
Meiji–MGC Dairy Co Pty Ltd (b) (c) Ordinary
Lavery International Pty Ltd (b) (c) Ordinary
Classic Food Holdings Pty Ltd (b) (c) Ordinary
Qingdao Murray Goulburn Dairy Co., Ltd (d) Ordinary
Provico Pty Ltd (c) Ordinary
MG Agrilink Pty Ltd (b) (c) Ordinary
Murray Goulburn IFIS Pty Ltd (c) Ordinary
Murray Goulburn International Pty Ltd (c) Ordinary
Controlled Entities of Classic Food Holdings Pty Ltd:
Classic Foods Pty Ltd (b) (c) Ordinary (a) Murray Goulburn Co–operative Co. Limited is the head entity within the tax–consolidated group. (b) These wholly–owned entities are members of the tax–consolidated group. (c) These entities are small proprietary companies pursuant to the Corporations Act 2001 and consequently are relieved from the requirement to prepare audited financial reports. (d) Qingdao Murray Goulburn Dairy Co., Ltd is incorporated in China. (e) This wholly–owned entity has entered into a deed of cross guarantee with Murray Goulburn Co–operative Co. Limited pursuant to ASIC Class Order 98/1418 and is relieved from the requirement to prepare and lodge an audited financial report.

52
NOTES TO THE FINANCIAL STATEMENTS FOR THE FINANCIAL YEAR ENDED 30 JUNE 2011
NOTE 12: CONTROLLED ENTITIES (CONTINUED)
The consolidated balance sheet of entities which are party to the deed of cross guarantee is:
NOTE2011 $000
2010 $000
BALANCE SHEET
CURRENTASSETS
Cash 119 9,704
Receivables 357,316 390,432
Inventories 382,662 372,083
Other 3,996 5,771
TOTAL CURRENT ASSETS 744,093 777,990
NONCURRENTASSETS
Receivables 53,738 53,936
Other Financial Assets 53,896 26,820
Property, Plant & Equipment 651,573 636,019
Intangible Assets 4,155 4,155
Other 8,753 7,553
TOTAL NON CURRENT ASSETS 772,115 728,483
TOTAL ASSETS 1,516,208 1,506,473
CURRENTLIABILITIES
Payables 281,556 217,032
Borrowings 68,657 78,476
Provisions 43,136 38,542
TOTAL CURRENT LIABILITIES 393,349 334,050
NONCURRENTLIABILITIES
Payables 1,699 3,452
Borrowings 391,663 526,352
Provisions 6,381 7,336
Deferred Tax Liabilities 45,827 23,081
TOTAL NON CURRENT LIABILITIES 445,570 560,221
TOTAL LIABILITIES 838,919 894,271
NETASSETS 677,289 612,202
EQUITY
Issued Capital 235,240 233,140
Reserves 153,531 97,712
Retained Earnings (i) 288,518 281,350
Parent Entity Interest 677,289 612,202
Minority Interest – –
TOTALEQUITY 677,289 612,202
(i)MOVEMENTINRETAINEDEARNINGS
Balance at the beginning of the financial year 281,350 273,526
Net profit 33,245 25,637
Dividends provided for or paid (26,077) (17,813)
Transfer from asset revaluation reserve – –
BALANCEATTHEENDOFTHEFINANCIALYEAR 288,518 281,350

53
NOTES TO THE FINANCIAL STATEMENTS FOR THE FINANCIAL YEAR ENDED 30 JUNE 2011
The consolidated income statement of entities which are party to the deed of cross guarantee is:
NOTE2011 $000
2010 $000
INCOME STATEMENT
Sales revenue 2,278,244 2,158,576
Cost of sales (1,969,037) (1,854,897)
Gross profit 309,207 303,679
Other income 5,839 6,293
Distribution expenses (135,098) (141,551)
Marketing expenses (16,701) (14,930)
Administration expenses (70,507) (68,320)
Finance costs (33,351) (32,927)
Other expenses (25,398) (31,810)
Profit before income tax 33,991 20,434
Income tax (expense) / benefit (746) 5,203
PROFITFORTHEPERIOD 33,245 25,637
TOTAL COMPREHENSIVE INCOME
Profit for the year 33,245 25,637
Other comprehensive income
Gain / (Loss) on property revaluation 21,894 (553)
Transfer to income statement on cash flow hedges 1,742 (7,584)
Gain / (Loss) on cashflow hedges taken to equity 46,374 (9,839)
Gain / (Loss) on revaluation of available–for–sale financial assets 7,809 (4,188)
Income tax relating to components of other comprehensive income (22,090) 5,393
TOTALCOMPREHENSIVEINCOME/(EXPENSE)FORTHEYEAR 88,974 8,866
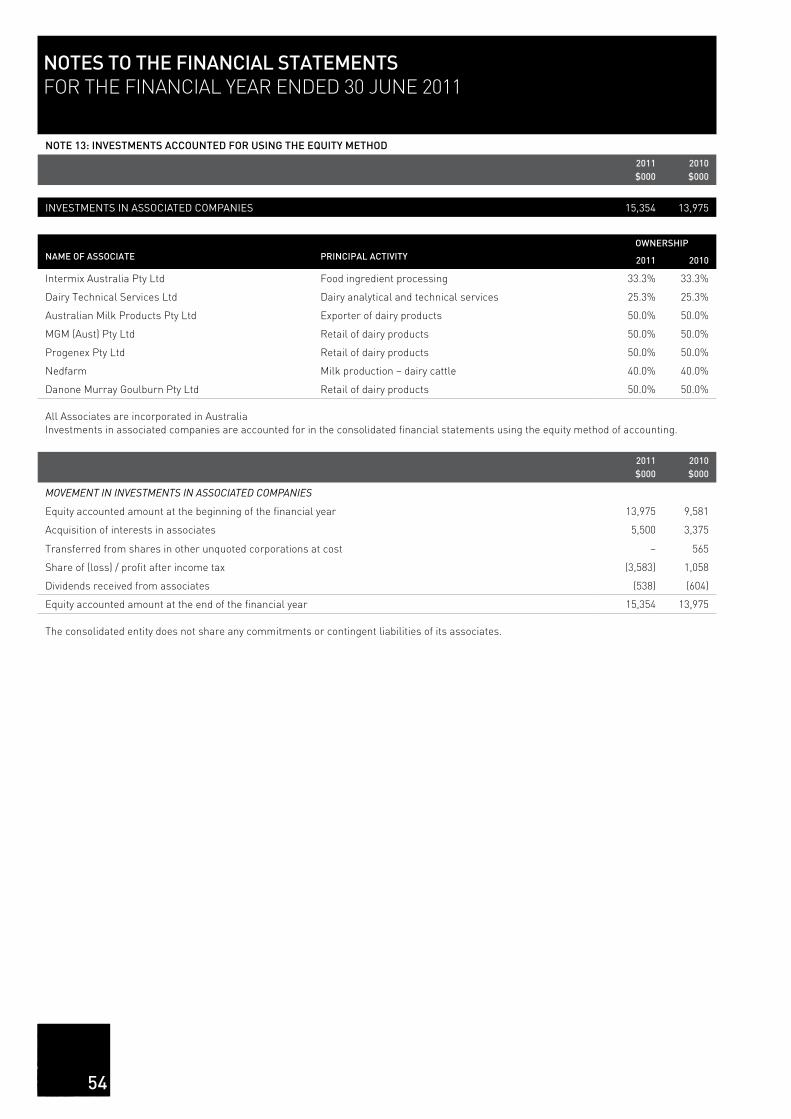
54
NOTES TO THE FINANCIAL STATEMENTS FOR THE FINANCIAL YEAR ENDED 30 JUNE 2011
NOTE 13: INVESTMENTS ACCOUNTED FOR USING THE EQUITY METHOD
2011 $000
2010 $000
INVESTMENTSINASSOCIATEDCOMPANIES 15,354 13,975
NAME OF ASSOCIATE PRINCIPAL ACTIVITY OWNERSHIP
2011 2010
Intermix Australia Pty Ltd Food ingredient processing 33.3% 33.3%
Dairy Technical Services Ltd Dairy analytical and technical services 25.3% 25.3%
Australian Milk Products Pty Ltd Exporter of dairy products 50.0% 50.0%
MGM (Aust) Pty Ltd Retail of dairy products 50.0% 50.0%
Progenex Pty Ltd Retail of dairy products 50.0% 50.0%
Nedfarm Milk production – dairy cattle 40.0% 40.0%
Danone Murray Goulburn Pty Ltd Retail of dairy products 50.0% 50.0% All Associates are incorporated in Australia Investments in associated companies are accounted for in the consolidated financial statements using the equity method of accounting.
2011 $000
2010 $000
MOVEMENT IN INVESTMENTS IN ASSOCIATED COMPANIES
Equity accounted amount at the beginning of the financial year 13,975 9,581
Acquisition of interests in associates 5,500 3,375
Transferred from shares in other unquoted corporations at cost – 565
Share of (loss) / profit after income tax (3,583) 1,058
Dividends received from associates (538) (604)
Equity accounted amount at the end of the financial year 15,354 13,975 The consolidated entity does not share any commitments or contingent liabilities of its associates.

55
NOTES TO THE FINANCIAL STATEMENTS FOR THE FINANCIAL YEAR ENDED 30 JUNE 2011
NOTE 14: PROPERTY, PLANT AND EQUIPMENT
NOTE2011 $000
2010 $000
LAND AND BUILDINGS
Freehold land at fair value (i) 73,427 63,364
Buildings at fair value (i) 257,552 248,488
less accumulated depreciation (296) (14,439)
257,256 234,049
Total Land and Buildings 330,683 297,413
PLANT AND EQUIPMENT
At cost 1,019,382 969,573
less accumulated depreciation (730,581) (685,427)
Total Plant and Equipment 288,801 284,146
VEHICLES
At cost 33,209 28,280
less accumulated depreciation (20,929) (16,828)
12,280 11,452
Leased Vehicles
Capitalised present value of lease payments – 3,312
less accumulated amortisation – (1,924)
– 1,388
Total Vehicles 12,280 12,840
Buildings and Plant in the course of construction 34,280 56,664
TOTALPROPERTY,PLANTANDEQUIPMENT 666,044 651,063
(i) Valuations of Land and Buildings The basis of valuation of land and buildings is fair value being the market value for existing use of all freehold land and buildings. Directors have assessed the carrying value of land and buildings as at 30 June 2011 and are satisfied that it is not materially different from its fair value. Revaluations as at 30 June 2011 were based on independent assessments. This is in accordance with a policy of revaluing property progressively to ensure that the carrying value of land and buildings does not differ materially from their fair value.
RECONCILIATIONSReconciliations of the carrying amounts of each class of property, plant and equipment are set out below.
LAND AND BUILDINGS
$000
PLANT AND EQUIPMENT
$000
VEHICLES
$000
IN COURSE OF CONSTRUCTION
$000
TOTAL
$000
CONSOLIDATED
Carryingamountat1July2009 304,071 281,668 8,210 64,584 658,533
Additions (including transfers from capital work in progress) 4,782 50,904 7,606 (7,920) 55,372
Net revaluations through asset revaluation reserve (552) – – – (552)
Impairment of non current assets (3,572) – – – (3,572)
Disposals – (1,015) (315) – (1,330)
Depreciation (7,316) (47,411) (2,283) – (57,010)
Amortisation – – (378) – (378)
Carryingamountat30June2010 297,413 284,146 12,840 56,664 651,063
Additions (including transfers from capital work in progress) 20,006 51,983 4,446 (22,384) 54,051
Net revaluations through asset revaluation reserve 21,894 – – – 21,894
Impairment of non current assets (1,456) – – – (1,456)
Disposals – (494) (505) – (999)
Depreciation (7,174) (46,834) (4,345) – (58,353)
Amortisation – – (156) – (156)
CARRYINGAMOUNTAT30JUNE2011 330,683 288,801 12,280 34,280 666,044

56
NOTES TO THE FINANCIAL STATEMENTS FOR THE FINANCIAL YEAR ENDED 30 JUNE 2011
NOTE 15: INTANGIBLE ASSETS
NOTE
2011 $000
2010 $000
Goodwill at cost 5,359 5,359
Export Quota at cost – 1,244
Brandnames at cost 4,000 4,000
TOTALINTANGIBLEASSETS 9,359 10,603
Intangible assets recognised by the consolidated entity have an indefinite useful life.
RECONCILIATIONSWith the exception of the Export Quota, which was written off during 2011, there have been no movements in the carrying value of Goodwill, Export Quotas or Brandnames during the current or prior financial year in the consolidated entity. In considering impairment, management have considered relevant forecasted cash flow projections.
NOTE 16: PAYABLES
CURRENT
Trade payables 62,114 56,737
Payable to suppliers 184,201 113,406
Sundry payables and accrued expenses 42,025 40,467
Foreign currency derivatives (i) 16 8,991
288,356 219,601
NON CURRENT
Net defined benefit superannuation fund liability 27 699 2,452
Other 1,752 1,752
2,451 4,204
(i) Foreign currency derivatives represent unrealised losses on foreign exchange contracts that are hedges against sales. Unrealised gains and losses on foreign currency hedge contracts are deferred in equity or recognised in profit or loss as appropriate.Foreign currency derivatives are Level 2 financial instruments recorded at fair value using observable market inputs.
All payables are recorded at amortised cost except for derivatives at (i) and the net defined benefit superannuation fund liability which are recorded at fair value.
The fair value of payables is documented in Note 30(d).

57
NOTES TO THE FINANCIAL STATEMENTS FOR THE FINANCIAL YEAR ENDED 30 JUNE 2011
NOTE 17: BORROWINGS
NOTE
2011 $000
2010 $000
CURRENT
Lease liability 26 – 509
Bank loans 16,309 42,768
Private placement senior notes 22,348 35,199
Domestic note issue 30,000 –
68,657 78,476
NON CURRENT
Lease liability 26 – –
Bank loans 119,839 160,398
Private placement senior notes 167,613 239,352
Domestic note issue – 30,000
287,452 429,750
The bank loans, private placement senior and domestic notes are covered by negative pledge agreements between the parent entity and its financiers. The lease liabilities are effectively secured over the assets leased, the current market value of which exceeds the value of thefinance lease liability.
All borrowings are recorded at amortised cost. Private placement notes are designated in effective cash flow hedge relationships with theexception of $46,559,000 (2010: $58,665,000).
The fair value of borrowings is documented in Note 30(d).
NOTE 18: CURRENT TAX PAYABLE
Income Tax Payable – –
– –
NOTE 19: PROVISIONS
CURRENT
Other 2 2
Employee benefits 43,181 38,595
43,183 38,597
NON CURRENT
Employee benefits 6,381 7,336
6,381 7,336
NOTE 20: DEFERRED TAX LIABILITIES
Deferred tax liability 4 45,185 22,314
45,185 22,314
NOTE 21: CONTINGENT LIABILITIES
Unsecured guarantees and warranties given in the normal course of business include commitments for the disposal of effluent.

58
NOTES TO THE FINANCIAL STATEMENTS FOR THE FINANCIAL YEAR ENDED 30 JUNE 2011
NOTE 22: ISSUED CAPITAL
2011 $000
2010 $000
Issued Capital 235,240 233,140
235,240 233,140
MOVEMENTS IN ISSUED CAPITAL
NUMBER OF SHARES
ORDINARY SHARES (a)
A CLASS PREFERENCE
SHARES (b)
B CLASS PREFERENCE
SHARES (c)
C CLASS PREFERENCE
SHARES (d) TOTAL
Balance at 30 June 2009 193,013,087 17,046,857 11,225,423 18,309,153 239,594,520
Shares issued 1,345,167 – – – 1,345,167
Dividend reinvestment plan issues 1,774,226 – – – 1,774,226
Transfers (9,386,943) (656,989) 7,070,586 2,973,346 –
Balance at 30 June 2010 186,745,537 16,389,868 18,296,009 21,282,499 242,713,913
Shares issued 1,977,682 – – – 1,977,682
Bonus shares issued 19,611,000 – – – 19,611,000
Net dividend reinvestment plan issues 98,149 23,304 417 12 121,882
Transfers 7,572,620 (590,710) (7,659,177) 677,267 –
BALANCEAT30JUNE2011 216,004,988 15,822,462 10,637,249 21,959,778 264,424,477
Changes to the then Corporations Law abolished the par value concept in relation to share capital from 1 July 1998. Therefore, the company does not have a limited amount of authorised capital and issued shares do not have a par value. All shares are fully paid. a) ORDINARY SHARES Ordinary shares entitle the holder to participate in dividends and the proceeds on winding up of the company in proportion to the number of shares held. On a show of hands every holder of ordinary shares present at a meeting in person or by proxy, is entitled to one vote and upon a poll each share is entitled to one vote. Upon ceasing supply of milk to the company, shareholders’ ordinary shares are converted into a class of non cumulative, non redeemable preference shares as determined by the board.
b) A CLASS 8% NON CUMULATIVE NON–REDEEMABLE PREFERENCE SHARES A class 8% non cumulative, non–redeemable preference shares entitle holders to receive, out of profits available for dividend, a preferential dividend at a rate of 8% per annum. These holders have no voting rights at a general meeting of the company but can convert their shares into ordinary shares, by resolution of the directors, if any holder becomes a supplier to the company.
c) B CLASS NON CUMULATIVE NON–REDEEMABLE PREFERENCE SHARES B class non cumulative, non–redeemable preference shares entitle holders to receive, out of profits available for dividend, a preferential dividend at a variable rate. These holders have no voting rights at a general meeting of the company but can convert their shares into ordinary shares, by resolution of the directors, if any holder becomes a supplier to the company.
d) C CLASS NON CUMULATIVE NON–REDEEMABLE PREFERENCE SHARES C class non cumulative, non–redeemable preference shares entitle holders to receive, out of profits available for dividend, a preferential dividend at a variable rate. These holders have no voting rights at a general meeting of the company but can convert their shares into ordinary shares, by resolution of the directors, if any holder becomes a supplier to the company. CAPITAL RISK MANAGEMENT The consolidated entity manages its capital to ensure that entities within the group will be able to continue as a going concern and to maintain an optimal capital structure to reduce the cost of capital and ensure access to adequate capital to sustain future development. In order to maintain or adjust the capital structure, the consolidated entity may adjust the amount of share equity milk deductions, adjust the level of dividends paid to shareholders, issue new shares or sell assets to reduce debt. Management continually monitor the capital structure by reference to the consolidated entity’s gearing ratio. The gearing ratio is calculated as net debt divided by total capital where net debt is borrowings less cash and total capital is equity, including minority interest, plus net debt as shown in the Balance Sheet. The consolidated entity’s strategy is to maintain its gearing ratio within 30% to 60%.

59
NOTES TO THE FINANCIAL STATEMENTS FOR THE FINANCIAL YEAR ENDED 30 JUNE 2011
NOTE2011 $000
2010 $000
Total borrowings 356,109 508,226
less Cash (5,697) (10,755)
Net debt 350,412 497,471
Total equity 788,469 719,003
Total capital 1,138,881 1,216,474
Gearing ratio 30.8% 40.9%
NOTE 23: RESERVES
Capital reserve (i) 36,916 36,916
Asset revaluation reserve 118,199 102,873
General reserve (i) 5,257 5,257
Hedge reserve 33,773 92
Investment revaluation reserve 2,535 (4,188)
Share allotment reserve 3,712 3,622
Foreign currency translation reserve 15 (67)
200,407 144,505
MOVEMENTS IN RESERVES
(i) There have been no movements in the Capital Reserve or General reserve in the current or prior years.
ASSET REVALUATION RESERVE
Balance at the beginning of the financial year 102,873 103,260
Increment / (decrement) on revaluation of land and buildings 14 21,894 (553)
Related income tax 4 (6,568) 166
BALANCEATTHEENDOFTHEFINANCIALYEAR 118,199 102,873
HEDGE RESERVE
Balance at the beginning of the financial year 92 12,288
Transferred to Income Statement 1,742 (7,584)
Related income tax 4 (523) 2,275
Gain / (loss) on cash flow hedges 46,374 (9,839)
Related income tax 4 (13,912) 2,952
BALANCEATTHEENDOFTHEFINANCIALYEAR 33,773 92
INVESTMENT REVALUATION RESERVE
Balance at the beginning of the financial year (4,188) –
Gain / (loss) arising on revaluation of available–for–sale financial assets 7,809 (4,188)
Related income tax 4 (1,086) –
BALANCEATTHEENDOFTHEFINANCIALYEAR 2,535 (4,188)
SHARE ALLOTMENT RESERVE
Balance at the beginning of the financial year 3,622 2,564
Allotment of shares to suppliers (3,622) (2,564)
Shares to be issued in lieu of milk payments 3,712 3,622
BALANCEATTHEENDOFTHEFINANCIALYEAR 3,712 3,622
At 30 June 2011 an amount of $3,712,000 (2010: $3,622,000) was due to suppliers, being deductions made from milk paymentsduring the year. This was satisfied by the allotment of fully paid shares in September 2011 (September 2010).

60
NOTES TO THE FINANCIAL STATEMENTS FOR THE FINANCIAL YEAR ENDED 30 JUNE 2011
NOTE 23: RESERVES (CONTINUED)
NOTE2011 $000
2010 $000
FOREIGN CURRENCY TRANSLATION RESERVE
Balance at the beginning of the financial year (67) (11)
Translation of foreign operations 117 (80)
Related income tax 4 (35) 24
BALANCEATTHEENDOFTHEFINANCIALYEAR 15 (67)
NATURE AND PURPOSE OF RESERVES
Capital Reserve The capital reserve is used to accumulate realised capital profits.
Asset Revaluation Reserve The asset revaluation reserve is used to record increments and decrements on the revaluation of non–current assets.
General Reserve The general reserve is used from time to time to transfer profits from retained earnings. There is no policy of regular transfer.
Hedge Reserve The hedge reserve represents hedging gains and losses recognised on the effective portion of cash flow hedges. The cumulative deferred gain or loss on the hedge is recognised in profit or loss when the hedged transaction impacts the profit or loss. Investment Revaluation Reserve The investment revaluation reserve represents accumulated gains and losses arising on the revaluation of available–for–sale financial assets that have been recognised in other comprehensive income. Share Allotment Reserve The share allotment reserve reflects the value of shares to be allotted to suppliers. The allotments arise from deductions made from milk payments during the year. Foreign Currency Translation Reserve The foreign currency translation reserve represents exchange differences relating to the translation from the functional currencies of the Group’s foreign controlled entities into Australian dollars.
NOTE 24: RETAINED EARNINGS
Balance at the beginning of the financial year 249,817 242,821
Net profit attributable to members of the parent entity 28,457 24,809
Dividends provided for or paid 7 (26,077) (17,813)
BALANCEATTHEENDOFTHEFINANCIALYEAR 252,197 249,817
NOTE 25: MINORITY INTERESTS
Minority interests comprises :
99,264,468 fully paid Employees Profits Participation Units (2010: 91,667,664) and 5 (2010: 5) fully paidordinary shares in MG Employees Equity Ltd 28 99,264 91,668
980,000 ordinary shares in Qingdao Murray Goulburn Dairy Co., Ltd (2010: 980,000) 832 (356)
49 ordinary shares in Provico Pty Ltd (2010: 49) 529 229
100,625 91,541

61
NOTES TO THE FINANCIAL STATEMENTS FOR THE FINANCIAL YEAR ENDED 30 JUNE 2011
NOTE 26: CAPITAL AND LEASING COMMITMENTS
NOTE2011 $000
2010 $000
a) MINIMUM FUTURE FINANCE LEASE PAYMENTS
– Due within 1 year – 529
– Due within 1–5 years – –
Minimum lease payments – 529
Less future finance charges – (20)
PRESENTVALUEOFMINIMUMLEASEPAYMENTS – 509
Classified as :
Current borrowings 17 – 509
Non current borrowings 17 – –
– 509
Finance leases relate to motor vehicles with lease terms of two to three years.
b) OPERATING LEASE COMMITMENTS
– Due within 1 year 18,822 19,206
– Due within 1–5 years 10,755 22,178
– Due longer than 5 years 1,217 –
30,794 41,384 Operating leases relate to Trading stores, warehousing facilities and vehicles with lease terms of between 1 to 31 years. Some leases have an option to extend the lease term. The consolidated entity does not have an option to purchase the leased assets at the expiry of the lease period.
c) CAPITAL EXPENDITURE COMMITMENTS
– Due within 1 year 40,756 19,832
CONTRACTEDCAPITALEXPENDITURECOMMITMENTS 40,756 19,832

62
NOTES TO THE FINANCIAL STATEMENTS FOR THE FINANCIAL YEAR ENDED 30 JUNE 2011
NOTE 27: DEFINED BENEFIT SUPERANNUATION PLAN The Company participates in a defined benefit superannuation plan, the MGC Superannuation Fund, which has been established and sponsored by the parent entity. This plan is a funded plan and provides a lump sum benefit on retirement, death, disablement and withdrawal. The defined benefit section of the plan is closed to new members. Contributions are made by employees and the consolidated entity as percentages of salary. The consolidated entity is obliged to make contributions as specified in the rules of the fund.
The consolidated entity expects to make a contribution of $666,000 (2010: $2,736,000) to the plan during the next financial year. The method used to determine the employer contribution recommendations at the last actuarial review was the Target Funding method. The method adopted affects the timing of the cost to the consolidated entity. The consolidated entity has recognised a liability in the balance sheet in respect of its defined benefit superannuation arrangements. If a surplus exists in the plan, the consolidated entity may be able to take advantage of it in the form of a reduction in the required contribution rate, depending on the advice of the plan’s actuary. The consolidated entity may at any time by notice to the Trustee terminate its contributions. The consolidated entity has a liability to pay the contributions due prior to the effective date of the notice, but there is no requirement for the consolidated entity to pay any further contributions, irrespective of the financial condition of the plan.
NOTE2011 $000
2010 $000
RECONCILIATIONOFTHEFAIRVALUEOFPLANASSETS
Fair value of plan assets at beginning of the year 27,018 25,570
Expected return on plan assets 1,783 1,632
Actuarial gains 154 467
Employer contributions 2,860 3,124
Contributions by plan participants 320 316
Benefits paid (2,785) (2,401)
Taxes, premiums and expenses paid (521) (556)
Transfers in / (out) – (1,134)
Fair value of plan assets at end of the year 28,829 27,018 The fair value of plan assets includes no amounts relating to any of the consolidated entity’s own financial instruments or any property occupied by, or other assets used by, the consolidated entity.
The actual gain on plan assets was $1,937,000 (2010: $2,099,000 gain on plan assets). RECONCILIATIONOFTHEPRESENTVALUEOFTHEDEFINEDBENEFITOBLIGATION
Present value of the defined benefit obligations at beginning of the year 29,470 30,606
Current service cost 690 762
Interest cost 1,137 1,335
Contributions by plan participants 320 316
Actuarial (gains) / losses 1,217 542
Benefits paid (2,785) (2,401)
Taxes, premiums and expenses paid (521) (556)
Transfers in / (out) – (1,134)
Present value of the defined benefit obligations at end of the year 29,528 29,470
Net superannuation (liability) / asset included in
Other Non Current Payables / Assets (699) (2,452)

63
NOTES TO THE FINANCIAL STATEMENTS FOR THE FINANCIAL YEAR ENDED 30 JUNE 2011
NOTE2011 $000
2010 $000
Expense recognised in Income Statement
Service cost 690 762
Interest cost 1,137 1,335
Expected return on assets (1,783) (1,632)
Actuarial loss 1,063 75
Superannuation expense 1,107 540
Superannuation expense is allocated to cost of sales (70%) and administration expenses (30%).
Historical information
Experience adjustments (gain) / loss on plan assets (154) (467)
Experience adjustments (gain) / loss on plan liabilities 3,022 (359)
2011 2010
Principal actuarial assumptions used:
Discount rate 4.3% 4.2%
Expected rate of return on plan assets 6.8% 6.8%
Expected salary increase rate 4.0% 4.0%
The percentage invested in each asset class at the balance date:
Australian equity 27% 29%
International equity 27% 32%
Fixed income 14% 12%
Property 10% 10%
Other 22% 17% In determining the expected rate of return on assets, the actuary has considered the expected future investment returns for each major asset class net of investment tax and investment fees.
2011$000
2010 $000
2009 $000
2008 $000
2007 $000
The history of experience adjustments are as follows:
Fair value of plan assets at end of the year 28,829 27,018 25,570 30,212 34,876
Present value of the defined benefit obligations at end of the year 29,528 29,470 30,606 27,559 26,715
Surplus / (Deficit) (699) (2,452) (5,036) 2,653 8,161
Experience adjustments (gain) / loss on plan assets (154) (467) 5,713 4,922 (2,808)
Experience adjustments (gain) / loss on plan liabilities 3,022 (359) 840 1,828 625

64
NOTES TO THE FINANCIAL STATEMENTS FOR THE FINANCIAL YEAR ENDED 30 JUNE 2011
NOTE 28: MURRAY GOULBURN GROUP EMPLOYEES PROFITS PARTICIPATION SCHEME In 1993 Murray Goulburn established an Employees Profits Participation Scheme under which employees of the Murray Goulburn Group with 12 months or more work experience with the Murray Goulburn Group could choose to invest in Employees Profits Participation Units in MG Employees Equity Limited (“MGEE”). MGEE invests the employees’ contributions in A class participating non cumulative non redeemable preference shares in Murray Goulburn Investment Limited.
Eligible employees must borrow all monies required to pay for the MGEE Employees Profits Participation Units either from MGEE or Murray Goulburn. The maximum amount each employee is entitled to borrow is equivalent to one year’s salary, rounded up to the nearest $10,000. MGEE funds the employee loans by borrowing from Murray Goulburn. All borrowings are interest free and employees repay their loans at 3% per annum or in full on withdrawal from the scheme. Loans receivable from employees are recorded at amortised cost. The adjustment to employee loans has been capitalised as an asset to the extent that it relates to future employee services.
Loans receivable from employees are effectively secured by the Employees Profits Participation Units held by the employees. At 30th June 2011, 1,357 employees had been issued with 99,264,468 $1.00 Employees Profits Participation Units. The value of Employees Profits Participation Units issued by MG Employees Equity Limited to employees of the consolidated entity is recognised as a Minority Interest. Loans owing by employees are included in other receivables in Note 8 above. Amounts recognised are as follows :
2011 $000
2010 $000
Minority Interest 99,264 91,668
Employee loans (current and non current) 47,830 45,519
NOTE 29 : EVENTS SUBSEQUENT TO BALANCE DATE Since 30 June 2011, the company has acquired a controlling interest in Tasmanian Dairy Products Co. Ltd, a company formed to undertake the construction, development and operation of a milk processing plant in Smithton, Tasmania. With the exception of this investment and the declaration of dividends detailed in Note 7 ‘Unrecognised Amounts’, no matters or circumstances have arisen since the end of the financial year which significantly affected or may significantly affect the operations of the consolidated entity, the results of those operations, or the state of affairs of the consolidated entity in financial years subsequent to the financial year ended 30 June 2011.
NOTE 30 : FINANCIAL INSTRUMENTS Risk management is carried out by the treasury and finance departments under policies approved by the Board of Directors. Financial risks are managed in accordance with written policies overseen by the board.
The consolidated entity does not enter into or trade financial instruments, including derivative financial instruments, for speculative purposes. The use of financial derivatives is governed by the consolidated entity’s policy approved by the board of directors which provides written principles on the use of financial derivatives. Compliance with policy and exposure limits is reviewed continuously by senior management and by the board of directors on a quarterly basis. a) MARKET RISK The consolidated entity’s activities expose it primarily to the financial risks of changes in foreign currency exchange rates and interest rates. The consolidated entity enters into a variety of derivative financial instruments to manage its exposure to foreign currency and interest rate risk, including: • Forward foreign currency and foreign currency option contracts to hedge the exchange rate risk arising on the sale of exported dairy goods in $US; and • Interest rate swaps to hedge the fair value risk associated with fluctuating interest rates.
Details of the significant accounting policies and methods adopted, including the criteria for recognition, the basis of measurement and the basis on which income and expenses are recognised, in respect of financial instruments are disclosed in Note 1 to the financial statements and below. FOREIGN CURRENCY RISK MANAGEMENT The group undertakes transactions denominated in foreign currencies, hence exposures to exchange rate fluctuations arise. Exchange rate exposures are managed within approved policy parameters utilising forward foreign exchange contracts and foreign exchange options.
FORWARD FOREIGN EXCHANGE CONTRACTS The consolidated entity maintains a policy of matching anticipated future cash flows in foreign currencies, ie. highly probable sales, for cash flow hedge accounting purposes, with forward exchange contracts in the same currency and with closely corresponding settlement dates.

65
NOTES TO THE FINANCIAL STATEMENTS FOR THE FINANCIAL YEAR ENDED 30 JUNE 2011
At balance date, the entity has $US180 million (2010: $US190 million) forward exchange contracts outstanding with maturity dates not exceeding one year, of which $USnil (2010: $US6 million) relate to receivables at balance date and $US180 million (2010: $US184 million) to future transactions. The fair value of these contracts at balance date is $9.1 million (2010: $7.3 million). Unrealised gains or losses at year end on specific hedges in the form of forward exchange contracts, in respect of unsettled sales transactions, are deferred and recognised in the hedge reserve to match against the underlying hedge transaction. Forward exchange contracts are classified as Level 2 financial instruments, as their fair value measurement is derived from inputs other than quoted prices that are observable for the asset or liability. CURRENCY OPTIONS During the year the consolidated entity entered into a range of US Dollar currency options with varying maturities and strike rates. By simultaneously purchasing and selling options in barrier type structures, the entity has effectively capped an exchange rate should the AUD strengthen whilst maintaining the flexibility to improve the exchange rate should the AUD trade at more favourable levels. At balance date, the entity had bought call options to the value of $US nil (2010: $US nil) with varying strike rates and sold call options to the value of $US nil (2010: $US nil). These were taken in conjunction with forward exchange contracts as part of the overall hedging strategy. All currency options have expiry dates not exceeding one year and were purchased or sold strictly as a means of reducing foreign exchange risk associated with hedging future sales denominated in $US. The fair value of these contracts at balance date is $nil (2010: $nil). PRIVATE PLACEMENT SENIOR NOTES The private placement is designated in a cash flow hedge relationship and is hedging highly probable forecast sales denominated in USD to be invoiced at the time of each loan repayment. The effective portion of changes in the fair value of the Private Placement due to foreign currency changes is recognised directly in equity via the Hedge Reserve. FOREIGN CURRENCY SENSITIVITY The consolidated entity is exposed to US dollars. The following table details the consolidated entity’s sensitivity to a 1% increase and decrease in the Australian dollar against the USD as at balance date. The sensitivity includes outstanding foreign currency derivatives and foreign currency denominated monetary items and adjusts their translation at the period end for a 1% change in foreign currency rates.
2011 $000
2010 $000
Other Equity AUD strengthens 1% – increase / (decrease) 2,156 3,001
AUD weakens 1% – increase / (decrease) (2,199) (3,061)
Profit or Loss AUD strengthens 1% – increase / (decrease) (55) 78
AUD weakens 1% – increase / (decrease) 56 (79) b) INTEREST RATE RISK Trade and other receivables, trade payables and accruals and loans from the state government of Victoria are non–interest bearing. The AUD bank overdraft bears interest at a floating rate based on the targeted cash rate of the Reserve Bank of Australia. The USD bank overdraft bears interest at a floating rate based on the London Interbank Offered Rate. USD cash on hand yields interest at the US Interbank Bid Rate. AUD cash on hand bears interest at a floating rate based on the targeted cash rate of the Reserve Bank of Australia. Bank loans consist of short term and long term USD and AUD revolving loan facilities, on which interest is payable at floating rates. Rates on US Dollar loans are based on LIBOR. Rates on AUD loans are based on BBR. Interest on floating AUD domestic notes is based on the three month BBSW rate. Fixed AUD domestic notes bear interest at 6.82%. The 2003 Private Placement bears interest at a fixed rate of 4.98%. The Private Placement will be repaid as follows: $US24.0 million (18 October 2011), $US18.0 million (18 October 2012) and $US12.0 million (18 October 2013). The 2009 Private Placement will be repaid as follows and bears interest at the following fixed rates: $US30.0 million, 4.83% (29 October 2014), $US17.0 million, 5.44% (29 October 2016), $US89.0 million, 5.81% (29 October 2019), $US14.0 million, 5.96% (29 October 2021). An analysis of borrowings by maturities is provided in paragraph (e) below. INTEREST RATE SENSITIVITY The consolidated entity’s sensitivity to a 50 basis point increase or decrease, representing management’s assessment of the possible change in interest rates, holding all other variables constant would be a decrease / increase in net profit of $533,000 (2010: $767,000 decrease / increase). c) CREDIT RISK EXPOSURES The maximum exposure to credit risk at balance date in relation to financial assets is the carrying amount, net of any allowances, of those assets as indicated in the balance sheet. The consolidated entity has adopted a policy of dealing with creditworthy counterparties assessed by reference to their financial position, internal and external credit assessment and historical trading experience. Concentrations of credit risk is minimised by undertaking transactions with a large number of customers and counterparties in various countries. Other receivables current include amounts receivable from suppliers and from GST paid. Other receivables non current represent loans to employees and are effectively secured by employees’ minority interest.

66
NOTES TO THE FINANCIAL STATEMENTS FOR THE FINANCIAL YEAR ENDED 30 JUNE 2011
NOTE 30: FINANCIAL INSTRUMENTS (CONTINUED) d) FAIR VALUE The fair value of other financial assets and financial liabilities, excluding derivative instruments, are determined in accordance with generally accepted pricing models based on discounted cash flow analysis using prices from observable current market transactions. To calculate the fair value of derivative instruments, use is made of discounted cash flow analysis using the appplicable yield curve for the duration of the instruments for non–optional derivatives and option pricing models for optional derivatives. The carrying amount recorded in the financial statements represents the fair value of all assets and liabilities, determined in accordance with the accounting policies in Note 1 to the financial statements, except for those mentioned below. The fair value is derived by discounting the expected future cash flows by the current interest rates for assets and liabilities with similar risk profiles. The fair value of non current Other Receivables at balance date is $44.8 million (2010: $44.6 million). The fair value of the Private Placement at balance date is $204.2 million (2010: $296.0 million). The fair value of the Domestic Note Issue at balance date is $30.3 million (2010: $30.2 million). The fair value of a government loan of $1.0 million at balance date is $0.6 million (2010: $0.6 million). e) LIQUIDITY RISK MANAGEMENT Liquidity risk is managed by maintaining adequate borrowing facilities, by continuously monitoring forecast and actual cash flows and matching the maturity profiles of financial assets and liabilities. Included in Note 32(c) is a listing of additional undrawn facilities that are available to reduce liquidity risk.
The following table analyses the consolidated entity’s non–derivative financial liabilities. The amounts disclosed in the table are the contractual undiscounted cash flows:
0–12 MONTHS$000
1–2 YEARS$000
2–5 YEARS$000
5+ YEARS$000
TOTALCONTRACTUAL
CASH FLOWS$000
CARRYINGAMOUNT
$000
AT 30 JUNE 2011
Non interest bearing 288,356 – – 1,000 289,356 289,356
Variable rate 38,481 121,692 – – 160,173 152,148
Fixed rate 46,151 25,398 60,454 132,223 264,226 203,961
CONSOLIDATED 372,988 147,090 60,454 133,223 713,755 645,465
AT 30 JUNE 2010
Non interest bearing 219,601 – – 1,000 220,601 220,601
Variable rate 50,548 22,783 163,159 – 236,490 219,166
Fixed rate 50,254 54,383 100,043 174,733 379,413 289,060
CONSOLIDATED 320,403 77,166 263,202 175,733 836,504 728,827

67
NOTES TO THE FINANCIAL STATEMENTS FOR THE FINANCIAL YEAR ENDED 30 JUNE 2011
NOTE 31: RELATED PARTIES Transactions between related parties are on normal commercial terms and conditions unless otherwise stated. Balances and transactions with related parties : a) ASSOCIATED COMPANIES Transactions between the parent entity and its associates include the sale of goods, the purchase of goods and the provision of technical and consultancy services by the parent entity. Transactions are on normal commercial terms and conditions. b) DIRECTORS OF THE PARENT ENTITY Shareholdings of directors in the parent entity, allotted to them in their capacity as suppliers of milk to the company:
SHARES HELD AT1 JULY 2009
ORDINARYNO.
ACQUIREDORDINARY
NO.
SHARES HELD AT30 JUNE 2010
ORDINARYNO.
SHARES HELD AT1 JULY 2010
ORDINARYNO.
ACQUIREDORDINARY
NO.
SHARES HELD AT30 JUNE 2011
ORDINARYNO.
GJ Davies 332,346 56,475 388,821 388,821 148,816 537,637
JT Vardy 627,454 72,760 700,214 700,214 141,118 841,332
WT Bodman 85,900 13,993 99,893 99,893 22,429 122,322
DF Howard 379,452 11,058 390,510 390,510 153,532 544,042
KW Jones 92,941 10,675 103,616 103,616 55,882 159,498
ST Mills 222,913 8,366 231,279 231,279 66,922 298,201
GN Munzel 148,404 8,919 157,323 157,323 26,292 183,615
JP Pye 190,145 9,052 199,197 199,197 27,474 226,671
PW Tracy 794,648 61,070 855,718 855,718 297,890 1,153,608
MJ Van de Wouw (i) – – – 271,396 87,644 359,040
2,874,203 252,368 3,126,571 3,397,967 1,027,999 4,425,966
(i) MJ Van de Wouw was appointed to the office of director during the current financial year and accordingly his shareholdings prior to 1 July 2010 are not disclosed. Directors of the parent company supply milk to the consolidated entity, are able to purchase goods at Murray Goulburn Trading Pty Ltd stores at commercial prices, and can obtain loans from the consolidated entity in the same manner as all other suppliers. Aggregate of loans to 5 (2010: 6) directors as at financial year end: $342,840 (2010: $255,368). Total interest paid by directors: $16,321 (2010: $15,547).
During the year, loans exceeding $100,000 were made to the following directors under the same terms and conditions available to all member suppliers for the purchase of fodder and other financing activities: ST Mills: total loan at financial year end: $114,932 (2010: $90,666); peak loan balance during the year: $133,742; interest paid $8,802. c) CLOSE FAMILY MEMBERS A close family member of the Managing Director, M O’Rourke, received remuneration comprising of salary of $84,835 (2010: $255,468), payment in lieu of notice of $63,000 (2010: $nil) and other benefits relating to annual leave, long service leave, superannuation, motor vehicle and notional interest on the loan via the Employee Profits Participation Scheme (note (d) below) of $341,613 (2010: $76,450). M O’Rourke’s employment with the company ceased in October 2010. M O’Rourke’s compensation was determined by the remuneration committee and approved by resolution of the board. There were no other terms or conditions attaching to M O’Rourke’s employment. d) KEY MANAGEMENT PERSONNEL AND CLOSE FAMILY MEMBERS Key management personnel and close family members of the consolidated entity participate in the Employees Profits Participation Scheme under the same terms and conditions available to all employees (refer Note 28). All loans are interest free and repayable at 3.0% per annum.

NOTES TO THE FINANCIAL STATEMENTS FOR THE FINANCIAL YEAR ENDED 30 JUNE 2011
68
NOTE 31: RELATED PARTIES (CONTINUED)Key management personnel and their close family members hold the following number of Employees Profits Participation Units in MG Employees Equity Limited:
SHARES HELD1 JULY 2009
NO.
NET OTHER CHANGE
NO.
SHARES HELD30 JUNE 2010
NO.
SHARES HELD1 JULY 2010
NO.
NET OTHERCHANGE
NO.
SHARES HELD30 JUNE 2011
NO.
SJ O’Rourke 2,210,677 110,533 2,321,210 2,321,210 440,684 2,761,894
P Kerr 647,754 32,387 680,141 680,141 111,809 791,950
N Longstaff 403,493 20,174 423,667 423,667 29,656 453,323
P Hobman 351,606 17,580 369,186 369,186 57,943 427,129
M Beniston 260,400 13,020 273,420 273,420 83,339 356,759
R Greenaway (i) – – – – 64,200 64,200
D Moffatt (ii) 271,828 13,591 285,419 – – –
M O’Rourke 399,695 19,984 419,679 419,679 (419,679) –
Interest free loans to key management personnel and their close family members, the terms of which are disclosed in Note 28, via the Employees Profits Participation Scheme:
BALANCE AT 1 JULY 2009
$
BALANCE AT30 JUNE 2010
$
BALANCE AT30 JUNE 2011
$
HIGHESTIN PERIOD
2010$
HIGHESTIN PERIOD
2011$
NOTIONALINTEREST
2010$
NOTIONALINTEREST
2011$
SJ O’Rourke 1,096,650 1,054,650 1,272,650 1,096,650 1,276,150 53,783 73,826
P Kerr 305,825 293,825 341,825 305,825 342,825 14,991 20,568
N Longstaff 215,400 207,300 199,200 215,400 207,300 10,568 14,511
P Hobman 233,375 225,275 247,175 233,375 247,850 11,466 15,769
M Beniston 232,200 225,000 277,800 232,200 278,400 11,430 15,750
R Greenaway (i) – – 60,000 – 60,000 – –
D Moffatt (ii) 182,225 175,925 – 182,225 – 8,954 –
M O’Rourke 208,100 200,300 – 208,100 200,300 10,210 3,338 Notional interest is included in non monetary compensation of key management personnel and close family members. P Kerr holds 1,068 (2010: 1,068) A Class 8% Non Cumulative Non–redeemable Preference Shares in the company. R Greenaway holds 296,579 Ordinary Shares in the company, an increase of 59,596 shares during the year, in his capacity as an investor in a farm supplying Murray Goulburn. (i) R Greenaway qualified as a key management personnel in 2011 and accordingly his unit holdings and interest free loan prior to 1 July 2010 are not disclosed. (ii) D Moffatt qualified as a key management personnel in 2010, but not 2011, and accordingly his unit holdings and interest free loan at 30 June 2011 are not disclosed.

NOTE 32: NOTES TO THE STATEMENT OF CASH FLOWS
NOTE2011 $000
2010 $000
a) RECONCILIATION OF CASH For the purposes of the statement of cash flows, cash includes cash on hand, deposits on call and investments in money market instruments, net of bank overdrafts
Cash at the end of the year as shown in the statement of cash flows is reconciled to cash in the balance sheet as follows:
Cash per balance sheet 5,697 10,755
Cash per statement of cash flows 5,697 10,755
b) RECONCILIATION OF PROFIT FOR THE PERIOD TO NET CASH FLOW FROM OPERATING ACTIVITIES
Profit for the Period 36,319 28,041
Depreciation 58,353 57,010
Amortisation 156 378
Movement in doubful debts provision (407) –
Impairment of non current assets 1,456 3,572
Impairment of intangible assets 1,244 –
Loss (Gain) on disposal of fixed assets 265 966
Share of loss (profit) of associated company 4,121 (454)
(Gain) Loss from defined benefit superannuation fund (1,753) (2,584)
Change in operating assets and liabilities
Decrease (increase) in trade receivables 18,682 (33,036)
Decrease (increase) in other receivables and prepayments 1,946 (2,423)
Decrease (increase) in inventories (11,179) 108,595
Increase (decrease) in trade payables and amounts due to suppliers 77,730 10,827
Increase (decrease) in provisions 3,630 2,422
Increase (decrease) in deferred tax liability 747 (10,619)
NETCASHINFLOW(OUTFLOW)FROMOPERATINGACTIVITIES 191,310 162,695
c) FINANCING ARRANGEMENTS
Credit facility 722,936 730,199
Amount utilised 137,195 203,166
UNUSEDCREDITFACILITY 585,741 527,033 The major facilities consist of a bank overdraft facility repayable at call, and loan facilities which are subject to yearly review to ensure that the required financial ratios are met. d) NON–CASH FINANCING AND INVESTING ACTIVITIES Nil.
NOTE 33: BUSINESS COMBINATIONS In respect of the financial year ended 30 June 2011: No business combinations. In respect of the financial year ended 30 June 2010: On 1 September 2009, the parent entity increased its shareholding in MG Agrilink Pty Ltd to 100% (2009: 50%) for consideration of $100,000. As at 1 September 2009, MG Agrilink Pty Ltd had a deficiency in net assets of $30,000.
NOTES TO THE FINANCIAL STATEMENTS FOR THE FINANCIAL YEAR ENDED 30 JUNE 2011
69

NOTES TO THE FINANCIAL STATEMENTS FOR THE FINANCIAL YEAR ENDED 30 JUNE 2011
70
NOTE 34: PARENT ENTITY DISCLOSURES
NOTE2011 $000
2010 $000
a) FINANCIAL POSITION
Total current assets 709,904 744,775
Total non current assets 767,880 725,008
TotalAssets 1,477,784 1,469,783
Total current liabilities 378,295 322,294
Total non current liabilities 454,916 565,070
TotalLiabilities 833,211 887,364
NETASSETS 644,573 582,419
Issued capital 235,240 233,140
Retained earnings 258,356 253,920
Reserves
Capital reserve 24,290 24,290
Asset revaluation reserve 84,018 68,894
General reserve 2,648 2,648
Hedge reserve 33,773 92
Investment revaluation reserve 2,535 (4,188)
Share allotment reserve 3,713 3,623
TOTALEQUITY 644,573 582,419
b) FINANCIAL PERFORMANCE FOR THE YEAR
PROFITFORTHEYEAR 30,513 26,032
TOTALCOMPREHENSIVEINCOME 86,212 9,261
c) GUARANTEES ENTERED INTO BY THE PARENT ENTITY IN RELATION TO THE DEBTS OF ITS SUBSIDIARIES
GUARANTEEPROVIDEDUNDERTHEDEEDOFCROSSGUARANTEE 14,451 11,062
d) UNSECURED GUARANTEES AND WARRANTIES Given in the normal course of business include commitments for the disposal of effluent.
e) COMMITMENTS FOR THE ACQUISITION OF PROPERTY PLANT AND EQUIPMENT
Plant and equipment 40,659 18,893
40,659 18,893 NOTE 35: ADDITIONAL INFORMATION Murray Goulburn Co–operative Co. Limited is a company limited by shares, incorporated and domiciled in Australia. Its registered office and principal place of business is: Murray Goulburn Co–operative Co. Limited 140 Dawson Street Brunswick, Victoria, 3056

DIRECTORS’ DECLARATION
71
In the directors’ opinion:
a) There are reasonable grounds to believe that the company will be able to pay its debts as and when they become due and payable;
b) The attached financial statements are in compliance with International Financial Reporting Standards, as stated in Note 1 to the financial statements;
c) The attached financial statements and notes thereto are in accordance with the Corporations Act 2001, including compliance with accounting standards; and
d) The attached financial statements and notes thereto give a true and fair view of the consolidated entity’s financial position as at 30 June 2011 and performance for the financial year ended on that date.
At the date of this declaration, the company is within the class of companies affected by ASIC Class Order 98/1418. The nature of the deed of cross guarantee is such that each company which is party to the deed guarantees to each creditor payment in full of any debt in accordance with the deed of cross guarantee.
In the directors’ opinion, there are reasonable grounds to believe that the company and the companies to which the ASIC Class Order applies, as detailed in Note 12 to the financial statements will, as a group, be able to meet any obligations or liabilities to which they are, or may become, subject by virtue of the deed of cross guarantee.
This declaration is made in accordance with a resolution of the directors.
GJ DAVIESDirector
Melbourne28 September 2011

INDEPENDENT AUDITORS REPORT TO THE MEMBERS OF MURRAY GOULBURN CO–OPERATIVE CO. LTD
REPORT ON THE FINANCIAL REPORT
We have audited the accompanying financial report of Murray Goulburn Co-operative Co. Limited, which comprises the consolidated balance sheet as at 30 June 2011, the consolidated income statement, the consolidated statement of comprehensive income, the consolidated statement of cash flows and the consolidated statement of changes in equity for the year ended on that date, notes comprising a summary of significant accounting policies and other explanatory information, and the directors’ declaration of the consolidated entity comprising the company and the entities it controlled at the year’s end or from time to time during the financial year as set out on pages 36 to 71.
Directors’ Responsibility for the Financial ReportThe directors of the company are responsible for the preparation of the financial report that gives a true and fair view in accordance with Australian Accounting Standards and the Corporations Act 2001 and for such internal control as the directors determine is necessary to enable the preparation of the financial report that is free from material misstatement, whether due to fraud or error. In Note 1, the directors also state, in accordance with Accounting Standard AASB 101 Presentation of Financial Statements, that the consolidated financial statements comply with International Financial Reporting Standards.
Auditor’s ResponsibilityOur responsibility is to express an opinion on the financial report based on our audit. We conducted our audit in accordance with Australian Auditing Standards. Those standards require that we comply with relevant ethical requirements relating to audit engagements and plan and perform the audit to obtain reasonable assurance whether the financial report is free from material misstatement.
An audit involves performing procedures to obtain audit evidence about the amounts and disclosures in the financial report. The procedures selected depend on the auditor’s judgement, including the assessment of the risks of material misstatement of the financial report, whether due to fraud or error. In making those risk assessments, the auditor considers internal control, relevant to the entity’s preparation of the financial report that gives a true and fair view, in order to design audit procedures that are appropriate in the circumstances, but not for the purpose of expressing an opinion on the effectiveness of the entity’s internal control. An audit also includes evaluating the appropriateness of accounting policies used and the reasonableness of accounting estimates made by the directors, as well as evaluating the overall presentation of the financial report.We believe that the audit evidence we have obtained is sufficient and appropriate to provide a basis for our audit opinion.
Auditor’s Independence DeclarationIn conducting our audit, we have complied with the independence requirements of the Corporations Act 2001. We confirm that the independence declaration required by the Corporations Act 2001, which has been given to the directors of Murray Goulburn Co-operative Co. Limited, would be in the same terms if given to the directors as at the time of this auditor’s report.
OpinionIn our opinion:
(a) the financial report of Murray Goulburn Co-operative Co. Limited is in accordance with the Corporations Act 2001, including: (i) giving a true and fair view of the consolidated entity’s financial position as at 30 June 2011 and of its performance for the year ended on that date; and (ii) complying with Australian Accounting Standards and the Corporations Regulations 2001; and
(b) the consolidated financial statements also comply with International Financial Reporting Standards as disclosed in Note 1.
REPORT ON THE REMUNERATION REPORT
We have audited the Remuneration Report included in pages 34 to 35 of the directors’ report for the year ended 30 June 2011. The directors of the company are responsible for the preparation and presentation of the Remuneration Report in accordance with section 300A of the Corporations Act 2001. Our responsibility is to express an opinion on the Remuneration Report, based on our audit conducted in accordance with Australian Auditing Standards.
OpinionIn our opinion the Remuneration Report of Murray Goulburn Co-operative Co. Limited for the year ended 30 June 2011, complies with section 300A of the Corporations Act 2001.
DELOITTE TOUCHE TOHMATSU
Chris BiermannPartnerChartered AccountantsMelbourne, 28 September 2011
Liability limited by a scheme approved under Professional Standards Legislation.
72

AUDIT INDEPENDENCE DECLARATION
The Board of DirectorsMurray Goulburn Co-operative Co. Limited 140 Dawson StreetBRUNSWICK VIC 3056
28 September 2011
Dear Board Members
Murray Goulburn Co–operative Co. Limited
In accordance with section 307C of the Corporations Act 2001, I am pleased to provide the following declaration of independence to the directors of Murray Goulburn Co-operative Co. Limited.
As lead audit partner for the audit of the financial statements of Murray Goulburn Co-operative Co. Limited for the financial year ended 30 June 2011, I declare that to the best of my knowledge and belief, there have been no contraventions of:
(i) the auditor independence requirements of the Corporations Act 2001 in relation to the audit; and(ii) any applicable code of professional conduct in relation to the audit.
Yours sincerely
DELOITTE TOUCHE TOHMATSU
Chris BiermannPartner Chartered Accountants
Liability limited by a scheme approved under Professional Standards Legislation.
73

CO–OPERATION – A WAY OF LIFE...
CO–OPERATION IS MORE THAN A BUSINESS, IT IS A WAY OF LIFE. CARRIED TO ITS ULTIMATE CONCLUSION, CO–OPERATION CAN BRING TO THE WORLD; PEACE, PROSPERITY AND CONTENTMENT. BUT INDIVIDUALS MUST PLAY THEIR PART IN THE PLAN.
CO–OPERATION IS BASED ON SERVICE. EACH FOR ALL AND ALL FOR EACH.