Embed Size (px)
Citation preview

Grant Agreement number: 619228
Project Acronym: ISS-EWATUS
Project Full Title: Integrated Support System for Efficient Water Usage and Resources
Management
Funding Scheme: Collaborative project
Period covered: from 01/02/2014 to 31/01/2016
Name, title and organisation of the scientific representative of the project's coordinator:
Dr Wojciech Froelich, Dr Ewa Magiera, University of Silesia, Poland
Tel: +48 510294043
Fax: +48 32 2918283
E-mail: [email protected], [email protected],
Project website address: http://issewatus.eu
ISS-EWATUS

ISS-EWATUS FP7-ICT-2013-11 Page - 2 - of 77
Consortium Consisting of:
Organisation Name Short Name Country
UNIWERSYTET SLASKI US Poland
INSTYTUT EKOLOGII TERENOW UPRZEMYSLOWIONYCH IETU Poland
Rejonowe Przedsiębiorstwo Wodociągów i Kanalizacji w Sosnowcu
Spółka Akcyjna
RPWiK Poland
LOUGHBOROUGH UNIVERSITY LU United Kingdom
BRUNEL UNIVERSITY BU United Kingdom
UNIVERSIDAD PABLO DE OLAVIDE UPO Spain
CENTRE FOR RESEARCH AND TECHNOLOGY HELLAS CERTH Greece
Dimotiki Epixirisi Ydreusis - Apoxeutesis Skiathou DEYASK Greece
DOTSOFT OLOKLIROMENES EFARMOGES DIADIKTIOY KAI VASEON
DEDOMENON AE
DOTSOFT Greece
STICHTING VU-VUMC VU/VUmc Netherlands

ISS-EWATUS FP7-ICT-2013-11 Page - 3 - of 77
Deliverable 4.2
Decision Support System at
Urban Level
Work Package 4 Organization Name Short Name Country
CENTRE FOR RESEARCH AND TECHNOLOGY HELLAS CERTH Greece
UNIWERSYTET SLASKI US Poland
INSTYTUT EKOLOGII TERENOW UPRZEMYSLOWIONYCH IETU Poland
Rejonowe Przedsiębiorstwo Wodociągów i Kanalizacji w Sosnowcu
Spółka Akcyjna
RPWiK Poland
UNIVERSIDAD PABLO DE OLAVIDE UPO Spain
Dimotiki Epixirisi Ydreusis - Apoxeutesis Skiathou DEYASK Greece

ISS-EWATUS FP7-ICT-2013-11 Page - 4 - of 77
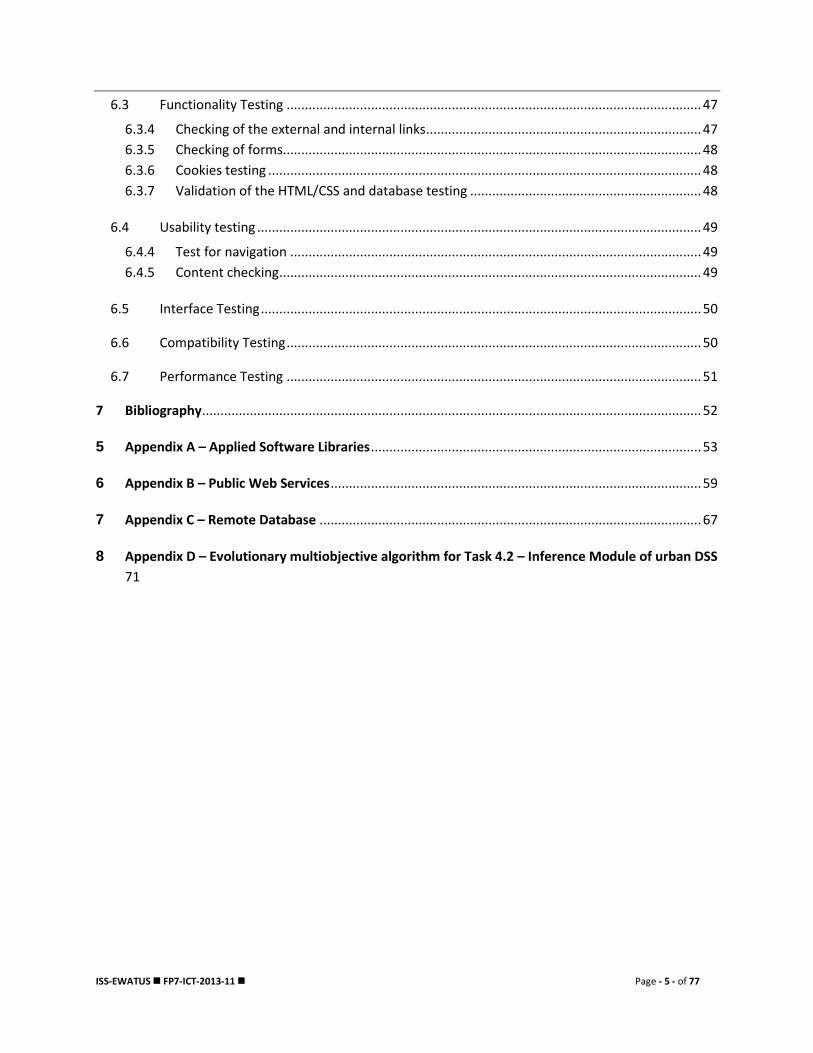
Table of Contents
1 Table of Contents
1 Introduction ........................................................................................................................................ 12
2 Objectives and Requirements ............................................................................................................ 13
3 Design of the DSS ............................................................................................................................... 15
3.1 Primary Functional Users ........................................................................................................... 15
3.2 Structure of the Local Database ................................................................................................ 16
3.3 Deployment Model .................................................................................................................... 17
3.4 Graphical User Interface ............................................................................................................ 19
4 Architecture of the DSS ...................................................................................................................... 21
4.1 Logical Architecture Overview – Main functionalities and modules ......................................... 24
4.1.1 Monitoring ............................................................................................................................ 24
4.1.2 Administrating land zones ..................................................................................................... 25
4.1.3 Administrating Users ............................................................................................................. 25
4.1.4 Geospatial Web Map Service Management ......................................................................... 27
4.1.5 Web Application Project ....................................................................................................... 27
4.1.6 Web Services ......................................................................................................................... 30
4.1.7 Forecasting module ............................................................................................................... 35
4.1.8 Evolutionary Multi-objective Optimization algorithm .......................................................... 39
4.1.9 Handling water pressure alerts ............................................................................................. 40
4.2 Physical Architecture Overview ................................................................................................. 41
5 Implementation Details ..................................................................................................................... 42
5.1 Data Transmission ..................................................................................................................... 43
5.2 Geoserver .................................................................................................................................. 44
6 Testing................................................................................................................................................. 45
6.1 Introduction to Web Application Testing .................................................................................. 45
6.2 Steps to web application testing ............................................................................................... 45
ISS-EWATUS FP7-ICT-2013-11 Page - 5 - of 77
6.3 Functionality Testing ................................................................................................................. 47
6.3.4 Checking of the external and internal links ........................................................................... 47
6.3.5 Checking of forms.................................................................................................................. 48
6.3.6 Cookies testing ...................................................................................................................... 48
6.3.7 Validation of the HTML/CSS and database testing ............................................................... 48
6.4 Usability testing ......................................................................................................................... 49
6.4.4 Test for navigation ................................................................................................................ 49
6.4.5 Content checking ................................................................................................................... 49
6.5 Interface Testing ........................................................................................................................ 50
6.6 Compatibility Testing ................................................................................................................. 50
6.7 Performance Testing ................................................................................................................. 51
7 Bibliography ........................................................................................................................................ 52
5 Appendix A – Applied Software Libraries .......................................................................................... 53
6 Appendix B – Public Web Services ..................................................................................................... 59
7 Appendix C – Remote Database ........................................................................................................ 67
8 Appendix D – Evolutionary multiobjective algorithm for Task 4.2 – Inference Module of urban DSS
71

ISS-EWATUS FP7-ICT-2013-11 Page - 6 - of 77
Revisions
Version Author(s) Partner Description of Version Date Completed
01 Konstantinos Kokkinos
CERTH Initial draft 18.12.2015
02 Konstantinos Kokkinos
CERTH Included Design of the System 30.12.2015
02.1 Konstantinos Kokkinos
CERTH Included DSS Architecture 10.01.2016
02.2 Konstantinos Kokkinos
Elpiniki Papageorgiou
CERTH Work on the Logical Architecture of DSS and forecasting algorithms.
20.01.2016
02.3 Konstantinos Kokkinos
CERTH Included Usability and Interface testing 28.01.2016
02.4 Konstantinos Kokkinos
Elpiniki Papageorgiou
CERTH Further work on Logical Architecture Overview of urban DSS 12.02.2016
03 Konstantinos Kokkinos
CERTH Final work on testing and validation preparing the first final draft 17.02.2016
03.1 Elpiniki Papageorgiou
CERTH Final work on the deliverable making corrections 20.02.2016
03.2 Laspidou Chrysi
CERTH Release to other partners 22.02.2016
03.3 Wojciech Froelich
US Make significant changes on the structure of the deliverable and provide comments
25.02.2016
04 Jose L. Salmeron
UPO Provided the Evolutionary multi-objective optimization algorithm for the Inference Module of the DSS
27.02.2016
05 Elpiniki Papageorgiou
CERTH Include Froelich’s restructure and suggestions and provide a new version of deliverable
5.03.2016

ISS-EWATUS FP7-ICT-2013-11 Page - 7 - of 77
ACRONYMS Explanations
ADL Architecture Description Language
AJAX Asynchronous JavaScript and XML
ANFIS Adaptive Neuro Fuzzy Inference System
API Application Programming Interface
ArcGIS Arc GIS Server by ESRI
ASP.NET
Free web framework for building web sites and web
applications using HTML, CSS, and JavaScript.
DSS Decision Support Systems
EUD End User Development
EPANET Computer program that performs extended period
simulation of hydraulic and water quality behavior within
pressurized pipe networks
FCM Fuzzy Cognitive Maps
GeoServer Open Source GIS-Server used.
GUI Graphical User Interface
IEEE Institute of Electrical and Electronics Engineers
JSON JavaScript Object Notation
KML Keyhole Markup Language
LINQ Language Integrated Query
NN Neural Network
OGC Open GIS Consortium
OpenGIS Open Geographical Information System
PMAC
Part of the Pressure Monitoring And Control system by
Technolog Conmpany
PRV Pressure Regulation Valve
RESTful
Web services based on REST (representational state
transfer)
RP Rapid Prototyping
RSS Rich Site Summary
SDLC System Development Life Cycle
SOS Sensor Observation Service
SSDD System Software Design Document
WaterML Water Modelling Language
VM Virtual machine
WCS Web Coverage Service
WDS Water Distribution System
WFS Web Feature Service
WMS Web Map Service
ISS-EWATUS FP7-ICT-2013-11 Page - 8 - of 77
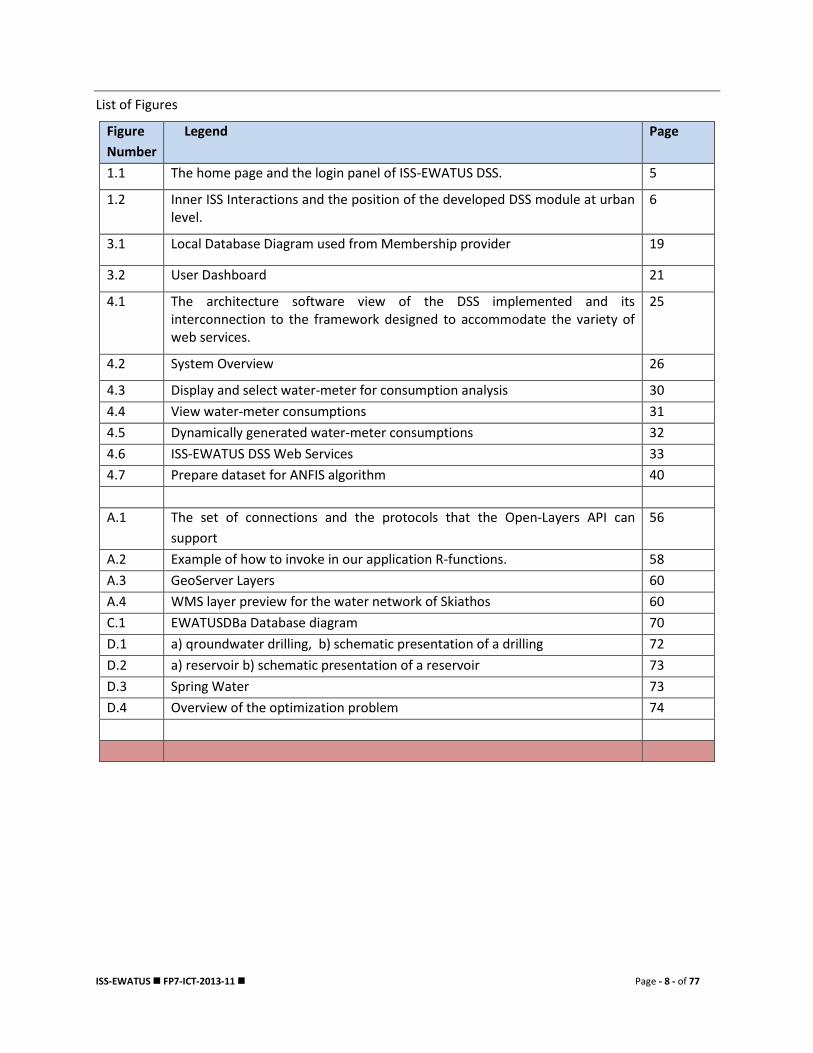
List of Figures
Figure
Number
Legend Page
1.1 The home page and the login panel of ISS-EWATUS DSS. 5
1.2 Inner ISS Interactions and the position of the developed DSS module at urban level.
6
3.1 Local Database Diagram used from Membership provider 19
3.2 User Dashboard 21
4.1 The architecture software view of the DSS implemented and its interconnection to the framework designed to accommodate the variety of web services.
25
4.2 System Overview 26
4.3 Display and select water-meter for consumption analysis 30
4.4 View water-meter consumptions 31
4.5 Dynamically generated water-meter consumptions 32
4.6 ISS-EWATUS DSS Web Services 33
4.7 Prepare dataset for ANFIS algorithm 40
A.1 The set of connections and the protocols that the Open-Layers API can
support
56
A.2 Example of how to invoke in our application R-functions. 58
A.3 GeoServer Layers 60
A.4 WMS layer preview for the water network of Skiathos 60
C.1 EWATUSDBa Database diagram 70
D.1 a) qroundwater drilling, b) schematic presentation of a drilling 72
D.2 a) reservoir b) schematic presentation of a reservoir 73
D.3 Spring Water 73
D.4 Overview of the optimization problem 74

ISS-EWATUS FP7-ICT-2013-11 Page - 9 - of 77
Executive summary
Our web application is hosted on an IIS (Internet Information Services) VM and is available through the
Internet in the following address:
www.issewatus.certh.gr
Figure 1.1: The home page and the login panel of ISS-EWATUS DSS
The purpose of the System/Software Design Document (SSDD) is to provide an overall description of the
urban level managerial functionalities of the developed DSS and to specify the hardware and software
system detail design.
The SSDD covers the following subject areas relative to the ISS-EWATUS Urban DSS application:
Primary functional users
System architecture
System software design
System hardware design
Software Application Design
Database Design (partially since it has been given a separate deliverable for the DB-design)
In this chapter we make a short discussion only relatively to the functional users of the system. However
the rest of the subject areas relative to the ISS-EWATUS Urban DSS description are elaborated in the
following chapters of this manuscript.

ISS-EWATUS FP7-ICT-2013-11 Page - 10 - of 77
Furthermore, the DSS we will describe in this manuscript is a major component of a larger integrated
system that includes a DSS that studies the consumption of water at the household level, a DSS for
making effective pricing policies and a social media platform that integrates the above as the following
diagram shows (taken from Deliverable 4.1 of the same project).
Figure 1.2: Inner ISS Interactions and the position of the developed DSS module at urban level.
The following table summarises tasks contributing to this deliverable, their objectives and outcomes
with the references to relevant sections of this document.
Tasks Objectives Reached (Yes/No)
Task 4.2: Inference module of decision support system
The suggested algorithms must replace and surpass human decisions of which water supply sources to choose for supply of water at each time. Internal factors, such as water pressure, water demand and flow-rate and external factors must be taken into account.
Yes
Task 4.3: Implementation of forecasting algorithms
Develop water demand forecasting algorithm based on ARIMA, ETS and Holt Winters
Yes
Develop water demand forecasting algorithm based on Fuzzy Cognitive Maps and Evolutionary Algorithms
Yes
Develop water demand forecasting algorithm based on Neural Networks
Yes
Develop water demand forecasting algorithm based on Adaptive Neuro-fuzzy Inference systems
Yes

ISS-EWATUS FP7-ICT-2013-11 Page - 11 - of 77
Main architectural aspects of the DSS have been defined following the described functional, technical and architectural requirement specifications of D4.1, by identifying the services provided and required by each subsystem and defining the interfaces to be used for communication.
Yes
Task 4.3: Development of the integrated DSS at urban level
Design of Interfaces. The user interface has been developed making the algorithms developed in this WP easily accessible to the end-users.
Yes
DSS implementation. This work task actually implements the decision support system, using the input from the previous tasks within this work package. All the necessary components have been implemented. Testing and Modification Phase have been accomplished at every stage of the DSS implementation. All developed modules have been already embedded into the DSS.
Yes
The hydraulic models of the two networks (Skiathos, Sosnowiec) have been built. As a result, the assessment of existing hydraulic conditions within the supply system is obtained.
Yes
Task 4.4: Simulation of water supply network
The forecasts of both water demand and hydraulic model of water distribution are performed.
Yes

This project has received funding from the European Union’s Seventh Framework Programme for research, technological development and demonstration under grant agreement no [619228]
ISS-EWATUS FP7-ICT-2013-11 Page 12 of 77
1 Introduction
The developed online Decision Support System (DSS) is a monitoring, forecasting and advisory tool to
simulate and control the efficacy of sustainable urban water management practices. This system
spans on capturing two different use cases (pilot cities) namely the use case of Sosnowiec, Poland
and the use case of the city of Skiathos island, Greece. The DSS gives the ability to experienced users
to initiate simulations on water demand practices for each case scenario in a variety of time scales
and using a repertoire of intelligent forecasting methodologies on historical data. The results are
used for providing input to a hydraulic model for the water distribution network based on the
EPANET well known simulation tool in order to induce management practices to be applied to the
water user categories within each service area according to selected parameters. The system is able
to provide simulation results in thematic maps exactly on the GIS layers that are dynamically created
and ultimately create heat maps of water demand for various seasonality oriented parameters.
The primary goal of the development of the aforementioned system is to became an effective tool
for the competent authorities, the stakeholders and the policy makers for supporting the decision
making process for the water resources management. The uniqueness of such systems is based on
the integration of multiple and sometimes interdisciplinary software component that it is made off
while at the same time aiming towards the water saving at urban level, the leakage reduction of
water distribution networks and the involved energy savings.
The implemented system integrates the monitoring of hardware devices such as the main valves of
the water distribution network, the devices that monitor the water pressure at specific critical points
of the network etc. Furthermore, through the use of the spatiotemporal database sub-system, we
are able to provide an abstract way of concentrating all relevant data into a centralized place with
the obvious benefits.
What we have succeeded to provide is to harmonize the water subsystems under study and all the
communication languages (coming from the different sub-systems of managing and monitoring) in
an interoperable platform that supports the water managers’ work to make more effective and
efficient decisions regarding the whole chain. To improve decision making, firstly several algorithms
have implemented to forecast the water demand of each use case scenario at a daily basis or even at
a 10min intervals to make a detailed water demand profile for a city. With the use of these water
demand profiles, we make an intelligent and revolutionary algorithm to disaggregate the demand to
the level of each household (hydrometer) and to the level of a previously defined geographical area
of study. In this way we finally implemented a dynamic interaction between all subsystems with the
EPANET model so that to forecast what will be the water pressure profile of the water distribution
network under the methodology described above.
In the following sections we describe the main objectives of the system implemented and all the user
and functional requirements addressed by the system.

This project has received funding from the European Union’s Seventh Framework Programme for research, technological development and demonstration under grant agreement no [619228]
ISS-EWATUS FP7-ICT-2013-11 Page 13 of 77
2 Objectives and Requirements
The implemented software for managing water resources at urban level builds on the lessons of
experience. At its core the system has the major objective to adopt a comprehensive policy
framework and to address the treatment of water resources at urban level as an economic good,
combined with decentralized management and delivery structures, greater reliance on pricing, and
fuller participation by stakeholders. More specifically, the system even though it is primarily made
for water company experts, it has also implemented the necessary “hooks” to be accessed by the city
residents (a subsystem to provide alarms for water distribution failures and leakages). The proposed
approach is consistent with the water directives from the European Commission.
The implemented system allows the adoption of a comprehensive framework in order to analyze
policies and options and draw decisions about managing urban water resources in cities. In the case
scenario where significant problems exist, or are emerging, concerning the scarcity of water, the
system provides an efficiency of service regarding the control of water pressure and the future
reduction of water leakages in the distribution network.
The complexity of the analysis was multileveled depending on the characteristics of each pilot city,
however, the framework can facilitate the consideration of deviations of the already existed systems
for monitoring and managing in these pilot cities. The system can also easily be hooked to the
appropriate subsystem of the same project regarding the economic objectives, and produce
appropriate thematic maps of the projected demand. The analytical framework would provide the
underpinnings for formulating public policies on regulations, incentives, public investment plans, and
environmental protection and on the interlinkages among them. It would establish the parameters,
ground rules, and price signals for decentralized implementation by government agencies and/or the
private sector. Also, decentralizing the delivery of water services and adopting pricing that induces
efficient use of water are key elements of sound water resource management.
To summarize the basic objectives met by the development of this system we must say that:
1. It provides adaptive management of water resources at urban level.
2. The system characterizes and clarifies certain sources of uncertainty that usually exist in
systems of such application range. More specifically, it gives a compact yet understandable
way to intercommunicate between proprietary hardware and software and also gives a
common ground to analyze data through the spatiotemporal model shared data repository.
3. The system provides the observation and monitoring functionalities as a response to
management actions. Furthermore, the dynamic nature of the system allows expert users to
initiate and integrate specific management interventions as it was claimed in the document
of work.
4. Relatively to the evaluation of the system, and even though this will follow in the next tasks
of this work package, the system responds as was expected and therefore, other different
potential changes can be developed and tested in future management alternatives.
Information and data gathered in future management interventions could be used to
validate or invalidate such changes.

This project has received funding from the European Union’s Seventh Framework Programme for research, technological development and demonstration under grant agreement no [619228]
ISS-EWATUS FP7-ICT-2013-11 Page 14 of 77
5. The system is open ended in terms of including and assimilating new data and information in
a conceptual and numerical representation, embodying the current understanding of how it
should function.
6. Flexibility which is an important aspect of a good adaptive management practice has also
been taken into account. The changing of policies which are based on the observed impacts
in future times and under the global policy making allows the system to conform. That
means, the system gets essential feedback which links the latest sensor observations with
the next decision-making steps. However, to achieve this, the system requires close
collaboration between those who monitor, study and interpret the behavior of the system
with those who do the decision-making.
In order to accomplish the desired functionalities for our tool we had to integrate a mixture of
different technologies to help us in our goal and manage each one of the corresponding modules.
Those modules are listed in Appendix A.

This project has received funding from the European Union’s Seventh Framework Programme for research, technological development and demonstration under grant agreement no [619228]
ISS-EWATUS FP7-ICT-2013-11 Page 15 of 77
3 Design of the DSS
3.1 Primary Functional Users
We define what types of users the system can support and for each type we provide their
characteristics. By users we mean the individuals who are able to interact directly with the software
product at hand:
Water Company User – These are the primary users of our system and have as a main goal
to use this tool to practice to water resource management for their urban area under
consideration. The system has been implemented to fully handle the areas of the two pilot
cities namely the city of Sosnowiec, Poland and the city of the Skiathos Island, Greece.
However we must mention that with the appropriate additions in the spatiotemporal
database (i.e. specific database tables that needed to define each new use case) as well as
minimal code changing the system has been developed to be an open-ended online system
and to have the ability to host many other use cases. The role of the water company user
which is the primary and most important user type in the system enjoys the following
privileges:
o Can insert/update water data for the registered regions/countries.
o Can insert information about sensors and valves.
o Can deploy forecasting algorithms to predict water demand for a case scenario (it
may be a one step ahead, a one-day ahead or a series of days ahead).
o Can manage land zones of interest in the area under study. The water company user
has the ability to create, edit, update and delete land zones of interest in the field of
study.
o Can have a managerial role in the insertion of meteorological and socio-economics
data in the system. The reason the system is built this way is that firstly there are
cases when the meteorological data is not available through the developed web
services (for example today’s temperatures are not available yet) and secondly there
are socio-economics data which are inserted into the system as they become
available and the availability time periods may range from days to trimesters
according to the time-period of interest and the use case. The ability therefore of the
primary user of the system to handle awkward situations like the ones mentioned
above is crucial for the system to function at all times.
o Can have managerial role in handling alarms that are raised by simple users. When
we talk in detail about such users we will elaborate on this issue. However the
aforementioned alarms refer to cases of water distribution network failures and
therefore it is an important submodule of the system.
This project has received funding from the European Union’s Seventh Framework Programme for research, technological development and demonstration under grant agreement no [619228]
ISS-EWATUS FP7-ICT-2013-11 Page 16 of 77
o Can deploy the EPANET model submodule after a series steps that involve
forecasting of water demand and disaggregation of this water demand to the various
land zones of the area, in order to predict the water pressure of the water
distribution network.
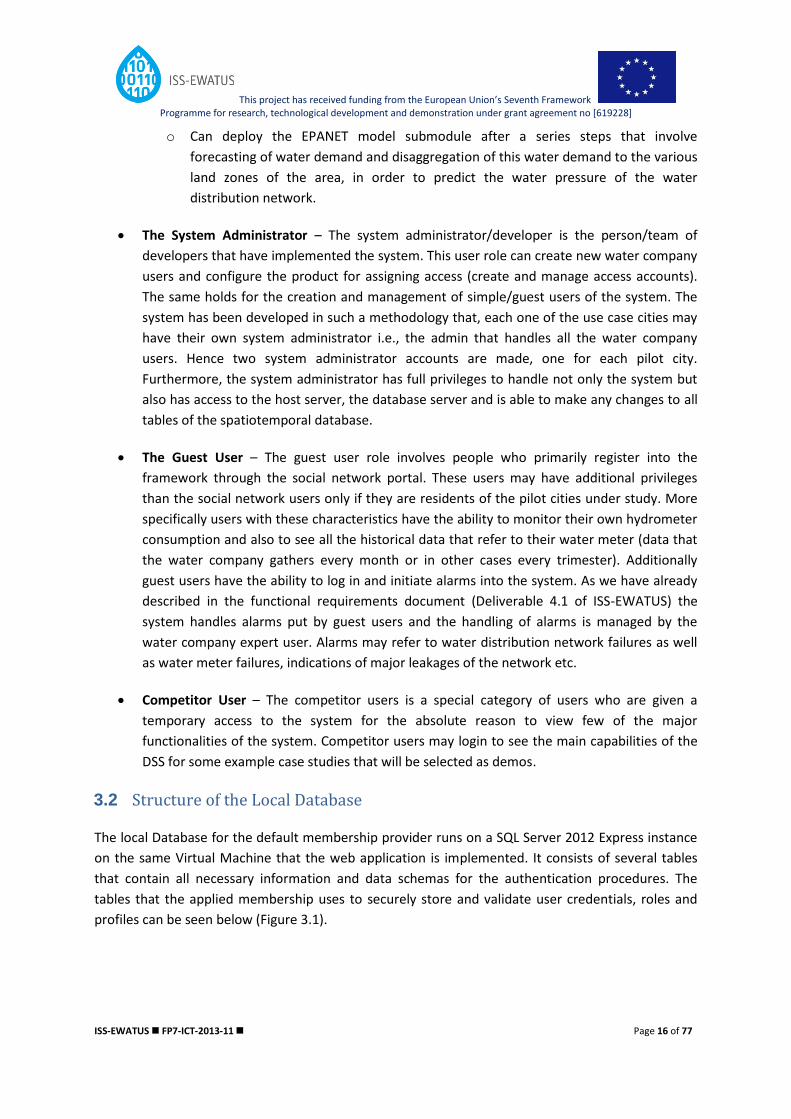
The System Administrator – The system administrator/developer is the person/team of
developers that have implemented the system. This user role can create new water company
users and configure the product for assigning access (create and manage access accounts).
The same holds for the creation and management of simple/guest users of the system. The
system has been developed in such a methodology that, each one of the use case cities may
have their own system administrator i.e., the admin that handles all the water company
users. Hence two system administrator accounts are made, one for each pilot city.
Furthermore, the system administrator has full privileges to handle not only the system but
also has access to the host server, the database server and is able to make any changes to all
tables of the spatiotemporal database.
The Guest User – The guest user role involves people who primarily register into the
framework through the social network portal. These users may have additional privileges
than the social network users only if they are residents of the pilot cities under study. More
specifically users with these characteristics have the ability to monitor their own hydrometer
consumption and also to see all the historical data that refer to their water meter (data that
the water company gathers every month or in other cases every trimester). Additionally
guest users have the ability to log in and initiate alarms into the system. As we have already
described in the functional requirements document (Deliverable 4.1 of ISS-EWATUS) the
system handles alarms put by guest users and the handling of alarms is managed by the
water company expert user. Alarms may refer to water distribution network failures as well
as water meter failures, indications of major leakages of the network etc.
Competitor User – The competitor users is a special category of users who are given a
temporary access to the system for the absolute reason to view few of the major
functionalities of the system. Competitor users may login to see the main capabilities of the
DSS for some example case studies that will be selected as demos.
3.2 Structure of the Local Database
The local Database for the default membership provider runs on a SQL Server 2012 Express instance
on the same Virtual Machine that the web application is implemented. It consists of several tables
that contain all necessary information and data schemas for the authentication procedures. The
tables that the applied membership uses to securely store and validate user credentials, roles and
profiles can be seen below (Figure 3.1).

This project has received funding from the European Union’s Seventh Framework Programme for research, technological development and demonstration under grant agreement no [619228]
ISS-EWATUS FP7-ICT-2013-11 Page 17 of 77
Figure 3.1: Local Database Diagram used from Membership provider
After successful login the system checks the assigned user Role (Poland or Skiathos Admin) and
redirects user to the corresponding function.
3.3 Deployment Model
Most of the modern programming languages try to exploit abstraction in order to reduce complexity.
That means that when we program rather complex systems it is towards the best of our interest to
modularize to the finest/smaller component the work and at a second phase to write code that will
be the abstract possible to accommodate all possible situations. The abstraction characteristic
primarily focuses on the functional behaviour and the logical composition of software. Also we must
say that the new modern programming languages are based in specific paradigms in order to deploy
new software. The most prominent that we also use in our system are the multithreading and the
concurrent objects. These two types of data types have the special characteristic of using interaction
mechanisms such as method calls, message passing, and shared resources in order to share the same
aspnet_Applications
ApplicationName
LoweredApplicationName
ApplicationId
Description
aspnet_Membership
ApplicationId
UserId
Password
PasswordFormat
PasswordSalt
MobilePIN
LoweredEmail
PasswordQuestion
PasswordAnswer
IsApproved
IsLockedOut
CreateDate
LastLoginDate
LastPasswordChangedDate
LastLockoutDate
FailedPasswordAttemptCount
FailedPasswordAttemptWindo...
FailedPasswordAnswerAttempt...
FailedPasswordAnswerAttempt...
Comment
aspnet_Paths
ApplicationId
PathId
Path
LoweredPath
aspnet_PersonalizationAllUsers
PathId
PageSettings
LastUpdatedDate
aspnet_PersonalizationPerUser
Id
PathId
UserId
PageSettings
LastUpdatedDate
aspnet_Profile
UserId
PropertyNames
PropertyValuesString
PropertyValuesBinary
LastUpdatedDate
aspnet_Roles
ApplicationId
RoleId
RoleName
LoweredRoleName
Description
aspnet_Users
ApplicationId
UserId
UserName
LoweredUserName
MobileAlias
IsAnonymous
LastActivityDate
aspnet_UsersInRoles
UserId
RoleId

This project has received funding from the European Union’s Seventh Framework Programme for research, technological development and demonstration under grant agreement no [619228]
ISS-EWATUS FP7-ICT-2013-11 Page 18 of 77
data repository. In our novel DSS we have developed a number of techniques to enable the
compositional development of modular systems such as the spatiotemporal database management
and the web services repository and the flexible reuse of these components whenever it is needed.
For example, the development of the set of algorithms for the DSS and the set of web services for the
case of one of the pilot cities and the reuse of them for the development of the other pilot city or the
future inclusion of any other pilot city in our system justifies the reuse development mechanism of
concurrent objects.
However the aforementioned techniques suffer from a small deficiency that is, they still overlook
how software’s deployment influences its behaviour. This is not always the case for concurrent
objects and multithreading but in our case we faced the above problem especially when concurrent
web services tried to modify data resources during execution. We resolved this issue by introducing
virtualization on the methodology to concurrently access the same data and concurrently trying to
modify the same data repository through concurrent objects. We had to separate the application
model, which requires resources, and the deployment scenario, which reflects the virtualized
computing environment and elastically provides resources. The next step that we are going to test
during the evaluation phase of this software (i.e. the third year of the project) is the performance
and scalability of a service for many different deployment scenarios already at the modeling level
Deployment support provided by methodologies
The deployment of systems development methodologies can be seen and evaluated from several
perspectives. Examples of criteria/metrics to perform such an evaluation may include the following:
Level of use
Acceptance by the target group of users
Horizontal and vertical use
User satisfaction etc.
Note also that the deployment encapsulates the post-implementation stages of the innovations
diffusion process where the innovation is actually being used in the organization. Thus from this
point of view we cannot have any data yet since our software is at the first stage of such conclusion
of its development and the evaluation comes next.
To measure the perceived support that systems development methodologies provide, we based our
measurement on the work by Henderson and Cooprider ( Henderson and Cooprider , 1990). These
authors have developed and tested a functional model for Integrated Software planning. They base
their methodology into two major categories: production and co-ordination technology. They believe
that “production is the functionality that directly impacts the capacity of an individual(s) to generate
planning or design decisions and subsequent artefacts or products.”
Having in mind the methodology of these authors we have developed our software to include the
following three basic characteristics:

This project has received funding from the European Union’s Seventh Framework Programme for research, technological development and demonstration under grant agreement no [619228]
ISS-EWATUS FP7-ICT-2013-11 Page 19 of 77
1. The software allows the user to define, describe, or change a definition or description of an
object, relationship, or process.
2. The system allows the user to explore, simulate, or evaluate alternate representations or
models of objects, relationships, or processes.
3. The way the software was developed, it executes a significant amount of planning or design
task, thereby replacing or substituting a human designer or planner.
3.4 Graphical User Interface
All web pages that exist in user folder, and are used as the front-end of our web application conform
to a universal stylesheet that defines the overall style and element positioning of the User Interface.
These pages derive from a MasterPage file (basically a universal Template) which defines the basic
components such as the menu bar, popup windows, footer, content placeholders (where each page
holds their separate UI modules) etc. With this type of implementation we achieved a universal look
and style for all web pages, easy and secure authentication procedures (so that only logged in and
roles registered users can access).
The majority of the project's web pages consist of html elements (ul, labels, text-areas, divs,
paragraphs etc.) as front-end source code, along with CSS, JavaScript and JQuery functions and run
on Server Side. We must also note that the whole web application project was built using the
bootstrap framework (Twitter based front-end framework that consists of html, CSS and JavaScript
that helps to build responsive applications).
The initial home page for each user contains a dashboard (Figure 3.2) with all functionalities that are
available to each Group / Role of users. Each tab redirects user to a specific web page that handles
the required modules.
Figure 3.2: User Dashboard

This project has received funding from the European Union’s Seventh Framework Programme for research, technological development and demonstration under grant agreement no [619228]
ISS-EWATUS FP7-ICT-2013-11 Page 20 of 77
Our software implements each one of the basic functional requirements in separate web pages that
allows users to easily access them (i.e. monitoring of water-meter consumptions, monitoring of
pumping stations, database records management, simulation algorithms etc.)

This project has received funding from the European Union’s Seventh Framework Programme for research, technological development and demonstration under grant agreement no [619228]
ISS-EWATUS FP7-ICT-2013-11 Page 21 of 77
4 Architecture of the DSS
The system is composed by a set of sub components which are implemented artificial intelligence
algorithms and models that can simulate and predict the water demand of an area or district.
The ISS-EWATUS DSS is 3-tier application consisting of 3 layers. This allows us to develop a highly
flexible, responsive and modular software. The layers are:
User Interface - Client Layer (html and aspx web pages)
Presentation - Application Layer (graphical display of user case action results)
Data Layer (Connection and Manipulation of data objects)
The ISS-EWAUSS urban-level DSS software tool integrates web technologies (web services, n-tier
architecture, client and server side programming, geographical information services, complex
forecasting algorithms) to a single web-based application that is user friendly and has the ability to
manage and depict all necessary functionalities.
The ISS-EWATUS urban-level DSS is a model-driven DSS implementing a spatiotemporal model
methodology which aggregates through online telemetry information about:
The water demand of a city,
The water distribution network characteristics of that city,
The water consumption of each household water pipeline that belongs to the water
distribution network,
The water pressure time-series data for each pressure regulator device that controls the flow
of water within the network,
The meteorological data related to the city as daily time series, and
Several other data that are implicated into the fluctuation of the population using the water
network such as seasonality, tourism, summer temperatures etc.
The software tool focuses on providing the water network and the water company managers a
decision support system that can be used to forecast water demand, suggest a near-optimal water
pressure regulation scheme on a daily basis and through this water pressure management decrease
the overall water leakage in the network.
Compared to traditional DSS, there are two changes brought by this implemented Web-based DSS.
First, it is the fact that the underlying architecture of the DSS has moved from main frames, to client–
server systems, to Web and network technology-based distributed systems. Consequently, large
amounts of data and related decision support tools from multidisciplinary sources, which may be
located in a distributed computing environment, have the possibility to be integrated together to
support decision-making.
Secondly, differing from traditional DSS, such as data-driven DSS focusing on access to and
manipulation of a time-series of data, model-driven DSS focusing on access to and manipulation of a

This project has received funding from the European Union’s Seventh Framework Programme for research, technological development and demonstration under grant agreement no [619228]
ISS-EWATUS FP7-ICT-2013-11 Page 22 of 77
domain-related model, and knowledge-driven DSS focusing on high-level knowledge extraction and
data mining, our Web-based DSS provides the ability to build a hybrid DSS. That is the ability to
synthesize the previous three approaches of design and to make an amalgamation of the different
methodologies by keeping the most convenient components. Furthermore, our system is not
restricted to just the management of the urban water resources but it can be easily modified to
integrate other commodities or any other product that is governed by spatiotemporal analysis and
risk management. To analyse and interpret the data from the spatiotemporal database, domain-
related analysis tools were needed to provide value-added information. Unfortunately these tools
are not ready made components but they had to be implemented from scratch. Furthermore,
knowledge discovery tools and data mining tools were built for the case of web DSS access to the
host server in order to extract useful knowledge from the information and data to support decision
making. More specifically there is a variety of forecasting algorithms spanning from minute one step
ahead forecasting to daily basis forecasting and from univariate to multivariate time-series
forecasting analysis. Given the multidisciplinary data sources and the related decision support tools
and algorithms, the design, specification, and implementation of the DSS was successful.
The system initially consisted of the data and the related tools, which come from multidisciplinary
areas such as weather and meteorological data, social economics data, hydrological data, water
distribution network hydraulic data, client data and geographical information system data for the
client hydrometers. These data and related tools originally were not designed to work together. Also
we must note that traditional DSS framework design methods usually lack the ability to structure,
organize and set a hierarchical view of the data used and the software components developed in
order to specify the software architecture of a Web-based DSS in a formal way. On the other hand,
with the assistance of the todays’ available Web and network technology, the data and the
developed decision support tools from multidisciplinary areas can be located on computers
distributed over a network. For example in our case the spatiotemporal database is located in a
different server located in Poland where the main host that contains the vast majority of the DSS
functionalities is located in a server in Greece. Additionally the connection of the system with the
EPANET hydraulic model to predict the water pressure of the network is of the same philosophy
since the EPANET is hosted in another separate server. Summarizing our arguments, we claim that in
such a distributed environment, our decision to develop a web based DSS application was “a must
decision” in order to manage and integrate the data and tools in a seamless way and to tackle the
aforementioned problems.
We show that, the system uses layered software architecture to provide a hierarchical view in order
to organize and specify the data and the related tools from multidisciplinary sources. In the layered
architecture, the data and related tools are viewed as components/services. When it is necessary we
use an Architecture Description Language (ADL) which is applied to provide formal specifications for
components and component composition (connectors). We need this specification of components
and connectors for the design of open interfaces and formal behaviour and to avoid an ambiguous
guidance for component and connector analysis and implementation. To implement the layered
architecture in a distributed computing environment, a component-based framework is also
presented. The framework we created has three major roles: the creation of components, the
creation of connectors that connect the components, and the creation of a coordinator that provides
the coordination of the components and the orchestration of the web services. The implementation

This project has received funding from the European Union’s Seventh Framework Programme for research, technological development and demonstration under grant agreement no [619228]
ISS-EWATUS FP7-ICT-2013-11 Page 23 of 77
of components and connectors in the framework follows the specification of components and
connectors at the design stage. We note that a component is a computation or storage server while a
connector is a server enabling component composition. On the other hand, a coordinator is a server
that manages components and connectors. The following figure (Fig. 4.1) shows the relationship
between the layered software architecture and the component-based framework in a Web-based
DSS. The layered software architecture creates a formal and hierarchical architecture view for the
Web-based DSS while the framework concretizes the layered software architecture in a distributed
computing environment. In this figure we show an example of the information layer to provide
access to more than one web services which in the framework have their own dedicated connector
objects. These objects are used from the coordinator object to synthesize the decision making
process according to the use case scenario, the philosophy of the forecasting methodology used for
the water demand and the integration of the EPANET model for the water pressure prediction.
Figure 4.1: The architecture software view of the DSS implemented and its interconnection to the
framework designed to accommodate the variety of web services.
As the diagram shows, the goal for the DSS and the decision analysis as a whole is to develop
relationships explaining the field of study and the engineering processes that describe these
relationships and their conversion into knowledge that can be used to make sound decisions for
water management. The layered software architecture assists in the design of the DSS implemented
by providing a formal and hierarchical view. With the help of the component-based framework, the

This project has received funding from the European Union’s Seventh Framework Programme for research, technological development and demonstration under grant agreement no [619228]
ISS-EWATUS FP7-ICT-2013-11 Page 24 of 77
urban ISS-EWATUS provides distributed services that can quantitatively describe the intensity,
duration, and magnitude of events.
4.1 Logical Architecture Overview – Main functionalities and modules
The ISS-EWATUS DSS project consists of several modules combined under a unique - universal
platform that brings all required functionalities to the user.
Figure 4.2: System Overview
4.1.1 Monitoring
Users can monitor various devices, observations or water network parameters. We included 6 use
cases for monitoring: (a) water consumption from the hydrometers, (b) water pressure data for a
specific land-zone or the whole network, (c) water flow, (d) water consumption of a specific land
zone, (e) water readings of devices at the urban level controlled solely by the water company (e.g.
Cellos, PRV device (Regulo)).
Water Consumption monitoring: In this sub-category we have succeeded to include all
consumer hydrometers for both the use case areas.
Water pressure data for a specific land-zone or the whole network: There are several types
of readings regarding the water pressure in a field of study that we need either to monitor or
to even generate for our calculations. More specifically we monitor/store
The inlet and outlet (the one provided by the PRV) water pressure of the
network at the main pipe coming from the well in Skiathos and at the main
pipe for the case of Sosnowiec.
The water pressure monitoring at the critical points.
The calculation of individual water pressures at the land zones (Skiathos) or
at the hydrometers (Sosnowiec) after a spatial disaggregation of the water
demand.

This project has received funding from the European Union’s Seventh Framework Programme for research, technological development and demonstration under grant agreement no [619228]
ISS-EWATUS FP7-ICT-2013-11 Page 25 of 77
Water Flow Monitoring: Similar to the water pressure the water flow is very important to be
monitored since it is the most important factor in predicting it through the forecast
algorithms for the next day and also it is primary input to the EPANET model for predicting
the water pressure of the network.
Water consumption of a specific land zone: Similar to the monitoring of water consumption
on a hydrometer level, after the creation of land zones of study, each of the land zones
behaves as a single “virtual hydrometer”. The system allows the water company user to
monitor and store the aggregated water consumption in various time scales based on the
number of hydrometers that reside in the land zone. The presentation of data is exactly the
same as in the first case of single hydrometer monitoring and it will be shown in detail in the
software architecture chapter.
Water readings of devices at the urban level controlled solely by the water company (cellos,
PRV device (regulo)): Devices like these are treated similarly to the hydrometers. They are
stored in the spatiotemporal database with their X,Y coordinates, thus they appear on the
thematic maps on the dashboard of the system and the user can click on them. According to
the data sampled by the device, there is an appropriate menu that is shown to the user so
he/she can pick the appropriate time series to inspect. For example we can show time series
for flow rate data, water pressure data etc.
4.1.2 Administrating land zones
This category corresponds to administrating land zones of the network and has one use case, i.e., to
create or update or delete a specific land zone for processing (a sub area of the whole water
network). We must note that the existing concepts and practices within the scope of the
administration of spatial units and the fulfilment of the objective of producing equally important
results in terms of forecasting water demand or predicting water pressure of a sub area of the water
distribution network have an extensive use in most software systems that deal with urban water
sustainability. Nonetheless, enhancing the land management paradigm is very important for urban
case studies where the number of nodes in the water distribution network is of great amount and
whenever it is necessary to study and analyse the individual characteristics of specific sub areas of
the network. For that reason we have incorporating in our system the functionality for the water
company expert user to create land zones of study, to save these land zones in a special database
table, to have the ability to update the characteristics of each of the land zones dynamically (for
example the dynamic changing of status of the hydrometers residing inside a specific land zone), to
delete unneeded land zones and in general to have full administration privileges in data manipulation
of these sub-areas. To succeed such a case, we developed a set of graphical interface tools to make
the creation, manipulation and administration of the land zones easier for the user.
4.1.3 Administrating Users
This category contains only the administration of users of the system and includes only one use case
to do so. We have created three different user roles for the whole DSS:
This project has received funding from the European Union’s Seventh Framework Programme for research, technological development and demonstration under grant agreement no [619228]
ISS-EWATUS FP7-ICT-2013-11 Page 26 of 77
The super/admin or the back-end user,
The water company expert user and
The resident user.
Users can be added or removed from the system by any back-end user. Resident users are created
by the social network portal from which there will be an anchor to the DSS. The resident users will
have only information to their personal data (i.e. the historical data of their own hydrometer and the
ability to create and upload alarms into the DSS system).
The water company expert user is the main user of the DSS. Indicatively, we have two accounts
created: one for the water company expert of Sosnowiec and the other for the water company
expert of the Skiathos Island.
Finally the back-end user is the actual developer of the system who has also the ability to either
dynamically create new users or to hard-code new users.
Auxiliary functionalitiesThis category contains auxiliary functionalities and includes 3 use cases: (a)
the creation of reports, (b) the use of map tools and (c) the use of the DSS manual.
The use case of reports corresponds to producing reports regarding the:
o Creating and updating land-zones
o Creating parameters for the forecasting algorithms
o Creating a water pressure map of a city or a specific land-zone
o Viewing and printing shapefiles with annotations of a city or a specific land-zone.
o Creating heat maps for showing the variations in water demand at a city level or at a
specific land-zone
o Showing the map of the city or the map of a specific land-zone
o Viewing the list of users etc.
o Reports for summarization of data for both pilot cities related to
Water demand (on a daily average basis and on the recorded granularity
step (10 min and 15 min)
Water pressure data, both inlet and outlet (on a daily average basis and on
the recorded granularity step (10 min and 15 min)
Resident consumptions (on a monthly basis for Sosnowiec and on a trimester
basis for the Skiathos)
For the case of map tools the system is able to
o Create graphically a region (a sub-area of the water distribution network) as a
polygon
o Calculate automatically the area of the region at hand
o Aggregate the hydrometers that reside in the area that was created and either store
them in a separate file or create a virtual hydrometer that represents them as a
single consumption point

This project has received funding from the European Union’s Seventh Framework Programme for research, technological development and demonstration under grant agreement no [619228]
ISS-EWATUS FP7-ICT-2013-11 Page 27 of 77
o The tools include also the functionality of editing, updating and deleting already
existed areas previously created.
4.1.4 Geospatial Web Map Service Management
This category includes functionalities for handling the loading and the saving of GIS (shapefiles)
geospatial data from/to web map server and includes two use cases: (a) loading maps (land zones)
and (b) loading the water network.
For this functionality we use the OpenGIS® Web Map Service Interface Standard (WMS) which
conforms to the OGC protocol and provides a simple HTTP interface for requesting geo-registered
map images from one or more distributed geospatial databases. For the two aforementioned
procedures we create two WMS requests which define the geographic layer(s) and areas of interest
to be processed. Previously the maps in a form of shape files are already uploaded to the WMS
server used (in our case the Geoserver). The interface we just described also supports the ability to
specify whether the returned images should be transparent so that layers from multiple servers can
be combined in the case of rather complicated applications. For our case we do not need more than
two layer-overlapping in any of the individual procedure that involve rendering of geospatial data.
4.1.5 Web Application Project
EWATUS DSS was developed using the .NET Framework but with all the open source technologies.
More specifically, the Web application project was built under .NET Framework V4.0, using the
programming language of C# as back-end, html (Hyper Text Markup Language), JavaScript, CSS3
(Cascading Style Sheets) and various open source libraries.
As stated above all our pages contain html UI elements to display any data to user, styled with CSS
files, and various open source JavaScript libraries and methods. These pages communicate through
our Web Services with the Remote Database to retrieve data or apply any computational functions
and algorithms. Below we will analyze the functional requirement of water-meters monitoring, the
web pages that are involved, JavaScript functions, 3rd party tools and libraries and web services used
in the example of Skiathos.
WaterMeters-Consumptions.aspx
When the user wants to monitor water consumptions for a specific water-meter he is being
redirected to the below web page (Figure 4.3).

This project has received funding from the European Union’s Seventh Framework Programme for research, technological development and demonstration under grant agreement no [619228]
ISS-EWATUS FP7-ICT-2013-11 Page 28 of 77
Figure 4.3: Display and select water-meter for consumption analysis
This webpage uses the Open-Layers API to render and display a map (in Street or Aerial view) and
consists of 5 tiled layers.
The base map layer can be either an OpenStreet Map layer (Street view option) or a WMS tile layer
retrieved for gis.ktimanet.gr. Also we display two additional layers that display some shape files that
correspond to the water network topology of Skiathos.
Finally we have the water-meters layer which is displayed on top of all layers and are dynamically
generated when the page loads with the help of JavaScript and Web Services. The whole source code
is provided to the source code repository of our project.
When the page loads we make a call to the JavaScript function loadnodes_type1(). The AJAX post to
our WebService ServiceGeoNodes, in the method "GetAllGeoNodes" includes a JSON serialized
variable list that contains the input values the web service method needs in order to work correctly.
These variables are the city and type of nodes we want to retrieve.
The Web service method that we use connects to the remote database and queries the data. Then
we create a list of C# class objects (GeoNode.cs), compose all necessary values and return them as a
JSON serialized string. We choose to use C# class objects and LINQ in order to benefit from latest
.NET technologies, data manipulation, ease of access and operational speed from the SQL-Server.
The result is a list containing some GeoNodes Objects that become deserialized on the client side to
an array, and then using some Open-Layers functions from the corresponding API we create points
based on their coordinates, unique identifiers and names and add them as a vector layer on top of
the map. We must note that all points are re-projected to the default EPSG projection system based
on their original coordinates in order to display all elements (base layers, tiled shape files layers,
water-meters etc.) correctly to the user.

This project has received funding from the European Union’s Seventh Framework Programme for research, technological development and demonstration under grant agreement no [619228]
ISS-EWATUS FP7-ICT-2013-11 Page 29 of 77
After displaying water-meters to the user, we use a JavaScript event function handler to catch and
manipulate user 'clicks' on the map, and display a popup window with necessary information about
the element and also a link to view the current consumptions by passing a query string field that
contains the unique node ID. By pressing the hyperlink 'View Consumptions' populated for each
water-meter we redirect the user to the 'ViewConsumptions-Meter' web page.
This webpage allows user to monitor consumptions for a specific water-meter based on a time
period (Figure 4.4).
Figure 4.4: View water-meter consumptions
This page uses the same source code for the map rendering and display, with the difference that it
generates a single point for the selected hydrometer ("getgeonodeid()") based on the query string of
the URL and auto zooms the map to the specific point.
When the page loads it searches using a JavaScript method the URL for query strings
(getqueryvariable("qsid")), gets the passed values and then posts asynchronously to WebService's
'ServiceGeonodes.asmx' method 'GetGeoNodeById'. This method takes as input a unique identifier
and searches the remote Database for matching records in the table 'GeoNodes'. The result is then
passed as a JSON serialized object and it is being displayed on the client side so that user can view all
necessary information for the corresponding node.
When the page has finished retrieving all geo-node data the user can input a time period to monitor
water consumptions for the selected meter. By pressing the 'View Consumptions' button the system
connects to 'ServiceWDSFlowmeters.asmx' web service and calls the 'GetFlowmetersData' method.
The input variables for the above method are the geonode id for which we want to monitor data, and
also the time period (start and end). The web method analyzes the inputs, constructs the appropriate
query and connects to the remote database to get the corresponding records from the database
tblDataTableWDSFlowmeters. The result is a JSON serialized object that contains water-meter
objects with consumption, reading, datetime and other values.

This project has received funding from the European Union’s Seventh Framework Programme for research, technological development and demonstration under grant agreement no [619228]
ISS-EWATUS FP7-ICT-2013-11 Page 30 of 77
Upon successful retrieval, on the client side, we use a 3rd party library (Highcharts Javascript Library)
to create charts from returned data. We deserialize the data object, create (date, consumption)
timeseries lists which and dynamically create the charts as shown below (Figure 4.5).
Figure 4.5: Dynamically generated water-meter consumptions
The current chart can then be saved as PDF or Image type file by using the export module of
HighCharts library. Also we provide the ability to the user to generate an excel data spreadsheet
containing the timeseries dynamically created data with the usage of Closed.XML library. On the
client side we make an asynchronous JavaScript post to "Reports.aspx" web service by passing a
JSON serialized object of all queried data and creates an excel file with appropriate water-meter
consumptions.
4.1.6 Web Services
The core functionalities of the developed DSS derive from the Web Services methods that are
consumed in the client side by the user. Each web service contains various public methods, each one
serving a specific functionality, grouped together and available for consumption to ISS-EWATUS DSS
web application users. These web services can be invoked by SOAP (Simple Object Access Protocol)
or by HTTP (POST or GET) or REST. The figure below (Fig. 4.6) shows a UML diagram of the web
services and their corresponding methods we use.

This project has received funding from the European Union’s Seventh Framework Programme for research, technological development and demonstration under grant agreement no [619228]
ISS-EWATUS FP7-ICT-2013-11 Page 31 of 77
Figure 4.6: ISS-EWATUS DSS Web Services

This project has received funding from the European Union’s Seventh Framework Programme for research, technological development and demonstration under grant agreement no [619228]
ISS-EWATUS FP7-ICT-2013-11 Page 32 of 77
All web invokable methods share the following common properties:
They are written using the programming language C# which encompasses strong typing,
imperative, declarative, functional, generic, object oriented and component oriented
programming disciplines.
They all run under the same Namespace
They are script enabed, meaning that they can be called via scripts, using AJAX.
They are developed based on project requirements that are highly modular
As stated above, EPANET module should be run at least once every new billing period in order to
have updated and current pressure profiles based on period's billing consumptions and pumping
station's water network consumption. When the system loads, it automatically checks the database
for latest records and alerts the user if he must run EPANET simulation to create and update the
simulations' results. The warning message and module redirection can be seen below.
When this message is displayed, then the user must run new EPANET simulations for the current
period in order to be able to generate and use correct flowrate and pressure profiles. In order to run
these simulations the DSS must prepare all data and create necessary database records. All these
functionalities are handled in RunEpanet.aspx web page.
On page load, the system retrieves and generates landzones for the selected city. Each landzone
holds a number of watermeters devices that are retrieved using OpenLayers JavaScript library and
TURF.JS. These devices will be used in the next step for the disaggregation of the water network
demand to the city's landzones. In order to dynamically retrieve this information first we load all
landzone objects from the database, along with their point’s coordinates which are represented as
GEOJSON objects and finally all watermeter devices that are located in the selected city. Then we
render the landzones on top of an OpenLayer map, along with the watermeter posistions and then
we use a function that uses TURF.JS library to create and retrieve point objects based on polygons
and their shapes. This function basically loops through a JavaScript array variable that holds all
landzone objects and checks for watermeter devices that are located in each polygon shape.
When the DSS has finished loading all landzones and their flowmeter devices it displays a message
indicating the procedure result and prompting user to continue with the generation and run of
epanet simulations. Having already created all landzones and their watermeter devices we can now
proceed with the creation and run of Epanet simulations. Although this procedure may take some
time, once the DSS and EPANET software has finished the simulations we don't need to create any
further simulations for the whole current period. This is achieved with the creation of multiple
epanet simulations, based on a range of variables that can cover all possible scenarios for the city we
are studying and will be described in details.
The next step is to press the 'Run Epanet Models' button. This button creates an AJAX post request to
the web service Preprocessing2 and calls the web method 'CreateEpanetDB'. This method takes as
input the current cityid, username and also a serialized list of landzone objects (which is basically the
local variable that the DSS created on the client side using OpenLayers and TURF libraries.). These

This project has received funding from the European Union’s Seventh Framework Programme for research, technological development and demonstration under grant agreement no [619228]
ISS-EWATUS FP7-ICT-2013-11 Page 33 of 77
inputs are passed along with the POST request and the web service starts with the creation of all
necessary EPANET modules
When the user calls the above mentioned Web method a series of functions and modules are called
in order to process all data. 'CreateEpanetDB' is the basic function that manages all auxiliary methods
and generates database records for the EPANET simulations. First the method deserializes the
landzones input text object to a list of landzone class objects. Each landzone object consists of a
unique id, its GEOJSON shape and the watermeter devices that are located inside the area polygon.
Having generated and assigned all watermeters using openlayers the DSS also checks for missing
watermeter devices that don't have valid coordinates and randomly assigns them to landzones.
When the system has finished with the landzones generation the next step is the spatial
disaggregation procedure. This is one of the most important functionalities and basically defines the
whole system procedure since we are able to generate water demands for specific landzones. The
dissagregation procedure is described briefly below (as an analytical description was accomplished at
D4.1).
1. We calculate the whole water network demand for a billing period based on pumping station
database records. We always use the same billing period from the previous year in order to
have complete and correct datasets
2. For all available watermeter devices we are calculating their total billing consumptions for
the selected period.
3. Then we are generating the leakage attribute based on the above results with this formula
SDP: Sum of Daily Pumping water demand for the whole billing period
SKY: Sum of all hydrometers billing consumptions for the whole period
Leakage Percentage = SDP-SKY / SKY4.
4. Afterwards we are calculating the theoretical consumption of each watermeter (which
includes water losses) based on the formula
DK_Consumption= Consumption * (1+Leakage Percentage)
5. Finally we are calculating the weight for each watermeter as a percentage based on its
theoretical consumption and the total network consumption
( Weight= DK_Consumption / SDP)
When the above function finishes, the system continues with the generation of the landzone
consumptions and weights. Based on the watermeter devices that exist in each landzone the web
application calculates the whole / summed theoretical water consumption for each landzone and
then generates the total weight for each ladzone object.
The next step is to prepare all EPANET Tables. The System clears all previous generated demands,
pressure results and other variables in order to regenerate them. The first thing is to create records
in the EPANET_QIDs table. By reading the settings for the current city the system automatically

This project has received funding from the European Union’s Seventh Framework Programme for research, technological development and demonstration under grant agreement no [619228]
ISS-EWATUS FP7-ICT-2013-11 Page 34 of 77
generates the above records. These records basically define all possible flowrate values that can be
found in the PRV device. By declaring some minimum and maximum values, along with some step
size we can produce a large amount of possible Flowrates. In this way, the user won't have to run
epanet simulations every time he needs to generate flowrate and pressure profiles for the forecasted
water demand since the EPANET will run all possible water simulations for the current billing period
and store the results for later usage.
The final step of the web method to create all available water demand records. These records are
created based on the generated QID values and the disaggregated landzone weights. For each
possible QID / PRV value (Flowrate) we are calculating the corresponding landzone water demand
and assign them to a Datatable object. At this point we must note that each landzone is assigned a
virtual node as a representative for the EPANET simulation models. When all water demands have
been created we are using a Bulk SQL query to insert these dataset in the EPANET_demands table.
When this procedure finishes we are creating some auxiliary database records and also create a
record in the EPANET_triggers table. This last action is responsible for calling / triggering the EPANET
software to run the simulations based on the database records we have created on the background.
The code used for the web method described above can be found source code repository of the
project.
The DSS will display a loading message while generating and writing all appropriate records in the
database and upon completion EPANET will start working on the simulations on the server. When all
simulations have finished, the EPANET software is configured to store all available results in the
remote Database tables (EPANET_Output_Pressure_PRVS and EPANET_Output_Pressure_Nodes).
These records are then used by the DSS when necessary in order to generate pressure profiles.
Flowrate and Pressure Profiles
When the DSS has finished with the generation of flowrate profiles and runs all the EPANET
simulations, the user can use all available results for the profiles creation. The pressure profile is
created after EPANET run. In order to access this functionality we must first run a forecasting
algorithm to predict the water demand for the network.
This method handles the creation of flowrate and pressure profiles which are returned as a JSON
serialized list of objects to the client side and then are rendered as graphs using Highcharts API.
Based on the disaggregation procedure we analyzed above we are generating landzone weights and
based on the predicted water demand we calculate the water demand for each landzone. Then we
proceed in the generation of flowrate profiles. To achieve this, we are using the latest records from
the PRV device. First we are calculating last day's water demand based on the flowrate PRV values.
Then we generate weights for each PRV timestep based on the daily demand and the current PRV
reading. When we have finished with the time disaggregation we are recreating a flowrate profile by
using the PRV timestep weights and the predicted total water network demand.
Finally, based on the predicted flowrate profile values we are retrieving the corresponding PRV
pressure values from the EPANET_Pressure_Outputs_PRVs table. The web method returns the
serialized results and the web application renders them on clied side.

This project has received funding from the European Union’s Seventh Framework Programme for research, technological development and demonstration under grant agreement no [619228]
ISS-EWATUS FP7-ICT-2013-11 Page 35 of 77
These results are dynamically generated as chart figures on client side, along with their distinctive
timestep values for easier visualization. Flowrate and pressure profiles can be also saved in excel
spreadsheet files as timestep / value arraylists by using the corrresponding functionality.
4.1.7 Forecasting module
Users can run forecasting functionalities. We included 3 forecasting functionalities: (a) forecast the
water demand for the whole water network, (b) forecast water demand for a specific land zone and
(c) create or update or delete a specific parameter to be included in the water demand forecasting
algorithms.
Forecasting the water demand for the whole water network: There are four different
algorithms that have been implemented to forecast water demand for an area or a specific
land zone. These algorithms mostly use regression algorithms and soft computing
methodologies. We have implemented the Adaptive Neuro Fuzzy Inference System
methodology, (ANFIS), a Neural Network methodology, a Fuzzy Cognitive Map (FCM)
methodology with Evolutionary algorithms for prediction and variations of regression
techniques such as ARIMA, AFRIMA etc. The algorithms have been implemented in different
programming languages or scripts thus making their integration to the online system a quite
challenging job.
Forecasting water demand for a specific land zone: Under the same assumptions that hold
for the whole study area, we use the forecasting algorithms to forecast water demand for a
specific sub-area, or land zone. The methodology is exactly the same, however there is an
additional disaggregation technique to project the corresponding water demand profile of a
specific land zone using the lumped values that refer to the whole island or district.
Create or update or delete a specific parameter to be included in the water demand
forecasting algorithms: Most of the forecasting algorithms use historical water demand data
and various seasonality data in order to predict the water demand for an area in a “one step
ahead” methodology i.e. to predict the water demand for the next day. The historical data
time span is up to years however today’s data are needed in order to predict the next day.
There are several obstacles into this approach. First is the fact that the data of current day
we would like to run the forecasting algorithm is never fully collected by the system unless
we are restricted ourselves to run the algorithm at 12:00 midnight every day. Therefore
there is an absolute need to be able to run such algorithms at any time of the day especially
for water company experts that work at a specific time schedule. On the other hand, there is
a specific set of forecasting algorithms that in order to predict the water demand for the next
day they also need several weather data for the next day which are not predicted but simply
they must be input by the user of the system. The above arguments make our case strong in
terms of human dynamic intervention in running the forecasting algorithms and changing
several parameters or updating several data by hand at the time of executing the software
component. The system allows such an intervention where the user is prompted to: insert

This project has received funding from the European Union’s Seventh Framework Programme for research, technological development and demonstration under grant agreement no [619228]
ISS-EWATUS FP7-ICT-2013-11 Page 36 of 77
data (mostly meteorological) that are missing from previous days or put a prediction of
meteorological data for the next day, insert/predict socio-economics data for the next day,
predict water demand data of time periods of the current day in order to forecast values of
the next day etc.
The forecasting water demand module was created based on the cities' available datasets and
reuirements. For the DSS we used a variety of prediction algorithms, customized or built based on
our needs, and with the help of some auxiliary toolkits and programming environments. These
algorithms implementations are located in Algorithms.asmx web service and can be called through
any HTTP or REST web request from client side. The code behind each web method handles the
communication with all necessary modules and libraries in order to generate appropriate results.
Each algorithm has a customized implementation based on the available dataset formats, inputs,
configuration variables and outputs in order to achieve better execution times and results.
RCmeans
The algorithm is implemented as an .R script and was modified to be used dynamically through our
web service. This script generates a predicted flowrate profile (Timestep / Flowrate values) based on
historical PRV dataset.
Inputs: PRV node, period start datetime for learning, cityid and username
The implementation of the script is based on the current season and a clustered dataset consisting of
working and non working days Flowrates values. Using a complex SQL query we are generating the
correct dataset from the remote database and creating a list of data records objects containing all
necessary information.
Calling an R Script through our Web Service is achieved with the usage of R.NET library and a custom
installation of R Statistical Software in the same VM that our web application is hosted. The code that
initializes the instances, passes all dynamically generated variables and retrieves results is displayed
below.
Fuzzy cognitive maps
This algorithm is based on Fuzzy Cognitive Maps implementation of Real Coded Genetic Algorithm in
R statistical language for univariate time series prediction of water demand.
Inputs: PRV node, period start datetime for learning, cityid and username
This algorithm generates a predicted water demand value based in aggregated historical PRV
flowrate values. By using dynamic SQL queries we are retrieving all necessary flowrate values form
the tblDataTableWdsPRV table, then we are created list of flowrate values based on their datetime
stamp and finally we are creating normalized daily water demand values by aggregating for each day
the Flowrate/hour values to total water demand / day. These results are stored in a complex arraylist
of objects and are passed to the R script with the usage of R.Net library. The algorithm executes and

This project has received funding from the European Union’s Seventh Framework Programme for research, technological development and demonstration under grant agreement no [619228]
ISS-EWATUS FP7-ICT-2013-11 Page 37 of 77
calculates the predicted water demand value. This result is then disaggregated based on a time
profile in order to produce a flowrate profile. The method that is responsible for creating the
flowrate predicted profile based on a total water network demand
Based on the current and next day (for which we are generating the predicted total water demand
and predicted flowrate profiles) this function retrieves previous week flowrate values for a whole
day. These values are then assigned to weights based on their readings and the total daily water
network consumption. The result is a list of weights for each timestep which is then used for the time
disaggregation in order to create the flowrate profile based on these weights and the total predicted
network demand.
This algorithm is based on autoregressive integrated moving average timeseries model
implementation in R statistical language for univariate time series analysis.
Inputs: PRV node, period start datetime for learning, cityid and username
This algorithm generates a predicted water demand value based in aggregated historical PRV
flowrate values. By using dynamic SQL queries we are retrieving all necessary flowrate values form
the tblDataTableWdsPRV table, then we are created list of flowrate values based on their datetime
stamp and finally we are creating normalized daily water demand values by aggregating for each day
the Flowrate/hour values to total water demand / day. R.net library is initialized and all inputs
variables are dynamically passed to the script. Upon execution it uses the same time disaggregation
procedure that was described previously to generate a predicted flowrate profile from the predicted
total water network demand and return the serialized JSON result to user for rendering.
ANFIS
This is an algorithm implementation of Adaptive Neuro-Fuzzy Inference Systems (ANFIS) using Matlab
(Fig 4.28). The connection and execution of this script is achieved using Matlab .COM server toolkit
which is installed along with Matlab software on the Web application VM server.
Inputs: JSON serialized input data for learning and forecasting, configuration variables (such as
numfs, epochs and step size etc.), cityid and username.
When a user requests to run this algorithm he is displayed with a page that contains some basic steps
in order to produce the dataset which will be used as input in the Web Service method. In this page
user is displayed the latest database records that contain all necessary variables such as water
demand, meteorological data and arrivals. This module helps the user to complete steps 1 and 2
before proceeding in the execution of the algorithm. In these steps user must validate current days
readings and also input some predicted values for the next day's variables (Fig 4.7). These are
necessary for the execution of ANFIS script. Finally he enters a learning period and by pressing the
'Prepare Dataset' an AJAX post request is made to Preprocessing.asmx web method
GetPeriodValues1. This method generates and returns to the client a JSON serialized object of list
containing all datarecords from the remote database along with their real and normalized readings.

This project has received funding from the European Union’s Seventh Framework Programme for research, technological development and demonstration under grant agreement no [619228]
ISS-EWATUS FP7-ICT-2013-11 Page 38 of 77
Figure 4.7: Prepare dataset for ANFIS algorithm
When the system has finished with the generation of the dataset a new panel opens to the user. This
panel contains all available algorithm parameters that can be changed by the user in order to
calibrate the script. When everything is ready user can run the algorithm by pressing the
corresponding button. The previously stored javascript dataset variable along with the algorithm
parameters are passed in the AJAX post request to Algorithms Web service in order to initiate the
matlab enginee, create the dynamic generated variables and execute the script. The result of the
whole procedure is finally returned to the user.
FCM
This is a multivariete implemetation of Fuzzy Cognitive Maps based on genetic algorithms using
multistep learning genetic algorithm. This algorithm was implemented as a seperate / native library
project. Using latest technologies and object oriented programming this forecasting algorithm is
connected using native DLL files on code behind through the Web services layer.
Inputs: JSON serialized input data for learning and forecasting, configuration variables (such as
population learning size), cityid and username.
Similar to ANFIS algorithm the first step of running this algorithm is to validate current day's values
(Fig 4.31). Since the algorithms' implementation for the case of Skiathos takes as inputs multivariete
variables (such as water demand, mean temperature, high temperature, rain and touristic arrivals)
we must provide a correct dataset for the learning and forecasting data.
For the generation of the data we are calling GetPeriodValues2 web method from Preprocessing
Web service. This method takes as inputs the currently user validated variables and the period start
datetime to produce a JSON serialized list of data objects.

This project has received funding from the European Union’s Seventh Framework Programme for research, technological development and demonstration under grant agreement no [619228]
ISS-EWATUS FP7-ICT-2013-11 Page 39 of 77
Using a complex dynamically generated SQL query we are retrieving all database records from 3
separate tables that contain historical data for pumping station water demand, meteorological data
(mean temperature, high temperature and rain) and tourist arrivals. These records are assigned to
seperate class objects and are processed to an array list. When finished we are creating current day's
user validated readings to another class object and add it to the final list. This last object's readings
are basically used for the water demand prediction while all remaining for the learning procedure.
Having generated this list, then next step is to produce their corresponding normalized values and
finally return the whole list object in a JSON serialized format that can be used on the client side.
When the preparation of data is finished, a new page is dynamically displayed along with the
algorithms parameters. By running the algorithm we are passing previously generated dataset and
the code behind handles learning and prediction procedures based on the custom implemented
libraries.
Neural Networks forecasting model
This is a custom implementation of multivariate time series prediction with ANNs and Levenberg-
Marquardt Algorithm, developed as a native library for the needs of the DSS.
Inputs: JSON serialized input data for learning and forecasting, configuration variables (such as
number of iterations, step size and epoch size), cityid and username.
Based on the algorithm inputs and the multivariete implementation for the case of Skiathos user
must verify current days variables, enter some estimated variables for next day (which will be used
for prediction) and a learning period datetime start. Using similar procedures as described in the
above algorithm implementations, the DSS retrieves corresponding data records from multiple
records, and generates a list of objects containg real and normalized readings. This object is then
passed as input to NNalgorithm web method along with user's selected algorithm parameters and
the execution of the Neural Networks methods start.
4.1.8 Evolutionary Multi-objective Optimization algorithm
Water that can be pumped and used for urban water consumption can be groundwater, water stored
in a reservoir and Spring water. There are restrictions concerning the quantity of water that can be
exploited. Concerning a drilling, the pumped water cannot be that much, that the ground water level
is not able to recover to its original point. That can be controlled by comparing the time of the
operation the and the recovery time. Concerning the reservoir water and the Spring water, the
restrictions are set by the availability of each resource.
The first objective is the delivery of the requested water volume. The demand for the highest
possible quality of urban water, gives out the second objective, which is the minimization of
concentration of each pollutant. The third objective of the multi-objective optimization problem is
the minimization of operational costs. The considered scenario involves an arbitrary optimization
problem with k objectives, which are, without loss of generality, all to be maximized and all equally
important, i.e., no additional knowledge about the problem is available.

This project has received funding from the European Union’s Seventh Framework Programme for research, technological development and demonstration under grant agreement no [619228]
ISS-EWATUS FP7-ICT-2013-11 Page 40 of 77
Evolutionary algorithms are characterized by a population of solution candidates and the
reproduction process enables to combine existing solutions to generate new solutions. Finally,
natural selection determines which individuals of the current population participate in the new
population. Real-Coded Genetic Algorithm is the population-based algorithm selected to solve this
problem. An analytical description of the problem and proposed algorithm is given in Appendix D.
4.1.9 Handling water pressure alerts
This is the case where our implemented system gives the opportunity to resident/users to participate
by informing the competent authorities about failures of the water distribution network, leaks in
safety valves etc. With this functionality the water company authorities collect information about the
current state of the water distribution network real time. The system is implemented to raise an
alarm message to the manager that someone has inserted an alarm. Each alarm is attaching an
explanation or some notes of what it is about and also is followed by the user’s credentials as well as
the X,Y coordinates of the area that it refers to. The managers can respond by managing these alarms
accordingly to the action taken. Relevant messages/actions can be inserted in the system to inform
the current situation. When failures are fixed the status of the alarm changes accordingly. Everything
is kept in the records and the log of the system for managerial purposes.
Project’s files structure
The project’s files structure is the following. Each folder contains several files that are being used by
the application in order to work correctly. The most important folders are:
App_Code: This folder holds compiled C# classes objects which are mainly used along with
our Web Services to store raw data records into objects, serialize them, manipulate them or
display the data to users.
AdminPoland: This folder contains all GUI files (basically html documents) used by our web
application only to users that are qualified as Poland administrators.
AdminSkiathos: This folder contains all GUI files (basically html documents) used by our web
application only to users that are qualified as Skiathos administrators.
WebServices: This folder stores all necessary asmx (Active Server Method Files) web services.
These services were build using C# and basically serve all functionalities of our web
application since they contain methods and functions to communicate with remote
databases, retrieve data using complex SQL-Queries, create and display data objects, run
various algorithms etc.
js: Folder that contains JavaScript libraries and files
css: Folder that contains CSS documents that are responsible for the user interface of our
web pages
adminjs: Folder that contains JavaScript libraries used for the administrators' user interface.

This project has received funding from the European Union’s Seventh Framework Programme for research, technological development and demonstration under grant agreement no [619228]
ISS-EWATUS FP7-ICT-2013-11 Page 41 of 77
All basic settings are stored in the web.config file and define the connection strings for the remote
and local databases (along with authentication credentials), the targeted framework, the
authentications forms and memberships and also some 3rd party open-source library references.
4.2 Physical Architecture Overview
EWATUS DSS project consists of two main modules, the Web Application part (Basically the GUI and
all User Functionalities) and the Database module (the main storage for our DSS data). Each module
lies on a different server in order to achieve a highly modular and easy to maintain project.
EWATUS DSS WEB APPLICATION
Our web application runs on an IIS Virtual Machine that is deployed in a physical server under the
CERTH domain. The VM consists of the following properties:
Windows Server 2012 64bit with IIS
Microsoft SQL Server 2012 Express
Processor: Intel Xeon(R) E3 1220
Memory: 4GB
HDD: 500GB
IP: 194.177.202.235
EWATUS REMOTE DATABASE
Our web application data sources that contain all necessary values and structure (such as water
demands, geonodes, meteorological data etc.) runs on a IIS Virtual Machine that is deployed in a
physical server at Poland. The VM consists of the following properties:
Windows Server 2012 R2 64bit
Microsoft SQL Server 2014
Processor: Intel Xeon(R) E5 2630
Memory: 8GB
HDD: 350GB
IP: 2012.106.179.159

This project has received funding from the European Union’s Seventh Framework Programme for research, technological development and demonstration under grant agreement no [619228]
ISS-EWATUS FP7-ICT-2013-11 Page 42 of 77
5 Implementation Details
A Web-based DSS is a complex software system that integrates multidisciplinary data sources and
related tools generally developed in different and sometimes diverse programming languages in
order to generate value-added information to support decision-making. The experience from the
development of previous decision support systems showed that there are three major development
methods:
System Development Life Cycle (SDLC),
Rapid Prototyping (RP), and
End-User Development (EUD).
All of them, especially the SDLC and RP, usually use informal box-and-line descriptions to clarify the
architecture of a DSS. Such methods bring an informal and ambiguous architecture specification to
system analysis. In contrast to those traditional design methods, the idea is to use a hierarchical
design method for a Web-based DSS. To achieve however this design we must provide interface
descriptions and formal specifications for components and connectors in a Web-based DSS. In this
way the layers in the hierarchy can accommodate any kind of information and they will not be
bounded to water related information or web services that communicate this information. Thus this
kind of web-based DSS design can allow also the organization of multidisciplinary data and related
tools.
Like traditional software design methods, most of today’s DSS design methods use informal box-and
line descriptions that lead to a number of problems. Firstly, the box-and-line diagrams do not provide
open access points for the architecture elements and secondly the diagrams cannot be formally
analyzed for consistency, completeness, or correctness. To specify the architecture of a software
system, we create connectors in our DSS as diagram 1.2 illustrates.
The system described above uses RESTful interoperable web services based on hydrological
procedures which perform the connection between different involved systems. When needed the
SOS 2.0 web services which are OGC certified are used in transferring data from the proprietary
hardware monitor software (namely PMAC) to the spatiotemporal database. After all data is
gathered, we use a customized Entity-Relationship model for the spatiotemporal database in such a
way that all the hydrological information depends on the concepts defined in the presentation layer
of the website. This approach uses the OGC® stack and the WaterML2.
Even though the system is developed mostly for the web based application in HTML and in Javascript
programming language we used the Microsoft's ASP.NET Framework as the base layer for the
following reasons:
The host server resides on a virtual Windows Server 2012 therefore is Internet Information
Services (IIS-host). The communication between the host and the Microsoft AS.NET
Framework environment is more stable for the above reason

This project has received funding from the European Union’s Seventh Framework Programme for research, technological development and demonstration under grant agreement no [619228]
ISS-EWATUS FP7-ICT-2013-11 Page 43 of 77
The development of web services was done using the C# programming language for security
reasons. Since the database environment of the spatiotemporal model is Microsoft SQL-
Server, it is much easier to program in a language that is used predominately for that.
Using this framework we were able to use several technologies and modules needed for the
project's functional requirements and make them work in the same environment, having
complete water DSS web application at urban level.
5.1 Data Transmission
In our system we had to deal with data transmission from the spatiotemporal database in the
following 3 use cases: (a) the transmission of the flow rate data, (b) the transmission of water
pressure data, and (c) the transmission of the consumer consumption (billed) data. We elaborate for
each one of the cases.
Transmission of the flow rate data. For this case we made two separate web services in order
to distinguish data about the flowmeters/hydrometers which are based on the billings and
the data coming from the main water distribution network devices such as Cellos, Regulos
and the inlet and outlet water pressure after the pressure regulation valve.
Transmission of water pressure data. Similarly to the previous web service we have
implemented a web service to take care of storing and transmitting the water pressure data
to and from the spatiotemporal database. The web service has the name WDSP and basically
contains two main calls namely GetPRVAllData and GetPRVAllDataAverage that they
perform the following:
o GetPRVAllData: Get all available readings (Flowrate, Outlet, Inlet) data for a
specific PRV device, based on a time period.
Inputs: Geonode Id, Period Start, Period End
Outputs: A JSON serialized List of PRVData C# class objects
o GetPRVAllDataAverage: Calculates all available average daily readings (Flowrate,
Outlet, Inlet) for a specific PRV device, based on a time period.
Inputs: Geonode Id, Period Start, Period End
Outputs: A JSON serialized List of PRVData C# class objects
Transmission of the consumer consumption data. This service has to deal with the billing
data. For the case of Sosnowiec we have two readings per hydrometers per month. However
for the case of Skiathos we have only one reading per trimester. This differentiates the
treatment of data as to reads and writes relatively to the web service that performs the
transmission. Additionally, we are forced to perform different time scale disaggregation
procedures for the two pilot cities for the pre-processing of the water demand inputs to the
EPANET.
This project has received funding from the European Union’s Seventh Framework Programme for research, technological development and demonstration under grant agreement no [619228]
ISS-EWATUS FP7-ICT-2013-11 Page 44 of 77
5.2 Geoserver
GeoServer is an open source server for sharing geospatial data. Designed for interoperability, it
publishes data from any major spatial data source using open standards. In order to render and
display necessary shape files from cities' water networks an instance of GeoServer was installed in
the same VM the Web application is deployed. The version we used is the latest stable software
version 2.7.1.1
The server was installed to automatically run as a network service by using the port 9090. After
installation we created separated Work Spaces for each city's network. By using some administrator
provided shape files we initiated separate data store objects based on provided EPSG systems and
created WMS (Web Map Service) modules containing tiled layers with shape file objects information,
ready to be consumed in our web application.
Through the WMS we specify a number of different request types, two of which are required by the
WMS server:
GetCapabilities - returns parameters about the WMS (such as map image format and WMS
version compatibility) and the available layers (map bounding box, coordinate reference
systems, URI of the data and whether the layer is mostly opaque or not)
GetMap - returns a map image. Parameters include: width and height of the map, coordinate
reference system, rendering style, image format
Apart from the two basic request types above, other request types may also include:
GetFeatureInfo - if a layer is marked as “queryable” then you can request data about a
coordinate of the map image.
DescribeLayer - returns the feature types of the specified layer or layers, which can be
further described using the requests.
GetLegendGraphic - returns an image of the map's legend image, giving a visual guide to map
elements.
Furthermore we must note that all the above types of requests which are needed for our application
are fully serviced by the installed GeoServer. GeoServer is an open-source server which written
in Java and even if the programming language is different than the one we are using, it allows us to
share, process and edit geospatial data. This server is really designed to accommodate all the
interoperability issues we face for the transmission of data from the spatiotemporal database and it
is able to publish data from any major spatial data source using open standards. GeoServer has
evolved to become an easy method of connecting existing to web-based maps such as Open-Layers
used for the maps in Skiathos.
The OGC web map service specification defines an HTTP interface for requesting georeferenced map
images from the GeoServer. GeoServer supports the WMS 1.1.1 protocol/version, the most widely
used version of WMS, as well as the WMS 1.3.0. On the other hand, WMS provides a standard
interface for requesting a geospatial map image. The benefit of this is that, WMS clients can request
images from multiple WMS servers, and then combine them into a single view for the user. The

This project has received funding from the European Union’s Seventh Framework Programme for research, technological development and demonstration under grant agreement no [619228]
ISS-EWATUS FP7-ICT-2013-11 Page 45 of 77
standard guarantees that, these images can all be overlaid on one another as they actually would be
in reality.
6 Testing
6.1 Introduction to Web Application Testing
Testing is one of the most important phases in the software life cycle and in software’s growth. It is
the best tool both professional and practical to uncover the precision, correctness, fault tolerance,
robustness and all the other major characteristics that constitute a good quality software product.
Otherwise said, testing leverages the internet computing environments and looks for to imitate real
world user visitors for this Web site testing procedure (Kaur et al., 2012; RadhikaBatra, 2014).
The testing for web applications is employed to check the correctness of web based attributes within
the web; for instance, how the computer software, hardware, network infrastructure and any other
component can perform the tests set for the check. Web testing aims to make certain the quality of
web-based applications which are called to verify and confirm the services as well as to check the
web support and interactions within the applications in a web structure (Vanitha and Alagarsamy,
2012; Mohsenzadeh, 2013).
Testing needed steps of software progression. In web based software testing procedure, the primary
phase test requests are ready by the user and they are delivered to the web-based testing system, so
they are obtained by the system when they are agreeing to. In the next phase all check-jobs are
organized and dispatched, the software services are offered for checking specific tasks, fundamental
sources are consented and test tasks are carried out and also guided. Within the last step, the results
of the tests and analytics are gathered and they are provided to users and to developers in order to
utilize the web interface (RadhikaBatra, 2014).
6.2 Steps to web application testing
The vast majority of the web sites and the web applications are essentially client/server
applications where the web servers perform services to the clients which act as browsers.
Consideration should be given to the interactions between html pages, TCP/IP communications,
Internet connections, firewalls, applications that run in web pages (such as applets, javascript, plug-in
applications), and applications that run on the server side (such as scripts, database interfaces,
logging applications, dynamic page generators, active server pages, etc.). Base on the previous
comments we must also say that, there is a wide variety of servers and browsers, and also within the
same browser there are different versions with small but sometimes significant differences between
them. Thus the testing process of web application due to the aforementioned complexity can
become a major ongoing effort.

This project has received funding from the European Union’s Seventh Framework Programme for research, technological development and demonstration under grant agreement no [619228]
ISS-EWATUS FP7-ICT-2013-11 Page 46 of 77
Before we set up all the steps in order to illustrate the whole testing process we must refer to all the
major considerations before to actually start testing any of the procedures or the services of the web
application. These considerations include the following:
What is the maximum possible number of hits that we might experience on the server at the
unit of time?
Considering the above hit counts and the loads that we will experience, what kind of
performance is required from the server point of view to respond to these loads, i.e. what
should be the appropriate server server response time? Especially for the web services that
deal with the database querying and additionally with the fact that these services “talk” to a
repote database, what are going to be the database query response times in order the user
not to experience any lag?
Do we need a set of special tools for web loads or maybe web robot downloading tools in
order to test the downloading and the uploading performance of the server?
Who is the target audience?
What kind of browsers will they be using?
What kind of connection speeds will these browsers above be using?
Are they intra- organization (thus with likely high connection speeds and similar browsers) or
Internet-wide (thus with a wide variety of connection speeds and browser types)?
What kind of performance is expected on the client side (e.g., how fast should pages appear,
how fast should animations, applets, etc. load and run)?
Will down time for server and content maintenance/upgrades be allowed? If yes how this
will affect the whole system and the decision making process? How much time will be
needed as “down-time” for the server to finish the maintenance?
What kinds of security (firewalls, encryptions, passwords, etc.) will be required and what is it
expected to do? How can it be tested?
How reliable are the site’s connections to the internet are and what is required at least by
the competent authorities that run the decision support syste? How these connections affect
the system at the time of invremental or scheduled backups?
What processes will be required to manage updates to the web site’s content?
What are the requirements for maintaining, tracking, and controlling page content, graphics,
links, etc.?

This project has received funding from the European Union’s Seventh Framework Programme for research, technological development and demonstration under grant agreement no [619228]
ISS-EWATUS FP7-ICT-2013-11 Page 47 of 77
Which HTML specification will be adhered to? What variations will be allowed for targeted
browsers?
Will there be any standards or requirements for page appearance and/or graphics
throughout a site or parts of a site?
How will internal and external links be validated and updated? How often?
Can testing be done on the production system, or will a separate test system be required?
How are browser caching, variations in browser option settings, dial-up connection
variabilities, and real-world internet ‘traffic congestion’ problems to be accounted for in
testing?
Having in mind the above considerations we set the categories of testing which are:
Functionality Testing
Usability testing
Interface testing
Compatibility testing
Performance testing
Thus the rest of the subsections in this chapter refer to each one of the categories of testing.
6.3 Functionality Testing
In the functionality testing we have to do the checks that are related to links in other web pages
(both internal and external), the checks that are related to database connections (especially when
the databases are remote), the checks to the forms used in the web pages for submitting or getting
information from user and their validation, and finally to do the cookie testing.
6.3.4 Checking of the external and internal links
Relatively to the checking of links we performed the following tests:
We checked the correcteness of the outgoing links from all the pages from specific domain under test.
We checked the correcteness of all the internal links.
We checked the correcteness of the links that are jumping on the same page.
We tested the links used to send alarms to the administrator from other users and from other web pages.
We checked if there are any orphan pages.

This project has received funding from the European Union’s Seventh Framework Programme for research, technological development and demonstration under grant agreement no [619228]
ISS-EWATUS FP7-ICT-2013-11 Page 48 of 77
We checked the case of broken links.
6.3.5 Checking of forms
Forms are the integral part of any web site. Forms are used to get information from users and to
keep interaction with them. The following issues must be checked when we deal with web pages that
contain forms
First checking all the validations on each field.
Checking for the default values of fields.
Wrong inputs to the fields in the forms and how the system will behave on any kind of values that are put in.
In a purely dynamic system check the options to create forms if any, delete forms, view or modify the forms.
6.3.6 Cookies testing
Cookies are small files stored on the user machine when we use the web application via the browser.
These are basically used to maintain the session of the usage, mainly the login sessions is the issue
we deal here. We did the appropriate testing of the application by enabling or disabling the cookies
in our browser options. The system behaved appropriately. We also tested the encryption
mechanism of the cookies before writing them to user machine. We also checked the session cookies
(i.e. the cookies which must expire after the session is closed) so basically, we checked for the login
sessions and the user stats after the session ended. We finally tested the effect on the application
security by deleting the cookies and the system behaved appropriately.
6.3.7 Validation of the HTML/CSS and database testing
The testing for validation of HTML/CSS is very important when we optimize our site for Search
engines. In our case scenario this is not the issue since the system is rather a closed system from the
point of view that the water company experts only need to know the URL and the correct procedure
to reach it.
From the other hand of the residents of the pilot cities using the system this is also covered since
there will be an anchor from the social network portal where the resident users mainly will use. Thus
a typical check was done towards this aspect with just validating the site for HTML syntax errors.
Another major check needs to be done here which is to test if the site is crawlable to different search
engines but as we mentioned before this is usually done for public sites and not for web applications
that refer to only a few people.

This project has received funding from the European Union’s Seventh Framework Programme for research, technological development and demonstration under grant agreement no [619228]
ISS-EWATUS FP7-ICT-2013-11 Page 49 of 77
Also relatively to the database testing we must say that data consistency is very important in our web
application. For that reason we did the testing that refers to the data integrity and errors while we
edit, delete, modify the forms or do any DB related functionality. More specifically, we checked if all
the database queries are executing correctly, data is retrieved correctly and also updated correctly.
6.4 Usability testing
The usability testing is the best way to understand how real users experience the website or the web
application. Here we are lloking for a well-designed user test from which we can measure actual
performance on the most important and mission-critical tasks. If the user cannot figure out how to
complete for example a whole prediction process relating to water pressure of the next day in a pilot
city, but on the other hand he/she likes a lot the web application then we have a major problem.
Thus the usability test refers to how well the users can perform according to how the web site was
designed and coded to function relatively to specific tasks. That is, usability testing is a technique
used in user-centered interaction design to evaluate a product by testing it on users. This can be seen
as an irreplaceable usability practice, since it gives direct input on how real users use the system.
Even though we are at a preliminary phase of releasing the system to the competent authorities for
the ultimate test we initially tested the system in a small group of users in the University of Thessaly.
This group was mostly formed by students of various prior experiences with computers web
applications.
When we conducted the user testing, one of the developers read to the participants (7 people) one
task at a time “Find and show on the screen the water meter in Skiathos wof some specific ID and
show all thw consumptions of this water meter that are stored in the system”. To prevent bias, the
developer followed the same “script” when explaining the task to each participant. The results were
mostly excellent in almost all the scripts which mean that the design of the web application indicates
a system which is user friendly and easy to use. The specific tests examined were the following:
6.4.4 Test for navigation
Navigation means how the user surfs the web pages, how he/she uses different controls like buttons,
boxes or how he/she uses the links on the pages to surf different pages. Usability testing includes:
Web site should be easy to use. Instructions should be provided clearly. Check if the provided
instructions are correct means whether they satisfy purpose. Main menu should be provided on each
page. It should be consistent.
6.4.5 Content checking
The content has been checked and it is proved logical and easy to understand. We also checked for
spelling errors. We have not used any dark colors in the presentation of the web application since the
dark colors have been proved that they annoy the users. We have followed some standards that are
used for web page and content building. These are commonly accepted standards and they are the
following:

This project has received funding from the European Union’s Seventh Framework Programme for research, technological development and demonstration under grant agreement no [619228]
ISS-EWATUS FP7-ICT-2013-11 Page 50 of 77
Content should be meaningful.
All the anchor text links should be working properly.
Images should be placed properly with proper sizes.
6.5 Interface Testing
The main interfaces are the web server and the application server along with the database server
interface. Relatively to those we checked all the interactions between these servers and they proved
to be executed properly. Errors are handled properly. If database or web server returns any error
message for any query by application server then application server catches and displays these error
messages appropriately to users.
6.6 Compatibility Testing
Compatibility of any web site or any web application in general is a very important testing aspect. For
that reason the compatibility test we executed were the following:
Browser compatibility
Operating system compatibility
Mobile browsing
Printing options
Browser compatibility: this is one of the most influencing types of web site testing. Some
applications are very dependent on browsers. Different browsers have different configurations and
settings that the web application should be compatible with. We have checked that the web
application coding is cross browser platform compatible. We have checked the correct running of the
web application with all the major web browsers (Internet Explorer, Chrome, and Mozilla).
OS compatibility: this test is to check if some functionality of the web application may not be
compatible with all operating systems. We have not excausted this type of checking due to limited
resources relatively to hardware, but the fact that almost the entire functionality is written in
JavaScript makes us confidentent that there will not be any issues of this category.
Mobile browsing: This is not one of the requirements for this deliverable. However the web
application runs on all the major mobile Operating Systems.
Printing options: Because we have given page-printing options in several cases of the system we
made sure that we used printable fonts and the appropriate page alignment and the graphics are
getting printed properly.
This project has received funding from the European Union’s Seventh Framework Programme for research, technological development and demonstration under grant agreement no [619228]
ISS-EWATUS FP7-ICT-2013-11 Page 51 of 77
6.7 Performance Testing
Web application should sustain to heavy load. Web performance testing must include the following
two types of testing:
Web Load Testing and
Web Stress Testing
Web load testing: The first thing we did towards this aspect was to test the application performance
on different internet connection speeds. In the case web load testing, we have to check the
performance of the system when many users are accessing or requesting the same page. However,
there is no reason to do such testing because the maximum number of simultaneous users will
exceed the number of 10 at any case scenario. We know that in the case scenario that more pilot
cities will be included then such a test needs to be performed. However, there is a performance peek
that always has to be kept in mind and this is due to the remote database connection and the remote
execution of the queries. The way the spatiotemporal database was designed does not give us any
other choise but to accept this type of latency.
Stress testing: Generally stress means stretching the system beyond its specification limits. Web
stress testing is performed to break the site by giving stress and checked how the system reacts to
stress and how the system recovers from crashes. However, there is no reason to do such testing
because the maximum number of simultaneous users is limited.

This project has received funding from the European Union’s Seventh Framework Programme for research, technological development and demonstration under grant agreement no [619228]
ISS-EWATUS FP7-ICT-2013-11 Page 52 of 77
7 Bibliography
1. J.C. Henderson, J.G. Cooprider. Dimensions of I/S planning and design aids: a functional model of CASE technology
Information Systems Research, 1 (3) (1990), pp. 227–254
2. RadhikaBatra, Naveen Sharma, “Cloud Testing: A Review Article,” International Journal of Computer Science and
Mobile Computing, Vol.3 Issue.6, June- 2014, pg. 314-319.
3. Amandeep Kaur, Navjeet Singh, Dr. Gurdev Singh, “An overview of cloud testing as a service,” International Journal
of Computers & Technology, Volume2No.2, April 2012.
4. Vanitha Katherine, K Alagarsamy, “Software Testing in Cloud Platform: A Survey,” International Journal of computer
applications, Vol.46, Issue 6, pp.21-24, IJCA, May 2012.
5. Ali Mohsenzadeh, “Cloud Computing Testing Evaluation,” IJCEM International Journal of Computational Engineering
& Management, Vol. 16 Issue 6, November 2013.

This project has received funding from the European Union’s Seventh Framework Programme for research, technological development and demonstration under grant agreement no [619228]
ISS-EWATUS FP7-ICT-2013-11 Page 53 of 77
5 Appendix A – Applied Software Libraries
The main software parts and components of our tool are:
ASP.NET – The base software architecture that we used to build our web application and to
manage the users and their authentication into the system.
Microsoft SQL SERVER - We used the MSSQL 2014 for the creation and management of our
system's databases that holds our DB system structure and all our data. Note that even
though there is a major database part of the integrated system which is the spatiotemporal
database, here we refer to the local database that works tightly with the IIS host where the
DSS resides. This database helps to keep data locally whenever it is needed and mostly to
keep temporarily all intermediate data that have been produced in the midst of some
calculation and will be used in the future as input but for the spatiotemporal database and
model they are not needed. Note that the version of the database server is different than the
version of the database server of the spatiotemporal model. This is not a problem because
there is absolute compatibility between the two versions
GeoServer - With the usage of GeoServer we are able to create WMS layers for shape files
and display them to users in our web application maps. More specifically, the Web Map
Service Interface Standard (WMS) provides a simple way to request and serve geo-registered
map images. During pan and zoom operations, WMS requests generate map images through
a variety of raster rendering processes. Such image manipulation is generally called re-
sampling, interpolation, or down-sampling. GeoServer supports three resampling methods
that determine how cell values of a raster are outputted. These sampling methods are the
Nearest Neighbor, the Bilinear Interpolation and the Bicubic methods and they are all
available on the default Interpolation menu.
Web Services - The main part of our DSS is in this module. By creating and consuming online
web services we were able to handle the majority of functionalities that we needed and also
create a communication module with our Databases. These are nothing else but a set of
modules that perform a specific task but the result of the task i.e. the outcome is
communicated through the web via the http protocol. This protocol was originally designed
for human-to-machine communication, is utilized for machine-to-machine communication,
more specifically for transferring machine readable file formats such as the XML and the
JSON. In our case we use the JSON. Thus in practice the web service typically provides an
object oriented interface to a database server, utilized for example by another web server,
like in our case where the host application is the DSS web application and the data is stored
in the spatiotemporal database. Basically our integrated system is offered to the end user as
a mushup where the web server consumes several web services at different machines, and
compiles the content into one user interface.
Open-Layers – Open-Layers API is an open JavaScript API that we use in order to load, display
and render maps on our Web Application. The following diagram shows all the possible

This project has received funding from the European Union’s Seventh Framework Programme for research, technological development and demonstration under grant agreement no [619228]
ISS-EWATUS FP7-ICT-2013-11 Page 54 of 77
connections that can be done through the Open-Layers API and how it communicates and
complies with the OGC principles.
Figure A.1: The set of connections and the protocols that the Open-Layers API can support.
EPANET – EPANET is the most popular water distribution modelling toolkit for running
hydraulic simulations. EPANET provides an integrated environment for editing network input
data, running hydraulic and water quality simulations, and viewing the results in a variety of
formats. EPANET provides a fully equipped and extended period of hydraulic analysis that
can handle systems of any size. The package also supports the simulation of spatially and
temporally varying water demand, constant or variable speed pumps, and the minor head
losses for bends and fittings. The modeling provides information such as flows in pipes,
pressures at junctions, propagation of a contaminant, chlorine concentration, water age, and
even alternative scenario analysis. This helps to compute pumping energy and cost and then
model various types of valves, including shutoffs, check pressure regulating and flow control.
Also EPANET’s water quality modeling functionality allows users to analyze the movement of
a reactive or non-reactive tracer material which spreads through the network over time. It
rates the reactive material as is grows, tracks the percentage of flow from the given nodes.
The package employs the global reaction rate coefficient which can be modified on a pipe-
by-pipe basis. The storage tanks can be modeled as complete mix, plug flow or two-
compartment reactors.

This project has received funding from the European Union’s Seventh Framework Programme for research, technological development and demonstration under grant agreement no [619228]
ISS-EWATUS FP7-ICT-2013-11 Page 55 of 77
Other tools - Along with the above tools we also used a variety of libraries and technologies,
in order to achieve the requirements for the project functionalities. These technologies
include:
o AJAX (Asynchronous JavaScript and XML). AJAX is a set of web
development techniques using many web technologies on the client-side to create
asynchronous web applications. With Ajax, web applications can send data to and
retrieve from a server asynchronously (in the background) without interfering with
the display and behavior of the existing page. By decoupling the data interchange
layer from the presentation layer, Ajax allows for web pages, and by extension web
applications, to change content dynamically without the need to reload the entire
page. Despite the name, the use of XML is not required (JSON is often used in the
AJAJ variant), and the requests do not need to be asynchronous. This is the case for
our web application.
o LINQ (Language Integrated Query). LINQ is a Microsoft .NET Framework component
that adds native data querying capabilities to .NET languages but it has also been
expanded to support Java, PHP, JavaScript and ActionScript. LINQ extends the
language by the addition of query expressions, which are akin to SQL statements,
and can be used to conveniently extract and process data from arrays, enumerable
classes, XML, JSON, documents, relational databases in general and third-party data
sources. Other uses, which utilize query expressions as a general framework for
readably composing arbitrary computations, include the construction of event
handlers or monadic parsers. LINQ also defines a set of method names
(called standard query operators, or standard sequence operators), along with
translation rules used by the compiler to translate fluent-style query expressions into
expressions using these method names, lambda expressions and anonymous types.
o HighCharts. Highcharts is a charting library written in pure JavaScript, offering an
easy way of adding interactive charts to any web site or web
application. Highcharts currently supports line, spline, area, areaspline, column, bar,
pie and scatter chart types therefore it covers all the possible charts that are
generated in our application.
o ClosedXML (.NET library for the creation of various type files like EXCEL documents).
Since there is a need to provide reports and most of these reports contain numeric
values, this is one of the most useful functionalities in our system. However, at the
same time this is one of the reasons why we had to use the .NET framework and the
base of implementing the web application to be the ASP.NET.
o NewtonSoft (.NET library to handle JSON objects), is an open source library that
contains a Flexible JSON serializer for converting between .NET objects and JSON
LINQ to JSON for manually reading and writing JSON. The main reason why we used

This project has received funding from the European Union’s Seventh Framework Programme for research, technological development and demonstration under grant agreement no [619228]
ISS-EWATUS FP7-ICT-2013-11 Page 56 of 77
this library is that it is the one with the highest performance in building JSON objects,
it is indented and easy-to-read JSON and also very useful for converting JSON to and
from XML. Hence it is the best choice especially when we are reading or writing maps
closely to a .NET class. Furthermore, there is a very easy to code connection between
the LINQ and JSON through NewtonSoft which is good for situations where you we
are only interested in getting values from JSON, and we don't have a special class to
serialize or deserialize to, or the JSON is radically different from the class we have
composed and in this case we need to manually read and write from our objects.
o R.NET (an implementation of a .NET library that acts as a communication gateway
between .NET and R statistical Language). More specifically R.NET is an in-process
interoperability bridge to R from the .NET Framework. R.NET requires .NET
Framework 4 and the native R DLLs installed with the R environment. R.NET works on
Windows, Linux and Mac-OS. We use this library because a great amount of the
forecasting algorithms are implemented in the R-statistical programming language.
Therefore this .NET library works as the mediator between our web application and
the R-language (environment and compiler) which needs to be installed into the
physical server or the virtual server of where the host application is also installed.
We can retrieve a single R-Engine object instance, after setting the necessary
environmental variables. More specifically, the call Set Environment
Variables, on Windows/Linux/Mac-OS, looks at the Registry settings set up by the
R installer. On Linux/Mac-OS, the path to libR.so (for Linux) must be in the
environment variable LD_LIBRARY_PATH before the process start, otherwise the
R.NET engine will not properly initialize. While we may evaluate function calls by
generating a string and call the Evaluate method, this can be unwieldy for cases
where we pass large amounts of data. The following demonstrates how we call a
function, reflectively in .NET.
// Invoking functions; Previously you may have needed custom
// function definitions
var myFunc = engine.Evaluate("function(x, y) { expand.grid(x=x, y=y) }").AsFunction();
var v1 = engine.CreateIntegerVector(new[] { 1, 2, 3 });
var v2 = engine.CreateCharacterVector(new[] { "a", "b", "c" });
var df = myFunc.Invoke(new SymbolicExpression[] { v1, v2 }).AsDataFrame();
Figure A.2: Example of how to invoke in our application R-functions.
o MATLAB. We have to use also a web application to MATLAB bridge because the
same reason exists like R for a great amount of forecasting algorithms being
implemented in MATLAB. We must note that MATLAB is a powerful scientific tool for
math manipulation, specifically matrix manipulations, with its own scripting
language, where files are .M files. Usually it's used as a standalone program, but can
be integrated in two ways using other languages like Java, C and FORTRAN. With the
first usage, we declare a new function or component in a native language that

This project has received funding from the European Union’s Seventh Framework Programme for research, technological development and demonstration under grant agreement no [619228]
ISS-EWATUS FP7-ICT-2013-11 Page 57 of 77
extends the functionalities of MATLAB, usually to improve the execution speed. This
approach uses the MEX system. The second approach uses MATLAB functionalities
from an external program, this time a program in the .NET framework. In this
schema, the Java language has a special role because, from the version R12 and
afterwards MATLAB is Java-based (specifically for the multiplatform GUI
functionalities) and you can easily use Java classes in both ways. To use MATLAB
from an external program, there are three possible solutions:
low level C API
DDE
COM
Finally we must say that ISS-EWATUS DSS is a web application that runs on a virtual Machine (VM)
that was deployed in a dedicated physical server at the CERTH domain, while the Databases run on a
SQL Server VM in a dedicated server in Poland.
GEOSERVER
GeoServer is an open source server for sharing geospatial data. Designed for interoperability, it
publishes data from any major spatial data source using open standards. In order to render and
display necessary shape files from cities' water networks an instance of GeoServer was installed in
the same VM the Web application is deployed. The version we used is the latest stable software
version 2.7.1.1
The server was installed to automatically run as a network service by using the port 9090. After
installation we created separated Work Spaces for each city's network. By using some administrator
provided shape files we initiated separate data store objects based on provided EPSG systems and
created WMS (Web Map Service) modules containing tiled layers with shape file objects information
(Figure A.4), ready to be consumed in our web application.
The consumption and rendering of a WMS service is displayed in Figure A.3. With the usage of the
appropriate URL we are calling the GeoServer WMS module which renders and displays on top of an
Open-Layers map the corresponding shape object layers by re-projecting the shape EPSG based on
the current map coordinate system.

This project has received funding from the European Union’s Seventh Framework Programme for research, technological development and demonstration under grant agreement no [619228]
ISS-EWATUS FP7-ICT-2013-11 Page 58 of 77
Figure A.3: GeoServer Layers
Figure A.4: WMS layer preview for the water network of Skiathos
OPEN-LAYERS
Open-Layers is an open source JavaScript library for displaying map data in web browsers. It provides
an API for building rich web-based geographic applications similar to Google Maps and Bing Maps.
This project has received funding from the European Union’s Seventh Framework Programme for research, technological development and demonstration under grant agreement no [619228]
ISS-EWATUS FP7-ICT-2013-11 Page 59 of 77
For the developed of EWATUS DSS application we incorporated OpenLayers Version 3 API as the
module the render and display all geographical requirements.
The current implementation of Open-Layers module uses the default Web Mercator projection
(EPSG:3857) which is the same projection used e.g. for the maps of the OpenStreetMap-project and
commercial products such as Bing Maps or Google Maps. In order to achieve this we used a custom
developed module and some auxiliary Open-Layers tools and 3rd party libraries to reproject and bind
all geographical elements under the same map.
PROJ4JS
Proj4js is an open source JavaScript library to transform point coordinates from one coordinate
system to another, including datum transformations.
TURFJS
Open source JavaScript library for advanced geospatial analysis and nodes manipulation
6 Appendix B – Public Web Services
We present and describe the basic web methods that each web service contains, their purpose and
how they can be consumed.
ServiceGeoNodes.asmx
* Web service for GeoNodes Database objects and records management.
GetAllGeoNodesCity: Retrieve all GeoNodes for a specific city
o Inputs: City Id
o Outputs: A JSON serialized list of Geonodes arrays
GetAllGeoNodes: Get all nodes for a specific city and specific geonode type (1=watermeters,
3=cellos, 7=pumping station, 8=prv, 10=critical points)
o Inputs: City Id, Geonode Type
o Outputs: A JSON serialized list of Geonodes C# class objects
GetGeoNodeByID: Get all information for a specific Geographical Node
o Inputs: Geonode Id
o Outputs: A JSON serialized Geonode C# class Object
GetGeonodeTypes: Get all available geonode types

This project has received funding from the European Union’s Seventh Framework Programme for research, technological development and demonstration under grant agreement no [619228]
ISS-EWATUS FP7-ICT-2013-11 Page 60 of 77
o Inputs: No input needed
o Outputs: Returns a JSON serialized list of GeoNodeType C# class objects
CreateGeoNode: Creates a new geonode record along with its corresponding information for
the city of Skiathos
o Inputs: User, city id, type, familyid, pmacid, skiathosid, address, ipaddress, routerip,
latitude, longitude, X, Y, elevation, parentid
o Outputs: A message indicating if the procedure was sucessfull.
CreateGeoNode2: Creates a new geonode record along with its corresponding information
for the city of Poland
o Inputs: User, city id, geonode type, familyid, pmacid, polandid, address, ipaddress,
routerip, latitude, longitude, X, Y, elevation, parentid
o Outputs: A message indicating if the procedure was sucessfull
DeleteGeoNode: Deletes a Geonode from the database
o Inputs: Node Id, User, City Id
o Outputs: A message indicating if the procedure was sucessfull
addevent: Creates a new log event stored in the database, based on user interaction
o Inputs: User, city id, event, type, result
o Outputs: A message indicating if the procedure was sucessfull
SystemGetResults.asmx
* Web service for System Log Events
ViewSystemLog: Retrieve all log events for a specific city
o Inputs: City Id
o Outputs: A JSON serialized List of database records arrays
ServiceLandzones.asmx
* Web service for Landzones management
CreateZone: Creates a new Landzone database object using the GUI of Open Layers and our
web application
o Inputs: User, city id, area code, area name, description, shape, epanet node, EPSG
type
o Outputs: A message indicating if the procedure was sucessfull
CreateZone2: Creates a new Landzone database object by entering raw data inputs
o Inputs: User, city id, area code, area name, description, shape, epanet node, EPSG
type
o Outputs: A message indicating if the procedure was sucessfull
GetUserZones: Get all landzones created from a specific user
o Inputs: User
o Outputs: A JSON serialized List of Landzones as String Array

This project has received funding from the European Union’s Seventh Framework Programme for research, technological development and demonstration under grant agreement no [619228]
ISS-EWATUS FP7-ICT-2013-11 Page 61 of 77
GetCityZones: Get all available landzones for a specific city
o Inputs: City Id
o Outputs: A JSON serialized List of Landzones as String Array
GetZoneById: Get all data information for a specific landzone identifier
o Inputs: Landzone Id
o Outputs: A JSON serialized Landzone C# class object
GetAllZonesCity: Get all available landzones for a specific city
o Inputs: City Id
o Outputs: A JSON serialized list of Landzone C# class objects
DeleteUserZone: Removes the selected landzone (that the same user has previously created)
from the database
o Inputs: Landzone Id, User, City Id
o Outputs: A message indicating if the procedure was sucessfull
addevent: Creates a new log event stored in the database, based on user interaction
o Inputs: User, city id, event, type, result
o Outputs: A message indicating if the procedure was sucessfull
ServiceWDSFlowmeters.asmx
* Web service for watermeters (geonodes of type=1) and landzone readings / water consumption
GetFlowmetersData: Get water consumption data for a specific watermeter device (located
in Skiathos), based on a time period. In Skiathos we have readings every 3months.
o Inputs: Geonode Id, Period Start, Period End
o Outputs: A JSON serialized List of FlowmeterData C# class objects
GetFlowmetersDataPoland: Get water consumption data for a specific watermeter device
(located in Poland), based on a time period. In Poland we have readings every 1 month.
o Inputs: Geonode Id, Period Start, Period End
o Outputs: A JSON serialized List of FlowmeterData_Poland C# class objects
GetFlowmetersDataLandzone: Calculate the total water consumption of all watermeters
located in a specific landzone, based on a time period.
o Inputs: Landzone Geonodes' Ids, Period Start, Period End
o Outputs: A JSON serialized List of FlowmeterData C# class objects
ServiceWDSIntakes.asmx
* Web service for critical points (geonodes of type=10) available readings such as FlowRate, Volume
and Pressure
GetIntakesAllData: Get all available readings (Flowrate, Volume, Pressure) data for a specific
intake device, based on a time period.
o Inputs: Geonode Id, Period Start, Period End
o Outputs: A JSON serialized List of IntakeData C# class objects
GetIntakesAllDataAverage: Calculates all available average daily readings (Flowrate, Volume,
Pressure) for a specific intake device, based on a time period.

This project has received funding from the European Union’s Seventh Framework Programme for research, technological development and demonstration under grant agreement no [619228]
ISS-EWATUS FP7-ICT-2013-11 Page 62 of 77
o Inputs: Geonode Id, Period Start, Period End
o Outputs: A JSON serialized List of IntakeData C# class objects
ServiceWDSPRV.asmx
* Web service for Pressure Regulator Valve (geonodes of type=8) available readings
GetPRVAllData: Get all available readings (Flowrate, Outlet, Inlet) data for a specific PRV
device, based on a time period.
o Inputs: Geonode Id, Period Start, Period End
o Outputs: A JSON serialized List of PRVData C# class objects
GetPRVAllDataAverage: Calculates all available average daily readings (Flowrate, Outlet,
Inlet) for a specific PRV device, based on a time period.
o Inputs: Geonode Id, Period Start, Period End
o Outputs: A JSON serialized List of PRVData C# class objects
ServiceWDSPumpingStations.asmx
* Web service for PRV readings
GetAllRecords: Get all available readings (Flowrate, Volume, Pressure) data for a specific
Pumping station device, based on a time period.
o Inputs: Geonode Id, Period Start, Period End
o Outputs: A JSON serialized List of data records
GetPumpingConsumptions: Get all available readings (Flowrate, Volume, Pressure) data for a
specific Pumping station device located in Skiathos, based on a time period.
o Inputs: Geonode Id, Period Start, Period End
o Outputs: A JSON serialized List of PumpingData C# class objects
GetPumpingConsumptions_Poland: Calculate all available daily average readings (Flowrate,
Volume, Pressure) data for a specific Pumping station device located in Poland, based on a
time period.
o Inputs: Geonode Id, Period Start, Period End
o Outputs: A JSON serialized List of PumpingData_Poland C# class objects
GetPumpingConsumptions_PolandReal: Get all available readings (Flowrate, Volume,
Pressure) data for a specific Pumping station device located in Poland, based on a time
period.
o Inputs: Geonode Id, Period Start, Period End
o Outputs: A JSON serialized List of PumpingData_Poland C# class objects
ServiceAlarms.asmx
* Web service for user alerts

This project has received funding from the European Union’s Seventh Framework Programme for research, technological development and demonstration under grant agreement no [619228]
ISS-EWATUS FP7-ICT-2013-11 Page 63 of 77
GetAlarms: Get all alerts for a specific city and of specific status type (fixed or pending).
o Inputs: City id, Fixed status
o Outputs: A JSON serialized list of Alarm C# class objects
GetAlarm: Get all available ifos for a specific Alert database object.
o Inputs: Alarm Id
o Outputs: A JSON parsed Alarm C# class object
UpdateAlarm: Update the status and basic information for a specific alert
o Inputs: Alarm id, user email, user comments, admin comments, fixed status, user,
city id
o Outputs: A message indicating if the procedure was sucessfull
InsertAlarm: Inserts a new alert record for a specific city in the database
o Inputs: City id, longitude, latitude, user email, user comments
o Outputs: A message indicating if the procedure was sucessfull
addevent: Creates a new log event stored in the database, based on user interaction
o Inputs: User, city id, event, type, result
o Outputs: A message indicating if the procedure was sucessfull
Reports.asmx
* Web service for creation and rendering of EXCEL spreadsheets containing data from user created
charts
LandzoneConsumption: Create excel data report for a specific landzone in Skiathos or Poland
o Inputs: Landzone name, JSON serialized database records
o Outputs: An excel data report
HydrometerConsumptionSKIATHOS: Create excel data report for a specific watermeter in
Skiathos
o Inputs: Watermeter Geonode Id, name, JSON serialized database records
o Outputs: An excel data report
PumpingSKIATHOS: Create excel data report for pumping station data in Skiathos
o Inputs: Pumping station id, JSON serialized database records
o Outputs: An excel data report
CelloSKIATHOS: Create excel data report for a specific intake / cello device in Skiathos
o Inputs: Geonode Id, PMAC id, name, JSON serialized database records
o Outputs: An excel data report
CelloAvgSKIATHOS: Create excel data report for a specific intake / cello in Skiathos containg
average daily calculated data
o Inputs: Geonode Id, PMAC id, name, JSON serialized database records
o Outputs: An excel data report
PrvSKIATHOS: Create excel data report for a specific PRV device in Skiathos
o Inputs: Geonode Id, PMAC id, name, JSON serialized database records
o Outputs: An excel data report
PrvAvg: Create excel data report for a specific PRV device in Skiathos or Poland containing
average daily calculated data
This project has received funding from the European Union’s Seventh Framework Programme for research, technological development and demonstration under grant agreement no [619228]
ISS-EWATUS FP7-ICT-2013-11 Page 64 of 77
o Inputs: Geonode Id, PMAC id, name, JSON serialized database records
o Outputs: An excel data report
LandzoneConsumption: Create excel data report for a specific landzone in Skiathos or Poland
o Inputs: Landzone name, JSON serialized database records
o Outputs: An excel data report
HydrometerConsumptionPOLAND: Create excel data report for a specific watermeter in
Poland
o Inputs: Watermeter Geonode Id, name, JSON serialized database records
o Outputs: An excel data report
PumpingPOLAND: Create excel data report for pumping station data in Poland
o Inputs: Pumping station id, JSON serialized database records
o Outputs: An excel data report
CelloPOLAND: Create excel data report for a specific intake / cello device in Poland
o Inputs: Geonode Id, PMAC id, name, JSON serialized database records
o Outputs: An excel data report
CelloAvgPOLAND: Create excel data report for a specific intake / cello in Poland containg
average daily calculated data
o Inputs: Geonode Id, PMAC id, name, JSON serialized database records
o Outputs: An excel data report
PrvPOLAND: Create excel data report for a specific PRV device in Poland
o Inputs: Geonode Id, PMAC id, name, JSON serialized database records
o Outputs: An excel data report
PrvAvgPOLAND: Create excel data report for a specific PRV device in Poland containing
average daily calculated data
o Inputs: Geonode Id, PMAC id, name, JSON serialized database records
o Outputs: An excel data report
Algorithms.asmx
* Web service for running prediction algorithms and simulations for the water network
Rcmeans: Runs an Rscript prediction algorithm for Sosnowiec water network with the usage
of R.NET library
o Inputs: Geonode Id, Data Period start, City Id, User
o Outputs: a JSON serialized RmeansData list of objects (Predicted profile)
ARFIMA: Runs an Rscript prediction algorithm for Sosnowiec water network with the usage
of R.NET library
o Inputs: Geonode Id, Data Period start, City Id, User
o Outputs: a JSON serialized RmeansData list of objects (Predicted profile)
FCM: Runs an R-script prediction algorithm for Sosnowiec water network with the usage of
R.NET library
o Inputs: A JSON serialized array of the latest 27 data records containg corresponding
DataBase values
o Outputs: Predicted water demand value

This project has received funding from the European Union’s Seventh Framework Programme for research, technological development and demonstration under grant agreement no [619228]
ISS-EWATUS FP7-ICT-2013-11 Page 65 of 77
AnfisAlgorithm: Runs Adaptine Neuro-Fuzzy Inference System prediction module with the
usage of Matlab .COM server component
o Inputs: JSON serialized arraylist of objects containing all records with data, Nummfs
parameter, MfType parameter, NumEpochs parameter, Steps parameter, City id,
User
o Outputs: Predicted water demand value
FCMAlgorithm_Population: Runs a Fuzzy Cognitive Maps prediction algorithm based on
Genetic Algorithms with the usage of a custom created .NET library
o Inputs: JSON serialized arraylist of objects containing all records with data, sigma
parameter, error parameter
o Outputs: Predicted water demand value
NNAlgorithm: Runs Neural Network prediction algorithm with the usage of a custom created
.NET library
o Inputs: JSON serialized arraylist of objects containing all records with data, iterations
parameter, steps parameter, epochs parameter, city id, user
o Outputs: Predicted water demand value
addevent: Creates a new log event stored in the database, based on user interaction
o Inputs: User, city id, event, type, result
o Outputs: A message indicating if the procedure was sucessfull
PreProcessing.asmx
* Web service for data calculation and preparation
GetLatestValues1: Get latest Database records for a specific node
o Inputs: Geonode id, city id
o Outputs: A JSON serialized list of the latest database queried records as C# class
objects
GetPeriodValues1: Used in Anfis module, for preprocessing and generating data that we will
use in the forecasting dataset
o Inputs: Geonode id, city id, current days values (water demand, mean temperature,
high temperature, rain,arrivals ), predicted next day values (mean temperature, high
temperature, rain,arrivals ), data normalization procedure, period start
o Outputs: A JSON serialized list of the latest database queried records, processed and
generated as C# class objects
GetPeriodValues2: Used in FCM module, for preprocessing and generating data that we will
use in the forecasting dataset
o Inputs: Geonode id, city id, current days values (water demand, mean temperature,
high temperature, rain,arrivals ), data normalization procedure, period start
o Outputs: A JSON serialized list of the latest database queried records, processed and
generated as C# class objects
GetPeriodValues4: Used in NNs module, for preprocessing and generating data that we will
use in the forecasting dataset

This project has received funding from the European Union’s Seventh Framework Programme for research, technological development and demonstration under grant agreement no [619228]
ISS-EWATUS FP7-ICT-2013-11 Page 66 of 77
o Inputs: Geonode id, city id, current days values (water demand, mean temperature,
high temperature, rain,arrivals ), predicted next day values (mean temperature, high
temperature, rain,arrivals ), data normalization procedure, period start
o Outputs: A JSON serialized list of the latest database queried records, processed and
generated as C# class objects
GetPeriodValues3: Used in Poland's FCM forecasting script module, for preprocessing and
generating data that we will use in the forecasting dataset
o Inputs: Geonode id, city id, current days values (water demand, mean temperature,
high temperature, rain,arrivals ), data normalization procedure, period start
o Outputs: A JSON serialized list of the latest database queried records, processed and
generated as C# class objects
PreProcessing2.asmx
* Web service mainly used for generating water prediction profiles, dissagregation procedures and
also Epanet models
SkiathosProfiles: Generate Water demand profile for the city of skiathos
o Inputs: predicted water demand, landzones
o Outputs: A JSON serialized list of the dissagregated Landzone records as C# class
objects
PolandProfiles: Generate Water Demand profile for the city of Sosnowiec
o Inputs: daily flowrate profile, city id, user
o Outputs: A JSON serialized list of the dissagregated Landzone records as C# class
objects
CreatePolandEpanetDB: This method is responsible for the creation and initialization of the
Epanet simulations for Sosnowiec. With the help of some additional WebService functions
the DSS clears all previous tables and recreates them by adding new and updated data to be
used in Epanet Software simulations.
o Inputs: city and user
o Outputs: A message indicating if the procedure was successful
CreateSkiathosEpanetDB: This method is responsible for the creation and initialization of the
Epanet simulations for Skiathos. With the help of some additional WebService functions the
DSS clears all previous tables and recreates them by adding new and updated data to be
used in Epanet Software simulations.
o Inputs: city, user and list of landzone objects
o Outputs: A message indicating if the procedure was successful

This project has received funding from the European Union’s Seventh Framework Programme for research, technological development and demonstration under grant agreement no [619228]
ISS-EWATUS FP7-ICT-2013-11 Page 67 of 77
7 Appendix C – Remote Database
All data available through the Web Application are dynamically generated by remotely connecting to
a SQL Server DataBase named 'EWATUSDBa'. This database contains all necessary tables, data
structures and variables our system uses in order to function properly. Data connections are
accomplished by using Remote Server's public IP, port 2003 and user credentials supplied from the
administrator. The database scheme is displayed in Figure C.1

This project has received funding from the European Union’s Seventh Framework Programme for research, technological development and demonstration under grant agreement no [619228]
ISS-EWATUS FP7-ICT-2013-11 Page 68 of 77
Figure C.1 EWATUSDBa Database diagram
This project has received funding from the European Union’s Seventh Framework Programme for research, technological development and demonstration under grant agreement no [619228]
ISS-EWATUS FP7-ICT-2013-11 Page 69 of 77
Each data table holds the data required by our DSS system to create object models, retrieve queried
data, run forecasting algorithms, create water network profiles and run smoothly all auxiliary
modules. Below we briefly describe the most important tables our system uses.
tblGeoNodes: Contains all geographical nodes objects for the whole system. Each node is defined by
a GeoNodeTypeId field which indicates what type the node is (for example watermeter, critical point,
pumping station etc.), the CityId in which it belongs, its geographical position both in WGS84 system
and also into the country's specific EPSG type and finally some further auxiliary fields.
tblCities: Contains the objects for the cities that are involved in the DSS Web application
tblGeoNodeTypes: Contains all available geographical node's types
tblLandzones: Contains all the user created Landzones. Each zone is assigned to a city and is defined
by an area code, a name, a shape object of points (a polygon that basically renders the landzone), an
EpanetNode (a GeoNode which is used in Epanet Water Simulations) and finally some further
auxiliary fields.
tblDataTableWDSFlowmeters: This table contains data for the cities' watermeters consumptions.
Each record is defined by a specific GeonodeID (which is of type 1), the reading and consumption
fields containing the water consumption values, the DateTime for the consumption period and finally
some further auxiliary fields.
tblDataTableWDSPRV: This table contains data for cities' PRV devices. Each record is defined by a
specific GeonodeID (which is of type 8), outlet, inlet, flowrate fields containing corresponding values,
the DateTime stamp for the readings and finally some further auxiliary fields.
tblDataTableWDSPumpingStations: This table contains data for cities' Pumping station devices. Each
record is defined by a specific GeonodeID (which is of type 7), flowrate, volume and pressure fields
containing corresponding values, the DateTime stamp for the readings and finally some further
auxiliary fields.
tblDataTableWDSIntakes: This table contains data for cities' cellos and critical point devices. Each
record is defined by a specific GeonodeID (which is of type 10 or 3), flowrate, volume and pressure
fields containing corresponding values, the DateTime stamp for the readings and finally some further
auxiliary fields.
tblAlarms: Contains alarm object infos. Each alarm is defined by a specific CityId, its position in
WGS84 geographical coordinate system, its status, description, user infos, admin comments and
finally some further auxiliary fields.
tblMeteoData: This table contains city's meteorological historical data. Each record consists of the
CityId, mean temperature, high temperature and rain readings, a date stamp declaring the date the
readings are referring to and finally some further auxiliary fields. Currently only the City of Skiathos
has these type of data.

This project has received funding from the European Union’s Seventh Framework Programme for research, technological development and demonstration under grant agreement no [619228]
ISS-EWATUS FP7-ICT-2013-11 Page 70 of 77
tblArrivalsData: This table contains city's data referring to tourists arrivals. Currently only the City of
Skiathos uses these type of data.
LogEvents: Contains data information for the Web Application modules Users' interactions.
Epanet_Demands: Contains water demand data for each landzone, based on the provided total
network consumption and spatially disaggregated demands. This table is used by the Epanet
software to create and runs water simulations for each city, based on the input data.
Epanet_QID: This table contains data declaring all possible flowrates and daily water demands for
the cities that Epanet uses for the simulations. Based on these values the DSS generates and writes
all corresponding landzones demands for the simulations.
Epanet_PressureGoals: Contains information about desired pressure in the water distribution system
used by EPANET to optimize the pressure at the system inflow.
Epanet_QID_Settings: Contains settings for each city that are used in the generation of QIDs table
values.
Epanet_RunSetup: This table holds data that are used by the Epanet software to calibrate the
simulation models' settings.
Epanet_Output_Pressure_PRVs: This table contains all Epanet's simulations results for the PRV of
each city.
Epanet_Output_Pressure_Nodes: This table contains all Epanet's simulations results for the Nodes of
each city.
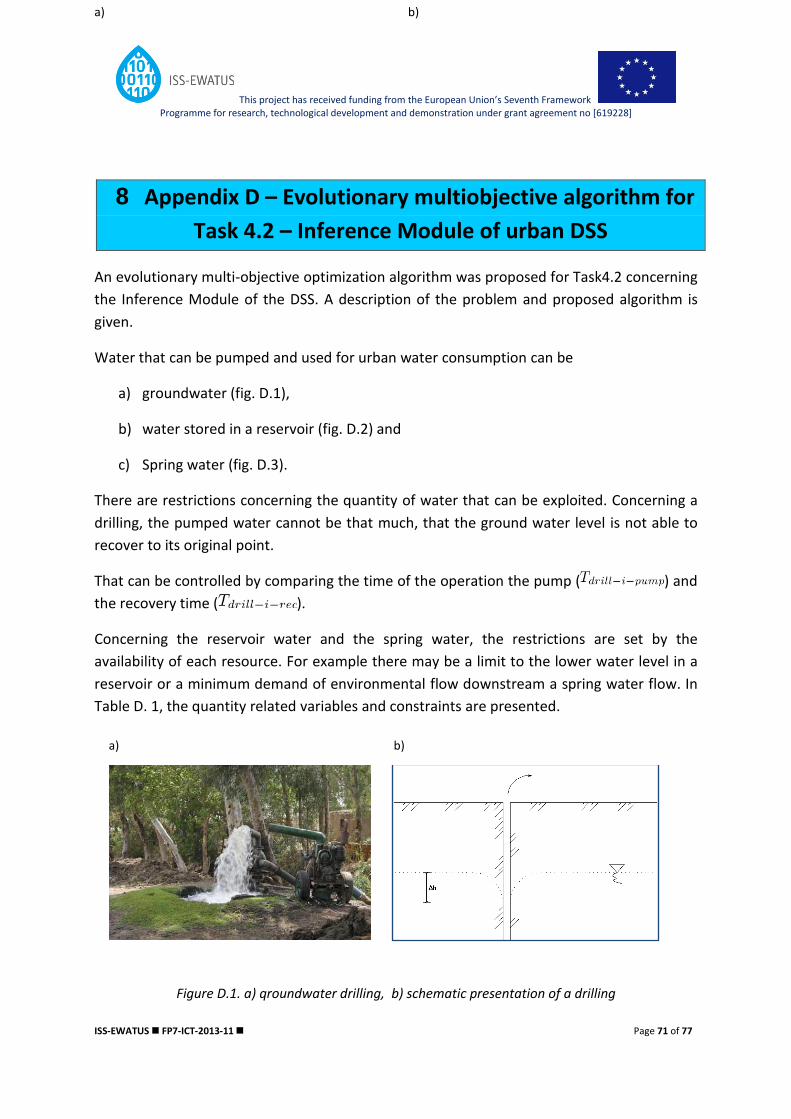
This project has received funding from the European Union’s Seventh Framework Programme for research, technological development and demonstration under grant agreement no [619228]
ISS-EWATUS FP7-ICT-2013-11 Page 71 of 77
8 Appendix D – Evolutionary multiobjective algorithm for
Task 4.2 – Inference Module of urban DSS
An evolutionary multi-objective optimization algorithm was proposed for Task4.2 concerning
the Inference Module of the DSS. A description of the problem and proposed algorithm is
given.
Water that can be pumped and used for urban water consumption can be
a) groundwater (fig. D.1),
b) water stored in a reservoir (fig. D.2) and
c) Spring water (fig. D.3).
There are restrictions concerning the quantity of water that can be exploited. Concerning a
drilling, the pumped water cannot be that much, that the ground water level is not able to
recover to its original point.
That can be controlled by comparing the time of the operation the pump ( ) and
the recovery time ( ).
Concerning the reservoir water and the spring water, the restrictions are set by the
availability of each resource. For example there may be a limit to the lower water level in a
reservoir or a minimum demand of environmental flow downstream a spring water flow. In
Table D. 1, the quantity related variables and constraints are presented.
a) b)
Figure D.1. a) qroundwater drilling, b) schematic presentation of a drilling
a) b)

This project has received funding from the European Union’s Seventh Framework Programme for research, technological development and demonstration under grant agreement no [619228]
ISS-EWATUS FP7-ICT-2013-11 Page 72 of 77
Figure D.2. a) reservoir b) schematic presentation of a reservoir
Figure D.3. Spring water

This project has received funding from the European Union’s Seventh Framework Programme for research, technological development and demonstration under grant agreement no [619228]
ISS-EWATUS FP7-ICT-2013-11 Page 73 of 77
Figure D.4. Overview of the optimization problem

This project has received funding from the European Union’s Seventh Framework Programme for research, technological development and demonstration under grant agreement no [619228]
ISS-EWATUS FP7-ICT-2013-11 Page 74 of 77
Table D.1. Quantity related variables
Variable Description Source/Computation
Volume of total water demand Forecasted
Time of recovery of the groundwater level Measured by the water utility
Time of pump operation
Set by the water utility Available volume of water from reservoir i
Available volume of water from spring water i
Volume of water from drilling i DSS outcome
Flow rate of the pumping DSS outcome
Volume of water from reservoir i
DSS outcome Volume of water from spring water
The constraints are the following
Quite often, water resources are characterized by high concentrations of a pollutant or an
unwanted substance ( ). A typical example of this is high salinity at underground water,
when the aquifer is located at a coastal area. This is reinforced, by the degradation of the
aquifer water level.
The demand for the highest possible quality of urban water, gives out the first objective,
which is the minimization of concentration of each pollutant ( ).

This project has received funding from the European Union’s Seventh Framework Programme for research, technological development and demonstration under grant agreement no [619228]
ISS-EWATUS FP7-ICT-2013-11 Page 75 of 77
Table D.2. Quality related variables
Variable Description Source/Computation
Concentration of pollutant j in drilling water i
Measured by water utility Concentration of pollutant j in reservoir i
Concentration of pollutant j in spring water
Upper limit in concentration of pollutant j Ruled by government
The quality related constraints are the following
The third objective of the multi-objective optimization problem is the minimization of
operational costs.
The costs come out as functions of the pumping energy needed, the level differences and
the distances between the water resource and the utility tank, and the pump specifications
(see Table D.3).
Table D.3. Cost related variables
Variable Description Source/Computation
Cost per cubic meter for drilling i Estimated by the water utility
Cost per cubic meter for reservoir i Estimated by the water utility
Maximum cost Setting by the water utility
According to this, the third optimization problem is
The considered scenario involves an arbitrary optimization problem with k objectives, which are,
without loss of generality, all to be maximized and all equally important, i.e., no additional
knowledge about the problem is available.
This project has received funding from the European Union’s Seventh Framework Programme for research, technological development and demonstration under grant agreement no [619228]
ISS-EWATUS FP7-ICT-2013-11 Page 76 of 77
We assume that a solution to this problem can be described in terms of a decision vector
in the decision space X. A function evaluates the quality of a specific
solution by assigning it an objective vector ) in the objective space Y.
Now, let us suppose that the objective space is a subset of the real numbers, i.e., , and that the
goal of the optimization is to maximize the single objective. In such a single-objective optimization
problem, a solution is better than another solution if where and
. Although several optimal solutions may exist in decision space, they are all mapped to the
same objective vector, i.e., there exists only a single optimum in objective space.
In the case of a vector-valued evaluation function with and , the situation of
comparing two solutions and is more complex. Following the well-known concept of Pareto
dominance, an objective vector is said to dominate another objective vectors if no
component of is smaller than the corresponding component of and at least one component is
greater. Accordingly, we can say that a solution is better to another solution , i.e., dominates
, if dominates . Here, optimal solutions, i.e., solutions not dominated by any
other solution, may be mapped to different objective vectors. Indeed, there may exist several
optimal objective vectors representing different trade-offs between the objectives.
The set of optimal solutions in the decision space is in general denoted as the Pareto set ,
and we will denote its image in objective space as Pareto front . With many
multiobjective optimization problems, knowledge about this set helps the decision maker in choosing
the best compromise solution. For instance, when designing computer systems, engineers often
perform a so-called design space exploration to learn more about the Pareto set. Thereby, the design
space is reduced to the set of optimal trade-offs: a first step in selecting an appropriate
implementation.
Although there are different ways to approach a multiobjective optimization problem, e.g., by
aggregation of the objectives into a single one, most work in the area of evolutionary multiobjective
optimization has concentrated on the approximation of the Pareto set. Therefore, we will assume in
the following that the goal of the optimization is to find or approximate the Pareto set. Accordingly,
the outcome of an Evolutionary Multiobjective Optimization Algorithm is considered to be a set of
mutually non-dominated solutions, or Pareto set approximation for short.
Evolutionary algorithms are characterized by a population of solution candidates and the
reproduction process enables to combine existing solutions to generate new solutions. Finally,
natural selection determines which individuals of the current population participate in the new
population. Real-Coded Genetic Algorithm is the population-based algorithm selected. The algorithm
is detailed as follows
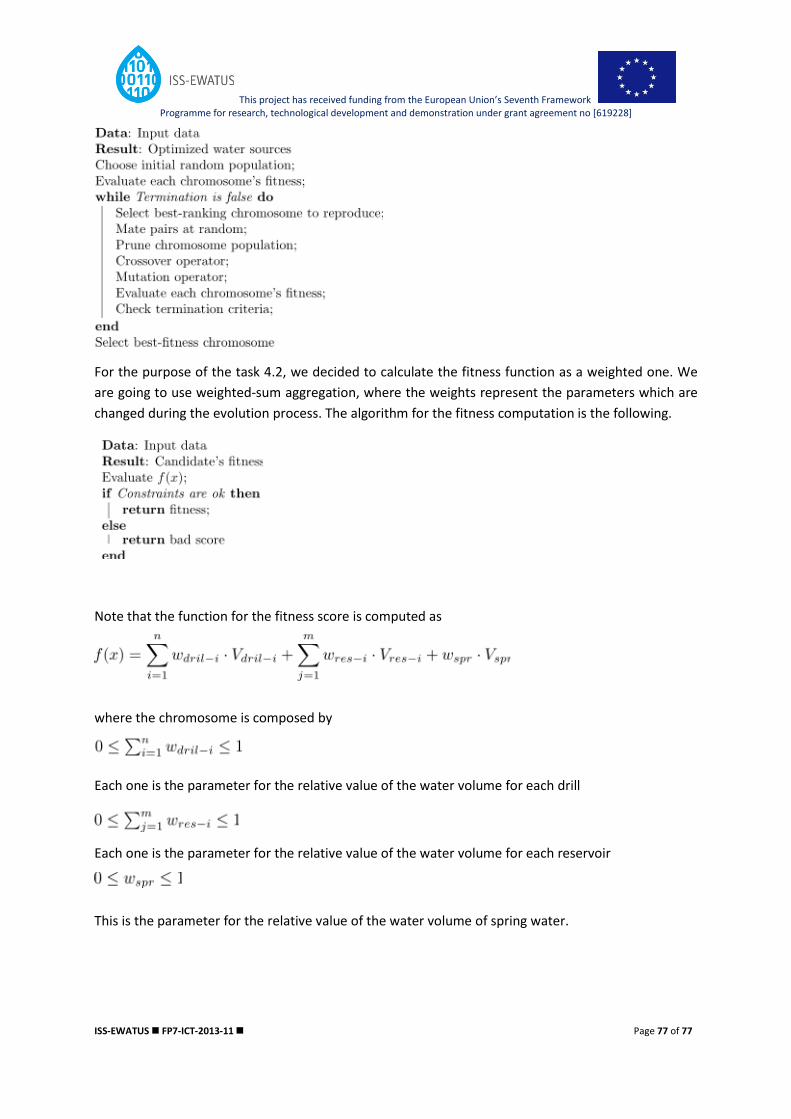
This project has received funding from the European Union’s Seventh Framework Programme for research, technological development and demonstration under grant agreement no [619228]
ISS-EWATUS FP7-ICT-2013-11 Page 77 of 77
For the purpose of the task 4.2, we decided to calculate the fitness function as a weighted one. We
are going to use weighted-sum aggregation, where the weights represent the parameters which are
changed during the evolution process. The algorithm for the fitness computation is the following.
Note that the function for the fitness score is computed as
where the chromosome is composed by
Each one is the parameter for the relative value of the water volume for each drill
Each one is the parameter for the relative value of the water volume for each reservoir
This is the parameter for the relative value of the water volume of spring water.