Embed Size (px)
Citation preview
ICES Ecosystem Overviews Greater North Sea Ecoregion Published 04 March 2016
Version 2; 13 May 2016
ICES Advice 2016, Book 6 1
6.1* Greater North Sea Ecoregion – Ecosystem overview Ecoregion description The Greater North Sea ecoregion includes the North Sea, English Channel, Skagerrak, and Kattegat. It is a temperate coastal shelf sea with a deep channel in the northwest, a permanently thermally mixed water column in the south and east, and seasonal stratification in the north. Fisheries management in the Greater North Sea ecoregion is conducted in accordance with the EU Common Fisheries Policy (CFP), by Norway, and by coastal state agreements. Managerial responsibility for salmon is taken by the North Atlantic Salmon Conservation Organization (NASCO) and for large pelagic fish by the International Commission for the Conservation of Atlantic Tunas (ICCAT). Collective fisheries advice is provided by the International Council for the Exploration of the Sea (ICES), the European Commission’s Scientific Technical and Economic Committee for Fisheries (STECF), and the North Sea and Pelagic ACs. Environmental policy is managed by national governments and agencies and OSPAR, with advice being provided by national agencies, OSPAR, the European Environment Agency (EEA), and ICES. International shipping is managed under the International Maritime Organization (IMO).
Figure 6.1.1† Greater North Sea ecoregion, showing EEZs, larger offshore Natura 2000 sites, and operational and authorized wind farms.
* Version 2; section number corrected † Version 2; figure number corrected
Published 04 March 2016 ICES Ecosystem Overviews
2 ICES Advice 2016, Book 6
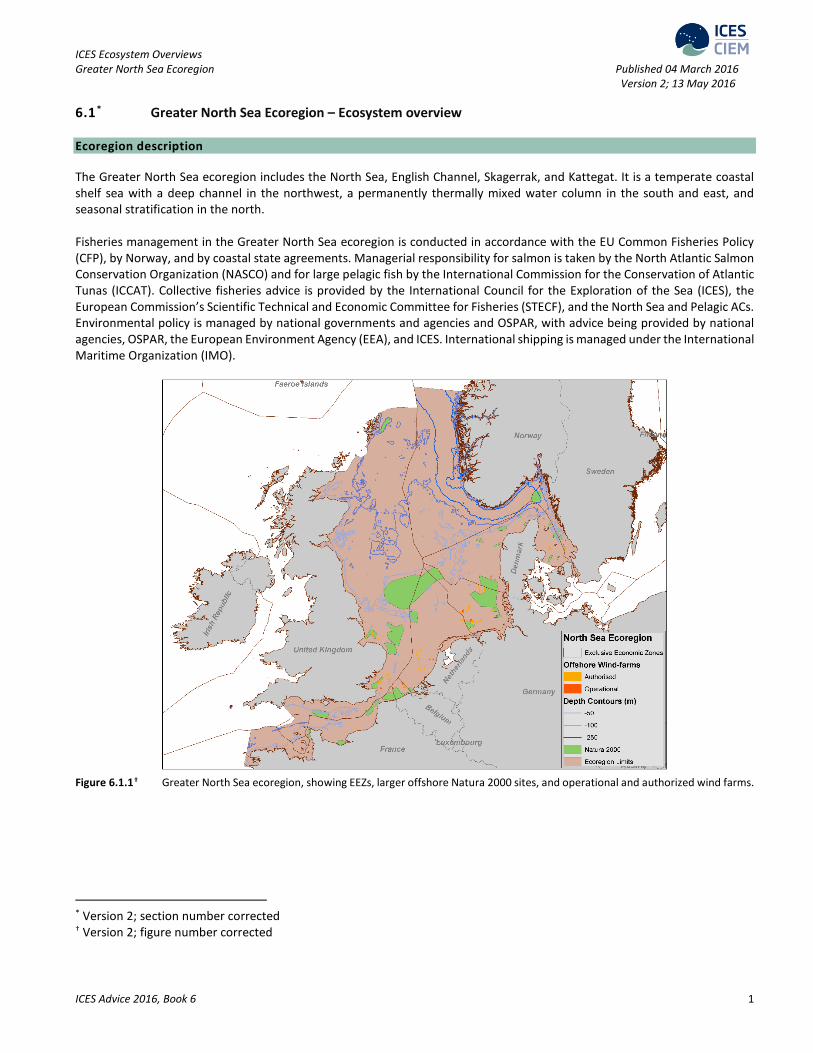
The ecoregion consists of four key areas:
• Northern North Sea (depths 0–500 m) is strongly influenced by oceanic inflow and has a deep channel in the east. The majority of the area is stratified in summer. The dominant human activities are fishing and oil and gas production.
• Southern North Sea (depths 0–50 m) is characterized by large river inputs and strongly mixed water. The dominant human activities are fishing, shipping, ports, gas production, wind farms, and aggregate (sand) extraction.
• The Skagerrak and Kattegat forms the link to the Baltic Sea and is less saline and less tidal than the rest of the ecoregion. The water column is usually mixed. The dominant human activities are fishing, shipping, and wind farms.
• The English Channel joins the southern North Sea to the Atlantic. It is usually mixed and heavily influenced by wind events. The dominant human activities are fishing, shipping, and aggregate (gravel) extraction.
Figure 6.1.2‡ Catchment area for the Greater North Sea ecoregion showing major cities, ports, and ICES areas. Key signals within the environment and the ecosystem
• The North Sea is characterized by episodic changes in the productivity of key components of the ecosystem. Phytoplankton, zooplankton, and demersal and pelagic fish have all exhibited such cycles in variability. Managers should expect change and ensure that management plans have the potential to respond to new circumstances. Examples of these changes include the gadoid ‘outburst’ in the 1970s, and a reduced productivity of herring Clupea harengus since 2002.
• The changes have been described as regime shifts; a notable example is the composition of the zooplankton community, which changed both in terms of species and size composition in the late 1980s and again around 2000.
• The temperature trends of the North Sea are linked to these ecosystem changes. Whilst the mechanisms underlying this link are not known, it is clear that the temperature cycle of the North Atlantic (the Atlantic Multidecadal
‡ Version 2; figure number corrected
ICES Ecosystem Overviews Published 04 March 2016
ICES Advice 2016, Book 6 3
Oscillation, AMO) affects the North Sea. Examples of this include the outbursts of anchovy Engraulis encrasicolus in the 1930s and the 2000s.
• Recent years have seen an increase in the addition of new artificial hard substrate to the North Sea (platforms, wind turbines, and rocks). These additions have changed the biodiversity and productivity in local areas.
• Fishing has reduced the number of large fish in the North Sea ecosystem (mostly cod Gadus morhua, saithe Pollachius virens, ling Molva molva, sturgeon Acipenser sturio, and some elasmobranchs). In historical times, the large whale populations of the North Sea were depleted or extirpated by hunting. Whilst the impact of these removals on the ecosystem functioning is not clearly understood, it should be assumed that the North Sea ecosystem is currently in a perturbed state. Several of these elasmobranch species are now considered threatened or endangered by OSPAR and IUCN and are still caught as bycatch in fisheries.
• However, it is clear that fishing effort has reduced in the North Sea since the 2002 CFP reforms; this can now be detected in the reduction of fishing mortality in most assessed fish stocks and an increase in the amount of larger fish present. The majority of assessed fish stocks are now fished at or below MSY fishing mortality targets (FMSY).
• There have been reports of a shift from pelagic to benthic production. The plaice stock in the North Sea has increased almost fourfold in the last 15 years and is now larger than when monitoring began in the 1950s. Flatfish are not included in the current multispecies models for the North Sea. The consequences of this large stock for the ecosystem are unknown.
• The seabird population showed an overall increasing trend until 2000, after which it declined. Recent changes in fisheries management policy (e.g. reduction in effort and the landing obligation) will likely affect seabirds as well as other parts of the ecosystem.
• There have been no significant changes in the cetacean populations of the North Sea. The centre of distribution of the harbour porpoise Phocoena phocoena population moved southwards from off the east of Scotland to the southern North Sea between the mid-1990s and the mid-2000s. These animals are caught as bycatch in bottom-set gillnets. The abundance of grey seals has been increasing for at least 30 years.
Published 04 March 2016 ICES Ecosystem Overviews
4 ICES Advice 2016, Book 6
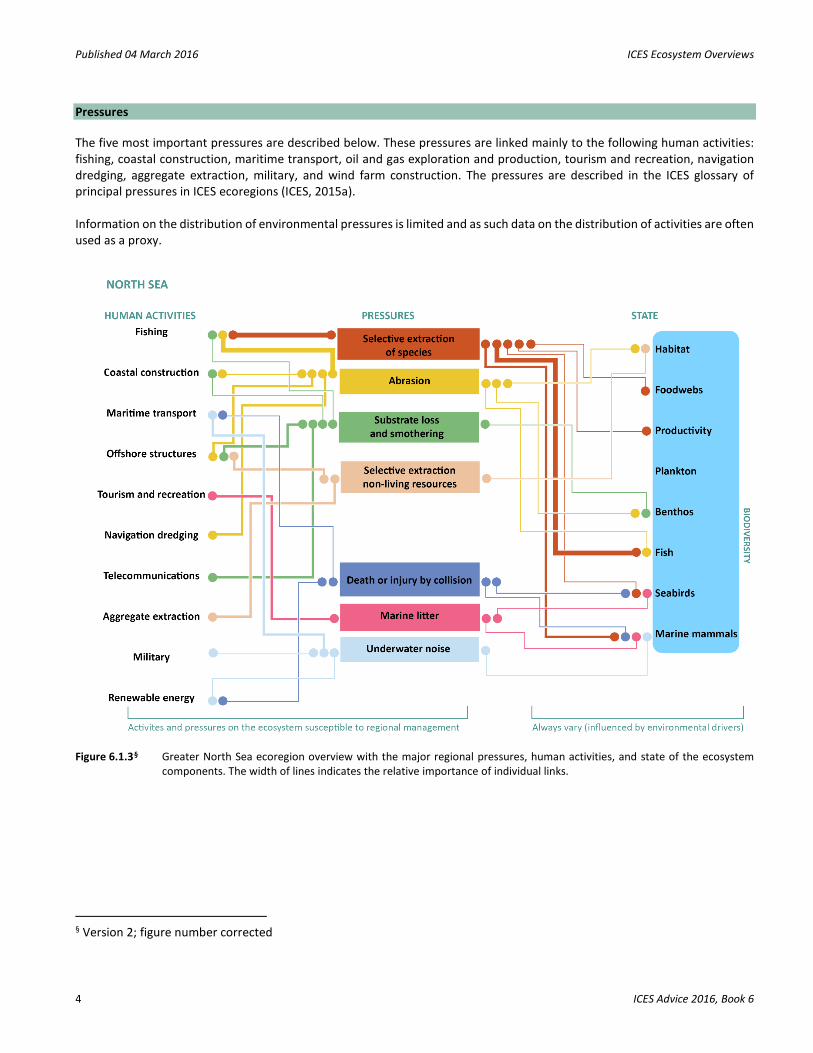
Pressures The five most important pressures are described below. These pressures are linked mainly to the following human activities: fishing, coastal construction, maritime transport, oil and gas exploration and production, tourism and recreation, navigation dredging, aggregate extraction, military, and wind farm construction. The pressures are described in the ICES glossary of principal pressures in ICES ecoregions (ICES, 2015a). Information on the distribution of environmental pressures is limited and as such data on the distribution of activities are often used as a proxy.
Figure 6.1.3§ Greater North Sea ecoregion overview with the major regional pressures, human activities, and state of the ecosystem
components. The width of lines indicates the relative importance of individual links.
§ Version 2; figure number corrected
ICES Ecosystem Overviews Published 04 March 2016
ICES Advice 2016, Book 6 5
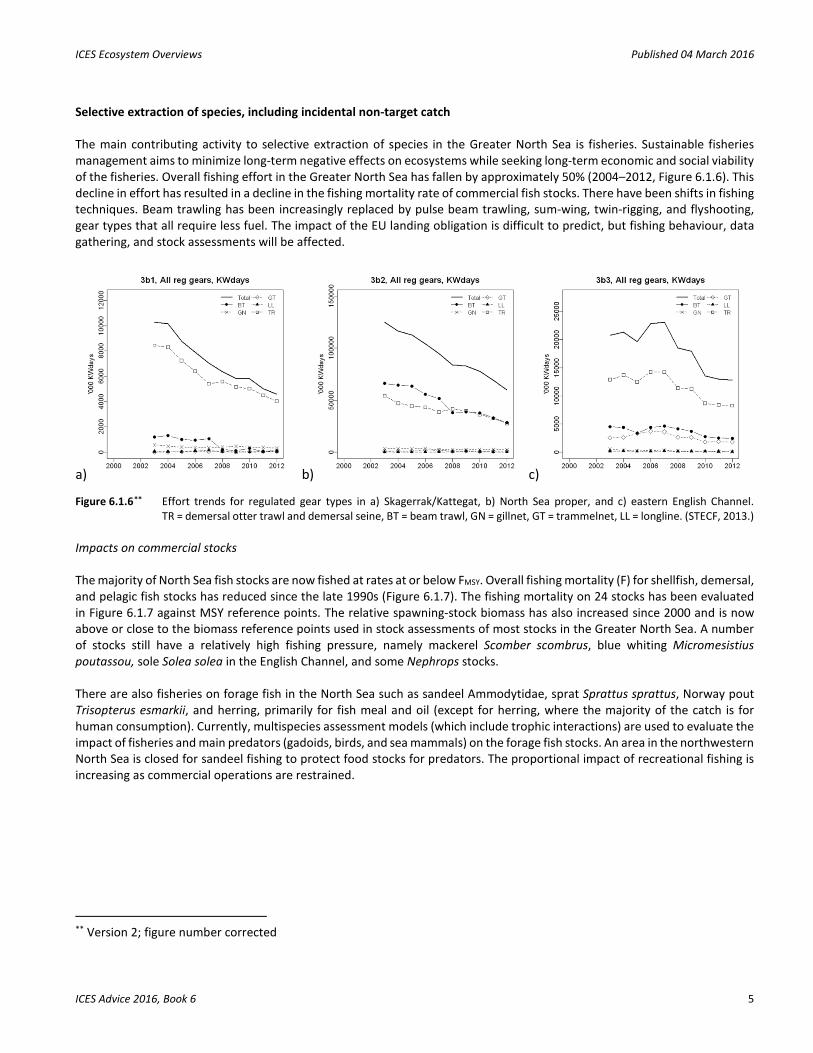
Selective extraction of species, including incidental non-target catch The main contributing activity to selective extraction of species in the Greater North Sea is fisheries. Sustainable fisheries management aims to minimize long-term negative effects on ecosystems while seeking long-term economic and social viability of the fisheries. Overall fishing effort in the Greater North Sea has fallen by approximately 50% (2004–2012, Figure 6.1.6). This decline in effort has resulted in a decline in the fishing mortality rate of commercial fish stocks. There have been shifts in fishing techniques. Beam trawling has been increasingly replaced by pulse beam trawling, sum-wing, twin-rigging, and flyshooting, gear types that all require less fuel. The impact of the EU landing obligation is difficult to predict, but fishing behaviour, data gathering, and stock assessments will be affected.
a) b) c)
Figure 6.1.6** Effort trends for regulated gear types in a) Skagerrak/Kattegat, b) North Sea proper, and c) eastern English Channel. TR = demersal otter trawl and demersal seine, BT = beam trawl, GN = gillnet, GT = trammelnet, LL = longline. (STECF, 2013.)
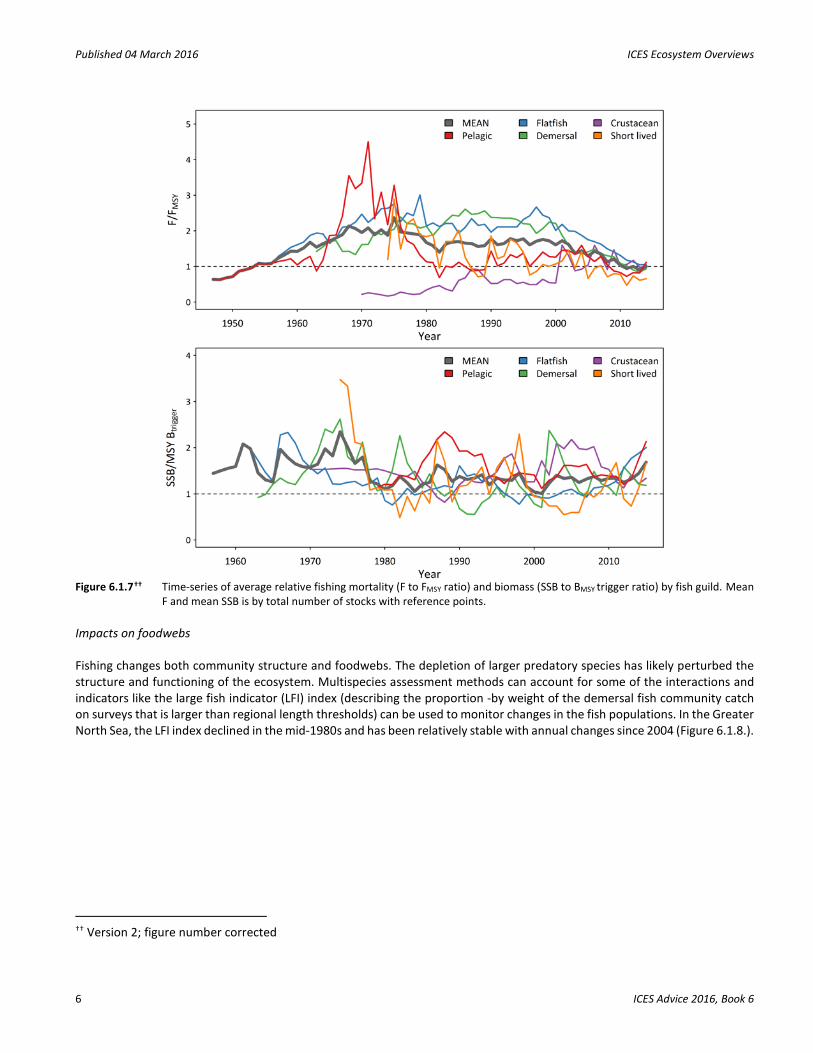
Impacts on commercial stocks The majority of North Sea fish stocks are now fished at rates at or below FMSY. Overall fishing mortality (F) for shellfish, demersal, and pelagic fish stocks has reduced since the late 1990s (Figure 6.1.7). The fishing mortality on 24 stocks has been evaluated in Figure 6.1.7 against MSY reference points. The relative spawning-stock biomass has also increased since 2000 and is now above or close to the biomass reference points used in stock assessments of most stocks in the Greater North Sea. A number of stocks still have a relatively high fishing pressure, namely mackerel Scomber scombrus, blue whiting Micromesistius poutassou, sole Solea solea in the English Channel, and some Nephrops stocks. There are also fisheries on forage fish in the North Sea such as sandeel Ammodytidae, sprat Sprattus sprattus, Norway pout Trisopterus esmarkii, and herring, primarily for fish meal and oil (except for herring, where the majority of the catch is for human consumption). Currently, multispecies assessment models (which include trophic interactions) are used to evaluate the impact of fisheries and main predators (gadoids, birds, and sea mammals) on the forage fish stocks. An area in the northwestern North Sea is closed for sandeel fishing to protect food stocks for predators. The proportional impact of recreational fishing is increasing as commercial operations are restrained.
** Version 2; figure number corrected
Published 04 March 2016 ICES Ecosystem Overviews
6 ICES Advice 2016, Book 6
Figure 6.1.7†† Time-series of average relative fishing mortality (F to FMSY ratio) and biomass (SSB to BMSY trigger ratio) by fish guild. Mean
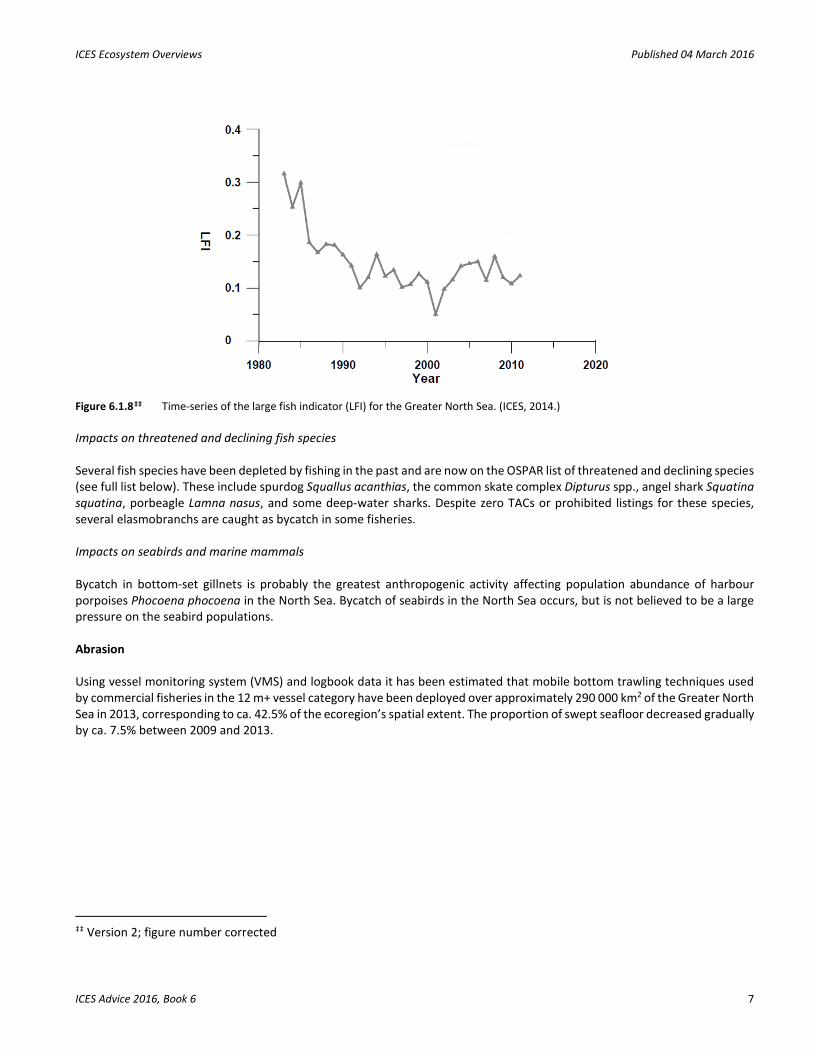
F and mean SSB is by total number of stocks with reference points. Impacts on foodwebs Fishing changes both community structure and foodwebs. The depletion of larger predatory species has likely perturbed the structure and functioning of the ecosystem. Multispecies assessment methods can account for some of the interactions and indicators like the large fish indicator (LFI) index (describing the proportion -by weight of the demersal fish community catch on surveys that is larger than regional length thresholds) can be used to monitor changes in the fish populations. In the Greater North Sea, the LFI index declined in the mid-1980s and has been relatively stable with annual changes since 2004 (Figure 6.1.8.).
†† Version 2; figure number corrected
ICES Ecosystem Overviews Published 04 March 2016
ICES Advice 2016, Book 6 7
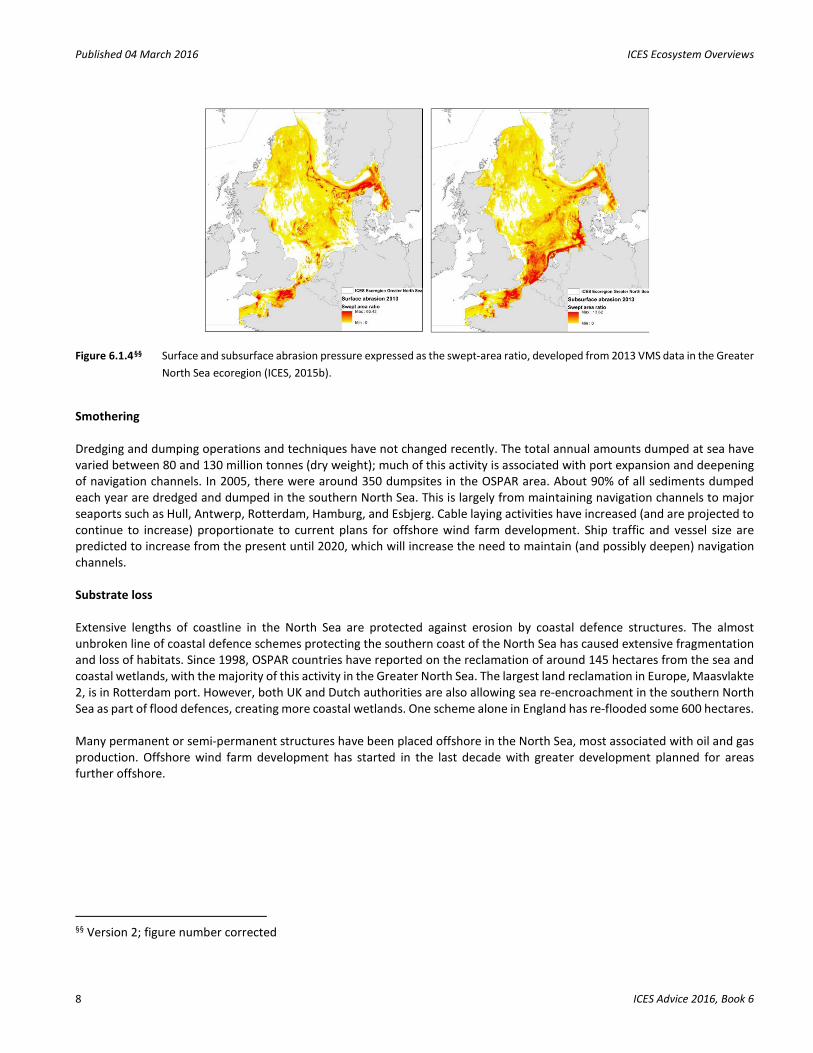
Figure 6.1.8‡‡ Time-series of the large fish indicator (LFI) for the Greater North Sea. (ICES, 2014.) Impacts on threatened and declining fish species Several fish species have been depleted by fishing in the past and are now on the OSPAR list of threatened and declining species (see full list below). These include spurdog Squallus acanthias, the common skate complex Dipturus spp., angel shark Squatina squatina, porbeagle Lamna nasus, and some deep-water sharks. Despite zero TACs or prohibited listings for these species, several elasmobranchs are caught as bycatch in some fisheries. Impacts on seabirds and marine mammals Bycatch in bottom-set gillnets is probably the greatest anthropogenic activity affecting population abundance of harbour porpoises Phocoena phocoena in the North Sea. Bycatch of seabirds in the North Sea occurs, but is not believed to be a large pressure on the seabird populations. Abrasion Using vessel monitoring system (VMS) and logbook data it has been estimated that mobile bottom trawling techniques used by commercial fisheries in the 12 m+ vessel category have been deployed over approximately 290 000 km2 of the Greater North Sea in 2013, corresponding to ca. 42.5% of the ecoregion’s spatial extent. The proportion of swept seafloor decreased gradually by ca. 7.5% between 2009 and 2013.
‡‡ Version 2; figure number corrected
Published 04 March 2016 ICES Ecosystem Overviews
8 ICES Advice 2016, Book 6
Figure 6.1.4§§ Surface and subsurface abrasion pressure expressed as the swept-area ratio, developed from 2013 VMS data in the Greater North Sea ecoregion (ICES, 2015b).
Smothering Dredging and dumping operations and techniques have not changed recently. The total annual amounts dumped at sea have varied between 80 and 130 million tonnes (dry weight); much of this activity is associated with port expansion and deepening of navigation channels. In 2005, there were around 350 dumpsites in the OSPAR area. About 90% of all sediments dumped each year are dredged and dumped in the southern North Sea. This is largely from maintaining navigation channels to major seaports such as Hull, Antwerp, Rotterdam, Hamburg, and Esbjerg. Cable laying activities have increased (and are projected to continue to increase) proportionate to current plans for offshore wind farm development. Ship traffic and vessel size are predicted to increase from the present until 2020, which will increase the need to maintain (and possibly deepen) navigation channels. Substrate loss Extensive lengths of coastline in the North Sea are protected against erosion by coastal defence structures. The almost unbroken line of coastal defence schemes protecting the southern coast of the North Sea has caused extensive fragmentation and loss of habitats. Since 1998, OSPAR countries have reported on the reclamation of around 145 hectares from the sea and coastal wetlands, with the majority of this activity in the Greater North Sea. The largest land reclamation in Europe, Maasvlakte 2, is in Rotterdam port. However, both UK and Dutch authorities are also allowing sea re-encroachment in the southern North Sea as part of flood defences, creating more coastal wetlands. One scheme alone in England has re-flooded some 600 hectares. Many permanent or semi-permanent structures have been placed offshore in the North Sea, most associated with oil and gas production. Offshore wind farm development has started in the last decade with greater development planned for areas further offshore.
§§ Version 2; figure number corrected
ICES Ecosystem Overviews Published 04 March 2016
ICES Advice 2016, Book 6 9
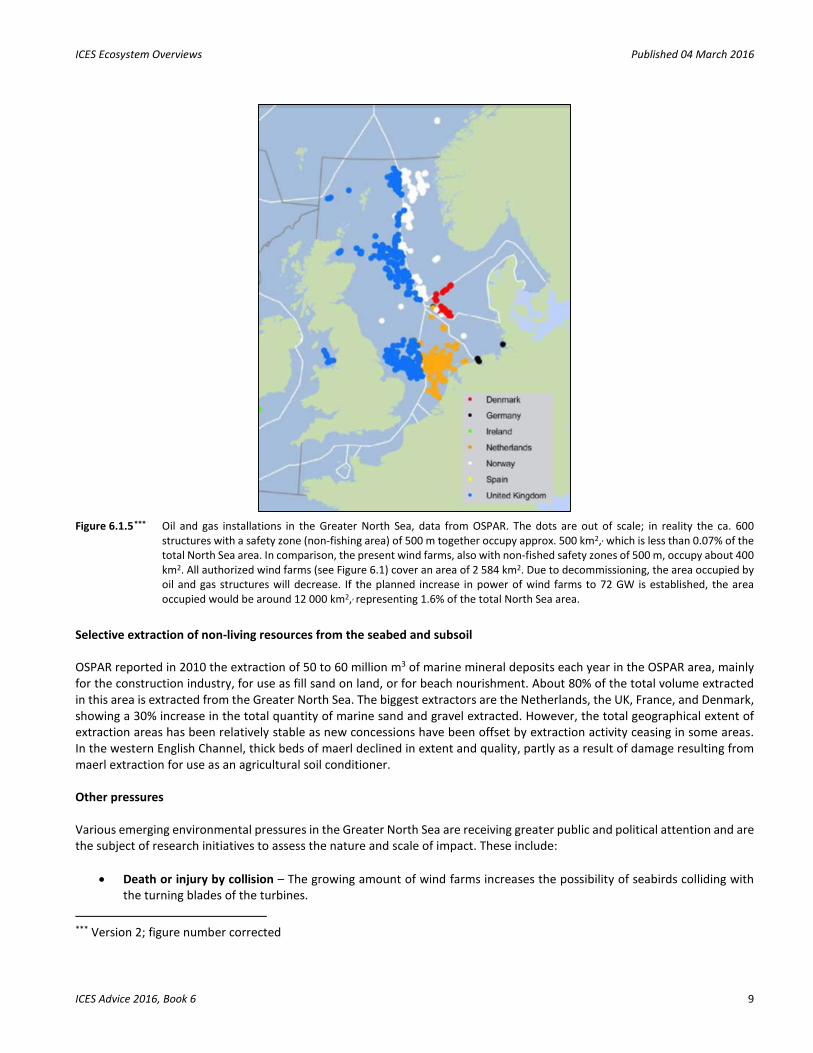
Figure 6.1.5*** Oil and gas installations in the Greater North Sea, data from OSPAR. The dots are out of scale; in reality the ca. 600
structures with a safety zone (non-fishing area) of 500 m together occupy approx. 500 km2,, which is less than 0.07% of the total North Sea area. In comparison, the present wind farms, also with non-fished safety zones of 500 m, occupy about 400 km2. All authorized wind farms (see Figure 6.1) cover an area of 2 584 km2. Due to decommissioning, the area occupied by oil and gas structures will decrease. If the planned increase in power of wind farms to 72 GW is established, the area occupied would be around 12 000 km2,, representing 1.6% of the total North Sea area.
Selective extraction of non-living resources from the seabed and subsoil OSPAR reported in 2010 the extraction of 50 to 60 million m3 of marine mineral deposits each year in the OSPAR area, mainly for the construction industry, for use as fill sand on land, or for beach nourishment. About 80% of the total volume extracted in this area is extracted from the Greater North Sea. The biggest extractors are the Netherlands, the UK, France, and Denmark, showing a 30% increase in the total quantity of marine sand and gravel extracted. However, the total geographical extent of extraction areas has been relatively stable as new concessions have been offset by extraction activity ceasing in some areas. In the western English Channel, thick beds of maerl declined in extent and quality, partly as a result of damage resulting from maerl extraction for use as an agricultural soil conditioner. Other pressures Various emerging environmental pressures in the Greater North Sea are receiving greater public and political attention and are the subject of research initiatives to assess the nature and scale of impact. These include:
• Death or injury by collision – The growing amount of wind farms increases the possibility of seabirds colliding with the turning blades of the turbines.
*** Version 2; figure number corrected
Published 04 March 2016 ICES Ecosystem Overviews
10 ICES Advice 2016, Book 6
• Marine litter – Marine debris, also known as marine litter, is man-made waste that has deliberately or accidentally been released in the sea, ocean, or waterway. Major contributing activities are tourism, fishing, and shipping.
• Underwater sound – Sound from the human world disrupts life below the surface, where many living creatures depend on sound as a primary sense for mating, hunting, and survival. The main anthropogenic activities that produce sound are shipping, oil exploration, and pile-driving of wind farm foundations.
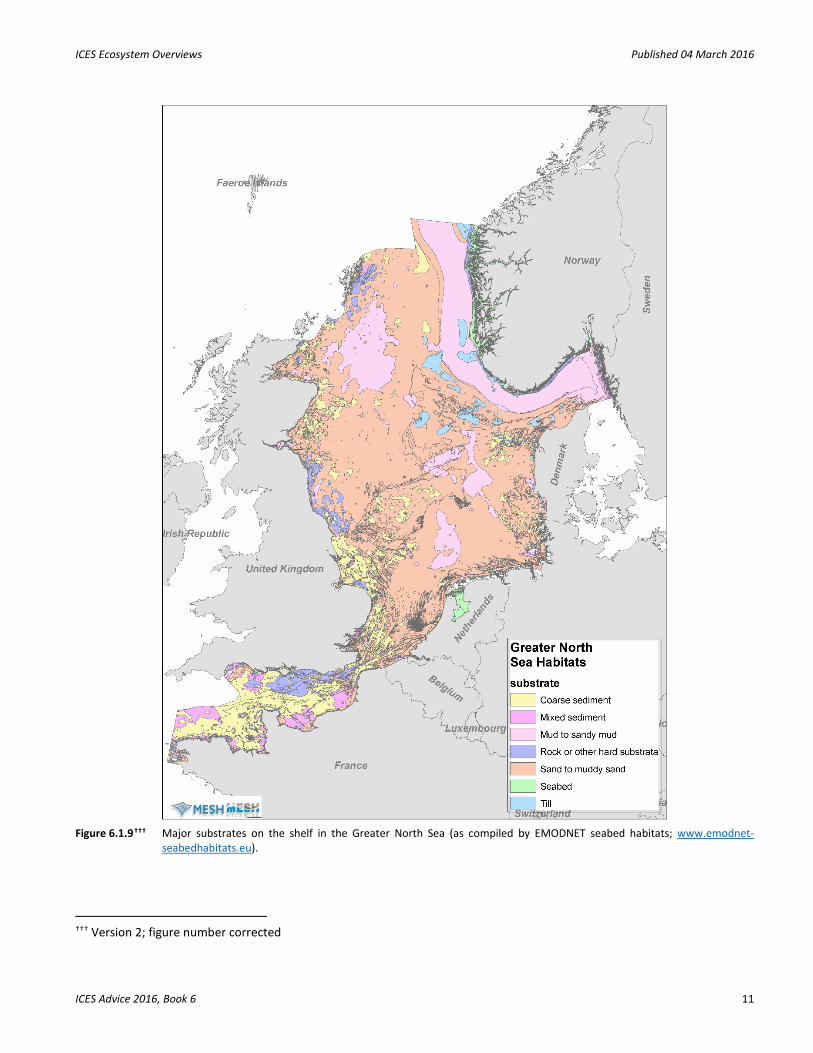
State of the ecosystem Habitat The benthic substrate of the Greater North Sea is predominantly characterized by soft sediments (from muds to gravel beds, Figure 6.1.9). Sediments from mobile muds to coarse sands are present throughout the region. Gravel beds are mainly distributed in the English Channel and the southern North Sea. The North Sea contains limited biogenic and geogenic reefs, except for patches of Sabellaria spinulosa reefs and scattered boulder fields. The shores consist mainly of mobile sediment types, i.e. mud, sand, and boulder beaches, while rocky shores are mostly found in the northern North Sea and the English Channel. The North Sea benthic habitats are impacted by bottom trawling, sand and gravel extraction, and recently also the growing introduction of offshore renewable energy structures such as wind farms, leading to pressures of abrasion, smothering, habitat loss, and selective extraction of non-living resources. Artificial hard substrates, such as hydrocarbon production platforms, wind turbines, and ship wrecks may act as new hard substrate habitat types that increase local biodiversity. Before 1900, biogenic oyster Ostrea edulis reefs were a large separate habitat type in the central part of the North Sea, but this disappeared most likely due to changes in currents and overfishing. Sea grasses (Zosteraceae) were common along the coasts of the southern North Sea; these have also mostly disappeared.
ICES Ecosystem Overviews Published 04 March 2016
ICES Advice 2016, Book 6 11
Figure 6.1.9††† Major substrates on the shelf in the Greater North Sea (as compiled by EMODNET seabed habitats; www.emodnet-
seabedhabitats.eu).
††† Version 2; figure number corrected
Published 04 March 2016 ICES Ecosystem Overviews
12 ICES Advice 2016, Book 6
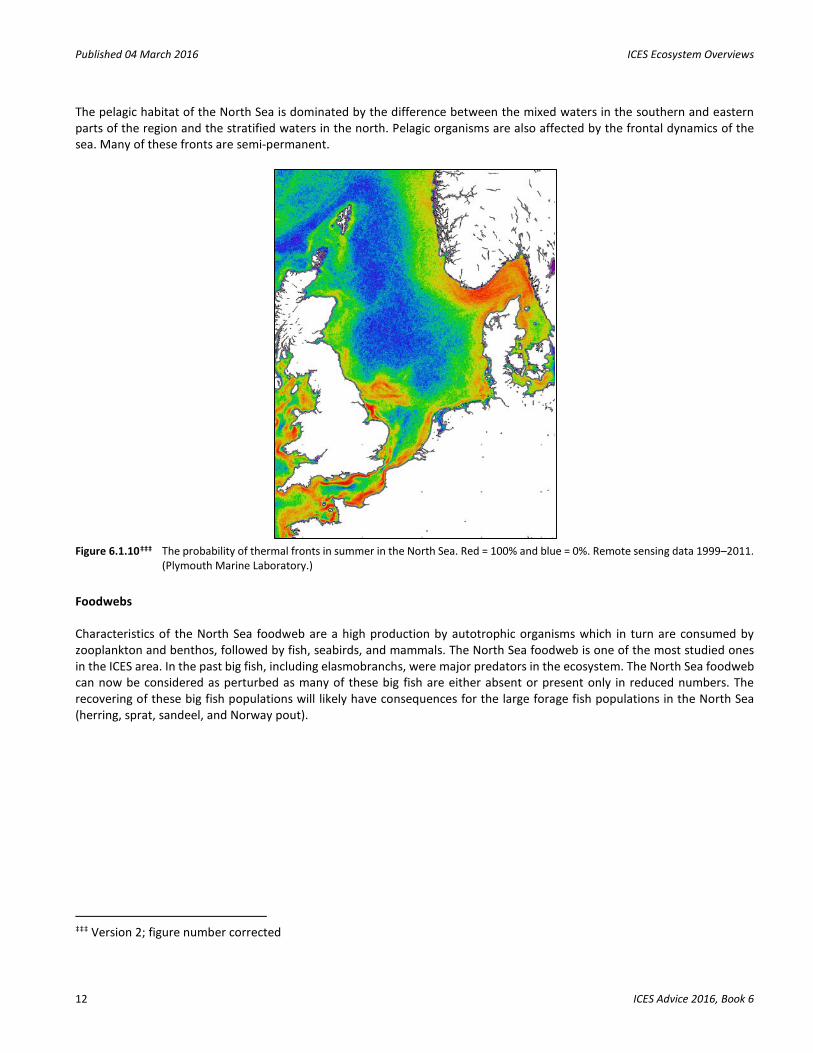
The pelagic habitat of the North Sea is dominated by the difference between the mixed waters in the southern and eastern parts of the region and the stratified waters in the north. Pelagic organisms are also affected by the frontal dynamics of the sea. Many of these fronts are semi-permanent.
Figure 6.1.10‡‡‡ The probability of thermal fronts in summer in the North Sea. Red = 100% and blue = 0%. Remote sensing data 1999–2011.
(Plymouth Marine Laboratory.)
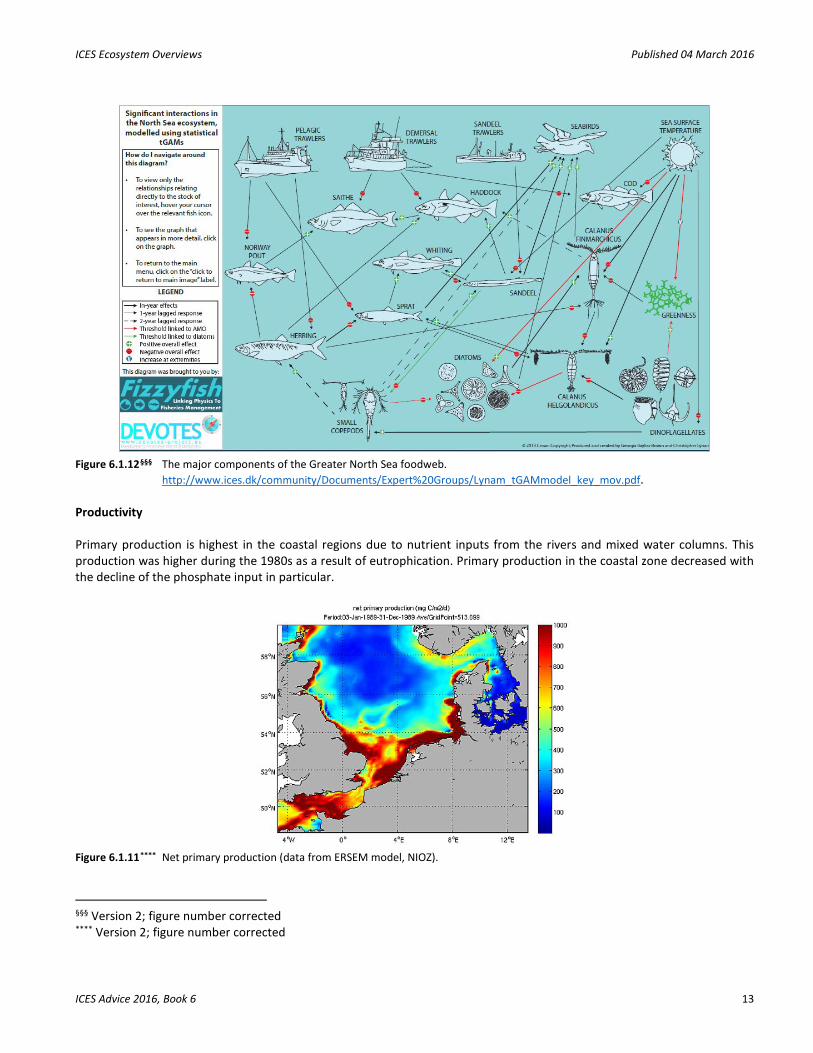
Foodwebs Characteristics of the North Sea foodweb are a high production by autotrophic organisms which in turn are consumed by zooplankton and benthos, followed by fish, seabirds, and mammals. The North Sea foodweb is one of the most studied ones in the ICES area. In the past big fish, including elasmobranchs, were major predators in the ecosystem. The North Sea foodweb can now be considered as perturbed as many of these big fish are either absent or present only in reduced numbers. The recovering of these big fish populations will likely have consequences for the large forage fish populations in the North Sea (herring, sprat, sandeel, and Norway pout).
‡‡‡ Version 2; figure number corrected
ICES Ecosystem Overviews Published 04 March 2016
ICES Advice 2016, Book 6 13
Figure 6.1.12§§§ The major components of the Greater North Sea foodweb.
http://www.ices.dk/community/Documents/Expert%20Groups/Lynam_tGAMmodel_key_mov.pdf. Productivity Primary production is highest in the coastal regions due to nutrient inputs from the rivers and mixed water columns. This production was higher during the 1980s as a result of eutrophication. Primary production in the coastal zone decreased with the decline of the phosphate input in particular.
Figure 6.1.11**** Net primary production (data from ERSEM model, NIOZ).
§§§ Version 2; figure number corrected **** Version 2; figure number corrected
Published 04 March 2016 ICES Ecosystem Overviews
14 ICES Advice 2016, Book 6
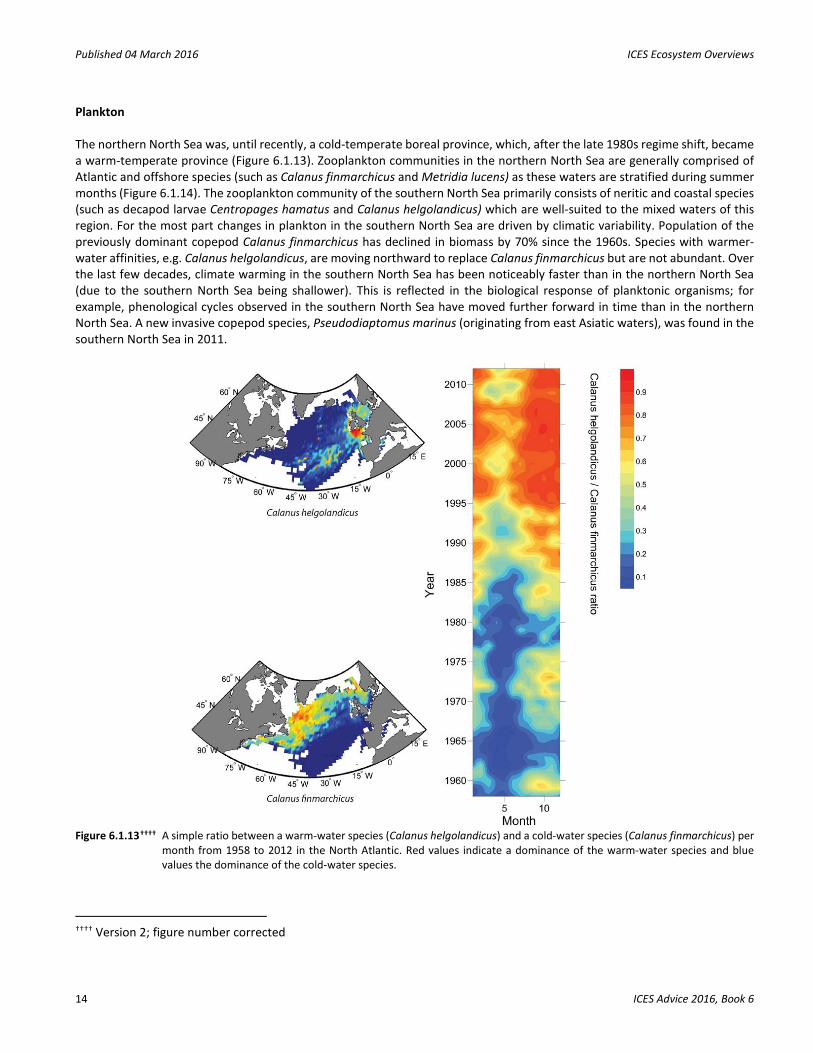
Plankton The northern North Sea was, until recently, a cold-temperate boreal province, which, after the late 1980s regime shift, became a warm-temperate province (Figure 6.1.13). Zooplankton communities in the northern North Sea are generally comprised of Atlantic and offshore species (such as Calanus finmarchicus and Metridia lucens) as these waters are stratified during summer months (Figure 6.1.14). The zooplankton community of the southern North Sea primarily consists of neritic and coastal species (such as decapod larvae Centropages hamatus and Calanus helgolandicus) which are well-suited to the mixed waters of this region. For the most part changes in plankton in the southern North Sea are driven by climatic variability. Population of the previously dominant copepod Calanus finmarchicus has declined in biomass by 70% since the 1960s. Species with warmer-water affinities, e.g. Calanus helgolandicus, are moving northward to replace Calanus finmarchicus but are not abundant. Over the last few decades, climate warming in the southern North Sea has been noticeably faster than in the northern North Sea (due to the southern North Sea being shallower). This is reflected in the biological response of planktonic organisms; for example, phenological cycles observed in the southern North Sea have moved further forward in time than in the northern North Sea. A new invasive copepod species, Pseudodiaptomus marinus (originating from east Asiatic waters), was found in the southern North Sea in 2011.
Figure 6.1.13†††† A simple ratio between a warm-water species (Calanus helgolandicus) and a cold-water species (Calanus finmarchicus) per
month from 1958 to 2012 in the North Atlantic. Red values indicate a dominance of the warm-water species and blue values the dominance of the cold-water species.
†††† Version 2; figure number corrected
ICES Ecosystem Overviews Published 04 March 2016
ICES Advice 2016, Book 6 15
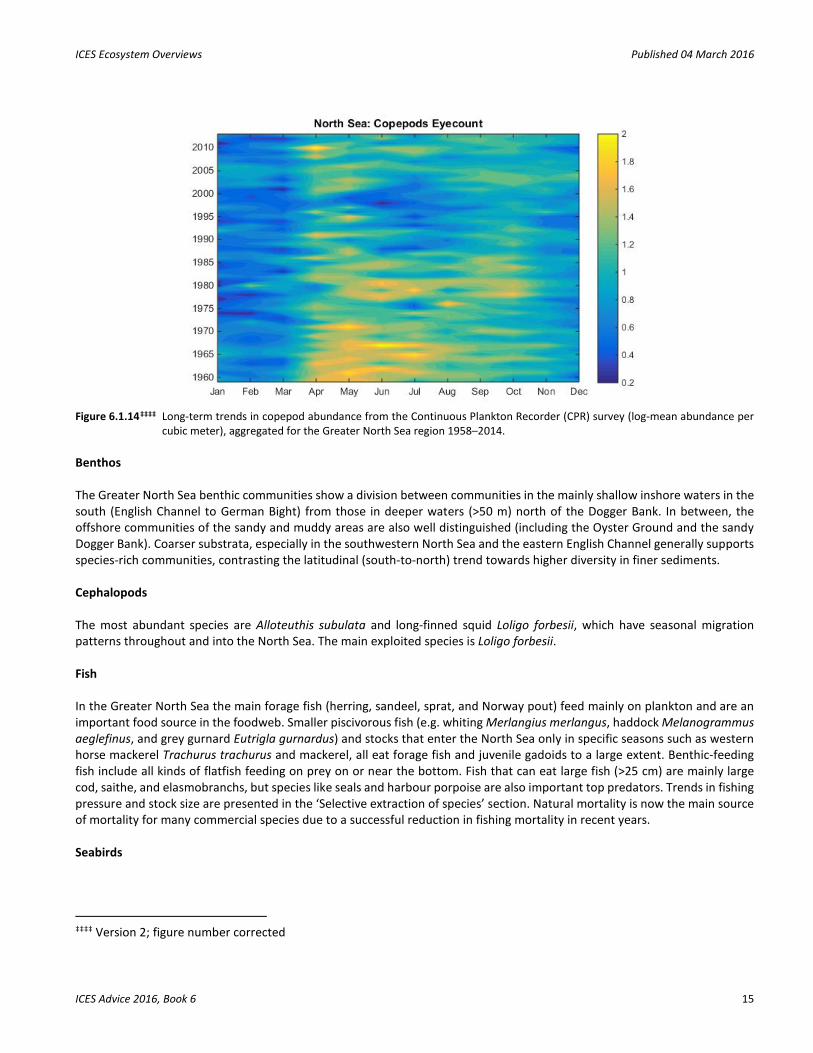
Figure 6.1.14‡‡‡‡ Long-term trends in copepod abundance from the Continuous Plankton Recorder (CPR) survey (log-mean abundance per
cubic meter), aggregated for the Greater North Sea region 1958–2014. Benthos The Greater North Sea benthic communities show a division between communities in the mainly shallow inshore waters in the south (English Channel to German Bight) from those in deeper waters (>50 m) north of the Dogger Bank. In between, the offshore communities of the sandy and muddy areas are also well distinguished (including the Oyster Ground and the sandy Dogger Bank). Coarser substrata, especially in the southwestern North Sea and the eastern English Channel generally supports species-rich communities, contrasting the latitudinal (south-to-north) trend towards higher diversity in finer sediments. Cephalopods The most abundant species are Alloteuthis subulata and long-finned squid Loligo forbesii, which have seasonal migration patterns throughout and into the North Sea. The main exploited species is Loligo forbesii. Fish In the Greater North Sea the main forage fish (herring, sandeel, sprat, and Norway pout) feed mainly on plankton and are an important food source in the foodweb. Smaller piscivorous fish (e.g. whiting Merlangius merlangus, haddock Melanogrammus aeglefinus, and grey gurnard Eutrigla gurnardus) and stocks that enter the North Sea only in specific seasons such as western horse mackerel Trachurus trachurus and mackerel, all eat forage fish and juvenile gadoids to a large extent. Benthic-feeding fish include all kinds of flatfish feeding on prey on or near the bottom. Fish that can eat large fish (>25 cm) are mainly large cod, saithe, and elasmobranchs, but species like seals and harbour porpoise are also important top predators. Trends in fishing pressure and stock size are presented in the ‘Selective extraction of species’ section. Natural mortality is now the main source of mortality for many commercial species due to a successful reduction in fishing mortality in recent years. Seabirds
‡‡‡‡ Version 2; figure number corrected

Published 04 March 2016 ICES Ecosystem Overviews
16 ICES Advice 2016, Book 6
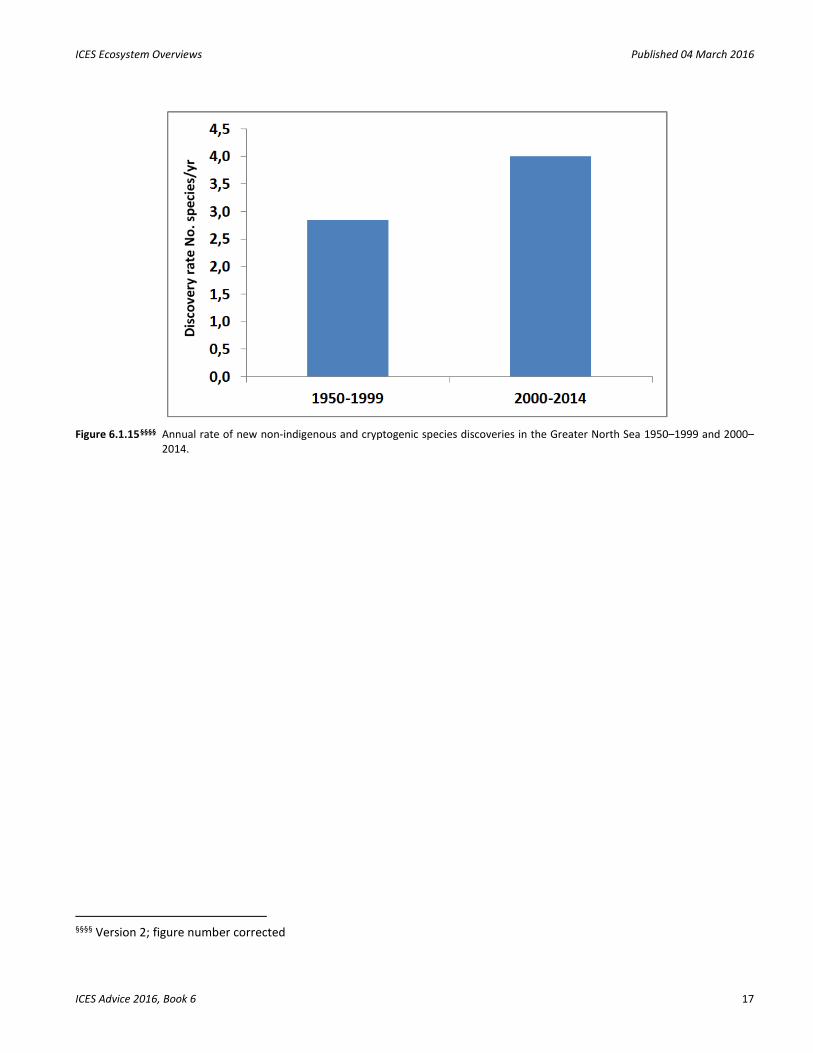
At least 19 species of seabird breed on the coasts of the Greater North Sea, in particular large numbers of northern gannet Morus bassanus, herring gull Larus argentatus, lesser black-backed gull Larus fuscus, black-legged kittiwake Rissa tridactyla, and common guillemot Uria aalge. Broadly, the numbers of breeding seabirds increased until about 2000, after which there was a decline. The North Sea is used for feeding, both by breeding species on its coasts and by birds from further afield during the non-breeding season. Immigrants during winter from the north and east are of particular note. Numbers of some of these immigrants have been declining, possibly due to milder winters, meaning that these migrants can remain in waters closer to their breeding grounds. Marine mammals Two species of seal occur commonly in the North Sea: grey seal Halichoerus grypus and harbour seal Phoca vitulina. Four cetacean species occur commonly or are resident: minke whale Balaenoptera acutorostrata, harbour porpoise Phocoena phocoena, white-beaked dolphin Lagenorhynchus albirostris, and bottlenose dolphin Tursiops truncatus. A further five species are considered regular but less common, short-beaked common dolphin Delphinus delphis, Atlantic white-sided dolphin Lagenorhynchus acutus, long-finned pilot whale Globicephala melas, killer whale Orcinus orca, and Risso’s dolphin Grampus griseus. Both seal species have gone through large population changes over the past century. The abundance of harbour seals reached an all-time low in the 1970s but subsequently increased steadily at an annual rate of 4%; however, this increase was affected by two major interruptions due to outbreaks of the phocine distemper virus (PDV) in 1988 and 2002. Over the last 15 years, declines in the harbour seal population have occurred in the northwestern North Sea. The reasons for these recent declines are unknown, although they are thought to be different in different areas. Grey seals occur predominantly along the British coasts of the North Sea and have been increasing at an annual rate of up to 10%. Trends in the abundance of cetaceans are less well known, but it is known that the centre of summer distribution of harbour porpoises moved southwards between 1994 and 2005, possibly in response to changes in availability of main prey. Minke whales and white-beaked dolphins are found mainly in the northern North Sea, with no obvious changes in distribution between the two surveys. The resident population of bottlenose dolphins lives along the coasts of eastern Scotland and is considered to be stable or increasing. Trends in non-indigenous species This ecoregion has 274 non-indigenous (NIS) and cryptogenic (obscure or of unknown origin) species. The majority (142 species) arrived between 1950 and 1999, with 60 species arriving since the beginning of the 21st century. Since 2000, a total of 21 new species have been recorded, all of which are new to Europe. The discovery rate increased between 1950–1999 and 2000–2014 (Figure 6.1.15). The main vector for primary introductions is vessels, either through ballast water or hull fouling, followed by aquaculture. Natural spread from neighbouring countries is considered to account for a third of the introduced species. The observed ecological impacts include significant reductions in the abundance of several important native species and changes to the physical and chemical composition of both sediments and the water column. Additional impacts include: out-competing native commercial species, fouling of aquaculture and fishing gear, and fish kills through toxin production. However, some NIS are considered as valuable resources.
ICES Ecosystem Overviews Published 04 March 2016
ICES Advice 2016, Book 6 17
Figure 6.1.15§§§§ Annual rate of new non-indigenous and cryptogenic species discoveries in the Greater North Sea 1950–1999 and 2000–
2014.
§§§§ Version 2; figure number corrected
Published 04 March 2016 ICES Ecosystem Overviews
18 ICES Advice 2016, Book 6
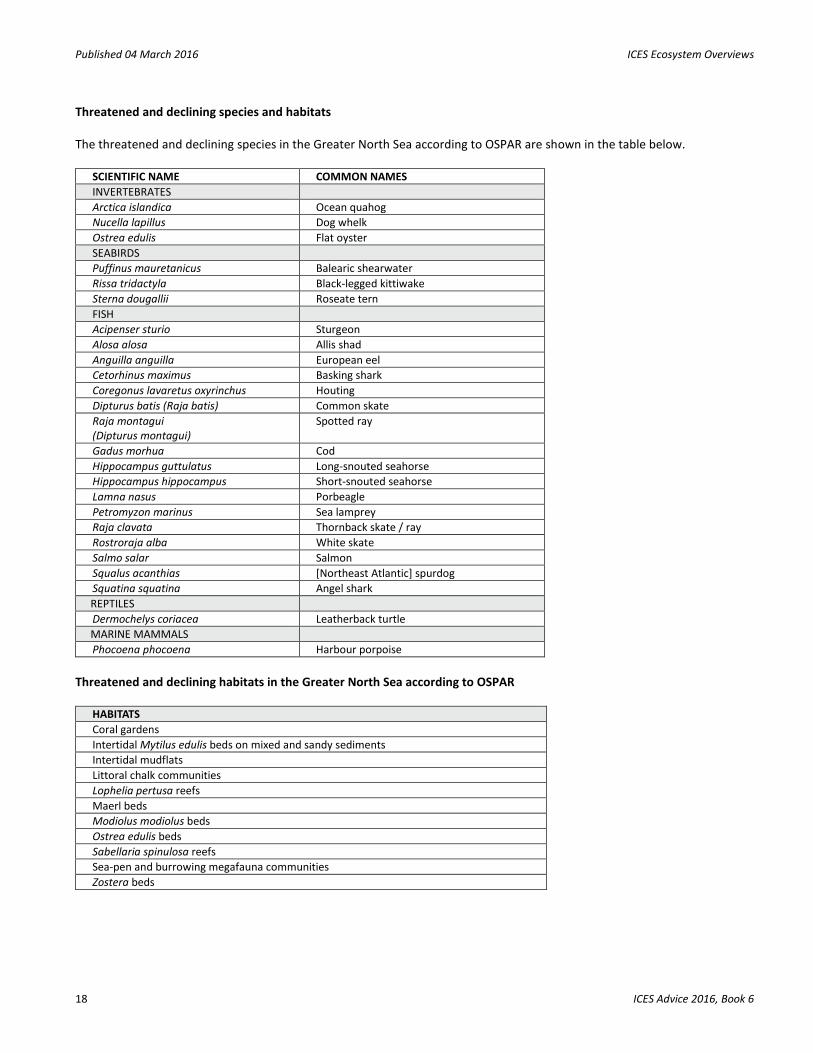
Threatened and declining species and habitats The threatened and declining species in the Greater North Sea according to OSPAR are shown in the table below.
SCIENTIFIC NAME COMMON NAMES INVERTEBRATES Arctica islandica Ocean quahog Nucella lapillus Dog whelk Ostrea edulis Flat oyster SEABIRDS Puffinus mauretanicus Balearic shearwater Rissa tridactyla Black-legged kittiwake Sterna dougallii Roseate tern FISH Acipenser sturio Sturgeon Alosa alosa Allis shad Anguilla anguilla European eel Cetorhinus maximus Basking shark Coregonus lavaretus oxyrinchus Houting Dipturus batis (Raja batis) Common skate Raja montagui (Dipturus montagui)
Spotted ray
Gadus morhua Cod Hippocampus guttulatus Long-snouted seahorse Hippocampus hippocampus Short-snouted seahorse Lamna nasus Porbeagle Petromyzon marinus Sea lamprey Raja clavata Thornback skate / ray Rostroraja alba White skate Salmo salar Salmon Squalus acanthias [Northeast Atlantic] spurdog Squatina squatina Angel shark REPTILES Dermochelys coriacea Leatherback turtle MARINE MAMMALS Phocoena phocoena Harbour porpoise
Threatened and declining habitats in the Greater North Sea according to OSPAR
HABITATS Coral gardens Intertidal Mytilus edulis beds on mixed and sandy sediments Intertidal mudflats Littoral chalk communities Lophelia pertusa reefs Maerl beds Modiolus modiolus beds Ostrea edulis beds Sabellaria spinulosa reefs Sea-pen and burrowing megafauna communities Zostera beds
ICES Ecosystem Overviews Published 04 March 2016
ICES Advice 2016, Book 6 19
Sources and acknowledgments The content for the ICES regional ecosystem overviews is based on information and knowledge generated by the following ICES processes: Workshop on Benchmarking Integrated Ecosystem Assessment (WKBEMIA) 2012, ACOM/SCICOM Workshop on Ecosystem Overviews (WKECOVER) 2013, Workshop to draft advice on Ecosystem Overviews (WKDECOVER) 2013, and Advice drafting group to finalize draft Ecosystem Overviews (ADGECO) 2015, which provided the theoretical framework and final layout of the documents. The ICES integrated ecosystem assessment working group Working Group on Integrated Assessments of the North Sea (WGINOSE) contributed to the main sections of this overview. The following working groups contributed to draft the subsections on the state of the ecosystem components: Benthos Ecology Working Group (BEWG), Working Group on Multispecies Assessment Methods (WGSAM), Working Group on Zooplankton Ecology (WGZE), Working Group on Cephalopod Fisheries and Life History (WGCEPH), Working Group on Marine Mammal Ecology (WGMME), and Working Group on Introductions and Transfers of Marine Organisms (WGITMO). The maps and GIS products were produced by the ICES Secretariat using data from:
1. Exclusive Economic Zones. Marineregions.org (VLIZ). 2. Offshore Wind-farms. OSPAR Commission. 3. Depth Contours. General Bathymetric Chart of the Oceans (GEBCO). 4. Natura 2000. European Commission. 5. Ecoregions. International Council for the Exploration of the Sea (ICES). 6. Ports. Global Shipping Lanes and Harbors (ESRI). 7. Cities. World Cities (ESRI). 8. Rivers. WISE Large Rivers and large lakes. European Environment Agency (EEA). 9. ICES Areas. International Council for the Exploration of the Sea (ICES). 10. Catchment Area. European Environment Agency (EEA). European Topic Centre on Inland, Coastal and Marine waters
(ETC/ICM). 11. Substrate maps. EU EMODNET seabed habitats; www.emodnet-seabedhabitats.eu. 12. Non indigenous species. AquaNIS; http://www.corpi.ku.lt/databases/index.php/aquanis.
Sources and references Alheit, J., Möllmann, C., Dutz, J., Kornilovs, G., Loewe, P., Mohrholz, V., and Wasmund, N. 2005. Synchronous regime shifts in the central Baltic and the North Sea in the late 1980s. ICES Journal of Marine Science, 62: 1205–1215. doi:10.1016/j.icesjms.2005.04.024.
Batsleer, J., Rijnsdorp, A. D., Hamon, K. G., van Overzee, H. M. J., and Poos, J. J. 2016. Mixed fisheries management: Is the ban on discarding likely to promote more selective and fuel efficient fishing in the Dutch flatfish fishery? Fisheries Research, 174: 118–128. doi:10.1016/j.fishres.2015.09.006.
Beaugrand, G. 2004. The North Sea regime shift: evidence, causes, mechanisms and consequences. Progress in Oceanography, 60(2-4): 245–262.
Beaugrand, G., Brander, K. M., Lindley, J. A., Souissi, S., and Reid, P. C. 2003. Plankton effect on cod recruitment in the North Sea. Nature, 426: 661–664. doi:10.1038/nature02164.
Bonnet, D., Richardson, A., Harris, R., Hirst, A., Beaugrand, G., Edwards, M., Ceballos, S., et al. 2005. An overview of Calanus helgolandicus ecology in European waters. Progress in Oceanography, 65(1): 1–53. doi:10.1016/j.pocean.2005.02.002.
Carlotti, F., and Radach, G. 1996. Seasonal dynamics of phytoplankton and Calanus finmarchicus in the North Sea as revealed by a coupled one-dimensional model. Limnology and Oceanography, 41(3): 522–539.
Collie, J. S., Hall, S. J., Kaiser, M. J., and Poiner, I. R. 2000. A quantitative analysis of fishing impacts on shelf-sea benthos. Journal of Animal Ecology, 69(5): 785–798.
Published 04 March 2016 ICES Ecosystem Overviews
20 ICES Advice 2016, Book 6
Daan, N., Bromley, P. J., Hislop, J. R. G., and Nielsen, N. A. 1990. Ecology of North Sea fish. Netherlands Journal of Sea Research, 26(2-4): 343–386.
Daan, N., Gislason, H., Pope, J. G., and Rice, J. C. 2005. Changes in the North Sea fish community: evidence of indirect effects of fishing? ICES Journal of Marine Science, 62(2): 177–188. doi: 10.1016/j.icesjms.2004.08.020.
Dickey-Collas, M., Engelhard, G. H., Rindorf, A., Raab, K., Smout, S., Aarts, G., van Deurs, M., et al. 2014. Ecosystem-based management objectives for the North Sea: riding the forage fish rollercoaster. ICES Journal of Marine Science, 71(1): 128–142. doi:10.1093/icesjms/fst075.
Dulvy, N. K., and Reynolds, J. D. 2002. Predicting extinction vulnerability in skates. Conservation Biology, 16(2): 440–450.
Dulvy, N. K., Metcalfe, J. D., Glanville, J., Pawson, M. G., and Reynolds, J. D. 2000. Fishery stability, local extinctions, and shifts in community structure in skates. Conservation Biology, 14(1): 283–293.
Edwards, M., and Richardson, A. J. 2004. Impact of climate change on marine pelagic phenology and trophic mismatch. Nature, 430(7002): 881–884.
Edwards, M., Beaugrand, G., Reid, P. C., Rowden, A. A., and Jones, M. B. 2002. Ocean climate anomalies and the ecology of the North Sea. Marine Ecology Progress Series, 239: 1–10.
Edwards, M., Helaouet, P., Johns, D. G., Batten, S., Beaugrand, G., Chiba, S., Hall, J., et al. 2014. Global Marine Ecological Status Report: results from the global CPR survey 2012/2013. SAHFOS Technical Report, 10: 1–37. Plymouth, U.K. ISSN 1744-0750.
Engelhard, G. H., Peck, M. A., Rindorf, A., Smout, S. C., van Deurs, M., Raab, K., Andersen, K. H., et al. 2014. Forage fish, their fisheries, and their predators: who drives whom? ICES Journal of Marine Science, 71(1): 90–104. doi:10.1093/icesjms/fst087.
Fässler, S. M. M., Payne, M. R., Brunel, T., and Dickey-Collas, M. 2011. Does larval mortality influence population dynamics? An analysis of North Sea herring (Clupea harengus) time series. Fisheries Oceanography, 20(6): 530–543. doi:10.1111/j.1365-2419.2011.00600.x.
Fransz, H. G., Colebrook, J. M., Gamble, J. C., and Krause, M. 1991. The zooplankton of the North Sea. Netherlands Journal of Sea Research, 28(1–2): 1–52. doi:10.1016/0077-7579(91)90003-J.
Gollasch, S. 2002. The importance of ship hull fouling as a vector of species introductions into the North Sea. Biofouling, 18(2): 105–121.
Greenstreet, S. P. R., and Rogers, S. I. 2006. Indicators of the health of the North Sea fish community: identifying reference levels for an ecosystem approach to management. ICES Journal of Marine Science, 63(4): 573–593.
Greenstreet, S. P. R., Rogers, S. I., Rice, J. C., Piet, G. J., Guirey, E. J., Fraser, H. M., and Fryer, R. J. 2011. Development of the EcoQO for the North Sea fish community. ICES Journal of Marine Science, 68(1): 1–11. doi: 10.1093/icesjms/fsq156.
Hammond, P. S., Berggren, P., Benke, H., Borchers, D. L., Collet, A., Heide-Jørgensen, M. P., Heimlich, S., et al. 2002. Abundance of harbour porpoise and other cetaceans in the North Sea and adjacent waters. Journal of Applied Ecology, 39: 361–376. doi: 10.1046/j.1365-2664.2002.00713.x.
Heessen, H. J. L., and Daan, N. 1996. Long-term trends in ten non-target North Sea fish species. ICES Journal of Marine Science, 53(6): 1063–1078.
Howarth, R. W., Billen, G., Swaney, D., Townsend, A., Jaworski, N., Lajtha, K., Downing, J. A., et al. 1996. Regional nitrogen budgets and riverine N & P fluxes for the drainages to the North Atlantic Ocean: Natural and human influences. Biogeochemistry, 35(1): 75–139. doi: 10.1007/BF02179825.
ICES. 2012. Report of the Workshop on Benchmarking Integrated Ecosystem Assessments (WKBEMIA), 27–29 November 2012, ICES Headquarters, Copenhagen, Denmark. ICES CM 2012/SSGRSP:08. 28 pp.
ICES. 2013a. Report of the Working Group on the ICES ACOM/SCICOM Workshop on Ecosystem Overviews (WKECOVER), 7–11 January 2013, ICES HQ, Copenhagen, Denmark. ICES CM 2013/ACOM/SCICOM:01. 131 pp.
ICES Ecosystem Overviews Published 04 March 2016
ICES Advice 2016, Book 6 21
ICES. 2013b. Report of the ICES Workshop to draft Advice on Ecosystem Overviews (WKDECOVER), 4–7 November, ICES HQ, Copenhagen. ICES CM 2013/ACOM/SCICOM:03. 11 pp.
ICES. 2013c. Report of the Working Group on Integrated Assessments of the North Sea (WGINOSE), 11–15 February 2013, Lisbon, Portugal. ICES CM 2013/SSGRSP:04. 76.pp.
ICES. 2014. Report of the Working Group on the Ecosystem Effects of Fishing Activities (WGECO), 8–15 April 2014, Copenhagen, Denmark. ICES CM 2014/ACOM:26. 172 pp.
ICES. 2015a. ICES glossary of principal pressures in ICES ecoregions. http://www.ices.dk/sites/pub/Publication%20Reports/Advice/2016/2016/Pressure_Glossary_for_ecosystem_overviews.pdf.
ICES. 2015b. Indicators 5, 6, and 7 of DCF Annex XII. In Report of the ICES Advisory Committee, 2015. ICES Advice 2015, Book 1, Section 1.6.1.4.
ICES. 2015c. Interim Report of the Benthos Ecology Working Group (BEWG), 4–8 May 2015, Calvi, Corsica, France. ICES CM 2015/SSGEPD:10. 64 pp.
ICES. 2015d. Interim Report of the Working Group on Zooplankton Ecology (WGZE), 16–19 March 2015, Plymouth, UK. ICES CM 2015/SSGEPD:05. 44 pp.
ICES. 2015e. Report of the Working Group on Marine Mammal Ecology (WGMME), 9–12 February 2015, London, UK. ICES CM 2015/ACOM:25. 114 pp.
ICES. 2015f. Report of the Working Group on Introductions and Transfers of Marine Organisms (WGITMO), 18–20 March 2015, Bergen, Norway. ICES CM 2015/SSGEPI:10. 195 pp.
Jennings, S., and Kaiser, M. J. 1998. The effects of fishing on marine ecosystems. Advances in Marine Biology, 34: 201–212, 212e, 213–352. doi:10.1016/S0065-2881(08)60212-6.
Kaiser, M. J., and Spencer, B. E. 1996. The effects of beam-trawl disturbance on infaunal communities in different habitats. Journal of Animal Ecology, 65(3): 348–358.
ODEMM. Options for Delivering Ecosystem-Based Marine Management. https://www.liverpool.ac.uk/odemm/ and http://www.odemm.com/.
OSPAR. 2010. Quality Status Report. OSPAR Commission, London. 176 pp.
Perry, A. L., Low, P. J., Ellis, J. R., and Reynolds, J. D. 2005. Climate change and distribution shifts in marine fishes. Science, 308(5730): 1912–1915. 22 February 2005; accepted 28 April 2005. Published online 12 May 2005; 10.1126/science.1111322.
Peschko, V., Ronnenberg, K., Siebert, U., and Gilles, A. 2016. Trends of harbour porpoise (Phocoena phocoena) density in the southern North Sea. Ecological Indicators, 60: 174–183. doi: 10.1016/j.ecolind.2015.06.030.
Petitgas, P., Alheit, J., Peck, M. A., Raab, K., Irigoien, X., Huret, M., van der Kooij, J., et al. 2012. Anchovy population expansion in the North Sea. Marine Ecology Progress Series, 444: 1–13. doi: 10.3354/meps09451.
Planque, B., and Fromentin, J.M. 1996. Calanus and environment in the eastern North Atlantic. 1. Spatial and temporal patterns of C. finmarchicus and C. helgolandicus. Marine Ecology Progress Series, 134(1–3): 101–109.
Reid, P. C., Borges, M. F., and Svendsen, E. 2001. A regime shift in the North Sea circa 1988 linked to changes in the North Sea horse mackerel fishery. Fisheries Research, 50(1–2): 163–171. doi:10.1016/S0165-7836(00)00249-6.
Rijnsdorp, A. D., Van Leeuwen, P. I., Daan, N., and Heessen, H. J. L. 1996. Changes in abundance of demersal fish species in the North Sea between 1906–1909 and 1990–1995. ICES Journal of Marine Science, 53(6): 1054–1062.
Rochet, M. J., and Trenkel, V. M. 2003. Which community indicators can measure the impact of fishing? A review and proposals. Canadian Journal of Fisheries and Aquatic Sciences, 60(1): 86–99.
Published 04 March 2016 ICES Ecosystem Overviews
22 ICES Advice 2016, Book 6
STECF. 2013a. Scientific, Technical and Economic Committee for Fisheries (STECF) – Evaluation of Fishing Effort Regimes in European Waters – Part 2 (STECF-13-21). Publications Office of the European Union, Luxembourg, EUR 26327 EN, JRC86088. 863 pp.
STECF. 2013b. Scientific, Technical and Economic Committee for Fisheries (STECF) – Landing obligation in EU fisheries (STECF-13-23). Publications Office of the European Union, Luxembourg, EUR 26330 EN, JRC 8611. 115 pp.
Stevens, J. D., Bonfil, R., Dulvy, N. K., and Walker, P. A. 2000. The effects of fishing on sharks, rays, and chimaeras (chondrichthyans), and the implications for marine ecosystems. ICES Journal of Marine Science, 57(3): 476–494. doi: 10.1006/jmsc.2000.0724.
Tasker, M. L., Camphuysen, C. J., Cooper, J., Garthe, S., Montevecchi, W. A., and Blaber, S. J. M. 2000. The impacts of fishing on marine birds. ICES Journal of Marine Science, 57(3): 531–547. doi:10.1006/jmsc.2000.00714.
Thrush, S. F., and Dayton, P. K. 2002. Disturbance to marine benthic habitats by trawling and dredging: Implications for marine biodiversity. Annual Review of Ecology and Systematics, 33: 449–473.
Votier, S. C., Furness, R. W., Bearhop, S., Crane, J. E., Caldow, R. W. G., Catry, P., Ensor, K., et al. 2004. Changes in fisheries discard rates and seabird communities. Nature, 427(6976): 727–730. doi:10.1038/nature02315.
Wiltshire, K. H., and Manly, B. F. J. 2004. The warming trend at Helgoland Roads, North Sea: Phytoplankton response. Helgoland Marine Research, 58(4): 269–273.