Embed Size (px)
Citation preview

A 6-Step Guide to
Implementing
Industrial Internet of
Things (IIoT) in
Manufacturing Start Small, Think Big, Move Fast

© SensrTrx 2020 2
Table of Contents
About This Guide: Why Implement IIoT? Our Approach: Start Small, Think Big, Move Fast
Step 1 – Where Do You Begin with IIoT?
Step 2 – Evaluate Your Machines.
Step 3 – What Data Do You Need?
Step 4 – How Do You Gather That Data?
Step 5 – You’ve Got the Data, Now Solve a Problem.
Step 6 – Apply What You’ve Learned and Run with It.
Achieve ROI
Conclusion
Resources

© SensrTrx 2020 3
About This Guide
The goal of this guide is to assist manufacturers with the implementation of IIoT
(Industrial Internet of Things) on the plant floor to solve business challenges. With the
right data and the right tools to visualize your data, IIoT projects can connect your
machines and empower you to help solve many of the manufacturing challenges
affecting productivity.
For almost every manufacturer, IIoT is the first step in gaining greater plant floor
visibility. By connecting to machines and gathering the necessary data, you can see
when your machines are running, when they are down, and why.
Let’s start with why IIoT is important. The adoption of IIoT provides many benefits,
including plant floor visibility. It’s an opportunity for small, large, and any manufacturers
in between, to drive connectivity in the factory.
IIoT provides cost-saving benefits with many companies seeing a return on investment
within a few weeks or months, allows employees to concentrate on other problematic
areas, and generates increased productivity and efficiency.
The benefits of IIoT, specifically manufacturing analytics, are immense. The focus is to
not only fix any issues or areas of concern but to implement IIoT to create a connected
factory floor that will lead to continuous improvement and growth.

© SensrTrx 2020 4
Our Approach
Start Small, Think Big, Move Fast
To begin implementing IIoT, it is important to first consider how your factory floor can
improve to a point of increased productivity and efficiency. “What are your challenges?”
Perhaps you’ve struggled with excel and paper as the primary way to collect data or you
have an ERP system that allows for the input of data, but it isn’t accurate and doesn’t
detect downtime automatically. Others may want real-time OEE (Overall Equipment
Efficiency) metrics, quality counts or scrap, or are hoping to lay the foundation for
predictive maintenance.
With the help of this 6-step guide, you will define your challenges and areas for growth,
gather data, and apply the data to gain insights into how to solve your problems by
understanding the IIoT implementation approach we take for our customers.
We believe in a “start small, think big, move fast” approach when implementing IIoT on
the plant floor. It’s okay to start small but start ASAP. Then, once you’ve solved one
problem, move to continuously improve the rest of your plant floor. This approach
focuses on determining where you can make improvements through IIoT by following a
6-step process:
1. Determine where you can achieve improvement and growth on the plant floor,
either through solving a business problem or improving processes. In other
words, “What are you trying to accomplish?”
2. Evaluate your machines. Determine not only the machines or cells that are
having issues but those that are performing well, too, for comparison.
3. Identify the critical data points you need to solve that problem.
4. Determine how to obtain that data using IIoT.
5. Gather insights from the data collected, solve your problem, and improve a
process.
© SensrTrx 2020 5
6. Optimize your factory floor by continually moving to improve and scale your
processes, machines, lines, or cells. In other words, rinse and repeat.
This 6-step guide will outline the ways to gather data from your machines, and
operators, too, on the plant floor, how to get the most out of that data, and how to
optimize your factory floor.
Let’s get started.

© SensrTrx 2020 6
Step 1 – Where Do You Begin with IIoT?
IIoT was established as a derivative of IoT, the Internet of Things. Essentially, IoT is a
system of interconnected devices that allows for the transfer of data from source to
source. IIoT specifically relates to the industrial and manufacturing sectors.
In this paper, we will specifically refer to IIoT in relation to manufacturing productivity
and how to improve processes to gain the data needed to make decisions.
IIoT helps manufacturers gain visibility on the floor, but what does that mean for you?
Visibility is the insight into how your machines and manufacturing processes are
running, when they are down, and why. It’s replacing Excel-based reporting and being
able to see and stop problems as they’re happening in real-time. Visibility gives you the
ability to solve the problems and challenges impacting the efficiency and productivity of
your plant floor.
IIoT offers several solutions that help you gain visibility. One of those solutions is
manufacturing analytics. While we will discuss IIoT and manufacturing analytics more
in-depth throughout this guide, it’s important to have a broad understanding of the
capabilities of the software before moving on.
A true manufacturing analytics software is designed to provide visibility on the factory
floor by acquiring data from the machines on the floor, cleaning and contextualizing that
data, calculating KPI’s, and producing role-based visualizations and dashboards. With
data in context, you can gain actionable insights that will help you improve your
manufacturing processes.
Bringing manufacturing analytics to the factory floor tackles four common issues your
company may be faced with regularly – lack of visibility, persistent downtime issues, low
quality, and changeovers.
© SensrTrx 2020 7
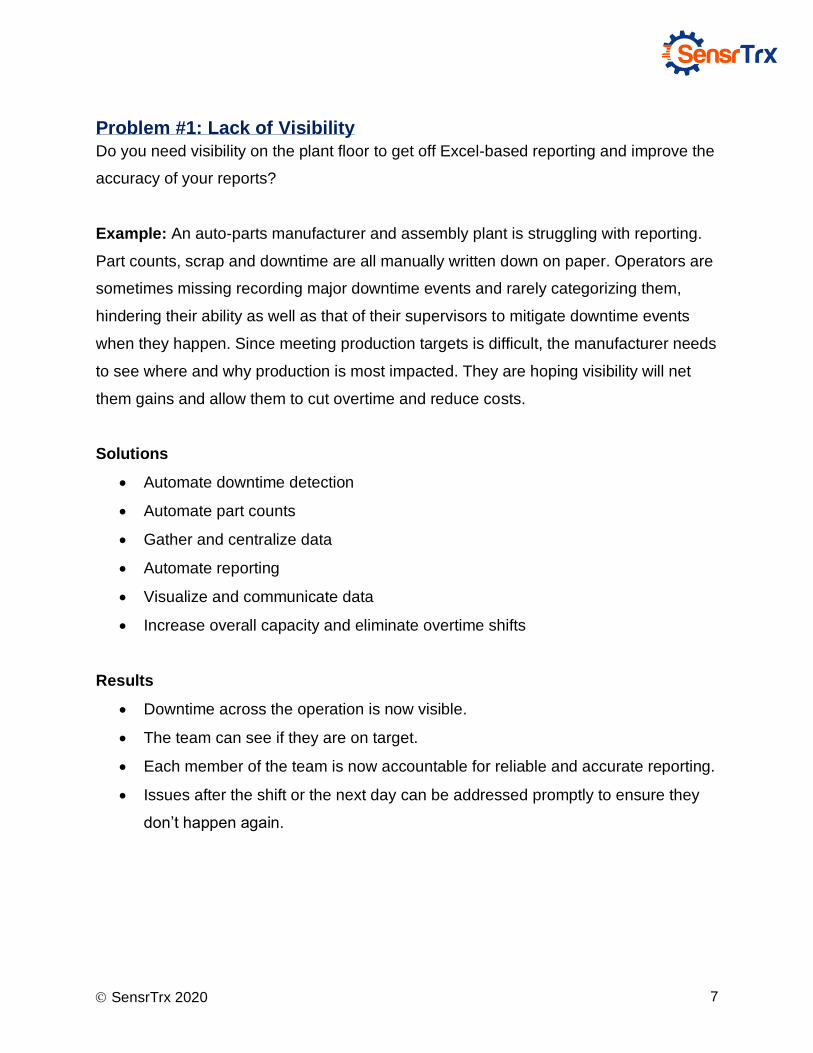
Problem #1: Lack of Visibility
Do you need visibility on the plant floor to get off Excel-based reporting and improve the
accuracy of your reports?
Example: An auto-parts manufacturer and assembly plant is struggling with reporting.
Part counts, scrap and downtime are all manually written down on paper. Operators are
sometimes missing recording major downtime events and rarely categorizing them,
hindering their ability as well as that of their supervisors to mitigate downtime events
when they happen. Since meeting production targets is difficult, the manufacturer needs
to see where and why production is most impacted. They are hoping visibility will net
them gains and allow them to cut overtime and reduce costs.
Solutions
• Automate downtime detection
• Automate part counts
• Gather and centralize data
• Automate reporting
• Visualize and communicate data
• Increase overall capacity and eliminate overtime shifts
Results
• Downtime across the operation is now visible.
• The team can see if they are on target.
• Each member of the team is now accountable for reliable and accurate reporting.
• Issues after the shift or the next day can be addressed promptly to ensure they
don’t happen again.

© SensrTrx 2020 8
Problem #2: Persistent Downtime Issues
Do you need to mitigate downtime and capacity issues in real-time?
Example: In a food processing plant, the plant manager is faced with many downtime
and capacity issues. He knows that the biggest bottleneck is his packaging machine at
the end of the line but isn’t sure what is causing it. Downtime on this critical machine
impacts production considerably thus reducing capacity. While other parts of the
process may impact throughput, this one machine causes the rest of the line to stop.
Solutions
• Automate downtime detection
• Automate or require operator input on downtime reason codes
• Report in real-time significant downtime events
• Visualize data in Pareto charts to see the biggest impacts on availability
Results
• Issues can be seen when they happen by machine/cell or line and addressed in
real-time.
• There is now visibility into why machines are not available.
• Alerts to unacceptable thresholds of downtime, planned or unplanned can be
sent out a soon as they occur, allowing for the problem to be fixed quickly.
• The plant manager can now focus on the top 20% of the causes of roughly 80%
of downtime (utilizing a Pareto) and systematically address those causes.
• It is now possible to determine whether new equipment or an optimized setup
might alleviate the bottleneck.

© SensrTrx 2020 9
Problem #3: Quality is Low
Do you need to address a specific issue with quality standards?
Example: A rope manufacturer has a problem. The plant manager is struggling with a
quality issue in which high scrap is affecting their profit margin. Additionally, fill variation
is causing concern with customers. How can they use IIoT to help manage and solve
these issues?
Solutions
• Automate product counts
• Detect variations in quality
• Pull process data from machines
Results
• It’s now possible to ensure that the plant is up and running at full capacity.
• Quality issues, as they are occurring, can be seen and addressed.
• Leads now have real-time alerts when issues arise on the line.

© SensrTrx 2020 10
Problem #4: Changeovers
Do you need to gain better visibility into how long it’s taking to changeover?
Example: A plastics and resin manufacturer is unsure how long it takes for employees
who are switching out to get the machinery back up and running. The manufacturer
lacks the ability to track changeover time and as a result cannot figure out where
changeovers happen, how long they take, or how frequently they occur. Currently, there
is no plan to fix the issue because there is no data.
Solutions
• Set and track changeovers
• Measure changeovers against a standard
• Once measured, improve changeovers based on the data collected
Results
• Observations into the longest and/or most frequent changeovers are a reality that
will help determine how to reduce those times.
The goal of the examples above is to provide an understanding of why you should, and
need, to implement IIoT and manufacturing analytics. While we touched on a few key
issues, each factory varies and is faced with different problems. It is important not only
to understand what benefits IIoT and manufacturing analytics can provide but for you to
have an understanding of the specific problems that need to be looked at in your plant.
If you are just beginning on the IIoT journey, the first step in implementing smart
technology is identifying the problems you are currently facing. Ask yourself, “What am I
trying to accomplish?”
The answer to that question will determine the trajectory of your IIoT and manufacturing
analytics journey.

© SensrTrx 2020 11
Start by making a list of the problems you are currently facing and potential areas of
growth. This list should include departments, cells, and machines in your factory that
you think could be performing better. Once you have made a list, begin by identifying
the machines that are underperforming and contributing to the problem as well as those
that are performing well. In the next section, we will discuss why it is important to
include both types of machines as well as further dive into your overall goals.

© SensrTrx 2020 12
Step 2 – Evaluate Your Machines
Let’s dive into the thought process behind developing a list of current problems and
growth areas.
Typically, this is the process we follow with all of SensrTrx’s new customers.
Manufacturing analytics software will transform your factory floor but having a goal in
place first will allow you to get the most out of the data you collect.
Start by making a list of all of your cells and machines, identify those machines that are
outperforming the others and those with known issues or bottlenecks. Evaluate how
they are currently performing.
Many of our customers start with 5-10 machines, both good and critical machines or
cells, and then expand the solution to the entire plant over time. Consider the following
questions when making a list:
• Which machines have too much downtime?
• Which cells are having quality issues?
• Are you running overtime to meet customer demand?
• Which part of the line is the bottleneck?
• Where can you reduce changeover time?
While you may think the machines causing problems and challenges are the ones you
need more data from, it is important to gather data from both the problem machines as
well as those performing well.
By identifying a machine or cell that is the root cause of your perceived problem and
another machine or cell that is performing well, you are approaching IIoT with a
balanced goal. You have pre-determined a potential area for improvement which will
allow you to better identify your issue and how to solve it. Consider it a type of

© SensrTrx 2020 13
comparison to determine if the data collected is valid and worth looking into. You will be
able to see the biggest impacts on your productivity through comparison.
Once you have a list of machines you wish to evaluate, think about your data collection
requirements. It’s important to know ahead of time what you’re trying to accomplish and
the data you want to collect. You’ll also want to define how to evaluate the data once it’s
collected to enable data-driven decisions.
Again, don’t forget the big idea is to start small, think big, and move fast. In this
guide, you’ll learn how to implement IIoT and manufacturing analytics methodically and
effectively. Once you’ve done so, you can go back to the beginning of step 1 to continue
to improve your factory floor, one machine or cell at a time.

© SensrTrx 2020 14
Step 3 – What Data Do You Need?
The first step of your journey addressed the potential problems you could be facing –
lack of visibility, persistent downtime issues, low quality, and excessive changeovers.
Those issues helped to determine what to focus on as goal of IIoT implementation.
Based on that goal, you will now determine what data you need.
What data do I need to see if the machine is available? How many parts or products is it
making? If it’s down, why?
With manufacturing analytics software, you will be able to gather the data needed to
answer those questions, review the data with easy-to-read reports and visualizations,
and begin designing an approach to make your factory floor more efficient.
Before getting to the visualization portion of manufacturing analytics, you must
determine what data needs to be gathered from the machines you selected in step 2.
The key to this step is to start and stick to the “baseline” at first. Determine only
what you need to solve the problem you defined in step 2, then once you’ve solved that
problem, you can improve other processes down the road. It’s all a part of the “Start
Small, Think Big, Move Fast” strategy used throughout your IIoT and manufacturing
analytics journey.
At this point, you have a clear understanding of the type of data you need to gather, but
let’s take a moment to go into further detail of the 3 main data points that will provide
you with greater visibility:
Availability - Is the Machine Up or Down and Why?
If you have persistent downtime problems, IIoT can help to solve them. But, to do that,
you must first know when the machine is up or down, determine why, and then apply
what you’ve learned to correct the problem.

© SensrTrx 2020 15
Downtime Considerations
• What types of downtime do you want to track? We strongly suggest tracking
and reporting on both unplanned and planned downtime and determining a
minimum threshold for lingering “micro-stops”.
• Do you want to track specific downtime reasons for this machine? If so, what
are they?
• Can the machine provide automated downtime reasons through error codes?
If you don’t know, skip this part.
• Do you want to collect all downtime including micro or small stops?
By answering these questions, you should be able to determine the best way to
automatically detect downtime. To do so, use the machine cycle I/O device to indicate
when the machine is up or down. For example, if a machine makes 1 part in 10
seconds, a downtime interval of 10 seconds might indicate downtime. Determining the
threshold is important since a little downtime here and there begins to add up.
Performance - Machine Cycles Tracked in Parts/Minute
Performance, or throughput, of a machine is extremely important to a manufacturer’s
ability to deliver to customers on time. The data you collect can measure the actual
cycle time versus the ideal cycle time thus determining where issues may be occurring
and why.
Part Counts
● Can machine cycles be used as a stand-in for a part count (1:1)?
● Does the machine produce co-parts?
● Do you need to track parts by machine or cell?

© SensrTrx 2020 16
Quality - Good and Bad Part Counts
If you have a quality issue, it’s important to have an understanding of what data needs
to be collected to further determine what’s causing it – quality, scrap, process data,
temperature, flow rate, or speed.
Quality
● How can you track the good and bad parts of that machine?
● Can you see good parts vs. bad parts at any point in the production cycle?
Scrap
● Is scrap a concern? If so, how do you usually measure or count scrap?
● Do you want to track defects and scrap reasons?
Process Data
● Do you want to collect process data like vibration and temperature?
● Will this data be used for conditional or predictive maintenance?
The main idea is to determine what the problem is, figure out which machines are
contributing to said problem, and then reiterate what data is needed to achieve the goal
of fixing the problem.
As a side note, gathering and contextualizing data is very important, however, there can
be such as a thing as too much data. We use and refer to an acronym – YAGNI or
“You’re Not Going To Need It” to explain this. Essentially, we’re saying that tracking the
data you need to better your factory floor is vital, but don’t get lost in the numbers and
end up with too much that you don’t know what to act upon.
You can learn more about YAGNI in the resources section of this white paper as well.

© SensrTrx 2020 17
Step 4 – How Do You Gather That Data?
Every machine is different, so how we gather data will be unique as well. The good
news is, it’s easier than you think. While implementing IIoT and manufacturing analytics
is a relatively simple process, it is important to have an understanding of how data will
be gathered and displayed for you and your team.
Refer back to the list of machines you wrote down earlier in step 2 and the list of data
you determined you need to gather in step 3. Both of those lists will be needed to
determine the HOW in this step. By implementing IIoT and manufacturing analytics, you
can gather data from four sources:
1. Machine PLCs
Most modern equipment has programmable PLCs. In many cases, you can connect to
the PLC via Ethernet or a serial connection to pull data like part counts, downtime, or
quality checks. You may need to combine a few pieces of data from the PLC to
determine if it produced a good part, why it was down, or why a part failed a test. If the
PLC cannot provide this information, you should look at an overlay solution.
2. Overlay Solution
The simplest way to gather data from a machine is to use 3rd party nodes or sensors as
an overlay solution. There are two options:
1. Nodes or PLCs that connect to existing sensors and outputs on the machine
2. New sensors like photo eyes to track parts as they are produced
Many of the sensors are battery-operated “peel and stick” sensors that can be installed
very quickly.
3. PC-Based Controllers
Many CNC machines have PC-based controllers and specialized software to run them.
In the last 10 years, many vendors have released MT Connect drivers that allow easy
access to the data. If drivers are not available and the vendor is not willing to share the
information, customers may have to reverse engineer the data by watching the machine

© SensrTrx 2020 18
run. One other challenge with CNCs is they produce so much data that it is difficult to
know what to look at first if a manufacturing analytics solution is not in place.
4. Operators
There may be instances in which data will need to be entered by those operating the
machines, lines, or cells on the factory floor. For example, inputting changeover or
downtime into the analytics software can be the responsibility of the operator. This can
be easily done through an operator dashboard.
© SensrTrx 2020 19
Step 5 – You’ve Got the Data. Now, Solve a
Problem.
At this point, you have identified the machines, their attributes, and the data most
important to you. The data is now collected, but what is your next step?
With that data, you should be able to make well-informed, data-driven decisions to solve
your problem(s) or challenge(s.) This step is the most difficult for the manufacturers not
using an IIoT solution on the plant floor to accomplish.
All of the data you collect would be meaningless if you could not answer the following
questions:
• What part were you running on that machine?
• Who was operating it?
• How many parts were produced?
• Did we have any quality issues?
The data needs to be contextualized so that downtime events are visible by machine,
cell, or line and associated with a specific shift, time of day, and operator. This is made
possible with an IIoT manufacturing analytics solution.
With insight into the data, you’ll be able to answer questions about availability,
performance, and quality such as:
• What was the load & rpm of the spindles?
• Did we produce any scrap?
• Did we change tools?
• What shift was it?
• Who was operating the machine?

© SensrTrx 2020 20
The context you gain will present a potential solution to your problem. But, where does
that insight come from? SensrTrx integrates the data collected from your machines,
lines, or cells into dashboards and scoreboards. When the data is transformed into easy
to understand visualizations, it becomes that much easier to gain insight and solve the
problems you’re faced with.
In the screenshot above, a dashboard provides actionable insights into how your machines are
performing.

© SensrTrx 2020 21
An operator screen, seen above, displays data in real-time to help operators evaluate their
performance and keep on track.
SensrTrx Manufacturing Analytics provides machine cell OEE, downtime, and scrap alerts
optimized for your smartphone, in real-time.

© SensrTrx 2020 22
Gaining plant floor visibility can be transformational, but only if it solves your problem
or challenge. Tracking plant performance metrics can be used to increase capacity,
reduce scrap, downtime, and implement Lean – the possibilities are truly endless.
Once you’re up and running with IIoT, the next step would be to use and apply the
stages you’ve gone through in your IIoT implementation journey into your daily
processes and make sure everyone has access to it. This can be done through:
• A dashboard that compiles and provides visuals of the data, in real-time.
• Scoreboards on the floor that display OEE, availability, performance, and quality
for your operators to view.
• Daily production meetings where you and your team review the data to focus on
future goals.
Once you’re up and running, you’ll learn how to take each problem one step a time and
focus on making your shop floor more productive and efficient. While implementing IIoT
will provide a connected factory floor, the biggest benefit is in the ability to continuously
improve and grow over time. Ready for the final step in IIoT implementation?

© SensrTrx 2020 23
Step 6 – Apply What You’ve Learned and
Run with It.
You’ve fully implemented IIoT and manufacturing analytics and solved your first problem
– congratulations!
Now that you are collecting data and making data-driven decisions, you will be able to
solve any other problems or challenges that arise, all thanks to the implementation of
IIoT and manufacturing analytics.
Remember, each of the following benefits of IIoT and manufacturing analytics can help
reduce cost, improve efficiency, and avoid the 3 biggest losses: downtime,
performance, and quality.
1. Real-time Monitoring - This allows management to always have visibility on the
plant floor and to receive alerts on every downtime and scrap issue that impacts
your production.
2. Track Target Performance vs. Actual - Monitor your production capacity and
ensure that you meet your delivery dates.
3. Daily Production Meeting - Start running your daily meetings with data. Review
the day’s production targets, identify issues from earlier, and preempt problems
that impact productivity.
4. Communicate Performance Plantwide - Install a scoreboard to display all of
your machines and cells and provide real-time updates. Make sure that every
issue and unplanned downtime event is visible to your employees. This can be a
large flat-screen TV equipped with a simple Chromecast device.

© SensrTrx 2020 24
5. End-of-Shift, Daily, and Weekly Reporting - Create email threads around the
day’s or week’s performance. Make productivity a topic for discussion and
employee engagement.
6. Review Top Downtime Reasons by Machine - Accelerate root-cause analysis
of problems. Systematically manage your biggest downtime reason and super-
charge your kaizen events by providing hard data on their impact on productivity.
7. Track Performance Trends and Protect Against “Drift” - Make sure any
improvements on the factory floor don’t disappear as they “drift” back to the
status quo.
8. Empower Your Continual Improvement Specialists - Every change can be
measured and tracked by cost savings. Put manufacturing analytics into the
hands of your continual improvement teams.
9. Integrate Alerts into Your CMMS - Connect analytics to a CMMS to automate
maintenance tickets when machines experience mechanical downtime.
10. Gather Baseline Measurements for Predictive Maintenance - Begin tracking
your most valuable assets with process data to build a maintenance profile and
start proactive or conditional maintenance to reduce unplanned downtime.
The implementation of IIoT will lead to maintaining production uptime, increased
efficiency, waste elimination, and reduced costs resulting in a return on investment.

© SensrTrx 2020 25
Achieve ROI
Regarding the ROI of connecting data gathered from your machines and operators,
your investment in an IIoT project should start to show gains immediately. In looking at
basic plant productivity analytics or just by tracking downtime and understanding it’s
causes, significant loss of production can be minimized.
For those who aren’t prioritizing this capability today, it’s not a question of whether
you’re leaving money on the table, but rather how much and for how long. One study
found that an increase in OEE of 10 to 15% can be achieved in the first year; this can
translate to a 50% increase in Return on Assets (ROA). After implementing SensrTrx
Manufacturing Analytics, our customers typically see a 100% ROI in as little as 6 weeks
and an increase in plant-wide OEE of roughly 30%. We’ve seen over and over how the
right investment in technology proves itself out fairly quickly.

© SensrTrx 2020 26
Conclusion
Leveraging IIoT and manufacturing analytics, manufacturers get more insight and
understanding of performance on the factory floor. Implementing it can be daunting, but
with well-thought-out processes, the application and execution of IIoT can be
successful.
We hope this guide has been valuable to you as you begin to implement IIoT and
manufacturing analytics. We’d love to hear more about your plans and give you a
chance to see SensrTrx Manufacturing Analytics in action.
The rest of this guide features some of our most popular resources so you can get a
better understanding of how manufacturing analytics can be used to improve
productivity and increase profitability.
About SensrTrx
SensrTrx is a manufacturing analytics platform that provides visibility into the data from
machines, devices, and people and puts it all into context. SensrTrx is revolutionizing
manufacturing by offering a complete solution from sensors to data collection to
analytics that provides real-time insights into the productivity of the factory. Those
insights give a manufacturer the ability to reduce costs, ensure customer on-time
delivery, and improve quality.
SensrTrx enables companies to start small, think big, move fast and easily grow from a
single machine at one plant to thousands of machines across the globe with
manufacturing analytics. To learn more, visit https://www.sensrtrx.com/.

© SensrTrx 2020 27
Resources
What is Manufacturing Analytics? – This article explains what manufacturing analytics is
and how manufacturing companies can use it to measure performance and quality.
Manufacturing Analytics: Where’s the Value? - This is where manufacturing analytics is
critical for modern manufacturers. In this paper, we again review what manufacturing
analytics is, how it’s different than existing manufacturing software, and how your
company can use it to create a competitive advantage and dominate the market.
What is OEE – Overall Equipment Effectiveness? - OEE is an attempt to combine the
many complex factors involved in manufacturing into a single metric to measure
machine effectiveness. OEE can be used to track how efficiently a machine, cell, or part
can be produced. The metric combines availability, utilization, production, and quality.
YAGNI – You Aren’t Going to Need It: Too Much Data is a Bad Thing - Can you have
too much data? Data is important, but too much can create more problems than it
solves.
Yes, the Cloud is Secure. No, it is Not Easier to Provide Your Own Data Center. – 65%
of global companies use cloud storage services. Did you know the cloud is very secure?
And no, it is not easier to provide your own, on-premise data center.
Manufacturing Glossary: Key Terms and Definitions – We compiled a list of commonly
used manufacturing acronyms and terms for your reference. The purpose of this list is
to help the reader become more familiar with the terms used in the industry.


![A History of IIoT Cyber-Attacks & Checklist for Implementing Security [Infographic]](https://img.dokumen.tips/doc/110x75/5871e0581a28ab6a7b8b594f/a-history-of-iiot-cyber-attacks-checklist-for-implementing-security-infographic.jpg)