Embed Size (px)
Citation preview

Economic Values Related to Aircraft Performance Factors 6-1
6. ECONOMIC VALUES RELATED TO AIRCRAFT PERFORMANCE FACTORS
6.1 INTRODUCTION
Certain types of investment programs or regulatory changes can affect aircraft performance. This can occur by changing the weight of the aircraft as well as altering the time in certain phases of flight. This section covers two elements related to aircraft performance:
The additional fuel use caused by incremental changes in aircraft weight The proportion of time spent in various phases of flight on representative aircraft
missions Measures are developed for air carrier and general aviation aircraft. Data were not
available on military aircraft performance. This section also contains data on the price of aviation fuel and sources for updated information on fuel prices.
The objective of this section is to provide values for use in economic analyses related to
investment and regulatory decisions that alter the performance of aircraft. For example, increases in aircraft weight affect fuel burn. The issue of when mandated increases in aircraft weight affect the suitability of an aircraft for specific missions is not directly examined in this section. For example, aircraft are designed with a target mission in terms of payload and range in mind, and these are performed at an assumed maximum aircraft weight. If a regulation were to cause a large change in aircraft weight, then the aircraft may not be capable of performing some of the missions for which it was designed. In this section, the values presented assume that the incremental changes in aircraft weight do not occur at the limits of the payload-range envelope.
When regulatory actions occur during the aircraft design phase, aircraft weight increases
will often cause an increase in installed power, fuel capacity, and so forth to maintain the target payload-range capability. Essentially, the increase in aircraft weight requires an increase in the amount of fuel used to fly the same mission. The increase in fuel used adds weight to the aircraft requiring additional fuel to be carried. The aircraft design would then be optimized for these new performance parameters. The re-optimization of an aircraft design is not considered in the values developed below. Re-optimization of a design may be the most appropriate type of analysis in some cases; however, it is not possible to capture this in a standard economic value.
6.2 APPROACH
The aircraft selected for analysis in this chapter were based on review of FAA’s Air Traffic Services Business Model (ATSBM) data regarding the types of aircraft operating in the National Airspace System (NAS) and the typical missions in terms of stage length at which they were operated.1 GRA selected the most frequently observed aircraft within each aircraft 1 The ATSBM provides data on all flights operating under instrument flight rules (IFR) that were operated in the NAS.

Economic Values Related to Aircraft Performance Factors 6-2
type/user group combination and determined the typical stage length(s) for the missions performed by this aircraft. These form the basis for the mission lengths over which the increases in fuel burn (based on increases in aircraft weight) were calculated, as well as the lengths of mission for which flight segment times were developed. Research conducted for a prior economic values study (FAA-APO-98-8: Tables 7-16 and 7-18) showed that the incremental fuel burn per pound of additional weight was relatively constant over the range weight added. Weight penalties used in this report range from 100 to 500 pounds depending on aircraft type.
6.2.1. Air Carrier Aircraft
Air carrier aircraft operated by passenger/combination carriers were selected using FY 2013 ATSBM data. The aircraft were selected for each economic values category based on number of flights. The aircraft types having the greatest number of flights were chosen to represent all aircraft within a category. In some cases, aircraft manufacturer data necessary for calculating fuel burn were not available for the selected aircraft. In these cases, the next most common aircraft type for which data were available was chosen. In general, one to three aircraft were selected to represent each aircraft category.
6.2.2. General Aviation Aircraft
General aviation aircraft were also selected based on flight frequencies in FY 2013 ATSBM data. The aircraft type having the greatest number of flights was chosen to represent all aircraft within a category. In some cases, aircraft manufacturer data necessary for calculating fuel burn were not available for the selected aircraft. In these cases, the next most common aircraft type for which data were available was chosen. In general, one aircraft was selected to represent each aircraft category.
6.2.3. Aircraft Performance Data
The data presented in this analysis were based on flight test results obtained at aircraft certification and represent the nominal level of performance at aircraft delivery. The performance manuals are produced by the aircraft manufacturer and represent the optimal performance achievable by the operator. Due to external and internal configuration changes, the aircraft’s actual performance will vary as a factor of weight, operating conditions, etc. In addition, it can be expected that actual aircraft performance will degrade as the aircraft ages, further restricting its capabilities. For example, no factor has been applied to allow for degradation in fuel efficiency over time.
6.2.3.1. General Assumptions
The analysis was performed in accordance with Approved Transport Category Operations, in particular Part 25, paragraph 25.121 and amendment 42. Regulatory performance is calculated with air conditioning bleeds off. Some aircraft performance is determined with reference to Part 23, Part 27, Part 29 or Part 135 requirements.
Climb, cruise, descent and holding fuel flows are calculated on the basis of an economic
air conditioning mode. Takeoff performance is calculated for zero wind, dry, hard and level
Economic Values Related to Aircraft Performance Factors 6-3
runway, and no obstacles. Holding and diversion fuel allowances were calculated for the respective aircraft weights at the beginning of the hold or diversion profile.
6.2.3.2. Aircraft Parameters
The Operational Weight Empty (OWE) is the weight of a typical aircraft as equipped for passenger operations. Included in the OWE is the manufacturer’s empty weight plus standard and operational items. Standard items include: unusable fuel, seats, carpet, engine oil, emergency equipment, toilet fluids and chemicals, galley, buffet, etc. Operational items include things such as crew, baggage, manuals, food, beverages, and life vests.
The Maximum Zero Fuel Weight (MZFW) is the maximum allowable weight of the
aircraft before fuel is added. The Maximum Structural Payload is the difference between the MZFW and the OWE.
For purposes of this analysis 70 percent of the maximum structural payload was assumed for the base case performance analysis. An additional calculation involving either a 100 or 500 pound payload increment was then performed. The difference in fuel burn against the base case was determined to be the incremental fuel burn for the weight increment.
The Maximum Landing Weight (MLW) is the certified maximum allowable weight of
the aircraft at touchdown. Mission Takeoff Weight is the total of OWE, passenger and/or cargo weight, mission fuel
weight and reserve fuel weight. Takeoff weight may be limited by aircraft performance. Mission Takeoff Weight may be less than the Maximum Takeoff Weight.
The combination of maximum payload and maximum fuel weight plus the OWE may
exceed the MTOW. In such situations, the operator must balance (reduce) payload, reserves, and mission needs to achieve the requirements of the flight profile to reduce the overall weight to MTOW or below. This involves a tradeoff between the payload and fuel load carried, and generally affects the maximum range that can be achieved.
6.2.3.3. Flight Profile
A mission is conducted over a specified distance. The effects of wind were not included in the analysis. The mission distance is applied from takeoff point (origin airport) to landing point (destination airport). No distance credit is taken for the taxi-out, takeoff, approach and landing, and taxi-in, as these segments may not be in the same direction as the desired flight path.
All of the factors shown above must be taken into account for proper mission planning. A
computer model was used with given parameters to calculate the optimal result. For optimization purposes, the computer model iterates to achieve the best payload vs. time ratio. This is due to most costs being time based.
Economic Values Related to Aircraft Performance Factors 6-4
The current industry practice is to allow the aircraft to maintain straight and level flight (in the mission cruise portion) for a minimum of 30 percent of the mission distance. This is to allow for safe movement about the cabin and the servicing of passengers.
Figure 6-1 illustrates the development of performance changes related to a 500-pound
weight penalty for a Gulfstream IV operating at a 1,000 nm stage length. The assumptions include an instrument standard (ISA) day, zero winds, level operation, 70 percent payload, Mach 0.8 cruise speed and National Business Aviation Association (NBAA) instrument flight rules (IFR) reserves. It shows the mission time, fuel burn and distance for each flight segment. The top part of the figure is the baseline mission and the bottom part is the same mission with a 500-pound weight penalty. The mission with the 500-pound weight penalty uses 42 more pounds of fuel, while the flight time for the mission is increased by one minute from 2 hours 27 minutes to 2 hours 28 minutes.
The performance models and manufacturer data also permit estimation of the time
aircraft spend in various mission segments of a flight including taxi-out, takeoff, climb, cruise, descent, landing, and taxi-in. Not all mission segments are available for each aircraft analyzed, using manufacturer data.

Economic Values Related to Aircraft Performance Factors 6-5
Figure 6-1: Gulfstream IV Illustrative Performance Calculations 1,000nm Stage Length and 500 lb Weight Penalty*
Total variance for 500 lb weight increase = 1 min of additional flight time and 42 lb or 6.3 usg of additional fuel
* Range 1,000 nm, ISA, zero winds, sea level takeoff, 70% payload, cruise at
Mach 0.80 and NBAA IFR reserves
5,607 /hr
Mission
Time Fuel Distance
2:27 6,478 lb 1,000 nm
Baseline
2:28 2:28
Mission
Time Fuel Distance
2:28 6,520 lb 1,000 nm
+500 lb
Climb
Variance
0 min
27 lb
Cruise
Variance
0 min
13 lb
Descent
Variance
1 min
2 lb
Taxi out Climb Cruise Descent Taxi in
TimeWeight
TimeWeight
Total variance for 500 lb weight increase = 1 min of additional flight time and 42 lb or 6.3 usg of additional fuel
* Range 1,000 nm, ISA, zero winds, sea level takeoff, 70% payload, cruise at
Mach 0.80 and NBAA IFR reserves
5,607 /hr
Mission
Time Fuel Distance
2:27 6,478 lb 1,000 nm
Mission
Time Fuel Distance
2:27 6,478 lb 1,000 nm
Baseline
2:28 2:282:28 2:28
Mission
Time Fuel Distance
2:28 6,520 lb 1,000 nm
Mission
Time Fuel Distance
2:28 6,520 lb 1,000 nm
+500 lb
Climb
Variance
0 min
27 lb
Cruise
Variance
0 min
13 lb
Descent
Variance
1 min
2 lb
Taxi out Climb Cruise Descent Taxi in
TimeWeight
TimeWeight
Economic Values Related to Aircraft Performance Factors 6-6
6.3 AIR CARRIER AIRCRAFT
This section presents the analysis of weight penalties and mission segments for large commercial aircraft. It considers aircraft used in passenger (combination) service as well as those used in all-cargo service.
6.3.1. Incremental Fuel Burn
As noted above, incremental fuel burn related to an increase in aircraft weight was calculated for selected aircraft types and selected stage lengths. The aircraft types selected present a sampling of the most common aircraft in use within each economic values category. Mission lengths were based on typical mission lengths for each aircraft type, as observed in FY 2013 ATSBM data. For most aircraft models, multiple mission lengths were analyzed. A weight penalty of 500 pounds was used for most larger narrow-body and wide-body jet aircraft, while a weight penalty of 200 pounds was used for most smaller narrow-body, regional jet and turboprop aircraft. In a few cases, these weight penalties did not produce reliable results so a different weight penalty was used.
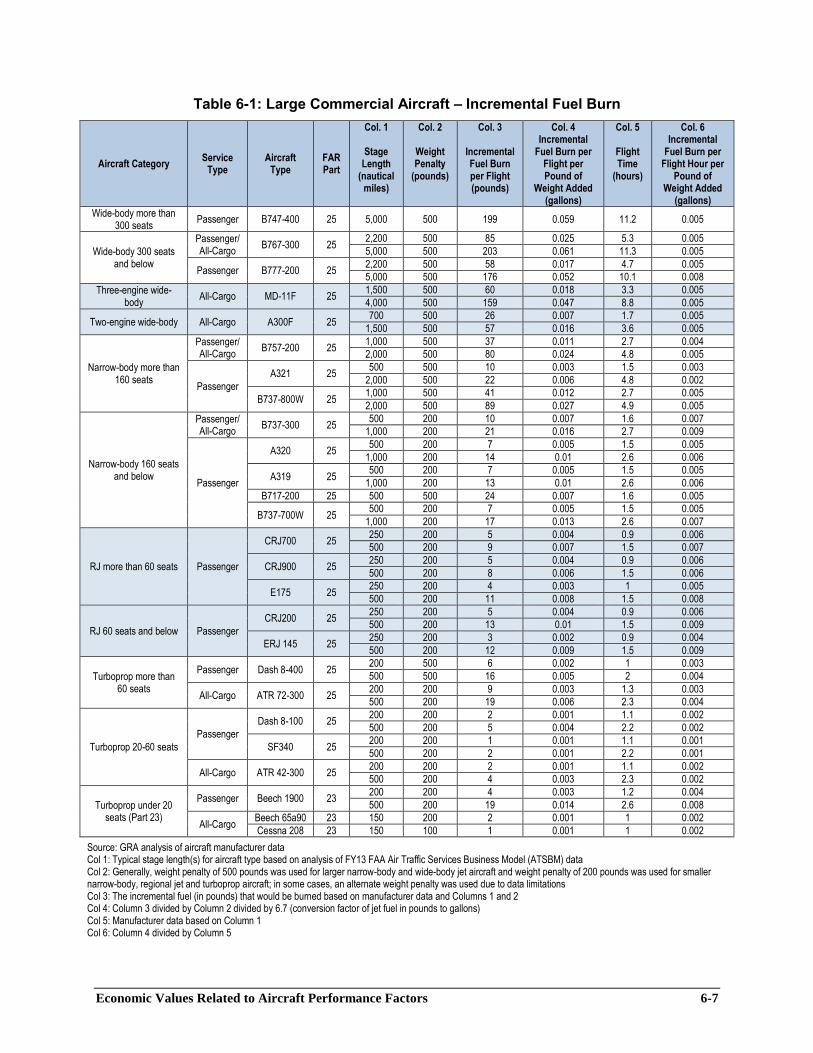
Table 6-1 presents the results for all large commercial aircraft (including both passenger
and all-cargo aircraft). The table presents the aircraft type, passenger or cargo configuration, the stage lengths analyzed, the weight penalty and the incremental fuel burn in pounds per flight.2 In addition, the incremental fuel burn per pound of weight added is also calculated in U.S. gallons per flight. The incremental fuel burn in gallons per hour per pound of weight added is calculated by dividing the incremental fuel burn per flight per pound of weight added by the flight time. Also shown is the total flight time for the specific mission analyzed.
As noted above, prior research has shown that the incremental fuel per pound of weight
added is relatively constant for the weight increases considered in this section. Therefore, the additional fuel consumption per year can be estimated by the amount of weight added times the incremental fuel burn times the annual utilization in flight hours. For example, assume that a regulation imposes a 100-pound weight penalty on a B737-700W that operates over a 500 nm average stage length for 3,000 hours per year. The annual cost at $3.01 per gallon for the additional fuel consumed because of the increase in aircraft weight is $4,515 (3,000 hours x $3.01 per gallon x 0.005 incremental gallons per flight hour per pound of weight added x 100 pound weight penalty).
2 Fuel weight in pounds is converted to U.S. gallons by using 6.7 lbs. per gallon.
Economic Values Related to Aircraft Performance Factors 6-7
Table 6-1: Large Commercial Aircraft – Incremental Fuel Burn
Aircraft Category Service
Type Aircraft
Type FAR Part
Col. 1
Stage Length
(nautical miles)
Col. 2
Weight Penalty
(pounds)
Col. 3
Incremental Fuel Burn per Flight (pounds)
Col. 4 Incremental
Fuel Burn per Flight per Pound of
Weight Added (gallons)
Col. 5
Flight Time
(hours)
Col. 6 Incremental
Fuel Burn per Flight Hour per
Pound of Weight Added
(gallons)
Wide-body more than 300 seats
Passenger B747-400 25 5,000 500 199 0.059 11.2 0.005
Wide-body 300 seats and below
Passenger/ All-Cargo
B767-300 25 2,200 500 85 0.025 5.3 0.005
5,000 500 203 0.061 11.3 0.005
Passenger B777-200 25 2,200 500 58 0.017 4.7 0.005
5,000 500 176 0.052 10.1 0.008
Three-engine wide-body
All-Cargo MD-11F 25 1,500 500 60 0.018 3.3 0.005
4,000 500 159 0.047 8.8 0.005
Two-engine wide-body All-Cargo A300F 25 700 500 26 0.007 1.7 0.005
1,500 500 57 0.016 3.6 0.005
Narrow-body more than 160 seats
Passenger/ All-Cargo
B757-200 25 1,000 500 37 0.011 2.7 0.004
2,000 500 80 0.024 4.8 0.005
Passenger
A321 25 500 500 10 0.003 1.5 0.003
2,000 500 22 0.006 4.8 0.002
B737-800W 25 1,000 500 41 0.012 2.7 0.005
2,000 500 89 0.027 4.9 0.005
Narrow-body 160 seats and below
Passenger/ All-Cargo
B737-300 25 500 200 10 0.007 1.6 0.007
1,000 200 21 0.016 2.7 0.009
Passenger
A320 25 500 200 7 0.005 1.5 0.005
1,000 200 14 0.01 2.6 0.006
A319 25 500 200 7 0.005 1.5 0.005
1,000 200 13 0.01 2.6 0.006
B717-200 25 500 500 24 0.007 1.6 0.005
B737-700W 25 500 200 7 0.005 1.5 0.005
1,000 200 17 0.013 2.6 0.007
RJ more than 60 seats Passenger
CRJ700 25 250 200 5 0.004 0.9 0.006
500 200 9 0.007 1.5 0.007
CRJ900 25 250 200 5 0.004 0.9 0.006
500 200 8 0.006 1.5 0.006
E175 25 250 200 4 0.003 1 0.005
500 200 11 0.008 1.5 0.008
RJ 60 seats and below Passenger
CRJ200 25 250 200 5 0.004 0.9 0.006
500 200 13 0.01 1.5 0.009
ERJ 145 25 250 200 3 0.002 0.9 0.004
500 200 12 0.009 1.5 0.009
Turboprop more than 60 seats
Passenger Dash 8-400 25 200 500 6 0.002 1 0.003
500 500 16 0.005 2 0.004
All-Cargo ATR 72-300 25 200 200 9 0.003 1.3 0.003
500 200 19 0.006 2.3 0.004
Turboprop 20-60 seats
Passenger
Dash 8-100 25 200 200 2 0.001 1.1 0.002
500 200 5 0.004 2.2 0.002
SF340 25 200 200 1 0.001 1.1 0.001
500 200 2 0.001 2.2 0.001
All-Cargo ATR 42-300 25 200 200 2 0.001 1.1 0.002
500 200 4 0.003 2.3 0.002
Turboprop under 20 seats (Part 23)
Passenger Beech 1900 23 200 200 4 0.003 1.2 0.004
500 200 19 0.014 2.6 0.008
All-Cargo Beech 65a90 23 150 200 2 0.001 1 0.002
Cessna 208 23 150 100 1 0.001 1 0.002
Source: GRA analysis of aircraft manufacturer data Col 1: Typical stage length(s) for aircraft type based on analysis of FY13 FAA Air Traffic Services Business Model (ATSBM) data Col 2: Generally, weight penalty of 500 pounds was used for larger narrow-body and wide-body jet aircraft and weight penalty of 200 pounds was used for smaller narrow-body, regional jet and turboprop aircraft; in some cases, an alternate weight penalty was used due to data limitations Col 3: The incremental fuel (in pounds) that would be burned based on manufacturer data and Columns 1 and 2 Col 4: Column 3 divided by Column 2 divided by 6.7 (conversion factor of jet fuel in pounds to gallons) Col 5: Manufacturer data based on Column 1 Col 6: Column 4 divided by Column 5

Economic Values Related to Aircraft Performance Factors 6-8
6.3.2. Flight Profiles
Flight profiles for large commercial aircraft are presented in Table 6-2. These are based on simple averages of the data from the specific aircraft that were used for calculating the incremental fuel burn shown in Table 6-1 above.3 Since flight profiles were not available for some aircraft used in Table 1, and some aircraft with flight profile data were not used in Table 6-1 due to data limitations, the specific aircraft types used in Table 6-2 are shown in the table. Not all mission segments could be calculated for each aircraft and some have been aggregated.
Table 6-2: Large Commercial Aircraft – Breakdown of Flight Profiles
Aircraft Category Aircraft Types Included in this Table
Average Flight Profiles (minutes)
Taxi Out and
Takeoff Climb Cruise
Descent and
Landing
Taxi In
Total
Wide-body more than 300 seats No Detailed Flight Path Data Available
Wide-body 300 seats and below A330; B777-200 12 17 419 23 5 476
Four-engine wide-body No Detailed Flight Path Data Available
Three-engine wide-body No Detailed Flight Path Data Available
Two-engine wide-body No Detailed Flight Path Data Available
Narrow-body more than 160 seats A321; B737-800W 12 18 152 20 5 207
Narrow-body 160 seats and below A319; A320; B737-300; B737-700W 12 19 69 19 5 125
RJ more than 60 seats CRJ700; CRJ900; E175; E190 12 21 28 16 5 82
RJ 60 seats and below CRJ200 12 23 19 16 5 74
Turboprop more than 60 seats ATR 72-200; Dash 8-400 11 21 46 17 5 100
Turboprop 20 - 60 seats ATR 42-300; Dash 8-100; EMB-120; SF340 11 18 50 13 5 97
Turboprop under 20 seats (Part 25) No Detailed Flight Path Data Available
Turboprop under 20 seats (Part 23) Beech 1900; Beech 65a90; Cessna 208 6 18 46 14 5 89
Piston engine (Part 25) No Data Calculated for this Aircraft Category
Piston engine (Part 23) No Data Calculated for this Aircraft Category
Source: GRA analysis of aircraft manufacturer data
6.4 GENERAL AVIATION
Table 6-3 contains the results of the performance analysis of weight penalties for selected general aviation and air taxi aircraft. The underlying performance data does not differentiate between air taxi and other general aviation aircraft. The same mission analysis rules as above were used except that a weight penalty of 100 pounds was applied to all aircraft except for the largest business jet aircraft category. In addition, rotorcraft performance is considered in this section. As can be seen, most aircraft were evaluated over one proposed mission length, except for jet aircraft that were evaluated at two mission lengths. The table shows the amount of the
3 Weighted averages were not calculated because there was not a good representation of the aircraft within each group. Thus, the category averages should be viewed as approximations of the amount of flight time in each flight segment of a typical aircraft mission.

Economic Values Related to Aircraft Performance Factors 6-9
weight penalty, the incremental fuel burn per flight in pounds, and the incremental fuel burn per flight per pound of added weight in gallons. The incremental fuel burn per pound of weight added per flight hour is also shown in this table.
Table 6-3: General Aviation and Air Taxi Aircraft – Incremental Fuel Burn
Aircraft Category Aircraft Type FAR Part
Col. 1 Stage
Length (nautical miles)
Col. 2 Weight Penalty
(pounds)
Col. 3 Incremental Fuel Burn per Flight (pounds)
Col. 4 Incremental Fuel Burn per Flight per Pound of Weight
Added (gallons)
Col. 5 Flight Time
(hours)
Col. 6 Incremental Fuel Burn per Flight Hour per Pound of Weight Added
(gallons)
Piston engine airplanes 4-9 seats one-engine
Cessna 172 23 150 100 0.725 0.001 1.4 0.001
Piston engine airplanes 4-9 seats multi-engine
Piper PA-30 23 250 100 0.648 0.001 1.7 0.001
Beech Baron 23 250 100 0.769 0.001 1.4 0.001
Turboprop airplanes 1-9 seats one-engine
TBM700 23 300 100 1.307 0.002 1.2 0.003
Turboprop airplanes 1-9 seats multi-engine
Beech King Air B200 23 300 100 0.826 0.001 1.0 0.002
Turboprop airplanes 10-19 seats
Cessna 208 23 150 100 0.499 0.001 1.0 0.001
Turbojet/turbofan airplanes <= 12,500 lbs.
Phenom 100 25 400 100 2.040 0.003 1.3 0.003
Turbojet/turbofan airplanes > 12,500 lbs. and <= 65,000 lbs.
Cessna 560 25 400 100 4.553 0.007 1.2 0.008
Turbojet/turbofan airplanes > 65,000 lbs.
Global Express 25 900 100 4.080 0.006 2.3 0.004
Rotorcraft piston <= 6,000 lbs.
R44 27 100 100 1.411 0.002 1.7 0.002
Rotorcraft turbine <= 6,000 lbs.
Bell 206 27 100 100 2.792 0.004 0.9 0.007
Rotorcraft turbine > 6,000 lbs.
EC145/BK117 29 100 100 1.031 0.002 0.8 0.003
Bell UH-1 29 100 100 1.500 0.002 1.0 0.003
Source: GRA analysis of aircraft manufacturer data Col 1: Typical stage length(s) for aircraft type based on analysis of FY13 FAA Air Traffic Services Business Model (ATSBM) data Col 2: Generally, weight penalty of 500 pounds was used for narrow-body and wide-body jet aircraft and weight penalty of 200 pounds was used for regional jet and turboprop aircraft; in some cases, an alternate weight penalty was used due to data limitations Col 3: The incremental fuel (in pounds) that would be burned based on manufacturer data and Columns 1 and 2 Col 4: Column 3 divided by Column 2 divided by 6.7 (conversion factor of jet fuel in pounds to gallons) Col 5: Manufacturer data based on Column 1 Col 6: Column 4 divided by Column 5
Table 6-4 summarizes performance data for the general aviation and air taxi aircraft.
Performance profiles allow consideration of the proportion of mission length spent in each part of the flight profile. This permits calculation of costs by amount of time in each part of the flight using the cost data per flight hour from Section 4.

Economic Values Related to Aircraft Performance Factors 6-10
Table 6-4: General Aviation and Air Taxi Aircraft – Breakdown of Flight Profiles
Aircraft Category Aircraft Types Included in this Table
Average Flight Profiles (minutes)
Taxi Out and
Takeoff Climb Cruise
Descent and
Landing
Taxi In
Total
Piston engine airplanes 1-3 seats
No Data Calculated for this Aircraft Category
Piston engine airplanes 4-9 seats one-engine
Cessna 172 1 9 70 6 NC 87
Piston engine airplanes 4-9 seats multi-engine
Piper PA-30; Beech Baron 1 9 71 11 NC 93
Piston engine airplanes 10 or more seats
No Data Calculated for this Aircraft Category
Turboprop airplanes 1-9 seats one-engine
TBM700; Beech King Air B200 1 10 42 12 NC 65
Turboprop airplanes 1-9 seats multi-engine
No Data Calculated for this Aircraft Category
Turboprop airplanes 10-19 seats
Cessna 208 1 11 32 15 NC 59
Turboprop airplanes 20 or more seats
No Data Calculated for this Aircraft Category
Turbojet/turbofan airplanes <= 12,500 lbs.
Phenom 100 1 9 63 6 NC 79
Turbojet/turbofan airplanes > 12,500 lbs. and <= 65,000 lbs.
Cessna 560 1 8 48 16 NC 72
Turbojet/turbofan airplanes > 65,000 lbs.
Global Express 11 10 96 17 5 139
Rotorcraft piston <= 6,000 lbs. R44 NC NC 100 NC NC 100
Rotorcraft turbine <= 6,000 lbs. Bell 206 NC NC 53 NC NC 53
Rotorcraft piston > 6,000 lbs. No Data Calculated for this Aircraft Category
Rotorcraft turbine > 6,000 lbs. EC145/BK-117; Bell UH-1 NC NC 53 NC NC 53
Other No Data Calculated for this Aircraft Category
Experimental No Data Calculated for this Aircraft Category
Light Sport No Data Calculated for this Aircraft Category
Source: GRA analysis of aircraft manufacturer data NC = Not Calculated
6.5 FUEL COSTS
In order to apply the incremental fuel burn data to an economic analysis, fuel price information is required. Data have been developed for both air carrier (Jet-A) and general aviation fuel (Jet-A and Avgas). Piston engine aircraft consume Avgas while all other aircraft consume Jet-A. All military aircraft use Jet-A.
Table 6-5 presents fuel consumption (Jet-A) reported by carriers filing Form 41,
Schedule P-1.2(a). In addition to fuel consumption, carriers report fuel cost, from which an average cost per gallon was calculated. To enable comparison of average fuel cost over time, values are presented in both nominal and real (2013) dollars. Readers should be cautioned that large air carriers generally buy fuel in significant quantities and therefore pay substantially less than other users. In addition, some carriers purchase hedge contracts to insulate themselves from

Economic Values Related to Aircraft Performance Factors 6-11
rapid increases in fuel prices. Smaller carriers may pay more than the average price of fuel for Form 41 carriers.
Table 6-5: Fuel Cost and Consumption—System-wide Operations
U.S. Majors, Nationals and Large Regionals — All Services
Year Fuel Consumption (gallons, millions)
Average Cost per Gallon (nominal)
Average Cost per Gallon ($2013)
1990 16,150 $0.78 $1.39
1991 15,248 $0.69 $1.18
1992 15,677 $0.64 $1.06
1993 16,072 $0.61 $0.98
1994 16,826 $0.56 $0.88
1995 17,318 $0.56 $0.86
1996 17,844 $0.67 $0.99
1997 18,619 $0.64 $0.94
1998 18,219 $0.51 $0.73
1999 19,767 $0.53 $0.74
2000 20,373 $0.81 $1.09
2001 19,204 $0.78 $1.03
2002 18,001 $0.72 $0.93
2003 18,300 $0.85 $1.07
2004 19,683 $1.16 $1.43
2005 19,950 $1.66 $1.98
2006 19,712 $1.97 $2.27
2007 19,886 $2.11 $2.37
2008 18,872 $3.07 $3.32
2009 17,061 $1.90 $2.06
2010 17,298 $2.27 $2.43
2011 17,558 $3.05 $3.16
2012 16,946 $3.15 $3.20
2013 16,824 $3.01 $3.01
Source: Form 41, Schedule P-1.2(a)
Note: Adjusted for inflation to 2013 dollars using Bureau of Labor Statistics, Consumer Price Index - All Urban Consumers
Table 6-6 reports general aviation fuel prices for Jet-A and Avgas. These data are for
December 2014. As can be seen, aviation gasoline costs more per gallon than jet fuel, with prices averaging about $6.60 per gallon for Avgas vs. roughly $5.90 per gallon for fuel for turbine engines.

Economic Values Related to Aircraft Performance Factors 6-12
Table 6-6: General Aviation Jet-A and Avgas Per Gallon Fuel Prices ($2014)
Region Jet-A High Price
Jet-A Low Price
Jet-A Average
Price Avgas
High Price Avgas
Low Price Avgas
Average Price
Eastern $8.77 $4.60 $6.45 $9.30 $5.20 $7.00
New England $7.55 $4.40 $5.72 $7.98 $4.80 $6.35
Great Lakes $8.36 $4.38 $5.76 $9.17 $5.30 $6.64
Central $7.95 $3.85 $5.35 $8.70 $4.91 $6.22
Southern $8.23 $4.85 $6.47 $8.90 $5.15 $6.91
Southwest $7.27 $3.87 $5.59 $7.84 $4.50 $6.25
NW Mountain $7.79 $3.90 $5.66 $8.43 $5.05 $6.60
Western Pacific $8.33 $4.57 $6.07 $9.05 $5.55 $6.80
Nationwide $8.03 $4.28 $5.89 $8.67 $5.07 $6.60 The table above shows results of a fuel price survey of U. S. fuel suppliers performed in December 2014.
Prices include taxes and fees. Source: Business & Commercial Aviation, January 2015.
Table 6-7 shows the average rate of fuel consumption (gallons per hour) and the estimated annual fuel use in millions of gallons for the general aviation fleet in 2013.

Economic Values Related to Aircraft Performance Factors 6-13
Table 6-7: 2013 General Aviation Total Fuel Consumed and Average Fuel Consumption Rate by Aircraft Type (Includes Air Taxi Aircraft; Excludes Commuter Aircraft)
Aircraft Category Certification
Jet Fuel: Turbine Aviation Gasoline:
100 Low Lead Aviation Gasoline:
100 Octane Automotive Gasoline Total Fuel Use
Average Rate
(GPH)
Estimated Fuel Use (Millions
of Gallons)
Average Rate
(GPH)
Estimated Fuel Use (Millions
of Gallons)
Average Rate
(GPH)
Estimated Fuel Use (Millions
of Gallons)
Average Rate
(GPH)
Estimated Fuel Use (Millions
of Gallons)
Average Rate
(GPH)
Estimated Fuel Use (Millions
of Gallons)
Piston engine airplanes 1-3 seats
Part 23 N/R N/R 9.8 19.3 8.6 0.8 8.8 1.7 10.5 24.4
Piston engine airplanes 4-9 seats one-engine
Part 23 N/R N/R 11.7 74.6 12.7 4.4 11.1 16.0 11.7 96.1
Piston engine airplanes 4-9 seats multi-engine
Part 23 N/R N/R 27.0 38.1 24.2 4.0 14.0 0.1 26.6 42.7
Piston engine airplanes 10 or more seats
Part 23 N/R N/R 31.7 1.5 43.3 0.3 44.7 a 40.9 3.1
Turboprop airplanes 1-9 seats one-engine
Part 23 60.0 46.8 19.1 2.4 65.6 0.3 13.2 0.3 53.3 49.8
Turboprop airplanes 1-9 seats multi-engine
Part 23 77.9 11.1 22.7 a 147.3 0.1 N/A - 77.5 11.3
Turboprop airplanes 10-19 seats
Part 23 81.2 115.8 40.3 0.1 73.2 0.4 N/A - 81.1 116.5
Turboprop airplanes 20 or more seats
Part 25 125.5 20.1 170.0 0.1 45.9 0.2 N/A - 123.5 20.5
Turbojet/turbofan airplanes <= 12,500 lbs.
Part 23/25 141.9 42.9 23.9 a 200.0 0.2 N/A - 141.7 43.1
Turbojet/turbofan airplanes > 12,500 lbs. and <= 65,000 lbs.
Part 25 281.1 728.0 63.9 0.1 191.4 3.9 N/A - 280.1 732.2
Turbojet/turbofan airplanes > 65,000 lbs.
Part 25 416.2 255.1 65.0 a 200.0 0.7 N/A - 414.7 255.8
Rotorcraft piston <= 6,000 lbs. Part 27 N/R N/R 13.3 7.8 16.1 0.2 8.0 a 13.5 8.2
Rotorcraft turbine <= 6,000 lbs. Part 27 45.5 64.1 20.4 a 66.6 0.9 N/A - 45.7 65.0
Rotorcraft piston > 6,000 lbs. Part 29 N/R N/R 40.0 a N/A - N/A - 43.4 a
Rotorcraft turbine > 6,000 lbs. Part 29 72.2 46.4 N/A - 94.5 1.0 N/A - 72.5 47.3
Other N/A - 2.8 a 42.5 0.1 3.4 a 12.2 1.7
Experimental 61.0 17.8 10.9 9.0 34.2 1.9 5.6 1.0 22.0 29.7
Light Sport N/A - 6.0 0.7 5.4 a 4.3 0.8 4.9 1.5
All Aircraft 159.3 1,353.6 13.4 153.8 26.0 19.5 9.8 19.9 67.7 1,549.0
Sources: FAA's General Aviation and Part 135 Activity Survey CY 2013.
a = < 0.05 N/A = Not Applicable N/R = Values not reported Total fuel use includes consumption of jet fuel: piston and other fuel, but estimates for use of these fuel types are not reported separately. Experimental aircraft includes experimental light-sport and light-sport aircraft for which airworthiness certificates are not final. Prior to 2012, estimates for these aircraft were included with light-sport. Totals may not add due to rounding See relation to GA Survey Groups in Table 3-9.