Embed Size (px)
Citation preview

5G RADIOFREQUENCY EXPOSURE ASSESSMENT AND IMPLICATIONS FOR SAFETY
May 2020
11390580
5G RF Exposure Assessment and Implications for Safety 2 May 2020
The Effect of Small Cell Transitions on the Public RF EnvironmentThe Importance of Minimizing Transmitted PowerThere are practical reasons to minimize power from antennas as much as possible. Specific reasons such as reducing interference into the communication channel from other users, reducing RF exposure to workers or the public increasing battery life and reducing power consumption will be introduced using a crowd acoustics analogy in the course of the next few paragraphs. In fact, that power conserva-tion drives modern communication system design.
An Analogy Using Crowd AcousticsThe cellular wireless communication problem is similar to the problem of carrying out multiple conversations in a crowded room such as shown in Fig. 1. Conversations other than yours in the room represent interference to you even though they are important to other people. The louder this background interference, the louder you have to speak to your companion in order to be heard. This, in turn, results in an increase in interference for everyone else. Hence, it is in everyone’s interest to speak as softly as possible; the most ef-fective situation for everyone in the room is for all conversations to be whispered. To achieve this, however, requires everyone’s coopera-tion and this is often not possible. By analogy, the same argument can be made for minimizing the radiated power for multiple cell phone users located within a single cell of the cellular communica-tion system.
One difference between the situation just described and the cell communication system is that cell system conversations take place through a central site (called a ‘base station”) and may involve indi-viduals in other cells. To illustrate, the crowd in Fig. 2 is augmented with a speaker on the left side who communicates separately with several individuals within the crowd. This can be accomplished if the speaker takes turns speaking to each individual with whom he/she wants to communicate1 and then waits for a response. This works best if the background conversations are relatively quiet.2
1 In cell communication systems, the different conversations are not necessarily separated by time; there are several other methods beyond the scope of this document than can be used. “Taking turns” speaking as described here is a simple illustration of what is called time division multiple access (TDMA).2 The analogy does not quite apply to the cell system because conversations between other individuals also take place through the speaker. But the analogy is still applicable since the other conversations do produce interference to all other conversations.
IntroductionThis report is a supplement to “5G Wireless Communications Sys-tems and the Electrical Grid – Associated Exposures to Electromag-netic Fields,” EPRI Product # 30020166606 and consists of four parts and an Appendix with a short introduction to 5G. The first is a discussion of the public radiofrequency (RF) environment in the vicinity of both existing cell sites as well as small cells (less coverage than a traditional base station). Special attention is paid to the fact that minimizing transmitted power may result in reduced time-aver-aged (as allowed by safety standards) RF exposure from base stations as illustrated with a crowd acoustics analogy, as well as both theory and experimental results. The second part is an examination of the RF exposure problem for those who work in the vicinity of small cell antennas at the higher frequencies associated with 5G systems. Guidance is provided for developing appropriate work practices. The third part is a short discussion of existing RF Safety standards applicable to 5G. The final section conludes with a summary of key points from the document along with highlights from published research in the area of exposure assessment.
Table of ContentsIntroduction ...............................................................2The Effect of Small Cell Transitions on the Public RF Environment ..........................................................2
The Importance of Minimizing Transmitted Power ........2An Analogy Using Crowd Acoustics ..........................2Introduction to Cellular Wireless Communication.........6What is Gain and How is it Related to Beamwidth? ....6Higher Frequency Cell Systems Such as those to beUsed for 5G ...........................................................7Effect of Cell Size on RF Exposure - LowerMicrowave Frequencies ...........................................8What can be learned about public exposure frommeasurements? .....................................................12Effect of Cell Size on RF Exposure - HigherMicrowave and Millimeter Wave Frequencies...........12Work Near 5G Antennas .......................................12RF Safety Guidelines and Regulations ......................15
Conclusions .............................................................16References ..............................................................16Appendix ................................................................17
Introduction to 5G .................................................17
11390580

5G RF Exposure Assessment and Implications for Safety 3 May 2020
The partially transparent color background (dark red corresponds to much louder than necessary and light blue to just enough to be heard by the most distant listener) represents the loudness of the speaker’s voice at any location. Clearly the voice is louder than nec-essary for individuals close to the speaker which presents a problem.
There are several methods to mitigate this problem, at least par-tially. First, the speaker should speak only loud enough to reach the listener to whom he/she wishes to communicate; a natural consequence of this is that the speech is still louder than necessary for closer individuals. Overall, however, this practice will reduce the interference to conversations between other individuals. In respond-ing, the listener in the crowd should also speak only loudly enough to communicate with the speaker. An advantage of the cell system over the crowd analogy is that the radiated power of any base station or mobile device can be controlled centrally (using a method called “adaptive power control”). The explicit cooperation of each indi-vidual is not required. Reducing the power from the mobile device increases its battery life. Second, the speaker could stand on a ladder in order to reduce the level of his/her speech at closer locations with
the result that the level of speech is more uniform over the entire group of listeners(shown in Fig. 3). Note that the speakers voice is not as loud at locations near the speaker (the red color is not as intense) but is still loud enough at the most distant listener. Having the speaker stand on a ladder is analogous to placing base station antennas on towers.
Figure 1. Multiple Conversations in a Crowded Room. Other conversations contribute to the background noise for any conversation causing the volume of all conversations to increase.
Figure 2. Conversations with a large group of people that involve communication with a single speaker who represents a base station. The color of the semi-transparent background indicates the amplitude of the speaker’s voice at any particular location. Light blue and dark red respectively indicate speech levels just loud enough and much louder than necessary for effective communication.
11390580

5G RF Exposure Assessment and Implications for Safety 4 May 2020
Third, the speaker could use a system such as a megaphone to direct his/her speech primarily towards the intended listener and hence to reduce interference to individuals who are carrying on separate conversations but at different locations than the intended listener. Because the passive megaphone concentrates the speakers voice in the intended direction, he/she does not have to speak loudly to effectively communicate with the listener. Conversely on response, if the speaker moves the megaphone to his own ear the listener does not have to speak so loudly because the passive megaphone concen-trates the listener’s response (Fig. 4.) For the conversation with the next individual, the megaphone can be redirected toward that next listener. Clearly, there is less interference with conversations away from the line between speaker and listener. Cell communication systems use directional antennas that are analogous to megaphones and result in less interference.
Fourth, the background interference can be reduced by replacing the single speaker (as shown in Figs. 2 – 4) with several speakers who communicate only with the individuals closest to them, as illustrated in Fig. 5. With several speakers, each individual speaker reduce their volume since each group addressed is smaller and his/her voice does not need to reach as far. It also means that conversa-tions between each speaker and his/her group of listeners can be conducted simultaneously. This results in an overall increase in communication capacity and a reduction in interference at any loca-tion. By analogy, cell phone systems that incorporate “small cells” achieve the same capacity enhancement with an overall reduction of transmitted power and hence exposure to RF electromagnetic fields at any location.
Figure 4. The use of a megaphone 1) reduces the need for the speaker to use a loud voice and 2) decreases interference with other conversations. The color of the semi-transparent background indicates the amplitude of the speaker’s voice at any particular location. Light blue and dark red respectively indicate speech levels just loud enough and much louder than necessary for effective communication.
Figure 3. Speaker standing on a ladder to make the level of his/her speech more uniform over the group of listeners. The color of the semi-transparent background indicates the amplitude of the speaker’s voice at any particular location. Light blue and dark red respectively indicate speech levels just loud enough and much louder than necessary for effective communication.
11390580

5G RF Exposure Assessment and Implications for Safety 5 May 2020
Finally, megaphones may be used within small cells as shown in Fig. 7. Here, each speaker uses a megaphone to direct his/her speech towards the individual of interest, someone with whom they wish to communicate. This both reduces the need for the speaker to use a loud voice and reduces the interference to individuals carrying on separate communications but not in the same direction as the individual of interest.
Similar techniques to all of these ideas are used in the cell system (and especially the newer 5G system) to reduce the radiated power from base station and cell phone antennas. More specifically, a sig-nificant advantage of the cellular communication system over that of the crowd analogy is that the cell system can reduce the power of each signal transmitted from a base station to the lowest level necessary for effective communications. Simultaneously, a phone’s transmitted power can be reduced as the background “interference” is reduced. Now imagine if both the speaker and the listener utilize megaphones pointed at each other, they can then reduce their voice volume even further. 5G millimeter wave communications will enable this form of power reduction on devices as small as smart phones. This results in a reduction of power usage, RF interfer-ence in the same and adjacent cells and RF exposure to all users in the cell from the base station and to the RF exposure from a user’s phone. In this condition, the system is performing optimally.
The speaker’s voice volume is not homogenous within the group, rather it is louder for individuals closer than for those farther away (as shown by the red color in the partially transparent circle). This problem can be mitigated by placing each speaker on a ladder as discussed earlier ( Fig. 6). In this case, the speaker’s voice volume is reduced because the distance has increased between the speaker on the ladder and those previously close to him/her. This is illustrated by the less intense red color near the closest individuals in the circles of Fig. 6. A similar result is achieved in the cell system by raising antennas on towers.
Figure 5. Conversations between several speakers (analogous to cell system base stations) and small groups of people . The color of the semi-transparent background indicates the amplitude of the speaker’s voice at any particular location. Light blue and dark red respectively indicate speech levels just loud enough and much louder than necessary for effective communication.
Figure 6. Speakers on ladders which reduces the interference for individuals closest to the speaker. The color of the semi-transparent background indicates the amplitude of the speaker’s voice at any particular location. Light blue and dark red respectively indicate speech levels just loud enough and much louder than necessary for effective communication.
Figure 7. Multiple speakers simultaneously using megaphones to communicate with individuals in “small cells.” The color of the transparent background indicates the amplitude of a speaker’s voice at any particular location. Light blue and dark red respectively indicate speech levels just loud enough and much louder than necessary for effective communication.
11390580

5G RF Exposure Assessment and Implications for Safety 6 May 2020
Introduction to Cellular Wireless CommunicationGiven the above discussion, is it useful to quantify the concept of interference and signal to noise ratio3 (SNR). One important characteristic of any communication system is the minimum power available to receiver needed to successfully recreate the transmitted signal. If less power than this is available, the quality of the received signal is reduced. But, the amount of received power needed de-pends on how much background noise and interference are present, which, in turn, depends on the number of other simultaneous users and the amount of power being used for their communication. Hence, the “signal to noise ratio” must be above a certain value for effective communication. Mathematically, the ratio can be written
(1)
where Pr is the power received by the mobile device, N is the noise and interference power density4 and BW is the “bandwidth” of the signal. The “bandwidth” is the range of frequencies used and is related to the rate at which data is being transmitted; an audio signal requires less bandwidth than a video signal. It will be assumed that the band-width is fixed although this assumption can easily be relaxed.
The next idea to be introduced is the relationship between power transmitted by a base station and the received power. Consider the system shown in Fig. 8. Here, a base station (with its antenna) and a mobile unit (with its antenna) are separated by a distance R. The power into the mobile device5 can be written as [1]
3 “Noise” referred to in this portion of the document is generally noise plus interference to distinguish between natural noise from inside and outside the receiver and interference generated by other communication signals.4 Per unit frequency5 This simple expression assumes antennas that are impedance matched to the transmitter and receiver and ignores effects due to reflection/absorption from the earth and other objects.
(2)
where λ is the wavelength of the transmitted signal in centimeters (equal to 30 divided by the frequency in Gigahertz), Pt is the power output of the base station transmitter, Gta and Gra are respectively the dimensionless “gains” (discussed in other sections of this docu-ment) of the base station and mobile unit antennas and R is the distance between the base station and the mobile.
Several things can be inferred from this formula. First, and very important, the transmitter power Pt required to produce a mini-mum acceptable receiver power at the edge of a cell is smaller for smaller cell sizes since R is smaller. This is the first indication that the exposure of the public to radio frequency (RF) electromagnetic fields might be smaller for smaller cell sizes. Second, it is clear (for fixed antenna gains) that the transmitter power required for success-ful communication at higher frequencies (i.e., smaller wavelengths) is larger. One might conclude that the millimeter wave frequen-cies unique to 5G communication systems might result in higher exposure of the public to RF electromagnetic fields than lower frequency systems such as 4G. However, this would assume gain is equal to one, since “gain” can also be a function of frequency as will be described in the next section.
What is Gain and How is it Related to Beamwidth?If the physical size of an antenna is larger than about a wavelength in size, it can be designed to radiate preferentially in one direction as shown in Fig. 9. In this figure, the antenna (called a “directive an-tenna”) is located at the junction of the main beam and the sidelobes (i.e., directions where smaller amounts of radiation propagate).
rPSNRN BW
=⋅
( )
2
2 24ta ra
r tG GP P
Rλπ
=
Figure 8. Simple base station mobile unit communication system
Figure 9. A directive antenna showing the beamwidth and the direction of maximum radiation
11390580
5G RF Exposure Assessment and Implications for Safety 7 May 2020
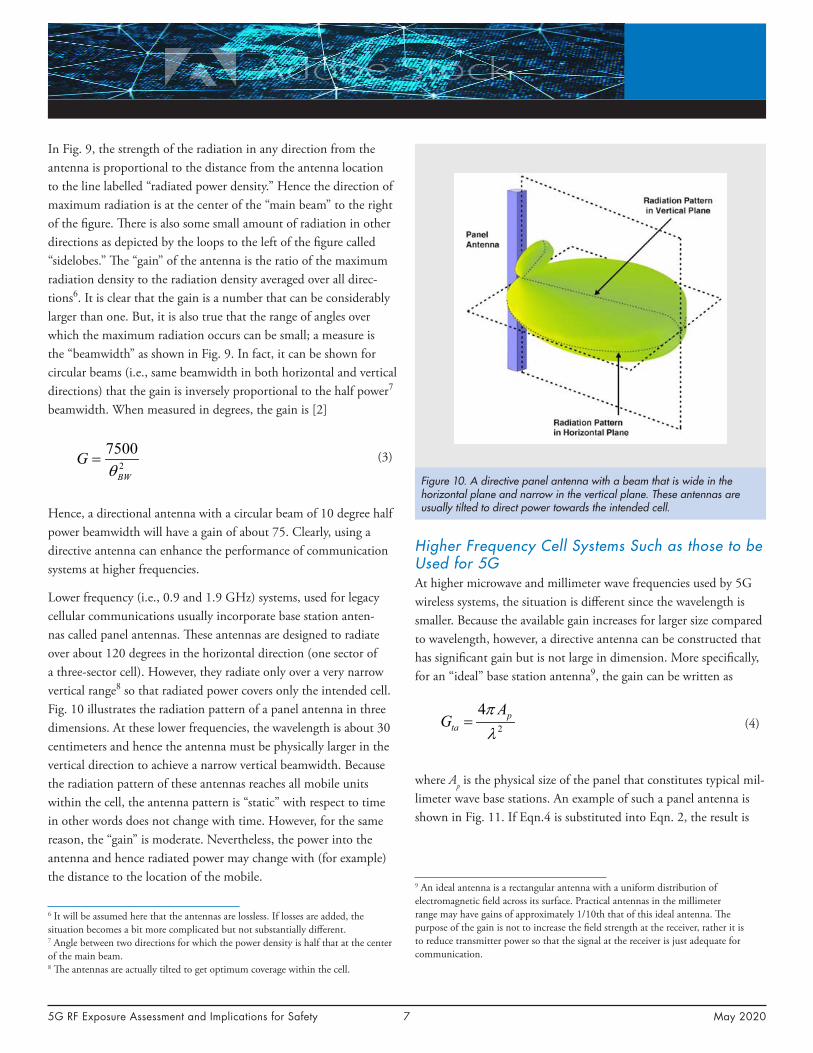
In Fig. 9, the strength of the radiation in any direction from the antenna is proportional to the distance from the antenna location to the line labelled “radiated power density.” Hence the direction of maximum radiation is at the center of the “main beam” to the right of the figure. There is also some small amount of radiation in other directions as depicted by the loops to the left of the figure called “sidelobes.” The “gain” of the antenna is the ratio of the maximum radiation density to the radiation density averaged over all direc-tions6. It is clear that the gain is a number that can be considerably larger than one. But, it is also true that the range of angles over which the maximum radiation occurs can be small; a measure is the “beamwidth” as shown in Fig. 9. In fact, it can be shown for circular beams (i.e., same beamwidth in both horizontal and vertical directions) that the gain is inversely proportional to the half power7 beamwidth. When measured in degrees, the gain is [2]
(3)
Hence, a directional antenna with a circular beam of 10 degree half power beamwidth will have a gain of about 75. Clearly, using a directive antenna can enhance the performance of communication systems at higher frequencies.
Lower frequency (i.e., 0.9 and 1.9 GHz) systems, used for legacy cellular communications usually incorporate base station anten-nas called panel antennas. These antennas are designed to radiate over about 120 degrees in the horizontal direction (one sector of a three-sector cell). However, they radiate only over a very narrow vertical range8 so that radiated power covers only the intended cell. Fig. 10 illustrates the radiation pattern of a panel antenna in three dimensions. At these lower frequencies, the wavelength is about 30 centimeters and hence the antenna must be physically larger in the vertical direction to achieve a narrow vertical beamwidth. Because the radiation pattern of these antennas reaches all mobile units within the cell, the antenna pattern is “static” with respect to time in other words does not change with time. However, for the same reason, the “gain” is moderate. Nevertheless, the power into the antenna and hence radiated power may change with (for example) the distance to the location of the mobile.
6 It will be assumed here that the antennas are lossless. If losses are added, the situation becomes a bit more complicated but not substantially different.7 Angle between two directions for which the power density is half that at the center of the main beam.8 The antennas are actually tilted to get optimum coverage within the cell.
Higher Frequency Cell Systems Such as those to be Used for 5GAt higher microwave and millimeter wave frequencies used by 5G wireless systems, the situation is different since the wavelength is smaller. Because the available gain increases for larger size compared to wavelength, however, a directive antenna can be constructed that has significant gain but is not large in dimension. More specifically, for an “ideal” base station antenna9, the gain can be written as
(4)
where Ap is the physical size of the panel that constitutes typical mil-limeter wave base stations. An example of such a panel antenna is shown in Fig. 11. If Eqn.4 is substituted into Eqn. 2, the result is
9 An ideal antenna is a rectangular antenna with a uniform distribution of electromagnetic field across its surface. Practical antennas in the millimeter range may have gains of approximately 1/10th that of this ideal antenna. The purpose of the gain is not to increase the field strength at the receiver, rather it is to reduce transmitter power so that the signal at the receiver is just adequate for communication.
2
7500
BW
Gθ
=
Figure 10. A directive panel antenna with a beam that is wide in the horizontal plane and narrow in the vertical plane. These antennas are usually tilted to direct power towards the intended cell.
2
4 pta
AG
πλ
=
11390580

5G RF Exposure Assessment and Implications for Safety 8 May 2020
(5)
Clearly, this result is independent of wavelength which means that the transmitted power required to effectively communicate with mobiles at the edge of the cell is roughly independent of frequency. The received power required for successful communication depends on the level of interference at the mobile.
There are trade-offs and some limitations as a result of this higher frequency system. In order to have antennas with high enough gain to overcome the wavelength term (in Eqn 2.) the pattern must be narrow in both horizontal and vertical directions. Hence, this beam does not cover the entire cell and must be “steered” dynamically (aimed and moved) as shown in Fig. 12. As the mobile receiver moves from one point to another, the beam follows it.
This need complicates the electronics associated with the antenna, but delivers a benefit. Power is radiated only in the direction it needs to be. Hence, the contribution of the desired signal to the interference at other receivers is reduced as illustrated in Fig. 13. The signal directed towards mobile #1 interferes very little with the signal directed towards mobile #2 and the transmitter power needed for effective communication with either mobile is not as large.
Before moving on, a key physical aspect of the mobile needs to be highlighted, namely its size. Because the mobile phone is limited in size, it is not generally possible to achieve much gain from this an-tenna. Hence, for simplicity, the gain of the mobile antenna will be considered to be constant with frequency. Nevertheless, in some 5G systems, it is possible to obtain some modest gain from the mobile antenna.
Finally, if the minimum power into the transmitter needed to suc-cessfully deliver communication to the mobile is reduced, it is also possible (done in practice) to reduce the power transmitted by the mobile. This power reduction, in theory, reduces RF exposure for the mobile user as well as nearby users and increases battery life. Again, power conservation drives the system design.
Effect of Cell Size on RF Exposure - Lower Micro-wave FrequenciesGiven this background, it is now useful to consider the question of whether exposure to RF electromagnetic fields is larger for physically large or small cells. To begin, consider a traditional cell (assumed to
24p ra
r t
A GP P
Rπ=
Figure 11. A typical “flat panel” millimeter wave base station antenna. Each small vertical element is an individual antenna. Courtesy of Bob Conley, Eigenwireless
Figure 12. Dynamic beam steering of a base station antenna as the receiver moves the beam moves to follow it.
Figure 13. Illustration of simultaneous communication between one base station and two mobiles.
11390580

5G RF Exposure Assessment and Implications for Safety 9 May 2020
Assuming an isotropic10 horizontal radiation pattern (over the cell sector of interest) the incident power density11 at any point in the cell for a typical vertical radiation pattern is
(6)
where Pd(ρ) is the incident power density at a point in the cell, Pt is the transmitter power and R is the distance from transmitter to point on the ground (i.e., R=(h2+ρ2)1/2). The beamwidth of the antenna (due to the narrow beamwidth in the vertical direction) is accounted for by the factor ρ/ρc. Further the antenna is assumed to be tilted slightly so that the main beam points at the cell boundary (Fig. 16b). A simple vertical antenna with a cosinusoidal radia-tion pattern in the vertical plane is also depicted (Fig. 16a). For the simple vertical antenna, the gain is much more uniform in the verti-cal plane, but has null directly above and below it. Hence, the signal strength at any given distance is more uniform than for the beam antenna. Given this, the signal strength near the antenna is larger than further from it such as by the cell boundary, as illustrated in Fig. 16a. The use of an antenna with a narrow beam mitigates this problem by reducing the gain in directions closest to the antenna.
10 The cell is sectored and this isotropy (uniformity) applies only to the relevant sector.11 There are earth reflections and more complicated propagation formulas that are used for practical designs of cells. Nevertheless, using incident radiation yields a realistic estimate.
be circular for convenience) with a fixed antenna that radiates uni-formly over a 120 degree “sector” with a narrow beam in the vertical direction (Fig. 10). One “sector” of the “cell” (i.e., between the red lines in Fig. 14) spans angles from -60 to +60 degrees (or -π/3 to π/3 radians). The transmitter is located on a tower at height h at the center of the cell and the radius of the cell is ρc (shown in Fig. 14).
The vertical position of the antenna is shown in Fig. 15.
Figure 14. A directive sector antenna that radiates into the -60 to +60 degrees sector (1/3 of the circle).
Figure 15. Tower at the center of a circular cell (as depicted in Figure 14).
2
( / )( )40
ta c td
G PPR
ρ ρρπ
=
11390580

5G RF Exposure Assessment and Implications for Safety 10 May 2020
The half power point for this pattern occurs when
(8)
The width of this vertical beamwidth can be determined empirically, by referring to Fig. 15. For a vertical pattern described by ρ/ρc,
(7)
Figure 16. Comparison of simple vertical (a) and narrow beam (b) base station antennas. The RF exposure on the ground for the simple antenna is higher than that for the beam antenna.
tan tantan tanc c c
hh
ρ θ θρ θ θ
= =
1/21tan tan tan2 cθ θ θ= =
Figure 17. Comparison of relative incident power density at different distances away from a vertical antenna and an antenna with a half power beamwidth of 11.2 degrees. Each antenna was assumed to be located 10 meters above the earth.
11390580

5G RF Exposure Assessment and Implications for Safety 11 May 2020
For ρc/h varying between 10 and 100, θ1/2 varies between = 84.3° and θ = 89.4°. Hence the half power beamwidth for this simple model varies between 11.2° and 1.2°.
For small cells, on the order of 100 meters in size, this 11.2 degree beamwidth is comparable to beamwidths used in practice. Assume that the antenna is tilted so that the main beam is pointed at the cell boundary. In addition, assume the transmitter power is set so that the incident signal at the boundary of the cell is the minimum power density necessary for reliable communications (i.e. Pdmin). Given these assumptions, and using Eqn. 6
(9)
Hence,
(10)
The impact of the beamwidth on the RF exposure level on the earth is illustrated in Fig. 17. In this scenario, the incident power density (normalized to the minimum power density required for successful communication) for a base station antenna at 10 meters in height in the center of a small cell (radius = 100 m) is shown. Two cases are illustrated: first, an antenna with an 11.2 degree vertical beamwidth (blue line) and, the second, an antenna that radiates equally in all directions in the vertical plane (red line). Clearly, the antenna with finite beamwidth provides sufficient power over the whole cell sur-face that is more spatially uniform resulting in less wasted power.
The average incident power density (Pdavg) over all points within the cell is the incident power density summed over all points within the cell12 divided by the area of the cell. If ρc >> h (for most cases), the average power density on the Earth can be written as
(11)
Assume that the small cell has a radius ρc of 100 meters and an antenna height h of 10 meters. For a small cell
12 The average incident power density is calculated using mathematical integration, a step not depicted here.
(12)
The average incident power density (using the narrow beam antenna) is only 1.69 times the minimum needed for effective com-munication. This result represents a fairly efficient system.
The same model cannot be used for larger cell sizes which typically have much greater ratios of cell size to tower height (ρc >> h). For a cell radius of 1 km and an antenna height of 30 meters, the method ending in Eqn. 11 would simulate an antenna with a beamwidth of 1.2°. For this case, the average incident power is bounded by the result for an antenna with a vertical beamwidth of 1.2° (Eqn. 11) and a vertical antenna with a cosinusoidal vertical pattern.
For the antenna with the cosinusoidal pattern, incident power den-sity from Eqn. 10 is modified to
(13)
Again, the average incident power density (Pdavg) over all points within the cell is the incident power density summed (i.e., math-ematically integrated) over all points within the cell divided by the area of the cell. The result is
(14)
where Eqn. 14 was integrated numerically. Pdavg for the 1.2° beam case, from Eqn. 11, has h/ρc = 1/30 and is equal to 1.91Pdmin. For this example, the range is
Pd (small cell 100 meters) = 1.69 Pdmin < a number between 1.91 Pdmin and 6.41 Pdmin (large cell)
Conservatively, the calculations mean average power density in a traditional small cell is about 2-3 times smaller than that in a large cell. Further, the incident power density is much more uniform (as previously illustrated in Fig. 17) for a small cell. This calculation assumes the same transmitter power in each case. If mobile com-munication usage increases over time, RF exposure will increase from the the current usage baseline. This is true whether the cells are
2
min40 c
t dta
RP PGπ
=
2min
2( ) c dd
c
R PPR
ρρρ
=
min2 12davg d
c
hP P πρ
≅ −
min min2 1 1.6920davg d dP P Pπ ≅ − ≅
3min
3( ) c dd
c
R PPR
ρρρ
=
3 2min
min3 20
2 6.41c
d cdavg d
c
P RP d PR
ρ ρ ρρ
≅ =∫
11390580

5G RF Exposure Assessment and Implications for Safety 12 May 2020
of factors involved in these scenarios and, owing to the fact 5G systems are not yet fully implemented, make the problem best ad-dressed statistically. Exposure modelling is beyond the scope of the current document. However, two different recent research papers have addressed the matter of potential environmental levels of 5G millimeter wave exposure expected to be produced by the deploy-ment of large numbers of “small cells” [5,6]. Both of these papers conclude that ambient millimeter wave exposures will most likely be substantially less than those associated with fixed beam 2G, 3G and 4G cellular base stations, owing to the low power and intermittent active beams used by beam-forming antennas proposed to be used with 5G millimeter wave technology.
More specifically, quoting from [5] with key points highlighted:
“The results – based on simulations of more than 200 different exposure scenarios – reveal that, for all user types, except for non-users (including passive mobile phone users and users dominantly using downlink data traffic, e.g., video streaming), total exposure is dominated by the persons own mobile device. ... Further, the results show that peak exposure of non-users is not defined by exposure to base stations but by exposure to mobile devices of close bystanders in urban areas resulting in 6 dB (or a factor of 4) higher exposure than from a nearby base station antenna. While a reduction of the mobile cell size leads to a reduction in total exposure by a factor of 2 to 10 for people actively using their mobile devices, this might also lead to a small increase by a factor of 1.6 in total exposure of non-users due the generally increased incident signal levels from the surrounding base stations. Similarly, the exposure of active users can be reduced by a factor of 4 to 600 by increasing the indoor network coverage. Yet, in line with the results for the mobile cell sizes, increased indoor coverage will also lead to increased exposure of non-users by a factor of 2 to 10. This increase, however, starts at a level 1000 times lower than the typical total exposure of active users.”
Work Near 5G AntennasWhile regulatory bodies such at the FCC have not required the use of specific procedures for complying with RF exposure regulations, common procedures have been developed for this purpose. More specifically, human access to areas near antennas that radiate RF electromagnetic fields has been limited through the definition of compliance, occupational and exceedance zones. Exceedance zones are regions where RF Safety occupational standards or guidelines are exceeded and where individuals (e.g., workers) should not be al-
large or small or whether the technology is legacy (i.e., 3G or 4G) or 5G. Nevertheless, the increase in usage needed to overcome the advantage of using small cells (i.e., reduced RF exposure) compared to larger cells would have to be significant.
Again, this issue addresses only the base station fields. The mobile device fields are also reduced because as the “interference” is de-creased, hence the power required to get successful communication is also decreased.
What can be learned about public exposure from measurements?Before moving on to the case for “new” 5G technologies, extensive international RF measurements are consistent with the theoreti-cal calculations provided above [3]. These public areas, ground level measurements span 23 countries over 5 continents and the years 2000 – 2010 during which the use of cell phone technology expanded rapidly.
Conclusions that can be made from these measurements are that,
“irrespective of country, the year and cellular technology, exposures to radio signals at ground level were only a small fraction of the relevant human exposure standards.”
Further,
“there has been no significant increase in exposure levels since the widespread introduction of 3G mobile services.”
Reasons for the relatively steady exposure level at any given loca-tion despite the rapid growth in use of the wireless communication system include the introduction of smaller cells, reduction of aver-age power levels of base stations and mobile phones through active power management.
Effect of Cell Size on RF Exposure - Higher Micro-wave and Millimeter Wave FrequenciesAs indicated earlier, RF exposure is expected to be lower in 5G small cells because 1) less power is needed to reach users at the edges of smaller cells and 2) the use of narrow beams may reduce both exposure of users outside the beam direction and 3) the potential is reduced for interference to other users which in turn means that transmitter power may also be decreased. However, the actual RF exposure scenarios may be more complex because the beam direction is dynamic (changing over time and space) and the total exposure depends on the number of users [4]. The number
11390580

5G RF Exposure Assessment and Implications for Safety 13 May 2020
lowed. Information about how these zones have been determined in the past can be found in elsewhere [7,8] while definitions from the International Telecommunications Union are provided below [9].
Compliance zone: In the compliance zone, potential exposure to EMF is below the applicable limits for both controlled/occupational exposure and uncontrolled/general public exposure.
Occupational zone: In the occupational zone, potential exposure to EMF is below the applicable limits for controlled/occupational exposure but exceeds the applicable limits for uncontrolled/general public exposure.
Exceedance zone: In the exceedance zone, potential exposure to EMF exceeds the applicable limits for both controlled/occupational exposure and uncontrolled/general public exposure
An example of these zones near an omnidirectional transmitting an-tenna is shown in Fig. 18. In this case, workers trained in RF safety procedures would only be allowed in the exceedance zone if the transmitter was not operating. Workers who are fully aware of the potential for exposure and can exercise control over their exposure may be allowed to work in the occupational zone while the trans-mitter is operating but must be careful to limit their exposure to the duration specified in the applicable regulation. The general public is allowed in the compliance zone when the transmitter is operating.While this example shows a two-dimensional exceedance zone, it is generally three dimensional and centered on the antenna location which is above ground level.
Since small cell radio (i.e., a wireless transmitter and receiver) instal-lations may be placed on electrical distribution poles, identification of the types of antennas is important for electric power company workers. Two examples are illustrated below. : First, an antenna is mounted on a utility pole in the communications space (i.e., suf-ficiently below the high voltage conductors and apparatus for safe work for individuals not trained to work near high voltage) and shows locations of the antenna, a riser (cable carrying radio signals to the antenna), the radio components and a disconnect switch (Fig. 19a). The second example shows a similar antenna mounted on a pole top above the high voltage space (Fig. 19b).
Once a small cell installation is located in the area, it is important for workers to understand proper safety procedures to follow before working near small cell antennas. In most cases, it should be as-sumed that workers in the immediate vicinity of the antenna will be in the exceedance zone and appropriate steps taken. Given this,
the U.S. Federal Communications Commission (FCC) requires that telecommunication companies post an RF safety notice sign on the pole near the installation (Fig. 20). Workers who climb poles need to be cognizant of potential for exposures as outlined by the FCC. More specifically, electric utility companies should provide writ-ten guidelines for compliance in their RF safety awareness program [10,11] . The sign may provide a telephone number for electri-cal workers to call to contact the telecommunications company before proceeding. Generally, the worker is expected to inform the telecommunications company that they intend to work near the antenna and then to turn off the transmitter during their work [12,13]. Workers can be given access to a disconnect (shown in Fig. 19b) that can be used to power down the transmitter. They are also expected to inform the telecommunications company when the work is completed and to turn the transmitter back on at that time.
Given this background, it is also useful to discuss the definition of an exceedance zone near a 5G antenna and the uncertainty sur-rounding related exposures. Four possible approaches may be used to determine the RF electromagnetic field exposure. The first meth-od is the traditional method that considers the theoretical maximum power in all directions. [7,8] However, designing the compliance boundary in this way for 5G systems that use narrow time varying beams would result in unrealistically large exceedance zones [14]. The second method assesses total exposure via measurement at a specific point in space and during a specific observation time, using
Figure 18. Illustration of exceedance, occupational and compliance zones for an omnidirectional antenna. The shape of the zones will differ between antennas with different directional characteristics.
11390580

5G RF Exposure Assessment and Implications for Safety 14 May 2020
Eqns. 9 -10 of the International Commission on Non-Ionizing Radiation Protection (ICNIRP) guidelines [15]. According to Keller [16], one should measure the square of the root-mean-square (rms) value of the external electric and magnetic field strength using a filtered broadband probe. The frequency response of the weighting filter is the reciprocal of the ICNIRP reference levels, which vary with frequency. The integration time of the rms detector can be as high as 30 minutes. Since the method is applicable to any kind of signal, Keller notes it also applies to those emitted by a 5G antenna. However, the result may not reflect the time averaged exposure, the theoretical maximum exposure or any other specified value in between. The third approach determines the theoretical maximum exposure for a 5G installation and are detailed elsewhere [16,17]. The first step with this approach is to identify signal components transmitted by 5G base stations which do not depend on the cur-rent traffic load and user behavior. Only the synchronization signals and physical broadcast channel (SS/PBCH) block fulfill this condi-tion. Whether extrapolation to the worst-case exposure is possible
Figure 19. Two examples of small cells co-located on utility distribution (a) Mounted within the communications space (b) Mounted above the high voltage space. Both show a disconnect that should be used before working on the pole. (photos courtesy of J. Cox of PGE, Portland, OR).
(a) (b)
Figure 20. An RF exposure warning sign posted allocated near a 5G small cell transmitter/antenna (courtesy Bob Conley, Eigenwireless)
11390580

5G RF Exposure Assessment and Implications for Safety 15 May 2020
exposure under a variety of conditions, by the assumptions defined. The dimension of the exceedance zone can then be determined by defining the RF exposure as a certain percentage level of the CDF such as at the 95% and 99% levels [19,20,21].
Discussions and new approaches to determine potential exposures from 5G systems are evolving, various exposure committees monitor the research with an aim of consensus and eventually development of measurement standards and exposure guidelines [22].
RF Safety Guidelines and RegulationsWorldwide, most government RF exposure limits are based on guid-ance developed by the IEEE International Committee on Electro-magnetic Safety (IEEE/ICES) and ICNIRP. More specifically, the FCC regulations in the U.S. refer to the IEEE while most European country regulations refer to ICNIRP. Both sets of limits were revised and updated in 2019 [23,24]. It is noteworthy that changes from the previous versions of these standards/guidelines were minimal. Further, over the frequency range occupied by 5G systems, the stan-dards/guidelines developed by both groups are in agreement.
The 2019 versions of the IEEE and ICNIRP whole body exposure limits for general public and occupational at frequencies relevant to 5G are listed below (Tables 1 and 2) [23,24] A specific reference to the FCC standards can be found within the docket, Guidelines for Evaluating the Environmental Effects of Radiofrequency Radiation (ET Docket No. 93-62) [25].
for 5G is unclear, there are two possible methods for worst-case scenario extrapolation based on SS/PBCH block measurements. The first uses a frequency selective measurement of the field strength of the SS/PBCH block, and the second method uses a code selective measurement of the field strength of the SS [16,17]. In some coun-tries (e.g., Germany, Austria, and Switzerland), exposure measure-ments from individual signal components are carried out indepen-dent of the traffic load or user behavior and then extrapolated to a theoretical maximum exposure.
The use of theoretical maximum power may lead to conservative and large compliance boundaries (or exceedance zones) which may complicate the 5G installation [17]. In Joshi et al.[18], long term measurements of 3G base station output power levels were present-ed. The mean and 95th percentile values were found to be 24% and 53% of the theoretical maximum, respectively. This result suggests that the use of the sum of theoretical maximum power levels for RF exposure compliance assessments is too conservative.
Lastly, the fourth method for defining the exceedance zone for a 5G installation follows from the measurements reported above. The RF exposure at any point in space will vary rapidly due to such factors as the number and spatial distribution of users, time division duplex between base station and user equipment, beam characteristics and base station power adjustments to achieve minimum transmitted power. Hence, the idea for the fourth approach is to make some reasonable assumptions about the system design and usage and to calculate a cumulative distribution function (CDF) of the RF
Frequency. Range Incident Power Density Averaging Time
IEEE C95.1 (2019) 2-300 GHz 10 W/m2 30 minutes
ICNIRP (2019) 2-300 GHz 10 W/m2 30 minutes
Table 1. Whole Body Limits for general public RF Exposure in ICNIRP and IEEE
Frequency. Range Incident Power Density Averaging Time
IEEE C95.1 (2019) 2-300 GHz 50 W/m2 30 minutes
ICNIRP (2019) 2-300 GHz 50 W/m2 30 minutes
Table 2. Whole Body Limits for occupational RF Exposure in ICNIRP and IEEE
11390580

5G RF Exposure Assessment and Implications for Safety 16 May 2020
ConclusionsThe fifth generation (5G) of communication will enhance the electrical grid of tomorrow by enabling the use of augmented and virtual reality, automated vehicles, automated drones, and commu-nications between electric utility infrastructure and its central office. 5G technologies will be installed alongside components of existing technologies such as 4G and use different, higher frequencies. The introduction of 5G will result in the use of small cell sizes which will use less power and, consequently, reduce RF exposure for the active uses. 5G employs use of new antenna technologies to direct energy and reduce overall power levels for active users. Increases in usage would need to be significant to offset the advantages of small cells (reduce power levels and reduced RF exposures) compared to large cells.
In simulation work, total RF exposure for all users was dominated by mobile phone use. Peak exposure for passive or non-user was dominated by nearby active users. The increase in network coverage (increased number of antennas in an area) can increase bystander ex-posure, albeit by a small amount. For active users, a reduction in cell size reduces total RF exposure as do increases in indoor coverage.
In summary, RF exposure scenarios are complex because several factors are dynamic. Beam direction changes with respect to time and space and the total number of users also changes. Current ap-proaches to assess exposure include: 1) consideration of the theoreti-cal maximum in all directions, 2) measurement of total exposure in space and time with a broadband probe over 30 minutes, 3) using the theoretical maximum for assessing base station, based on mea-surements which identify signals independent of traffic loads or user behavior and 4) calculating theoretical maximum using mathemati-cal models. However, the literature in the area of exposure assess-ment remain sparse. Further, exposure assessment will likely need to be statistical in nature, given the complexity of 5G exposure. RF safety awareness will continue to be an important component of an electric power company’s safety program.
References1. J. D. Kraus, Antennas 2nd Edition, McGraw Hill, 1998
2. C. A. Balanis, Antenna Theory, Harper and Rowe, New York, 1982
3. Rowley, J. T. and K. H. Joyner, Comparative international analysis of radiofrequency exposure surveys of mobile com-
munication radio base station Journal of Exposure Science and Environmental Epidemiology (2012) pp. 304 – 315
4. Jamshed, M. A., Heliot, F., & Brown, T., “A Survey on Elec-tromagnetic Risk Assessment and Evaluation Mechanism for Future Wireless Communication Systems,” IEEE Journal of Electromagnetics, RF and Microwaves in Medicine and Biology, Vol. 4, No. 1., pp. 24-36, March 2020
5. Kuehn S., Pfeifer S., Kochali B., Kuster N. Foundation for Re-search on Information Technologies in Society (IT’IS); Model-ling of Total Exposure in Hypothetical 5G Mobile Networks for Varied Topologies and User Scenarios: A report on behalf of the Swiss Federal Office for the Environment (FOEN). Zurich, Switzerland; 2019.
6. Chiaraviglio L., Fiore M., Rossi E. 5G Technology: Which Risks from the Health Perspective? In: MA Marsan, NB Melazzi, S Buzzi, S Palazzos eds. The 5G Italy Book 2019: a Multiperspec-tive View of 5G. Parma, Italy: Consorzio Nazionale Interuniver-sitario per le Telecomunicazioni; 2019.
7. IEC 62232:2017, “Determination of RF field strength, Power Density and SAR in the Vicinity of Radiocommunication Base Stations for the Purpose of Evaluating Human Exposure,” Aug. 2017.
8. S. Blanch, J. Romeu, and A. Cardama, “Near Field in the Vicin-ity of Wireless Base-Station Antennas: An Exposure Compliance Approach,” IEEE Trans. Antennas Propagation, Vol. 50, No. 5, pp. 685–692, May 2002.
9. ITU-T, Series K: Protection Against Interference, Electromag-netic Field Considerations in Smart Sustainable Cities. ITU-T K.91 September 2018
10. Radiofrequency (RF) Safety Signs and the Electric Power Indus-try. EPRI, Palo Alto, CA: 2018. 3002014504.
11. Radio Frequency Safety for The Electric Power Industry. EPRI, Palo Alto, CA: 2002. 1005419.
12. R. Conley, R., Eigenwireless Personal Communication,
13. Busch, R. J., Busch Law Firm PLLC, Personal Communication
14. E. Degirmenci,, B. Thors, and C. Tornevik, “Assessment of com-pliance with RF EMF exposure limits: approximate methods for radio base station products utilizing array antennas with beam-
11390580
5G RF Exposure Assessment and Implications for Safety 17 May 2020
forming capabilities,” IEEE Trans. Electromagn. Compat., vol. 58, no. 4, pp. 1110–1117, Aug. 2016.
15. International Commission on Non-Ionizing Radiation Protec-tion, Guidelines for limiting exposure to time varying electric, magnetic and electromagnetic fields (up to 300 GHz). Health Physics, Vol. 74. pp. 494-522, 1998.
16. Keller, H., “On the Assessment of Human Exposure to Electro-magnetic Fields Transmitted by 5G NR Base Stations.” Health Physics, DOI” 10.1097/HP.0000000000001089, 2019
17. Aerts, S., L. Verlock, M. Van den Bossche, D. Colombi, L. Martens, C. Tornevik, and W. Joseph, “In-situ Measurement Methodology for the Assessment of 5G NR Massive MIMO Base Station Exposure at Sub-6 GHz Frequencies,” IEEE Access, Vol. 7. pp. 184658- 184667 December 20,2019.
18. Joshi, P., M Agrawal, B. Thors, D. Colombi, A. Kumar and C. Torneviki, “Power Level Distributions of Radio Base Station Equipment and User Devices in a 3G Mobile Communication Network in India and the Impact on Assessments of Realistic RF EMF Exposure,” IEEE Access Digital Object Identifier 10.1109/ACCESS.2015.2453056, July 7, 2015.
19. Thors, B., A. Furuskar, D. Colombi and C. Tornevik, “Time-Averaged Realistic Maximum Power Levels of Radio Frequency Exposure for 5G Radio Base Stations Using Massive MIMO,” IEEE Access, Vol. 5, pp 19711-19719. September 18, 2017.
20. Joshi, P., M. Agrawal, B. Thors, D. Columbi, A. Kumar, and C. Tornevik, “Power level distributions of radio base station equip-ment and user devices in a 3G mobile communications network in India and the impact on assessment of realistic RF EMF exposure, “ IEEE Access, Vol 3. Pp. 1051-1059, 2015 .
21. Baracca, P. A. Weber, T. Wild and C. Grangeat, “A Statistical Approach for RF Exposure Compliance Boundary Assessment in Massive MIMO Systems,” https://arxiv.org/pdf/1801.08351.pdf, January 25, 2018
22. https://www.iecetech.org/Industry-Spotlight/2019-04/How-the-IEC-has-been-preparing-for-5G
23. https://ieeexplore.ieee.org/document/8910342
24. https://www.icnirp.org/cms/upload/consultation_upload/IC-NIRP_RF_Guidelines_PCD_2018_07_11.pdf
25. https://transition.fcc.gov/Bureaus/Engineering_Technology/Or-ders/1996/fcc96326.pdf
Appendix Introduction to 5G The terminology “5G” refers to the fifth generation of mobile com-munications network technology presently in its initial stages of deployment. The first generation (1G) was introduced in the 1980’s and supported analog phone only with a digital equivalent speed of 2.4 kilobits per second. 2G, the second generation was intro-duced in the early 1990’s and was the first network based on digital technology. Using it expanded consumer options to text encryp-tion as well as short message service (SMS), picture messaging and multimedia messaging service (MMS). The maximum speed for 2G was about 50 kilobits per second. 3G networks became available in 1998 and allowed speeds of 2 megabits per second on station-ary or non-moving devices and 384 kilobits per second on devices in moving vehicles. 4G, the current standard for cellular networks, was introduced in the late 2000s. It is capable of supporting high-definition mobile TV and video conferencing. Moving and station-ary devices can reach speeds of tens and hundreds of megabits per second respectively.
5G is being introduced to meet the very large growth in data which is straining the capacity of existing networks as well as to facilitate communication between large numbers of autonomous connected devices. It will incorporate many components of existing 4G licensed communication networks as well as elements of existing unlicensed networks, it will eventually become a high capacity, ubiquitous communication network used to support all varieties of mobile communication.
The fundamental differences between 5G and earlier generations of mobile communication are:
• Some frequencies for the new technology in dense areas will be higher (although existing frequencies and unlicensed bands will also be used). More specifically, frequencies with wavelengths in the millimeter wavelength region will be introduced.
• More smaller cells with lower transmitted power will be used al-though existing 4G large and small cells will also be incorporated into the network.
• The bandwidth (and hence data rate) may be larger.
11390580

5G RF Exposure Assessment and Implications for Safety 18 May 2020
• The antennas for higher frequencies will be different; they will be capable of generating beams of radiation with a direction that can be dynamically changed to follow a mobile unit.
• The system will eventually be configured to support large numbers of “low bandwidth” services related to the “internet of things.”
• The RF exposure problem is different since higher frequencies do not penetrate into the body as far as lower frequencies.
5G is of interest to electrical utilities for several reasons. These include:
• requests from communication service providers for permission to place their equipment in spaces controlled by electrical utilities,
• the possible use of electric utility facilities for backhaul of data
• the use of 5G systems by electrical utilities for their own purposes, and
• the implications for exposure to radio frequency (RF) electromag-netic fields from facilities mounted on utility infrastructure.
11390580

DISCLAIMER OF WARRANTIES AND LIMITATION OF LIABILITIES
THIS DOCUMENT WAS PREPARED BY THE ORGANIZATION(S) NAMED
BELOW AS AN ACCOUNT OF WORK SPONSORED OR COSPONSORED
BY THE ELECTRIC POWER RESEARCH INSTITUTE, INC. (EPRI). NEITHER EPRI,
ANY MEMBER OF EPRI, ANY COSPONSOR, THE ORGANIZATION(S)
BELOW, NOR ANY PERSON ACTING ON BEHALF OF ANY OF THEM:
(A) MAKES ANY WARRANTY OR REPRESENTATION WHATSOEVER,
EXPRESS OR IMPLIED, (I) WITH RESPECT TO THE USE OF ANY INFORMA-
TION, APPARATUS, METHOD, PROCESS, OR SIMILAR ITEM DISCLOSED IN
THIS DOCUMENT, INCLUDING MERCHANTABILITY AND FITNESS FOR A
PARTICULAR PURPOSE, OR (II) THAT SUCH USE DOES NOT INFRINGE ON
OR INTERFERE WITH PRIVATELY OWNED RIGHTS, INCLUDING ANY PAR-
TY’S INTELLECTUAL PROPERTY, OR (III) THAT THIS DOCUMENT IS SUITABLE
TO ANY PARTICULAR USER’S CIRCUMSTANCE; OR
(B) ASSUMES RESPONSIBILITY FOR ANY DAMAGES OR OTHER LIABILITY
WHATSOEVER (INCLUDING ANY CONSEQUENTIAL DAMAGES, EVEN IF
EPRI OR ANY EPRI REPRESENTATIVE HAS BEEN ADVISED OF THE POSSIBIL-
ITY OF SUCH DAMAGES) RESULTING FROM YOUR SELECTION OR USE OF
THIS DOCUMENT OR ANY INFORMATION, APPARATUS, METHOD, PRO-
CESS, OR SIMILAR ITEM DISCLOSED IN THIS DOCUMENT.
REFERENCE HEREIN TO ANY SPECIFIC COMMERCIAL PRODUCT, PRO-
CESS, OR SERVICE BY ITS TRADE NAME, TRADEMARK, MANUFACTURER,
OR OTHERWISE, DOES NOT NECESSARILY CONSTITUTE OR IMPLY ITS
ENDORSEMENT, RECOMMENDATION, OR FAVORING BY EPRI.
THE ELECTRIC POWER RESEARCH INSTITUTE (EPRI) PREPARED THIS REPORT.
This is an EPRI Technical Update report. A Technical Update report is intended as an informal report of continuing research, a meet-ing, or a topical study. It is not a final EPRI technical report.
Note
For further information about EPRI, call the EPRI Customer Assistance Cen-
ter at 800.313.3774 or e-mail [email protected].
The Electric Power Research Institute, Inc. (EPRI, www.epri.com)
conducts research and development relating to the generation, delivery and
use of electricity for the benefit of the public. An independent, nonprofit
organization, EPRI brings together its scientists and engineers as well
as experts from academia and industry to help address challenges in
electricity, including reliability, efficiency, affordability, health, safety and the
environment. EPRI also provides technology, policy and economic analyses to
drive long-range research and development planning, and supports research
in emerging technologies. EPRI members represent 90% of the electricity
generated and delivered in the United States with international participation
extending to nearly 40 countries. EPRI’s principal offices and laboratories
are located in Palo Alto, Calif.; Charlotte, N.C.; Knoxville, Tenn.; Dallas,
Texas; Lenox, Mass.; and Washington, D.C.
Together . . . Shaping the Future of Electricity
3002018849 May 2020
Electric Power Research Institute 3420 Hillview Avenue, Palo Alto, California 94304-1338 • PO Box 10412, Palo Alto, California 94303-0813 USA 800.313.3774 • 650.855.2121 • [email protected] • www.epri.com
© 2020 Electric Power Research Institute (EPRI), Inc. All rights reserved. Electric Power Research Institute, EPRI, and TOGETHER . . . SHAPING THE FUTURE OF ELECTRICITY are registered service marks of the Electric Power Research Institute, Inc.
EPRI RESOURCES
Ximena Vergara, Principal Technical Leader 650.855.2315, [email protected]
Electric and Magnetic Fields and Radio-Frequency Health Assessment and Safety
Export Control Restrictions
Access to and use of this EPRI product is granted with the specific understanding and requirement that responsibility for ensuring full compliance with all applicable U.S. and
foreign export laws and regulations is being undertaken by you and your company. This includes an obligation to ensure that any individual receiving access hereunder who is not a U.S. citizen or U.S. permanent resident is permitted access under applicable U.S. and foreign export laws and regulations.
In the event you are uncertain whether you or your company may lawfully obtain access to this EPRI product, you acknowledge that it is your obligation to consult with your company’s legal counsel to determine whether this access is lawful. Although EPRI may make available on a case by case basis an informal assessment of the applicable U.S. export classification for specific EPRI products, you and your company acknowledge that this assessment is solely for informational purposes and not for reliance purposes.
Your obligations regarding U.S. export control requirements apply during and after you and your company’s engagement with EPRI. To be clear, the obligations continue after your retirement or other departure from your company, and include any knowledge retained after gaining access to EPRI products.
You and your company understand and acknowledge your obligations to make a prompt report to EPRI and the appropriate authorities regarding any access to or use of this EPRI product hereunder that may be in violation of applicable U.S. or foreign export laws or regulations.
11390580