Embed Size (px)
Citation preview

Nature © Macmillan Publishers Ltd 1998
8
letters to nature
478 NATURE | VOL 394 | 30 JULY 1998
Electrophysiology and staining. Recording electrodes were glass micropip-
ettes ®lled with 2±4% biocytin (Sigma) dissolved in 1 M potassium acetate.
Electrode resistances ranged from 30 to 100 MQ. The recording electrodes were
aligned so that the tips would meet approximately 1±2 mm ventral to the dorsal
surface of the striatum. After recording electrodes were inserted, the exposed
cortex was covered with a low-melting-point paraf®n wax to reduce brain
pulsations. Recordings were made using an active bridge ampli®er and then
®ltered and digitized at a rate of 4 kHz or higher. Neurons that had membrane
potentials more negative than -60 mVand action potentials more positive than
0 mV were included in the sample. Neurons were stained by passing 1.5-nA
depolarizing pulses of 300 ms duration every 600 ms for 10±60 min.
Histology. At the end of the experiment, the animals were given a lethal dose of
Nembutal or urethane intraperitoneally and were perfused intracardially with
isotonic buffered saline followed by 400 ml of 4% formaldehyde in 0.15 M
sodium phosphate buffer (pH 7.2±7.6). Intact brains were removed and
post®xed in cold phosphate-buffered formaldehyde. The brains were trimmed
and cut on a vibratome in 50-mm parasagittal sections. Sections containing
labelled neurons or processes were processed for biocytin30. Some sections were
post®xed with 1% osmium tetroxide. Cells were identi®ed by the coordinates of
the recording electrodes, which were recorded during the experiment. Only
pairs in which both neurons were identi®ed were used in the sample.
Data analysis. The membrane potential distribution was normalized and the
weighted sum of two gaussians was ®t to the data using the Levenberg±
Marquart method of nonlinear least squares. The model used was
p�v� �a����������
2pj1
p exp�v 2 m1�
2j21
� ��
1 2 a����������2pj2
p exp�v 2 m1�
2j22
� �where m1 is the mean membrane potential in the `down' state; j1 is the
amplitude of ¯uctuations within the `down' state; m2 is the mean membrane
potential in the `up' state; j1 is the amplitude of ¯uctuations within the `up' state
and a is the ratio of `down' state to `up' state. After the two best-®tting gaussians
were found, we de®ned the thresholds of the `up' and `down' states as half of
the distance between the minimum point between the two gaussians and the
modal point for that state. Using these methods, the state transition times were
converted into a point process, which was used to construct the auto- and
cross-correlograms of the state transitions. Cross-correlograms were con-
structed from the transition times of the two states, rather than cross-
correlating the waveforms of the membrane potential, so that the only
contribution to the central peak would be the jitter in the delay between the two
neurons' membrane-potential transition times. Cross-correlating the mem-
brane-potential waveforms would result in a broader peak owing to the
variability of the autocorrelation waveforms, that is, the durations of the `up'
and `down' states in each cell. Auto- and cross-correlograms of state transitions
and spikes were calculated using standard methods16 implemented using the
program Mathematica. All cross-correlograms were compared to autocorrelo-
grams of the component neurons. The central peak in the cross-correlogram,
which was present for each cell pair, was never present in the autocorrelograms.
Synchrony (strength of cross-correlation) was calculated by dividing the
magnitude of the central peak by the standard deviation of the correlogram.
Cross-correlation of the waveforms was performed using standard time-series
methods13 implemented in Mathematica. The cross-correlations were calcu-
lated starting from 100 ms from the ®rst peak within the `up' state. Only `up'
states without spikes were selected. 95% con®dence intervals were calculated
for the harmonic means of 6 cross-correlations.
Received 9 March; accepted 8 June 1998.
1. Graybiel, A. M., Aosaki, T., Flaherty, A. W. & Kimura, M. The basal ganglia and adaptive motor
control. Science 265, 1826±1831 (1994).
2. Wilson, C. J. in The Synaptic Organization of the Brain (ed. Shepherd, G.) 329±375 (Oxford Univ.
Press, New York, 1997).
3. Wilson, C. J. & Groves, P. M. Spontaneous ®ring patterns of identi®ed spiny neurons in the ratneostriatum. Brain Res. 220, 67±80 (1981).
4. Wilson, C. J. & Kawaguchi, Y. The origins of two-state spontaneous membrane potential ¯uctuations
of neostriatal spiny neurons. J. Neurosci. 16, 2397±2410 (1996).
5. Stern, E. A., Kincaid, A. E. & Wilson, C. J. Spontaneous subthreshold membrane potential ¯uctuations
and action potential variability of rat corticostriatal and striatal neurons in vivo. J. Neurophysiol. 77,1697±1715 (1997).
6. Wickens, J. R. & Wilson, C. J. Regulation of action potential ®ring in spiny neurons of the rat
neostriatum in vivo. J. Neurophysiol. 79, 2358±2364 (1998).
7. Choi, S. & Lovinger, D. M. Decreased frequency but not amplitude of quantal synaptic responses
associated with expression of corticostriatal long-term depression. J. Neurosci. 17, 8613±8620 (1997).8. Wilson, C. J. in Single Neuron Computation (eds McKenna, T., Davis, J. & Zornetzer, S. F.) 141±171
(Academic, San Diego, 1992).
9. Alexander, G. E. & DeLong, M. R. Microstimulation of the primate neostriatum. I. Physiological
properties of striatal microexcitable zones. J. Neurophysiol. 53, 1401±1416 (1985).10. Flaherty, A. W. & Graybiel, A. M. Two input systems for body representations in the primate striatal
matrix: Experimental evidence in the squirrel monkey. J. Neurosci. 13, 1120±1137 (1993).
11. Alexander, G. E. & DeLong, M. R. Microstimulation of the primate neostriatum. II. Somatotopic
organization of striatal microexcitable zones and their relation to neuronal response properties.
J. Neurophysiol. 53, 1417±1430 (1985).12. Jaeger, D., Gilman, S. & Aldridge, J. W. Neuronal activity in the striatum and palladium of primates
related to the execution of externally cued reaching movements. Brain Res. 694, 11±127 (1995).
13. Diggle, P. Time Series (Oxford Univ. Press, 1990).
14. Abeles, M. Quanti®cation, smoothing, and con®dence limits for single-units' histograms. J. Neurosci.
Methods 5, 317±325 (1982).15. Wilson, C. J. Postsynaptic potentials evoked in spiny neostriatal projection neurons by stimulation of
ipsilateral and contralateral cortex. Brain Res. 367, 201±213 (1986).
16. Perkel, D. H., Gerstein, G. L. & Moore, G. P. Neuronal spike trains and stochastic point processes.
Biophys. J. 7, 419±440 (1967).
17. Onn, S. P. & Grace, A. A. Dye coupling between rat striatal neurons recorded in vivo: compartmentalorganization and modulation by dopamine. J. Neurophysiol. 71, 1917±1934 (1994).
18. Jaeger, D., Kita, H. & Wilson, C. J. Surround inhibition among projection neurons in weak or
nonexistent in the rat neostriatum. J. Neurophysiol. 72, 2555±2558 (1994).
19. Steriade, M., Nunez, A. & Amzica, F. A novel slow (,1 Hz) oscillation of neocortical neurons in vivo:depolarizing and hyperpolarizing components. J. Neurosci. 13, 3252±3265 (1993).
20. Amzica, F. & Steriade, M. Short- and long-range neuronal synchronization of the slow (,1 Hz)
cortical oscillation. J. Neurophysiol. 73, 20±38 (1995).
21. Contreras, D. & Steriade, M. State-dependent ¯uctuations of low-frequency rhythms in corticotha-
lamic rhythms. Neuroscience 76, 25±38 (1995).22. Douglas, R. J., Martin, K. A. C. & Whitteridge, D. An intracellular analysis of the visual responses of
neurons in cat visual cortex. J. Physiol. (Lond.) 440, 659±696 (1991).
23. Wilson, C. J. The generation of natural ®ring patterns in neostriatal neurons. Prog. Brain Res. 99, 277±
297 (1993).
24. Hull, C. D., Bernardi, G. & Buchwald, N. A. Intracellular responses of caudate neurons to brain stemstimulation. Brain Res. 22, 163 (1970).
25. Plenz, D. & Kitai, S. T. Up and down states in striatal medium spiny neurons simultaneously recorded
with spontaneous activity in fast-spiking interneurons studied in cortex-striatum-substantia nigra
organotypic cultures. J. Neurosci. 18, 266±283 (1998).
26. Stern, E. A., Aertsen, A., Vaadia, E. & Hochstein, S. Stimulus encoding by multidimensional receptive®elds in single cells and cell populations in V1 of awake monkey. Adv. Neural Inf. Process. Systems 5,
377 (1993).
27. Arieli, A., Sterkin, A., Grinvald, A. & Aertsen, A. Dynamics of ongoing activity: explanation of the
large variability in evoked cortical responses. Science 273, 1868±1871 (1996).
28. O'Keefe, J. & Reece, M. L. Phase relationship between hippocampal place units and the EEG thetarhythm. Hippocampus 3, 317±330 (1993).
29. Skaggs, W. E., McNaughton, B. L., Wilson, M. A. & Barnes, C. A. Theta phase precession in
hippocampal neuronal populations and the compression of temporal sequences. Hippocampus 6,
149±172 (1996).
30. Horikawa, K. & Armstrong, W. E. A versatile means of intracellular labeling: injection of biocytin andits detection with avidin conjugates. J. Neurosci. Methods 25, 1±11 (1988).
Acknowledgements. This work was supported by a grant from the NIH. We thank B. Mattix for technicalassistance.
Correspondence and requests for materials should be addressed to E.S. ([email protected]).
Glutamate locallyactivatesdendritic outputsofthalamic interneurons
Charles L. Cox, Qiang Zhou & S. Murray Sherman
Department of Neurobiology, State University of New York, Stony Brook,
New York 11794-5230, USA. . . . . . . . . . . . . . . . . . . . . . . . . . . . . . . . . . . . . . . . . . . . . . . . . . . . . . . . . . . . . . . . . . . . . . . . . . . . . . . . . . . . . . . . . . . . . . . . . . . . . . . . . . . . . . . . . . . . . . . . .
The relay of information through thalamus to cortex is dynami-cally gated, as illustrated by the retinogeniculocortical pathway1.Important to this is the inhibitory interneuron in the lateralgeniculate nucleus (LGN). For the typical neuron, synaptic infor-mation arrives through postsynaptic dendrites and is transmittedby axon terminals. However, the typical thalamic interneuron, inaddition to conventional axonal outputs, has distal dendrites thatserve both pre- and postsynaptic roles2±6. These dendritic term-inals participate in curious and enigmatic triadic arrangements,in which each contacts a relay cell dendrite and is contacted by aglutamatergic retinal terminal that innervates the same relay celldendrite. Here we show that agonists of the metabotropic gluta-mate receptor (mGluR) activate dendritic terminals of interneur-ons in the absence of action potentials, thereby inhibiting thepostsynaptic relay neuron. Somatic recordings from LGN inter-neurons reveal that there is no response to mGluR agonists,suggesting that their dendritic terminals are electrically isolated

Nature © Macmillan Publishers Ltd 1998
8
letters to nature
NATURE | VOL 394 | 30 JULY 1998 479
from their somata and axons, consistent with anatomical model-ling of these cells7. Our results offer insight into the functioning oftriadic circuitry and indicate that thalamic interneurons canperform independent computations expressed through axonalas opposed to dendritic outputs.
Local, GABAergic, inhibitory inputs to dendrites of relay cells ofthe LGN derive from three sources: two are axonalÐfrom inter-neurons and neurons in the thalamic reticular nucleus (TRN)Ðandthe other is from the dendritic terminals of interneurons (see alsobelow). The axonal terminals, also known as F1 terminals, arepresynaptic only, and form conventional inhibitory synaptic con-tacts. The dendrites of the interneurons have been described as`̀ axoniform''8, because at their distal regions they give rise to small,thin stalks terminating in dendritic terminals. These are known asF2 terminals, and they are unusual in that they are both pre- andpostsynaptic (reviewed in ref. 1; Fig. 1A). These F2 terminals areusually involved in triads (Fig. 1A, shaded area), in which theretinogeniculate terminal provides excitatory contacts onto both arelay cell dendrite and the F2 terminal, with the F2 terminalcontacting the same relay cell dendrite (Fig. 1A). This arrangementsuggests that the retinal input produces both monosynaptic excita-tion and feedforward disynaptic inhibition at the relay cell. Finally,although all LGN relay cells receive inputs from F1 terminals, onlymorphological type 2 cells (thought to be X; see refs 9, 10) receivesigni®cant numbers of F2 inputs11, and type 1 cells (thought to be Y)do not; thus, only type 2 cells should display physiology re¯ectingtriadic inputs involving F2 terminals11. The problem has been to testthe function of these triadic circuits, which have previously beende®ned anatomically but not physiologically because of the dif®-culty in recording from or selectively activating the F2 terminals.
A possible solution to this problem was offered by immuno-cytochemical studies of the distribution of mGluRs in the cat'sLGN12, which indicated that mGluRs are selectively located post-synaptic to cortical inputs on relay cell dendrites and on F2 terminalspostsynaptic to retinal input. By suppressing the postsynaptic actionsof mGluR activation in the relay neurons, this arrangement allowsthe possibility of selectively stimulating F2 terminals with mGluR
agonists, thereby gaining a glimpse into the functioning of theseterminals speci®cally and interneurons more generally. We did thisby using whole-cell recording of relay cells and interneurons from invitro thalamic slice preparations of cats and rats.
During current clamp recording of cat LGN relay cells, the generalmGluR agonist (6)-1-aminocyclopentane-trans-1,3-dicarboxylicacid (ACPD) produced a long-lasting membrane depolarizationassociated with an increased input resistance (Fig. 1B). This pre-sumably acts through the mGluRs on relay cell dendrites and isconsistent with previous demonstrations that mGluR activationreduces a resting potassium `leak' conductance (Kleak), therebydepolarizing the membrane13,14. We also noticed that ACPD appli-cation produced a large increase in the baseline activity (Fig. 1Bb)that persisted independently of the ACPD-mediated membranedepolarization (Fig. 1Bc) and was suppressed by the GABAA
antagonist bicuculline methiodid (BMI; data not shown). Weconclude that this increased activity re¯ected spontaneous inhibi-tory postsynaptic potentials (sIPSPs), which also implies that thiseffect is independent of the ACPD-mediated reduction of Kleak inthe postsynaptic neuron.
To help isolate spontaneous inhibitory postsynaptic currents(sIPSCs), we minimized the effect of ACPD on Kleak by substitutingCs+ for K+ in the recording pipette (Cs+ will thus diffuse into the celland block the K+ conductance underlying Kleak), and we made voltageclamp recordings with a holding potential of 0 mV to increase thedriving force of the presumed Cl- conductance (Fig. 1C, D). Underthese conditions, application of ACPD (125±250 mM) increased theamplitude and frequency of sIPSCs (n � 19 cells; Fig. 1C). ThesesIPSCs were eliminated or strongly attenuated by BMI (30 mM;n � 8 of 8 cells tested; Fig. 2Ad), and their reversal potential wasnear the calculated Cl- equilibrium potential (data not shown). Thisfurther supports the conclusion that these sIPSCs activated byACPD application represented activation of GABAA receptors.
One explanation for the increased sIPSC activity is that ACPDactivated local inhibitory neurons (TRN cells and/or interneurons)that form synaptic contacts through F1 terminals onto the recordedneurons (Fig. 3A). To eliminate this possibility, we applied
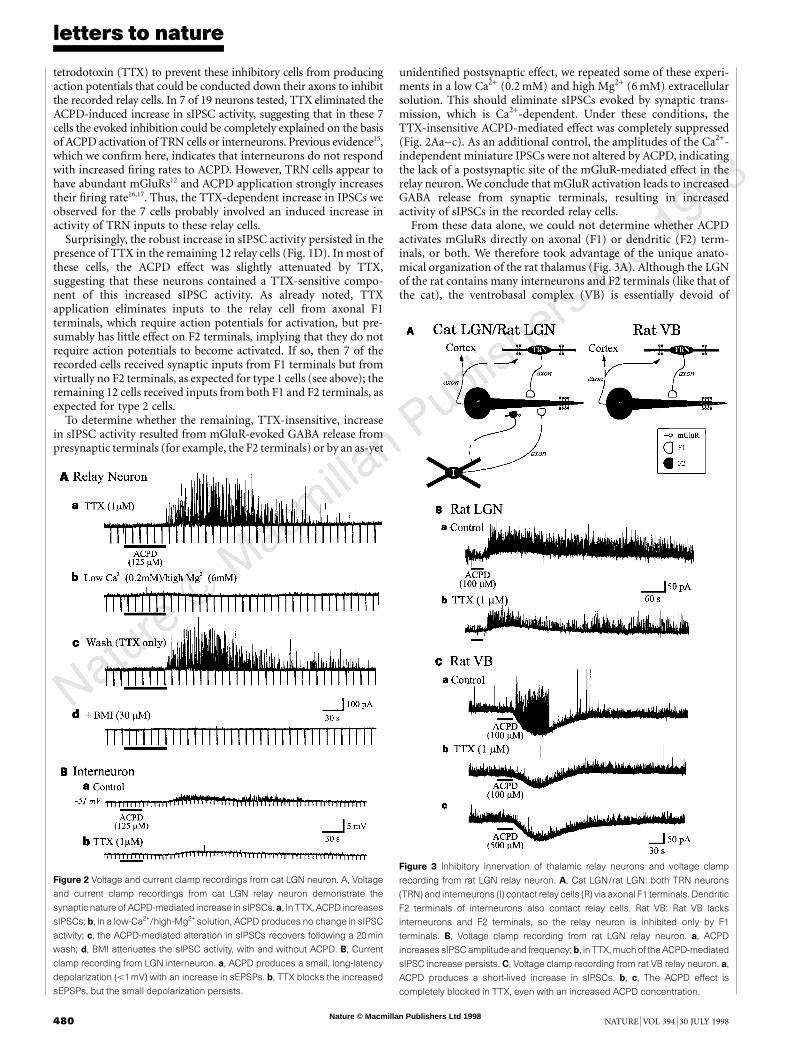
Figure 1 Activation of mGluRs increases inhibition in cat LGN relay neurons. A,
The retinal axon forms excitatory synapses onto both the relay cell (R) dendrite
and the interneuron's (I) F2 terminals. F2 terminals emanate from distal dendrites
after many branches (dashed portion) and synapse onto the relay cell. B, Current
clamp recording from relay cell. ACPD produces a long-lasting depolarization and
an increase in baseline activity. The expanded traces (a, b, c) show the baseline
activity during the indicated periods. Downward de¯ections are responses to
constant current pulses used to estimate input resistance. C, D, Voltage clamp
recording from relay neuron, C, ACPD produces a long-lasting increase in sIPSC
activity, as shown in a, b and then expanded traces below. D, This ACPD-
mediated increase in sIPSC activity persists in TTX, as shown in a, b.
Nature © Macmillan Publishers Ltd 1998
8
letters to nature
480 NATURE | VOL 394 | 30 JULY 1998
tetrodotoxin (TTX) to prevent these inhibitory cells from producingaction potentials that could be conducted down their axons to inhibitthe recorded relay cells. In 7 of 19 neurons tested, TTX eliminated theACPD-induced increase in sIPSC activity, suggesting that in these 7cells the evoked inhibition could be completely explained on the basisof ACPD activation of TRN cells or interneurons. Previous evidence15,which we con®rm here, indicates that interneurons do not respondwith increased ®ring rates to ACPD. However, TRN cells appear tohave abundant mGluRs12 and ACPD application strongly increasestheir ®ring rate16,17. Thus, the TTX-dependent increase in IPSCs weobserved for the 7 cells probably involved an induced increase inactivity of TRN inputs to these relay cells.
Surprisingly, the robust increase in sIPSC activity persisted in thepresence of TTX in the remaining 12 relay cells (Fig. 1D). In most ofthese cells, the ACPD effect was slightly attenuated by TTX,suggesting that these neurons contained a TTX-sensitive compo-nent of this increased sIPSC activity. As already noted, TTXapplication eliminates inputs to the relay cell from axonal F1terminals, which require action potentials for activation, but pre-sumably has little effect on F2 terminals, implying that they do notrequire action potentials to become activated. If so, then 7 of therecorded cells received synaptic inputs from F1 terminals but fromvirtually no F2 terminals, as expected for type 1 cells (see above); theremaining 12 cells received inputs from both F1 and F2 terminals, asexpected for type 2 cells.
To determine whether the remaining, TTX-insensitive, increasein sIPSC activity resulted from mGluR-evoked GABA release frompresynaptic terminals (for example, the F2 terminals) or by an as-yet
unidenti®ed postsynaptic effect, we repeated some of these experi-ments in a low Ca2+ (0.2 mM) and high Mg2+ (6 mM) extracellularsolution. This should eliminate sIPSCs evoked by synaptic trans-mission, which is Ca2+-dependent. Under these conditions, theTTX-insensitive ACPD-mediated effect was completely suppressed(Fig. 2Aa±c). As an additional control, the amplitudes of the Ca2+-independent miniature IPSCs were not altered by ACPD, indicatingthe lack of a postsynaptic site of the mGluR-mediated effect in therelay neuron. We conclude that mGluR activation leads to increasedGABA release from synaptic terminals, resulting in increasedactivity of sIPSCs in the recorded relay cells.
From these data alone, we could not determine whether ACPDactivates mGluRs directly on axonal (F1) or dendritic (F2) term-inals, or both. We therefore took advantage of the unique anato-mical organization of the rat thalamus (Fig. 3A). Although the LGNof the rat contains many interneurons and F2 terminals (like that ofthe cat), the ventrobasal complex (VB) is essentially devoid of
Figure 2 Voltage and current clamp recordings from cat LGN neuron. A, Voltage
and current clamp recordings from cat LGN relay neuron demonstrate the
synaptic nature of ACPD-mediated increase in sIPSCs. a, In TTX, ACPD increases
sIPSCs; b, in a low-Ca2+/high-Mg2+ solution, ACPD produces no change in sIPSC
activity; c, the ACPD-mediated alteration in sIPSCs recovers following a 20min
wash; d, BMI attenuates the sIPSC activity, with and without ACPD. B, Current
clamp recording from LGN interneuron. a, ACPD produces a small, long-latency
depolarization (,1mV) with an increase in sEPSPs. b, TTX blocks the increased
sEPSPs, but the small depolarization persists.
Figure 3 Inhibitory innervation of thalamic relay neurons and voltage clamp
recording from rat LGN relay neuron. A, Cat LGN/rat LGN: both TRN neurons
(TRN) and interneurons (I) contact relay cells (R) via axonal F1 terminals. Dendritic
F2 terminals of interneurons also contact relay cells. Rat VB: Rat VB lacks
interneurons and F2 terminals, so the relay neuron is inhibited only by F1
terminals. B, Voltage clamp recording from rat LGN relay neuron. a, ACPD
increases sIPSC amplitude and frequency;b, in TTX, muchof the ACPD-mediated
sIPSC increase persists. C, Voltage clamp recording from rat VB relay neuron. a,
ACPD produces a short-lived increase in sIPSCs. b, c, The ACPD effect is
completely blocked in TTX, even with an increased ACPD concentration.

Nature © Macmillan Publishers Ltd 1998
8
letters to nature
NATURE | VOL 394 | 30 JULY 1998 481
interneurons and F2 terminals18,19. Thus IPSCs recorded in rat VBneurons can only result from activation of F1 axonal terminals. Inrecordings from relay cells of the rat LGN in control conditions, ACPDproduced a robust increase in sIPSC activity (Fig. 3Ba; n � 19 cells),and this increase persisted in TTX (1 mM) in 5 of 9 cells (Fig. 3Bb).Thus, the TTX-insensitive mGluR effect is present in both rat andcat LGN, nuclei that contain both F1 and F2 terminals.
The effects of ACPD were then tested on rat VB neurons. Incontrol conditions, ACPD increased sIPSC activity in 10 of 17 cells(Fig. 3Ca). However, in contrast to the rat LGN neurons, the ACPD-mediated increase in sIPSC activity was completely suppressed byTTX (1mM) in all nine VB cells tested (Fig. 3Cb, c). These effects ofACPD on rat VB neurons probably represent activation of axonsand their F1 terminals from the adjacent TRN. Thus the TTX-insensitive ACPD action was absent in rat VB, a structure containingonly F1 terminals, but was present in rat and cat LGNs, each ofwhich contain both F1 and F2 terminals. These results indicate thatmost or all of the TTX-insensitive increase in sIPSCs we observed inLGN neurons is due to activation of mGluRs on F2 terminals,thereby evoking GABA release and producing inhibitory activity inLGN relay cells.
This conclusion is consistent with immunocytochemical evi-dence pointing to dense localization of mGluRs on F2 but not F1terminals in the cat LGN12. This, in turn, indicates that interneuronscan be activated through mGluRs on the dendritic F2 terminals.However, previous recordings made from somata of interneuronsrevealed no detectable effects of ACPD15. We con®rmed this in somaticrecordings from four cat LGN interneurons. Interneuron recordingswere identi®ed by their characteristic spike discharge properties15 andtwo were further identi®ed morphologically, based on injectingbiocytin through the recording electrode. ACPD produced nodiscernible effect on the interneurons except at very long latencies(1±2 min), when there is an increase in spontaneous excitatory post-synaptic potentials (sEPSPs; Fig. 2Ba). In TTX, there remains only avery long latency, small depolarization (Fig. 2Bb). The cause of thesecurious long-latency effects of ACPD recorded at the somata willrequire further investigation, but it seems clear that their latency istoo long to be related to the effects attributed to activation of theF2 terminals of these same cells (compare Figs 1±3).
Our ®ndings suggest that the effects of activating F2 terminalssynaptically (via mGluRs) are so electronically distant from the cell'ssoma and axon hillock that they have negligible in¯uence there7.The interneuron may thus perform simultaneous and largelyindependent computation operations: one involves inputs to theproximal dendrites and soma expressed conventionally via the axon;the other involves a collection of local functional circuits via F2terminals that are both pre- and postsynaptic and do not requireaction potentials. This indicates that the typical somatic recordingof these cells may reveal nothing of the processing involving their F2terminals. In addition, our results offer insight into the functioningof triadic circuitry. The retinal synapses onto relay cells appear toactivate only ionotropic glutamate receptors (iGluRs)14, whereas, asour data indicate, these retinal terminals can activate mGluRs on theF2 terminals. Whether retinal terminals can also activate iGluRs onF2 terminals is not known. Nonetheless, the differential require-ments for activation of iGluRs rather than mGluRs suggest that therelative monosynaptic excitation and disynaptic inhibition evokedby retinal inputs in the relay cells may differ with different ®ringpatterns of the retinal axon. For example, mGluR activation mayrequire higher rates of afferent activity than iGluR activation14,implying that the disynaptic inhibition develops more strongly asthe retinal axons ®re at a greater frequency. This would limit theamplitude of retinogeniculate transmission more as retinal cellsbecome more excited. This may prevent geniculate relay cellsfrom saturating in their response to stronger visual stimuli,thereby extending their dynamic range of responsiveness to visualstimuli. M
. . . . . . . . . . . . . . . . . . . . . . . . . . . . . . . . . . . . . . . . . . . . . . . . . . . . . . . . . . . . . . . . . . . . . . . . . . . . . . . . . . . . . . . . . . . . . . . . . . . . . . . . . . . . . . . . . . . . . . . . .
Methods
Slice preparation. Intracellular recordings were made from relay neurons in
cat and rat LGN, and rat VB using whole-cell techniques. Thalamic slices were
prepared from young cats (5±8 weeks) and rats (postnatal age, 12±18 days) in
compliance with approved animal protocols. Brie¯y, animals were deeply
anaesthetized with ketamine (25 mg kg-1 for cats; 33 mg kg-1 for rats) and
pentobarbital sodium (cats only; 50 mg kg-1). A block of tissue containing
the LGN and VB was removed and placed in cold, oxygenated slicing solution
containing (in mM): 2.5 KCl, 1.25 NaH2PO4, 10.0 MgCl2, 0.5 CaCl2, 26
NaHCO3, 11.0 glucose and 234.0 sucrose. Thalamic slices (250±300 mm) were
cut in a coronal or sagittal plane with a vibrating tissue slicer and placed in a
holding chamber (30 8C) for .2 h before recording. Individual slices were
transferred to a submersion-type recording chamber (cat tissue maintained at
30 8C; rat tissue maintained at room temperature) and continuously perfused
with oxygenated physiological solution containing (in mM): 126.0 NaCl, 2.5
KCl, 1.25 NaH2PO4, 2.0 MgCl2, 2.0 CaCl2, 26.0 NaHCO3, 10.0 glucose, pH 7.4.
Whole-cell recording. Whole-cell recordings were obtained from neurons
visualized using a high-power water immersion objective within the slices20,21.
The recording pipette solution contained (in mM): 117.0 caesium gluconate,
13.0 CsCl, 1.0 MgCl2, 0.07 CaCl2, 0.1 ethylene glycol-O,O9-bis(2-
aminoethyl)-N,N,N9,N9-tetraacetic acid (EGTA), 10.0 N-(2-hydroxyethyl)piper-
azine±N9-(2-ethanesulphonic acid)(HEPES) and 0.5% biocytin. In some record-
ings, potassium gluconate and KCl were substituted for Cs gluconate and CsCl.
The solutions were adjusted to a ®nal pH of 7.3 and osmolality of 280 mosm.
An Axoclamp 2A ampli®er (Axon Instruments) was used in continuous single-
electrode voltage clamp mode for current recordings. With Cs+-containing
recording pipettes, sIPSCs were recorded in voltage clamp mode at a holding
potential (Vhold) of 0 mV. Hyperpolarizing voltage steps were repetitively given
throughout the experiment to monitor any changes in the access resistance
(Raxs), and recordings were limited to those cells with a stable Raxs , 20 MQ. No
correction for liquid junction potential has been made to voltage measure-
ments. ACPD was applied by injecting a bolus into the ¯ow line of the chamber
over 30±60 s using a motorized syringe pump. On the basis of the rate of agonist
injection and the rate of chamber perfusion, the estimated ®nal bath concentra-
tion of ACPD was estimated to be about one-fourth of the concentration
introduced in the ¯ow line. All other pharmacological agents were bath-applied.
Received 25 March; accepted 11 May 1998.
1. Sherman, S. M. & Guillery, R. W. Functional organization of thalamocortical relays. J. Neurophysiol.
76, 1367±1395 (1996).
2. Famiglietti, E. V. Jr & Peters, A. The synaptic glomerulus and the intrinsic neuron in the dorsal lateralgeniculate nucleus of the cat. J. Comp. Neurol. 144, 285±334 (1972).
3. Guillery, R. W. The organization of synaptic interconnections in the laminae of the dorsal lateral
geniculate nucleus of the cat. Zeitschr. Zellforsch. Mikroskop. Anat. 96, 1±38 (1969).
4. Hamos, J. E., Van Horn, S. C., Raczkowski, D., Uhlrich, D. J. & Sherman, S. M. Synaptic connectivity of
a local circuit neurone in lateral geniculate nucleus of the cat. Nature 317, 618±621 (1985).5. Montero, V. M. Localization of gamma-aminobutyric acid (GABA) in type 3 cells and demonstration
of their source to F2 terminals in the cat lateral geniculate nucleus: a Golgi±electron-microscopic
GABA±immunocytochemical study. J. Comp. Neurol. 254, 228±245 (1986).
6. Ralston, H. J. Evidence for presynaptic dendrites and a proposal for their mechanism of action. Nature
230, 585±587 (1971).7. Bloom®eld, S. A. & Sherman, S. M. Dendritic current ¯ow in relay cells and interneurons of the cat's
lateral geniculate nucleus. Proc. Natl Acad. Sci. USA 86, 3911±3914 (1989).
8. Guillery, R. W. A study of Golgi preparations from the dorsal lateral geniculate nucleus of the adult cat.
J. Comp. Neurol. 128, 21±50 (1966).
9. Friedlander, M. J., Lin, C.-S., Stanford, L. R. & Sherman, S. M. Morphology of functionally identi®edneurons in lateral geniculate nucleus of the cat. J. Neurophysiol. 46, 80±129 (1981).
10. LeVay, S. & Ferster, D. Relay cell classes in the lateral geniculate nucleus of the cat and the effects of
visual deprivation. J. Comp. Neurol. 172, 563±584 (1977).
11. Wilson, J. R., Friedlander, M. J. & Sherman, S. M. Fine structural morphology of identi®ed X- and Y-
cells in the cat's lateral geniculate nucleus. Proc. R. Soc. B 22, 411±436 (1984).12. Godwin, D. W. et al. Ultrastructural localization suggests that retinal and cortical inputs access
different metabotropic glutamate receptors in the lateral geniculate nucleus. J. Neurosci. 16, 8181±
8192 (1996).
13. Charpak, S., GaÈhwiler, B. H., Do, K.-Q. & KnoÈpfel, T. Potassium conductances in hippocampal
neurons blocked by excitatory amino-acid transmitters. Nature 347, 765±767 (1990).14. McCormick, D. A. & von Krosigk, M. Corticothalamic activation modulates thalamic ®ring through
glutamate `̀ metabotropic'' receptors. Proc. Natl Acad. Sci. USA 89, 2774±2778 (1992).
15. Pape, H.-C. & McCormick, D. A. Electrophysiological and pharmacological properties of interneur-
ons in the cat dorsal lateral geniculate nucleus. Neuroscience 68, 1105±1125 (1995).
16. Lee, K.H. & McCormick, D. A. Modulation of spindle oscillations by acetylcholine, cholecystokininand 1S,3R-ACPD in the ferret lateral geniculate and perigeniculate nuclei in vitro. Neuroscience 77,
335±350 (1997).
17. Sherman, S. M. & Cox, C. L. Excitatory and inhibitory actions of metabotropic glutamate receptor
activation in rat thalamic reticular neurons. Soc. Neurosci. Abstr. 23, 73.10 (1997).
18. Arcelli, P., Frassoni, C., Regondi, M. C., De Biasi, S. & Sprea®co, R. GABAergic neurons in mammalianthalamus: A marker of thalamic complexity? Brain Res. Bull. 42, 27±37 (1997).
Nature © Macmillan Publishers Ltd 1998
8
letters to nature
482 NATURE | VOL 394 | 30 JULY 1998
19. Ottersen, O. P. & Storm-Mathisen, J. GABA-containing neurons in the thalamus and protectum of the
rodent. An immunocytochemical study. Anat. Embryol. 170, 197±207 (1984).20. Edwards, F. A., Konnerth, A., Sakmann, B. & Takahashi, T. A thin slice preparation for patch clamp
recordings from neurons of the mammalian central nervous system. P¯ugers Arch. 414, 600±612 (1989).
21. Stuart, G. J., Dodt, H. U. & Sakmann, B. Patch-clamp recordings from the soma and dendrites of
neurons in brain slices using infrared video microscopy. Eur. J. Physiol. 423, 511±518 (1993).
Acknowledgements. This work was supported by National Eye Institute (NIH).
Correspondence and requests for materials should be addressed to S.M.S. (e-mail: [email protected]).
Original antigenic sin impairscytotoxicT lymphocyteresponses tovirusesbearingvariant epitopesPaul Klenerman & Rolf M. Zinkernagel
Institute for Experimental Immunology, University Hospital,
Schmelzbergstrasse 12, 8091 Zurich, Switzerland. . . . . . . . . . . . . . . . . . . . . . . . . . . . . . . . . . . . . . . . . . . . . . . . . . . . . . . . . . . . . . . . . . . . . . . . . . . . . . . . . . . . . . . . . . . . . . . . . . . . . . . . . . . . . . . . . . . . . . . . .
Some viruses, including human immunode®ciency virus (HIV)and hepatitis B virus (HBV) in humans, and lymphocytic chor-iomeningitis virus (LCMV) in mice, are initially controlled bycytotoxic T lymphocytes (CTLs), but may subsequently escapethrough mutation of the relevant T-cell epitope1±3. Some of thesemutations preserve the normal binding to major histocompat-ibility complex class I molecules, but present an altered surface tothe T-cell antigen receptor4,5. The exact role of these so-calledaltered peptide ligands in vivo is not clear. Here we report thatmice primed with LCMV-WE strain respond to a subsequentinfection by WE-derived CTL epitope variants with a CTLresponse directed against the initial epitope rather than againstthe new variant epitope. This phenomenon of `original antigenicsin' was initially described in in¯uenza6±8 and is an asymmetricpattern of protective antibody crossreactivity determined byexposure to previously existing strains, which may thereforeextend to some CTL responses. Original antigenic sin by CTLleads to impaired clearance of variant viruses infecting the sameindividual and so may enhance the immune escape of mutantviruses evolving in an individual host.
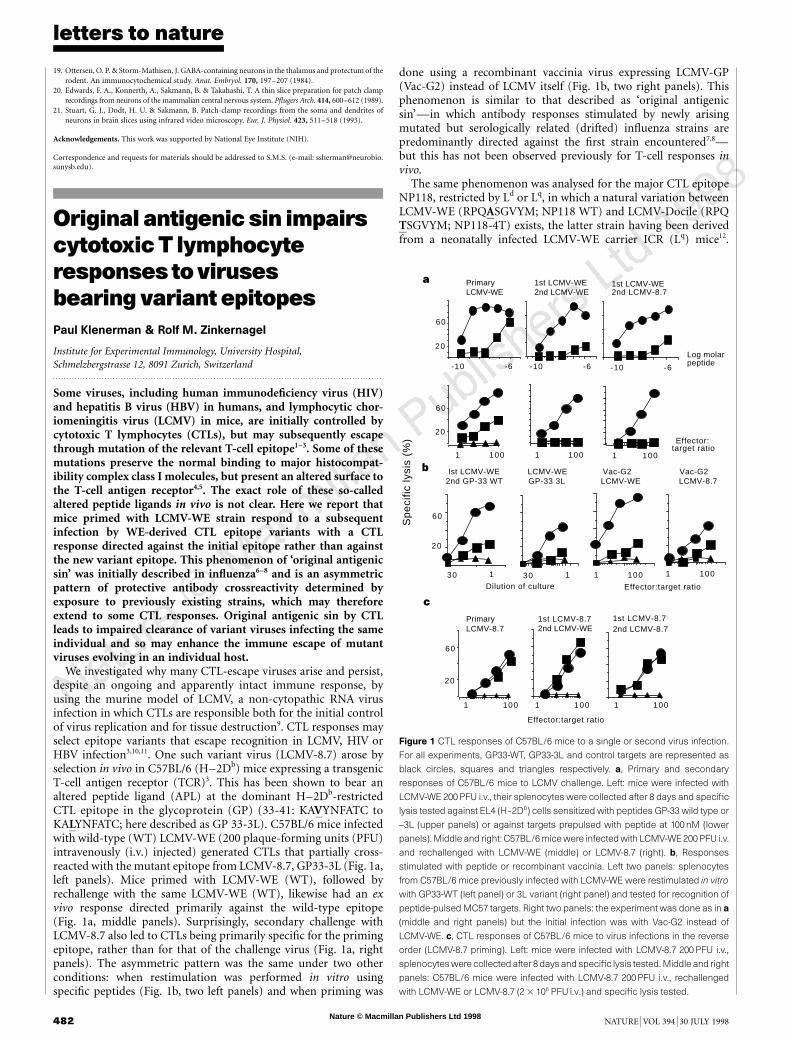
We investigated why many CTL-escape viruses arise and persist,despite an ongoing and apparently intact immune response, byusing the murine model of LCMV, a non-cytopathic RNA virusinfection in which CTLs are responsible both for the initial controlof virus replication and for tissue destruction9. CTL responses mayselect epitope variants that escape recognition in LCMV, HIV orHBV infection3,10,11. One such variant virus (LCMV-8.7) arose byselection in vivo in C57BL/6 (H±2Db) mice expressing a transgenicT-cell antigen receptor (TCR)3. This has been shown to bear analtered peptide ligand (APL) at the dominant H±2Db-restrictedCTL epitope in the glycoprotein (GP) (33-41: KAVYNFATC toKALYNFATC; here described as GP 33-3L). C57BL/6 mice infectedwith wild-type (WT) LCMV-WE (200 plaque-forming units (PFU)intravenously (i.v.) injected) generated CTLs that partially cross-reacted with the mutant epitope from LCMV-8.7, GP33-3L (Fig. 1a,left panels). Mice primed with LCMV-WE (WT), followed byrechallenge with the same LCMV-WE (WT), likewise had an exvivo response directed primarily against the wild-type epitope(Fig. 1a, middle panels). Surprisingly, secondary challenge withLCMV-8.7 also led to CTLs being primarily speci®c for the primingepitope, rather than for that of the challenge virus (Fig. 1a, rightpanels). The asymmetric pattern was the same under two otherconditions: when restimulation was performed in vitro usingspeci®c peptides (Fig. 1b, two left panels) and when priming was
done using a recombinant vaccinia virus expressing LCMV-GP(Vac-G2) instead of LCMV itself (Fig. 1b, two right panels). Thisphenomenon is similar to that described as `original antigenicsin'Ðin which antibody responses stimulated by newly arisingmutated but serologically related (drifted) in¯uenza strains arepredominantly directed against the ®rst strain encountered7,8Ðbut this has not been observed previously for T-cell responses invivo.
The same phenomenon was analysed for the major CTL epitopeNP118, restricted by Ld or Lq, in which a natural variation betweenLCMV-WE (RPQASGVYM; NP118 WT) and LCMV-Docile (RPQTSGVYM; NP118-4T) exists, the latter strain having been derivedfrom a neonatally infected LCMV-WE carrier ICR (Lq) mice12.
Effector:target ratio
1001
1st LCMV-WE2nd LCMV-WE
PrimaryLCMV-WE
20
60
-10 -6
20
60
1st LCMV-WE2nd LCMV-8.7
-10 -6
10011001
-10 -6
Log molarpeptide
Dilution of culture
Ist LCMV-WE LCMV-WE Vac-G2 Vac-G2 2nd GP-33 WT GP-33 3L LCMV-WE LCMV-8.7
20
60
30 1 30 1
PrimaryLCMV-8.7
1st LCMV-8.72nd LCMV-WE
100110011001
1st LCMV-8.72nd LCMV-8.7
a
b
c
20
60
Sp
eci
fic ly
sis
(%)
1001 1001
Effector:target ratio
Effector:target ratio
Figure 1 CTL responses of C57BL/6 mice to a single or second virus infection.
For all experiments, GP33-WT, GP33-3L and control targets are represented as
black circles, squares and triangles respectively. a, Primary and secondary
responses of C57BL/6 mice to LCMV challenge. Left: mice were infected with
LCMV-WE 200 PFU i.v., their splenocytes were collected after 8 days and speci®c
lysis tested against EL4 (H±2Db) cells sensitized with peptides GP-33 wild type or
-3L (upper panels) or against targets prepulsed with peptide at 100nM (lower
panels). Middle and right: C57BL/6 mice were infected with LCMV-WE 200 PFU i.v.
and rechallenged with LCMV-WE (middle) or LCMV-8.7 (right). b, Responses
stimulated with peptide or recombinant vaccinia. Left two panels: splenocytes
from C57BL/6 mice previously infected with LCMV-WE were restimulated in vitro
with GP33-WT (left panel) or 3L variant (right panel) and tested for recognition of
peptide-pulsed MC57 targets. Right two panels: the experiment was done as in a
(middle and right panels) but the initial infection was with Vac-G2 instead of
LCMV-WE. c, CTL responses of C57BL/6 mice to virus infections in the reverse
order (LCMV-8.7 priming). Left: mice were infected with LCMV-8.7 200 PFU i.v.,
splenocytes were collected after 8 days and speci®c lysis tested. Middle and right
panels: C57BL/6 mice were infected with LCMV-8.7 200PFU i.v., rechallenged
with LCMV-WE or LCMV-8.7 (2 3 106 PFU i:v:) and speci®c lysis tested.