Embed Size (px)
Citation preview

275
5.7 Experimental Results
In this section the dynamic overmodulation behavior of an IFOC algorithm
based induction motor drive is experimentally investigated. The drive employs
digital SFCR to achieve high bandwidth current regulation. Due to the labora-
tory limitations only an induction motor without load and without additional
inertia could be tested.
A prototype digital control board (developed at Rockwell Automation-Allen
Bradley, Inc. for PWM-VSC applications) and a commercial PWM-VSI (20
kW, 620 VDC, 460 V, 21 A, PWM-VSI by Rockwell Automation-Allen Bradley,
Inc. ) were interfaced to form the laboratory PWM inverter drive. The inverter
was diode recti�er front end type. All the control tasks were performed by a
digital signal processor (MOTOROLA 56005 DSP [80]) with a 40 MHz clock
frequency (25 ns instruction cycle). Originally designed for computer disk drive
applications, this DSP chip has six PWM counter comparators (analog/digital
hardware triangular wave carrier signal and comparator circuits eliminated).
Once loaded with the duty cycle count, each PWM counter increments the
count, compares to the reference, and outputs a gate drive logic signal. Also,
with the built in inverter blanking time generation circuit (digital), this PWM
generator eliminates the need for hardware blanking time generation circuits.
Since the digital control board was designed for PWM-VSC applications, it had
no digital motor shaft encoder interface capability and therefore the incremental
position information was absent in the controller. This hardware constraint

276
limited the drive bandwidth and the experimental investigation of drive dynamic
performance.
The controller board employed the synchronous sampling technique to mea-
sure the motor feedback currents. An A/D converter with 2 �s conversion time
and an eight-channel-multiplexer were utilized to sample the three phase motor
currents, the DC link voltage, and several other analog input signals (analog
speed feedback, speed reference and controller gains). The A/D sampling pro-
cess was triggered every carrier cycle at the instant the PWM counters were
loaded with the new duty cycle value (equivalent to triggering at the peak of
the triangle). The multiplexer sequentially selected the analog signals to be
sampled until all the analog inputs were sampled, held, put in a register, and
�nally stored in a memory location for access by the DSP.
With the motor currents being sampled �rst, the values of the �rst two
currents could be utilized to calculate the third current. With this approach,
the �rst feedback current was precisely measured (synchronous sampling), the
second feedback current was measured with 2 �s delay. The current transducer
(closed loop hall e�ect current transducers by LEM Inc. ) o�set errors were sub-
tracted from these signals by the DSP (o�sets were read and stored in the DSP
memory with the inverter disabled during initialization). The third current was
calculated from the �rst two and has an equivalent delay of 1 �s (average delay
of the other two signals). Therefore, the feedback current values represented the
per carrier cycle average currents with reasonable accuracy. This single A/D

277
solution resulted in a low cost controller and is suitable in many applications
(Worthwhile to mention is some recent motion control DSPs utilize two parallel
A/D channels and can sample two feedback currents simultaneously such that
true synchronous sampling is possible [155]). The DC link voltage and other
analog input signals were also sampled at the carrier frequency rate. However,
due to the slow variation of these signals, they could be updated at the speed
loop sampling rate (�ve times smaller than the carrier frequency).
Synchronous frame current controller with antiwindup structure (the algo-
rithm described in the simulations section of this chapter) was implemented in
the DSP and the controller calculations were updated once every carrier cycle.
The carrier frequency was selected as 5 kHz (200 � s carrier cycle). The speed
loop and DC buc voltage disturbance rejection controller were also programmed
in the DSP and the update rate was selected as 1 kHz (once every �ve carrier
cycles). The speed loop antiwindup structure was similar to the current loop
antiwindup structure and it had a constant maximum output signal limit (the
maximum Iqe limit of the inverter drive).
Due to the lack of the digital encoder feedback signal interface capability,
the experimental system had limited motion control performance. However, an
analog speed feedback was utilized in order to achieve su�cient bandwidth to
illustrate the dynamic overmodulation performance characteristics of various
PWM methods. For this purpose, a digital incremental encoder was mounted
on the shaft of the induction motor and an Allen Bradley encoder interface and
278
iqe
*
^i qe
+
-
+
-
i *de
^i de
+
+
+
+
qe
*v*vqefb
*vqeff
defb*v
deff*v
de*v
Ram
p C
ompa
rison
3 6
*ωr
3s/2e3
A/D
mux
3
IM
3
~
3
2e/3
s
θe*
*ωeωr
^
Aux.Board
Ks
+
+
+
-
rθ
ωr
ωr
^
Control Board with DSP56005
Vdc
VdcVdc Dist. Rej.
PW
M-V
SI
60 Hz 460 V
Figure 5.26: The experimental RFO-IFOC drive control diagram.
motion control circuit board (will be termed as the auxiliary board) which could
provide analog speed signal output was interfaced with the encoder. The auxil-
iary board calculated the shaft speed and generated an analog output signal at
a 1 kHz rate. This analog speed signal was input to the DSP through the analog
input channels. It was processed through the A/D converter and updated once
every �ve carrier cycles (at 1 kHz rate). Therefore, the total speed measure-
ment delay was at least 2 ms (1 ms delay in each unit). The small delays of the
several hardware and digital signal conditioning �lters slightly contributed to
the measurement delay. The experimental drive control diagram is illustrated
in Fig. 5.26 in detail.
As illustrated in Fig. 5.26, the speed feedback signal, and the slip frequency
(computed by multiplying the slip gain with I�qe) are added to generate the

279
electrical frequency reference. This signal is integrated to generate the electrical
angle reference for the controller. Unlike the conventional industrial drives,
which measure the shaft position and estimate the speed by computational
procedures, the laboratory drive employed the reverse procedure. Therefore, the
precision of the speed measurement could lead to a signi�cant error between the
shaft position and its estimate. Since the IFOC system dynamic performance
is strongly a�ected by the position error, the bandwidth of such a system is
expected to be signi�cantly smaller than a system with an accurate position
estimate. Therefore, the drive controller gains were tuned for a relatively low
bandwidth. The speed loop proportional and integral gains of the laboratory
drive were experimentally optimized and a 5 Hz bandwidth with unity damping
could be obtained. This bandwidth value is signi�cantly below the bandwidth of
the industry standard IFOC controlled industrial drives with encoder feedback
(typically 30 Hz and above is achievable) and comparable to the bandwidth
of observer based drives. However, this bandwidth was su�cient to generate
a notable dynamic overmodulation condition and illustrate the performance of
the laboratory drive with various modulators.
The experimentalmotor is a four pole squirrel cage induction motor (US Mo-
tors Inc. ) with the following nameplate: 5 HP, 60 Hz, 460 V, 6.9 A, 1745 RPM.
The motor lumped equivalent circuit parameters were obtained by measurement
and estimation (from Auto-tuning test with a commercial drive). The stator
phase resistance was measured as 1.969 ohm per phase. The stator transient in-
ductance estimated as 22.39 mH, the stator magnetizing inductance as 0.276 H,

280
the rotor inertia as 0:07kgm2, the rated magnetizing current as IdeR = 3:4734A,
the slip gain as Ks = 1:263, the rated slip as s!eR = 11:52rad=s (55 RPM me-
chanical radial speed), and the rotor resistance as 1.73 ohm. The rated torque
current was calculated as IqeR = 9:119A. And the maximum torque current
limit of the current controller was set to 150 % of the rated torque current,
i.e. I�qemax = 14:22A.
In order to illustrate the dynamic overmodulation performance of the SFCR
based drive with di�erent modulators, a dynamic overmodulation condition was
forced by rapidly varying the speed reference signal. While the drive was op-
erating at 1350 RPM (45 Hz electrical frequency) at steady state and no load
conditions, the speed reference was increased to 1650 RPM (55 Hz electrical
frequency) in 50 ms with a ramp function. The speed ramp signal was pro-
grammed with the DSP by incrementing the signal at 1 ms rate and it was
externally triggered. Since the analytical investigation clearly illustrated the
inferior performance characteristics of SPWM and the THIPWM methods, ex-
perimental investigation of these methods was omitted. Therefore, the dynamic
overmodulation test was conducted with SVPWM, DPWM0, DPWM1, and
DPWM2. In each case the motor phase currents and speed, the modulation
waves, and the controller signals (obtained through the D/A channels of the
DSP board) were recorded. Since the laboratory oscilloscope channel capacity
was limited to four, for each modulator the experiments had to be repeated
several times to observe and record all the important the waveforms.

281
The dynamic overmodulation behavior of DPWM0 is illustrated in Figures
5.27,5.28,5.29,5.30, 5.31,5.32, and 5.33 with both zoomed and long time behav-
ior waveforms. As Fig. 5.28 clearly illustrates, the saturated modulation wave
indicates the drive exhibits dynamic overmodulation. Due to the saturation,
the motor d and q axis current regulation becomes poor and the current and
speed errors become large and oscillatory. As the speed reference is rapidly
increased, �rst the speed regulator delay and following the current controller
saturation limit the drive torque and the actual speed lags the reference signif-
icantly. With the overmodulation condition enduring, the speed loop exhibits
oscillation. Note as illustrated in Fig. 5.28, the motor currents within the �rst
few overmodulation cycles are similar to the six step mode waveforms. How-
ever, as the speed error gradually decreases to zero (in about six fundamental
cycles) the linear modulation region is approached, the next steady state oper-
ating point is reached and the current waveforms become more sinusoidal. Note
the new steady state operating point is slightly outside the linearity limit of
this modulator. Although the �nal speed is smaller than the rated speed, and
the drive is expected to operate in the linear modulation region, this does not
occur. As Fig. 5.31 and Fig. 5.32 illustrate, in the new steady state, the d axis
current is larger than its reference value. This condition implies that correct
�eld orientation is not achieved due to the di�erence between the actual rotor
ux angle and the ux angle the position estimator computes. Also, as a result
of the incorrect �eld orientation the drive requires higher terminal voltage than
the voltage required for the intended steady state operating speed. Therefore,

282
v��as
ias
i�qe
4!r
vdc=div
10A=div
4A=div
60RPMdiv
Figure 5.27: DPWM0 modulation signal, phase current, q axis current reference,and speed error oscillograms.
following the dynamic overmodulation transient, the new steady state operating
point is slightly outside the linear operating region, i.e. in the overmodulation
region. However, the experimental waveforms clearly illustrate the dynamic
overmodulation condition and provides a base for comparing the performance
of all the discussed modulators.

283
v��as
ias
i�qe
4!r
vdc=div
10A=div
4A=div
60RPMdiv
Figure 5.28: DPWM0 modulation signal, phase current, q axis current reference,and speed error oscillograms: zoomed view of the �rst few cycles.
Shown in Figures Fig. 5.34, Fig. 5.35, Fig. 5.36,the DPWM1 dynamic over-
modulation waveforms exhibit similar characteristics to DPWM0. With the
DPWM1 method having higher fundamental component voltage gain and the
transients enduring several fundamental cycles, the DPWM1 method output
voltage has stronger dynamics. It responds faster. However, it is more oscilla-
tory. The speed error peak value of DPWM1 is larger than the DPWM0 case.
Also the phase currents of DPWM1 have larger peak value. The large phase er-
ror and high fundamental component voltage gain characteristics of this method
result in poorer dynamic overmodulation performance of this method compared
to DPWM0. As the waveform of Fig. 5.36 illustrates, with this method also
correct �eld orientation is not achieved due to the incorrect rotor ux angle
estimation and at the �nal operating point the d axis current is larger than

284
v��as
ias
4iqe
4!r
vdc=div
10A=div
4A=div
60RPMdiv
Figure 5.29: DPWM0 modulation signal, phase current, q axis current error,and speed error oscillograms.
v��as
ias
4iqe
4!r
vdc=div
10A=div
4A=div
60RPMdiv
Figure 5.30: DPWM0 modulation signal, phase current, q axis current error,and speed error oscillograms: zoomed view of the �rst few cycles.

285
v��as
ias
4ide
4!r
vdc=div
10A=div
4A=div
60RPMdiv
Figure 5.31: DPWM0 modulation signal, phase current, d axis current error,and speed error oscillograms.
v��as
ias
4ide
4!r
vdc=div
10A=div
4A=div
60RPMdiv
Figure 5.32: DPWM0 modulation signal, phase current, d axis current error,and speed error oscillograms: zoomed view of the �rst few cycles.

286
v��as
ias
!�r
!r
vdc=div
10A=div
500RPMdiv
Figure 5.33: DPWM0 modulation signal, phase current, speed and speed refer-ence oscillograms.
the reference value. Therefore, at the �nal operating point this modulator also
operates outside its voltage linearity region. The long term waveforms of this
case will be omitted and they are similar to the DPWM0 waveforms.
Figures Fig. 5.37, Fig. 5.38, Fig. 5.39, and Fig. 5.40 illustrate the DPWM2
dynamic overmodulation characteristics. It is apparent from the waveforms that
the poor phase error characteristics of this modulator result in poorer response
compared to DPWM0 and DPWM1. As the all the three �gures illustrate, the
speed error is more oscillatory and the maximum error is signi�cantly larger
than the DPWM0 and DPWM1 case. Under a dynamic overmodulation condi-
tion, DPWM2 results in poor d and q axis voltage partitioning and results in
signi�cantly larger ux current and signi�cantly smaller torque current. As a
result, the dynamic performance signi�cantly degrades. Although the zoomed

287
v��as
ias
i�qe
4!r
vdc=div
10A=div
4A=div
60RPMdiv
Figure 5.34: DPWM1 modulation signal, phase current, q axis current reference,and speed error oscillograms.
v��as
ias
4iqe
4!r
vdc=div
10A=div
4A=div
60RPMdiv
Figure 5.35: DPWM1 modulation signal, phase current, q axis current error,and speed error oscillograms.

288
v��as
ias
4ide
4!r
vdc=div
10A=div
4A=div
60RPMdiv
Figure 5.36: DPWM1 modulation signal, phase current, d axis current error,and speed error oscillograms.
view of Fig. 5.39 illustrates the d axis current error is more successfully ma-
nipulated than the other cases (at least for the �rst few cycles), as the speed
error is not rapidly manipulated, the d axis current error increases again and
the incorrect ux orientation (due to incorrect ux angle estimation) yields a
�nal operating point in the overmodulation region.
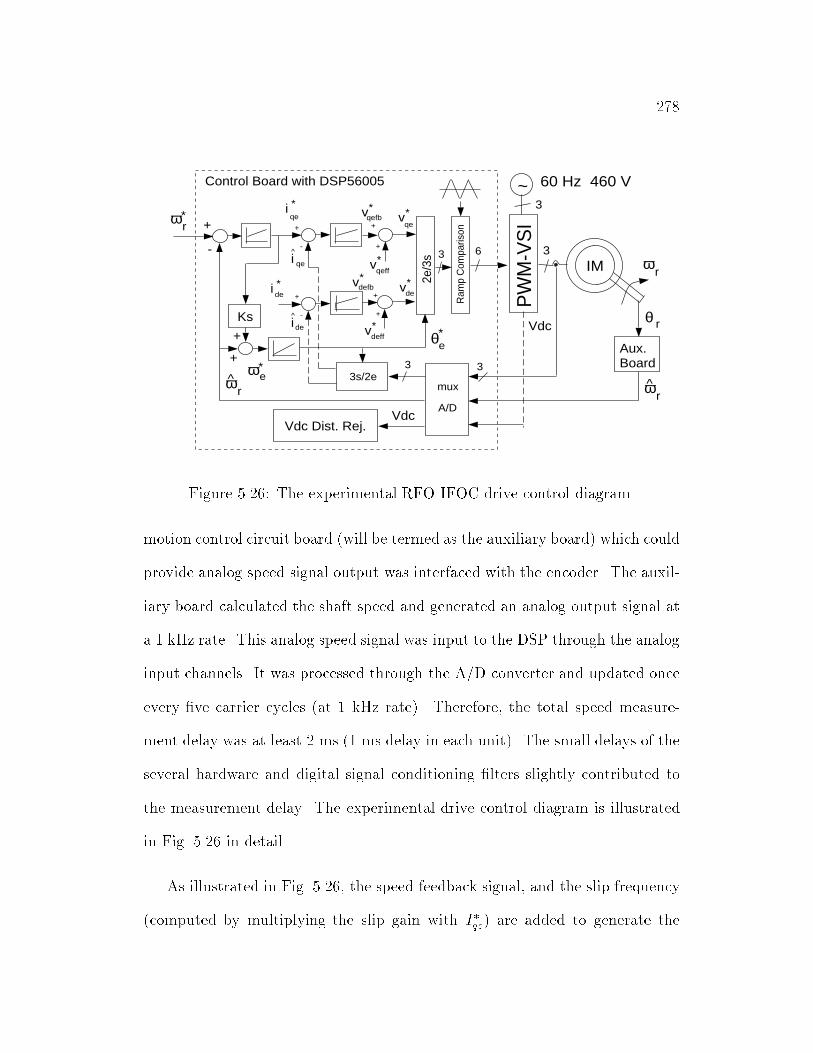
Figures Fig. 5.41, Fig. 5.42, and Fig. 5.43 illustrate the SVPWM dynamic
overmodulation performance. As the �gure indicates, the SVPWM performance
is less oscillatory than DPWM1. However, a comparison between SVPWM
and the DPWM1 and DPWM0 indicates these modulators perform quite simi-
larly. This is due to the fact these methods exhibit similar phase characteristics.
DPWM0 phase error is positive, however small. DPWM1 phase error is larger,
however its polarity alternates and for dynamics enduring a period of one-sixth

289
v��as
ias
i�qe
4!r
vdc=div
10A=div
4A=div
60RPMdiv
Figure 5.37: DPWM2 modulation signal, phase current, q axis current reference,and speed error oscillograms.
v��as
ias
4iqe
4!r
vdc=div
10A=div
4A=div
60RPMdiv
Figure 5.38: DPWM2 modulation signal, phase current, q axis current error,and speed error oscillograms.

290
v��as
ias
4ide
4!r
vdc=div
10A=div
4A=div
60RPMdiv
Figure 5.39: DPWM2 modulation signal, phase current, d axis current error,and speed error oscillograms.
v��as
ias
4ide
4!r
vdc=div
10A=div
4A=div
60RPMdiv
Figure 5.40: DPWM2 modulation signal, phase current, d axis current error,and speed error oscillograms.

291
v��as
ias
i�qe
4!r
vdc=div
10A=div
4A=div
60RPMdiv
Figure 5.41: SVPWM modulation signal, phase current, current reference, andspeed error oscillograms.
of a fundamental cycle or longer, it yields practically a small average value.
Although for di�erent reasons, both DPWM methods exhibit a performance
similar to SVPWM. However in a higher bandwidth drive, dynamics enduring
shorter time intervals are expected to yield distinguishable di�erences between
all the methods (as predicted by analytical models). Due to its one-step-optimal
performance, the SVPWMmethod manipulates the ux oscillation more rapidly
and in the �nal operating point the motor phase current is more sinusoidal indi-
cating an operating point closer to the maximum linear modulation boundary.
Partially, the current waveform is more sinusoidal due to the fact the e�ective
PWM frequency of DPWM methods is 66 % of the SVPWM method.
Although the overshoot and the initial response characteristics vary, the set-
tling time is practically the same in all the modulator cases. This is due to the
292
v��as
ias
4iqe
4!r
vdc=div
10A=div
4A=div
60RPMdiv
Figure 5.42: SVPWM modulation signal, phase current, q axis current error,and speed error oscillograms.
v��as
ias
4ide
4!r
vdc=div
10A=div
4A=div
60RPMdiv
Figure 5.43: SVPWM modulation signal, phase current, d axis current error,and speed error oscillograms.

293
fact that the drive bandwidth is small (the proportional and integral gains are
small) and the antiwindup controllers limit the reference voltage vector mag-
nitude to be only slightly larger than the hexagon boundary (relatively small
modulation index values). As all modulators have small phase and magnitude
error for small modulation index values, the response is slow and takes sev-
eral fundamental cycles. Over such a long period the fundamental component
gain concept is valid in predicting the performance. With the modulation sig-
nals limited to the neighborhood of the hexagon, the voltage gain values of the
discussed modulators are comparable, therefore the settling time of the speed
controller (or the average response time) is practically the same in all the mod-
ulators tested in the laboratory. However, as illustrated, the maximum error
and oscillations are di�erent, and determined by the modulator characteristics.
Since the dynamic overmodulation behavior is dependent on the position of
the voltage vector immediately before the transient (i.e. the rotor position at
the triggering instant), randomly triggering the dynamic overmodulation mode
results in slight di�erences in the dynamic performance. If the reference vector
is closer to the hexagon sides than the middle, initially there exists more volt-
age to manipulate the dynamics (same in any segment). Therefore, the dynamic
behavior is dependent on the initial (previous to dynamic overmodulation) posi-
tion of the reference vector phase angle. However, with the experimental system
having a relatively low bandwidth, and the dynamics lasting signi�cantly longer
than a time period corresponding to a hexagon segment, the triggering instant

294
of the dynamic overmodulation condition had little e�ect on the transient pe-
riod and the peak speed ripple. Therefore, the initial conditions deserve less
attention than the overall dynamic behavior. A large number of dynamic over-
modulation tests triggered at di�erent voltage vector spatial positions indicated
the triggering point sensitivity of the dynamics was negligible. Therefore, the
remaining experiments were conducted with no signi�cant attempt to repeat
the same exact initial conditions in each case.
Although the experimental system could not exhibit a true IFOC perfor-
mance due to the inaccuracy involved in measuring the rotor angle, the experi-
ments were su�cient to illustrate the modulator dependent dynamic overmod-
ulation behavior of the drive. With a high bandwidth controller and accurate
rotor angle measurement, the modulator characteristics could be illustrated into
more detail, as the simulation results indicated.
The experimental results of this section clearly illustrated the in uence of
the modulator phase and magnitude characteristics on the drive dynamic per-
formance in the overmodulation region. The experiments suggest the SVPWM
has better performance than DPWM methods, and DPWM2 in particular per-
forms poorly and may render the drive unstable. It is apparent that combining
several modulators and in the overmodulation region selecting a higher perfor-
mance modulator will yield a high dynamic performance. While in the linear
modulation region, GDPWM or a DPWM method of choice can be selected
for low switching losses. During dynamic overmodulation, SVPWM or other

295
methods discussed in the simulation section could be selected. Such a hybrid
algorithm could be successfully implemented in modern digital platforms and
result in an overall high performance drive.
5.8 Steady State Overmodulation In Current
Controlled Drives
As the previous chapter illustrated, voltage feedforward drives could be success-
fully operated in the overmodulation region. However, the dynamic performance
and steady state output voltage/current waveform quality of the drive would
degrade in the overmodulation region. As the overmodulation region is entered,
the PWM output voltage begins to contain a considerable amount of subcarrier
frequency harmonic content. The waveform distortion rapidly increases with
the modulation index, and becomes maximum at the six-step operating point.
The degree of performance loss is secondarily dependent on the modulator type
and as clearly illustrated, DPWM methods are superior to all other modulators.
With the overmodulation performance of voltage feedforward drives being lim-
ited, certain applications involving such drives may limit the drive maximum
output voltage to a value smaller than the six-step voltage value (a modulation
index smaller than unity). As the theoretical and experimental investigations
indicated, all high performance modulators (including DPWM methods) exhibit
rapid performance deterioration after approximately 0:95 modulation index. In

296
waveform distortion sensitive applications this approximate value may be uti-
lized as the maximummodulation index limit. As a result, voltage feedforward
controlled drives can be operated in the overmodulation region and power elec-
tronics devices of the inverter can be utilized at high capacity and the drive can
perform in a wider operating range with improved DC bus voltage disturbance
rejection. In high performance current regulated drives, however, the overmod-
ulation region is less e�ciently utilized than in voltage feedforward drives.
As the dynamic overmodulation studies of this chapter indicated, in the
overmodulation region, current controlled drives exhibit strong interaction be-
tween the modulator and the current controller (and possibly outer control
loops also). This interaction results in signi�cant current, torque, and speed os-
cillations and degrades the performance. As the simulations and experimental
investigations illustrated, dynamic overmodulation performance of current con-
trolled drives could be enhanced by employing antiwindup controllers, careful
current controller design, and proper modulation algorithm choice. Regardless
of the controller type and performance, however, the overmodulation perfor-
mance remains inferior to the linear modulation region performance.
Due to the high performance motion quality requirements, in most cur-
rent controlled drives the intended steady state operating region is the linear
modulation region and the overmodulation region may only be entered dur-
ing transients. However, in certain applications steady state operation in the
overmodulation may be allowed. For most electric motor drives steady state

297
overmodulation occurs at high shaft speed, and the torque ripple generated due
to overmodulation harmonics could be su�ciently suppressed by the shaft in-
ertia and speed regulation can be satisfactory. In particular, this is true for
induction motors with relatively large leakage inductance. Since the leakage
inductance suppresses the overmodulation harmonic currents, with higher leak-
age inductances the associated torque ripple is relatively small. Perhaps, PM
motors with small leakage inductance values would have signi�cant harmonic
current and the associated torque ripple would be prohibitive in certain applica-
tions. Therefore, current controlled AC motor drives with moderate high speed
regulation requirements and suitable motor characteristics could be operated in
the overmodulation region not only during transients, but also at steady state
(at least in the lower overmodulation region). In this section the performance
issues of current controlled drives when operating in the overmodulation region
at steady state will be investigated.
While within the linear modulation range, the steady state voltage and cur-
rent waveform characteristics of an SFCR controlled drive are the same as the
voltage feedforward drive for the same modulator and operating conditions.
However, in the overmodulation region the SFCR controlled drive (with or with-
out current controller antiwindups) exhibits poorer steady state performance
than the voltage feedforward type. This performance degradation is due to the
fact that the feedback currents a�ect the current controller performance.
In voltage feedforward drives when operating in the overmodulation region,

298
the overmodulation harmonics result in current harmonics at their associated
frequencies. In particular, the �rst few harmonics, the 5th, 7th, 11th, and
13th are large in magnitude. They induce torque ripple that results in speed
oscillations and performance degradation. Since the V
fcontroller and the mod-
ulator are feedforward no additional dynamics are generated. In current con-
trolled drives, however, the feedback current overmodulation harmonics a�ect
the drive performance signi�cantly. As they are fed to the proportional and in-
tegral blocks of the controller, the controller generates modulation signals with
overmodulation harmonic components and oscillatory behavior results. Intel-
ligently designed antiwindup controllers partially limit these voltages and the
associated oscillations. However, they introduce additional voltage nonlinearity
to the drive and limit the voltage range of the drive. It is apparent that for
superior steady state overmodulation performance of current controlled drives,
the overmodulation harmonic currents should be removed from the measured
feedback current. In addition the modulator fundamental component voltage
gain loss in the overmodulation region could be compensated by employing
the inverse gain compensation technique. However, both modi�cations degrade
the drive dynamic overmodulation performance. Inverse gain compensation
increases the current controller overshoot and eliminating the overmodulation
harmonics from the feedback currents by �ltering techniques increases the con-
troller delay. Also, with the overmodulation harmonics absent from the feedback
path, the current controller can no more provide inherent overcurrent protec-
tion. The above discussions clearly illustrate the trade-o� between the steady

299
state and dynamic overmodulation performance of the current controlled drives.
Therefore, steady state overmodulation of most current controlled drives in the
overmodulation is limited to less than 0:95 modulation index (in particular,
for drives employing motors with relatively small leakage inductances) and the
e�ect of the overmodulation harmonics is only suppressed by the antiwindup
controllers. This performance limitation is valid for all the carrier based and on-
o� current controllers. Therefore, the discussion involving the high performance
SFCR is su�cient. However, it should be noted, on-o� current controllers such
as the hysteresis current controller have inferior steady state overmodulation
and superior dynamic overmodulation performance to SFCR. In the following,
a simulation study will attempt to illustrate the steady state overmodulation
performance issues of current controlled drives and describe a method to pro-
vide enhanced steady state current controlled drive performance. Perhaps, such
studies are necessary to initiate thoughts for developing current controllers with
better overall characteristics than the conventional current controllers.
5.8.1 A Simulation Study of Steady State Overmodu-
lation
In this section, the current controlled drive steady state performance will be
investigated by a computer simulation. For the sake of simplicity, a simple
three phase load consisting of resistance, inductance, and sinusoidal voltage
connected in series (per phase) will be simulated. The load parameters are

300
L� = 12:79mH , R� = 0:4425ohm , fe = 60Hz, and Emax = 310:0V . A
digital SFCR with once per carrier cycle synchronous sampling and PWM write-
out rates will be employed. The carrier frequency is 5 kHz. Except for the
antiwindup controllers, the current controller is designed in the same manner
as for the simulations in the dynamic overmodulation study. In the simulation,
the current controller does not employ any antiwindup on the PI controller such
that the in uence of overmodulation harmonics on the drive performance could
be clearly observed. The DC bus voltage of the inverter is �xed at 620 V. Only
the DPWM1 method is simulated.
The system is �rst operated at 0.933 modulation index until t = 0:1s (with
Emax = 365V an overmodulation condition is created), then the d axis current
command is stepped up to a value to yield approximately a modulation index of
0.975. Figure 5.44 shows the corresponding current, modulation, and controller
signal waveforms during overmodulation. As the �gure indicates, in particu-
lar in the higher overmodulation region, the currents contain large amount of
overmodulation harmonics. The PI controller signals are oscillatory and they
generate modulation waves with no quarter-wave symmetry. Hence, increased
current harmonic content and oscillatory behavior compared to an open loop
overmodulation operating condition.
In Figure 5.45, a small portion of the previous �gure is shown. Generated
from the synchronously sampled phase currents, the d and q axis currents,
labeled in the �gure as IQSE, and IDSE, have signi�cant ripple, mainly at 6fe

301
frequency. Since the 5th and 7th overmodulation harmonics form a 6th harmonic
in the synchronous frame, this result is to be expected. The PI controllers
respond to these harmonics and generate modulation signals with such harmonic
components and the modulator quarter-wave symmetry is lost. Figure 5.46
provides a more detailed view of the modulation and phase current waveforms
at Mi = 0:933. It is clear from the �gure that the modulation wave is not
quarter-wave symmetric. Operating at higher modulation indices (as the 0.975
modulation index case illustrated) increases the asymmetry and the distortion,
such that the performance is unacceptable. Therefore, without proper structural
modi�cations, the SFCR controlled drive can not successfully operate in the
higher overmodulation region at steady state.
5.8.2 Steady State Overmodulation Performance With
Feedback Current Harmonic Reduction
Having demonstrated the steady state overmodulation performance de�ciency
of the SFCR controlled drive in the previous section, we next investigate the
performance of such a drive when the overmodulation harmonics are eliminated
from the feedback path of the controller. An overmodulation harmonic cur-
rent estimation method will be developed and the estimation method will be
employed in eliminating the harmonic currents from the controller feedback
simulated in the previous section. The simulation results will be evaluated and
compared to the previous case.

302
Figure 5.44: SFCR based system simulation waveforms in the overmodulationrange. Traces (bottom to top): reference and actual phase currents, DPWM1modulation wave, q and d axis PI controller outputs. At t = 0:1s, Mi is in-creased from 0:933 to 0:975.

303
Figure 5.45: Detailed view of the system characteristic waveforms in the over-modulation range. Traces (bottom to top): reference and actual phase currents,discretized q and d axis currents, q and d axis PI controller outputs.

304
Figure 5.46: Zooming into the phase current and modulation wave at Mi =0:933. Traces (bottom to top): reference and actual phase currents, andDPWM1 modulation wave.

305
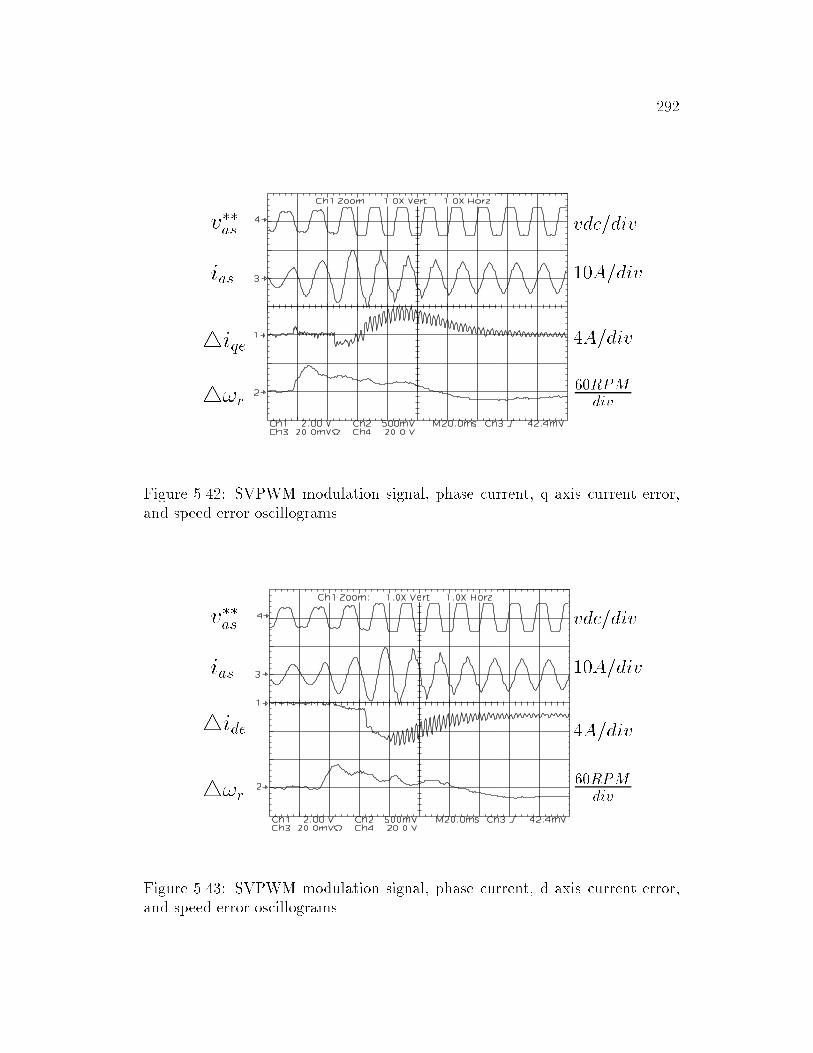
In this work, a reference model based harmonic estimation method is devel-
oped. The induction machine harmonic behavior can be modeled by its transient
impedance circuit [108, 145]. Figure 5.47 shows the induction machine constant
ux model, and harmonic equivalent circuit. The motor harmonic equivalent
circuit model can be represented in any reference frame. For this application,
the synchronous frame equivalent circuit is suitable. If the AC motor harmonic
voltages are known, then the corresponding d and q axis harmonic currents can
be estimated from the harmonic equivalent circuit as follows.
iqeh(t) =Z t
0
vqeh(t)� r�iqeh(t)� weL�ideh(t)
L�
dt+ iqeh(0) (5.18)
ideh(t) =Z t
0
vdeh(t)� r�ideh(t) + weL�iqeh(t)
L�
dt+ ideh(0) (5.19)
Figure 5.48 shows the harmonic estimation based system controller block
diagram. Figure 5.48(a) shows the current regulator structure, including the
fundamental component gain compensation scheme. The low pass �lter ( LPF),
provides a smooth gain compensation signal and helps estimate the overmodu-
lation harmonic voltage signal. As shown in Figure 5.48(b), the overmodulation
harmonic voltages are estimated from the modulator input and output wave-
forms. In the overmodulation region, the modulator output signal is saturated
and has a lower fundamental component magnitude than the reference. When
the inverse gain compensation technique is involved, the original modulation
signal and the modulator output signal have the same fundamental component.
306
Rσs L σ s
+
-ω e L σ s ihde
hqeV
i hqe
+
-
RσsL σ s
+
-L σ sω e
i hqehdeV
ihde
+
-
q axis
d axis
RσsL σ s
E ’asasV
asi
+
-
L σ sRσs
+
-
Vhas
ihas
(a)
(b) (c)
Figure 5.47: Three phase AC induction motor transient and harmonic equivalentcircuits; (a): Per phase fundamental component transient model, (b): Per phaseharmonic model, (c): Harmonic model in the synchronous frame.

307
Therefore, the di�erence between the original modulation signal and the output
modulation signal equals the overmodulation harmonic voltage. In case of in-
accurate inverse gain compensation, the estimation will include a fundamental
component also. Therefore, additional �ltering to block the fundamental com-
ponent voltage is required for accurate harmonic voltage estimation. As will be
shown in the simulations, a single frequency band pass �lter (BPF) tuned to the
dominant 6fe component and implemented in the 6fe frame provides satisfactory
results. In Fig. 5.48 (c), the overmodulation harmonic current, and fundamental
component current estimation block diagrams are illustrated. Employing the
synchronous frame harmonic equivalent circuit and the estimated synchronous
frame harmonic voltages, the overmodulation harmonic currents can be easily
computed. Subtracting the estimated harmonic currents from the synchronously
sampled and d-q transformed currents, the synchronous frame fundamental com-
ponent currents can be found. The accuracy of the discussed harmonic current
estimation scheme depends on the knowledge of machine parameters. Param-
eter inaccuracy, computational accuracy, etc. factors can strongly a�ect the
overmodulation harmonic current prediction accuracy. However, at this stage
the accuracy and implementation issues of the overmodulation harmonic current
prediction algorithm will be omitted.
The overmodulation harmonic feedback current reduced current controller
scheme has been simulated to illustrate its superior steady state overmodula-
tion performance. The same load, inverter, and controller parameters as the
previous case are assumed. The overmodulation harmonic estimator computes

308
PI
LPF
PI
LPF
2e/3
s
Mod
ulat
or
3
i qe∗
dei ∗
i qe
^
+
-
+
-
dei^ G-1
qefb∗V
+
+
+
+
+
+
+
+
defbV ∗
qeffV ∗
deffV ∗
V ∗qess
dessV ∗
Vqe∗∗
de∗∗V
6Gai
n C
omp.
VS
I Gat
e D
rives
V ∗qess
dessV ∗
G-1
2e/3
s
Mod
ulat
or
3s/2
e
BPF
BPF
Vqess∗∗
∗∗dess
V
+
− V ∗qehss
dehssV ∗
+
−
3 3
Rσs
σsL S
1V ∗
qehss
+ -
iqe
^
dei^
dehssV ∗
Rσs
σsL S
1+
-
σsLω e
+
-
qehssi^
idehss
^
i defb
qefbi
+
-
+-
(a)
(b)
(c)
Figure 5.48: The SFCR drive with overmodulation harmonic estimation al-gorithm. (a): Current regulation algorithm including the gain compensationblock, (b): Overmodulation harmonic voltage estimation block diagram, and(c): Overmodulation harmonic current estimation block diagram.

309
the signals once per carrier cycle. Once the reference voltage signal is computed
(at the beginning of the cycle), the estimator predicts the harmonic current
value at the end of the associated carrier cycle. Figure 5.49 shows the simu-
lation waveforms of the harmonic reduced system. The system is operated at
0.933 modulation index(at t = 0 all the currents are zero) for 0.1 s. Then the d
axis current reference is stepped to a value corresponding to 0.965 modulation
index. As the �gure indicates the current regulator provides improved steady
state current waveform. With the absence of the dominant overmodulation har-
monics from the feedback, the PI controller output signals are less oscillatory
and the operation is less oscillatory. Zooming into the �gure, it can be seen in
Figure 5.50, the synchronous frame d-q axis discretized currents are not as os-
cillatory as the previous case (Fig. 5.45). Including more detail, the waveforms
in Fig. 5.51 indicate the steady state performance superiority of this controller.
The modulation waveform has quarter-wave symmetry and the phase currents
are more sinusoidal than the previous case.
This section illustrated high performance SFCR based drives have signi�-
cant performance issues in the overmodulation region. Without PI controller
antiwindups, current controllers exhibit poor steady state and dynamic perfor-
mance in the overmodulation region. Employing antiwindups on the PI current
controllers aids manipulating dynamic overmodulation conditions without sig-
ni�cant current oscillations. Steady state operation of an SFCR based drive
with or without antiwindups in the overmodulation region results in higher

310
Figure 5.49: Harmonic feedback reduced, SFCR based drive simulation wave-forms in the overmodulation range. Traces (bottom to top): reference phasecurrent, actual phase current, modulation wave, q and d axis PI controller out-puts. At t = 0:1s, the modulation index is increased from Mi = 0:933 toMi = 0:965.

311
Figure 5.50: Detailed view of the system characteristic waveforms in the over-modulation range. Traces (bottom to top): reference and actual phase currents,discretized q and d axis currents, q and d axis PI controller outputs.

312
Figure 5.51: Zoomed view of the phase current and modulation wave at Mi =0:933. Traces (bottom to top): reference and actual phase currents, estimatedfundamental component and harmonic currents, and DPWM1 modulation wave.

313
overmodulation harmonics than voltage feedforward drives for the same oper-
ating point. The steady state performance of an SFCR based drive can be
enhanced by removing the overmodulation harmonic feedbacks from the con-
troller. However, this approach requires �ltering and the dynamic performance
reduction due to the introduction of such �lters is generally prohibitive. Al-
though the implementation di�culties can be overcome with high performance
digital signal processors, the inherent delay of the �lters is prohibitive from the
performance perspective. As a result, most drives only employ antiwindup con-
trollers and the dynamic performance is retained. Although their presence limits
the voltage utilization and steady state operating range of a drive, antiwindups
are invaluable for they manipulate the dynamics safely. The simulation study
of this section illustrated the poor steady state overmodulation performance
characteristics of current controllers and aided in understanding the problem.
Therefore, it becomes clear, the overall overmodulation region performance of
current controlled drives is limited.
Perhaps, the steady state modulation limit of an SFCR based drive with
antiwindup and with a high performance modulator could be estimated by cal-
culating the modulation index corresponding to an operating condition which
forces the inverter output vector follow the hexagon sides. This condition corre-
sponds to the minimum (zero) phase error method developed for direct digital
PWM overmodulation [58] and illustrated in Fig. 5.6 with the tip point \a" in
detail. Projecting the reference voltage vector on the \q" axis of the complex

314
plane, the q axis AC voltage signal can be found and the fundamental compo-
nent voltage magnitude can be closed form calculated. Expressed in terms of
modulation index, the resulting maximum steady state voltage utilization is as
follows.
Mimaxa = (
p3
2)ln(3) � 0:9514 (5.20)
This operating point also corresponds to the practical breakthrough point
for the rapid increase of the overmodulation harmonics. Although some appli-
cations may require smaller or wider operating range, the authors experience
indicates the 0:95 modulation index limit generally represents the rapid perfor-
mance degradation point and it is the typical performance boundary for many
industrial current controlled drives with moderate performance requirements.
5.9 Summary
Dynamic overmodulation and steady state overmodulation issues are di�erent
and the modulator fundamental gain characteristics are not a su�cient per-
formance measure to evaluate the dynamic overmodulation performance. An
elegant approach is the characterization of the reference and modulator output
voltage vector angle and magnitude relations. A simple technique provides an-
alytical tools to obtain these characteristics. Each triangle intersection PWM
method is shown to have a unique dynamic overmodulation characteristic. The

315
investigation reveals the minimumvoltage magnitude error dynamic overmodu-
lation attribute (one-step-optimal) of SVPWM method, indicating a signi�cant
implementation advantage compared to the two methods reported to achieve
such performance. In a motor drive, motion quality is more important than
rapid current control and the high performance phase error regulation approach
is superior to the inherent overmodulation characteristics of the modern PWM
methods. For intermediate dynamic overmodulation performance SVPWM pro-
vides satisfactory performance and for high dynamic overmodulation perfor-
mance a phase error regulation method is adapted from the direct digital PWM
technique to enhance the dynamic overmodulation characteristics of the triangle
intersection PWM methods. In both methods the antiwindup limiters play an
important role in keeping the phase error small and maintaining high dynamic
performance. The theoretical modulator dynamic overmodulation characteris-
tics were veri�ed by detailed computer simulations and laboratory experiments.
This chapter also illustrated the steady state overmodulation performance
de�ciency of current controlled drives. Detailed computer simulation studies
illustrated the overmodulation harmonic currents a�ect the current controller
through the feedback channels and the performance degrades. As a result the
steady state overmodulation performance of current controlled drives is inferior
to voltage feedforward drives. Current controlled drives with antiwindups pro-
vide approximately a maximum steady state operating point of 0:95. Although
their operating range is narrower than the voltage feedforward drives, current
controlled drives manipulate dynamic conditions more rapidly and safer.