Embed Size (px)
Citation preview

1
510(k) SUBSTANTIAL EQUIVALENCE DETERMINATION DECISION MEMORANDUM
A. 510(k) Number:
K171655
B. Purpose for Submission:
Clearance of a new device
C. Manufacturer and Instrument Name:
Roche Diagnostics GmbH, cobas m 511 integrated hematology analyzer
D. Type of Test or Tests Performed:
Complete blood count and 5-part differential: RBC, HGB, HCT, MCV, MCH, MCHC, RDW, RDW-SD, %NRBC, #NRBC, WBC, %NEUT, #NEUT, %LYMPH, #LYMPH, %MONO, #MONO, %EO, #EO, %BASO, #BASO, PLT, MPV, %RET, #RET, and HGB-RET parameters.
White blood cell (WBC), red blood cell (RBC), and platelet classification and characterization
E. System Descriptions:1. Device Description:
The cobas m 511 system is an automated hematology analyzer with integrated slide making capability and digital cell imaging technology. It uses digital morphology to provide a complete blood count, 5-part differential, and reticulocyte enumeration from capillary or venous whole blood samples collected in K2EDTA or K3EDTA. It also uses digital imaging to classify red blood cells, white blood cells and platelets based on morphological characteristics.
The cobas m 511 system consists of the following major components:
§ The analyzer § Viewing station § Associated consumables and components § Cobas m 511 system software for the analyzer, viewing station and image
analysis § Printer
cobas m 511 analyzer
The cobas m 511 analyzer is a stand-alone hematology analyzer with integrated slide

2
making capability and digital cell imaging that contains a rack transport system for sample tubes. It has five processing stations: sample mixing, slide printing, slide staining, slide imaging (low and high magnification) and slide output. It also includes a separate compartment, which houses the necessary consumables and waste containers.
cobas m 511 viewing station
The viewing station hardware is a computer with software that provides the graphical user interface for the system. It is designed to interface with a standard Laboratory Information System (LIS) for result reporting. It can be configured as the control station or as a review station
Consumables and components
The DigiMAC³ stain pack is intended to fix and stain cells from a whole blood sample or control/calibrator material that have been applied to a slide by the cobas m 511 analyzer. The DigiMAC3 stain pack is comprised of the following four separate solutions, which are individually applied to each processed slide: DigiMAC3 fix, DigiMAC3 eosin, DigiMAC3 methylene blue, and DigiMAC3 rinse. The application of these stain solutions results in a Romanowsky type stain.
DigiMAC³ reticulocyte is intended to stain a whole blood sample or control material before it is applied to a slide by the cobas m 511 analyzer, in order to make the reticulocytes suitable for automated imaging or manual microscopy.
DigiMAC3 wash is used to clean all specimen-contacting surfaces, including blood fluid pathways, following processing of each blood sample.
DigiMAC3 clean is used to remove protein build-up from the surfaces of the cobas m 511 analyzer components that come in contact with blood samples.
The DigiMAC³ slide is a glass substrate on which a whole blood sample or control/calibrator material is applied and stained by the cobas m 511 analyzer, in order to enable automated imaging or manual microscopy.
Software Used in cobas m 511 system
The cobas m 511 system includes three major software components: viewing station software, analyzer software, and the image analysis application.
Viewing Station Software The viewing station software provides the user interface to the cobas m 511 analyzer, including: managing system configuration and consumables; reporting analyzer and sample processing status; troubleshooting and error recover; quality control processing and results; reviewing sample results; classifying/reclassifying cells; and evaluating cell morphology.
Analyzer Software The analyzer software runs the analyzer computer and manages all hardware elements, sample processing, data management, and viewing station communications.
Image Analysis Application The image analysis application runs on the analyzer computer and communicates with the
3
cameras and motion-control hardware to acquire images at both the low- and high-magnification imaging stations. The program identifies and measures cells in the images, and it reports the cell counts and measurements to the analyzer software. It also saves images for display on the viewing station.
2. Principles of Operation:
The cobas m 511 system uses digital morphology from an automatically produced Romanowsky stained monolayer slide, to provide the complete blood count (CBC), automated white blood cell (WBC) differential, and the enumeration of reticulocytes. This is done through the use of proprietary imaging algorithms that locate, count and evaluate red and white blood cells, platelets and nucleated red blood cells.
The cobas m 511 system prints a consistent sample volume (1 uL) onto a glass microscope slide using a precision application method. In the stainer module, four reagents are applied to the cells on the slide: a fixative, an eosin stain, a methylene blue stain, and a rinse. Following staining, the slide is imaged at low magnification using a 10x lens to locate, image, and count white and red blood cells, nucleated red blood cells, and platelets. The system selects a specific number of white blood cell locations and provides their coordinates to the high magnification module for additional analysis. In the high magnification module, a 50x lens is used to classify white blood cell types, evaluate red blood cells, and platelets and to evaluate cellular morphology. The white blood cells are categorized into five types (NEUT, LYM, MONO, EO, BASO), or as unclassified cells by the instrument. This allows a skilled technologist to review images of the cells on the viewing station or to perform a full microscopic review of the slide. This 50x magnification is also used to identify and count the reticulocytes when a reticulocyte test is requested. For reticulocyte processing, an additional slide is produced from blood in the sample cup that is first incubated with a supravital stain. The cells are then printed onto the slide, stained using DigiMAC3 stain and imaged to determine the number and percentage of reticulocytes and reticulocyte hemoglobin.
Following processing, results and images can be viewed on the viewing station. The viewing station allows the operator to monitor system processes and status, and to view sample processing and results. The viewing station also allows a skilled medical technologist to perform a full white blood cell differential and a morphological review of white blood cells, red blood cells and platelets for samples requiring further review.
3. Modes of Operation:
Does the applicant’s device contain the ability to transmit data to a computer, webserver, or mobile device?
Yes ____X____ or No ________
Does the applicant’s device transmit data to a computer, webserver, or mobile device using wireless transmission?
Yes ________ or No ___X_____
4. Specimen Identification:
Specimen identification is manual entry by keyboard, hand-held barcode reader or automated identification by barcode reader.

4
5. Specimen Sampling and Handling:
Samples can be introduced onto the cobas m 511 system using either the closed tube (automated rack mode) or open tube modes. In the closed tube mode, the operator loads the sample tubes into a custom rack. The rack is then mechanically transported into the cobas m 511 system for processing. In this mode the cobas m 511 system automatically mixes, aspirates, and analyzes samples while the sample caps remain intact. In the open tube mode, the operator processes individual samples by manually mixing the sample collection tube by hand and then introducing the sample to the open port aspiration probe presented by the cobas m 511 system. The operator will position the tube such that the aspiration probe is immersed into the approximate center of the blood volume.
6. Calibration:
The DigiMAC3 calibrator is used for calibration of the cobas m 511 system. The calibrator is a stable suspension of cells of human or animal origin. It is used for calibrating the following hematology parameters of the cobas m 511 system: WBC, RBC, MCH, MCV, PLT, and MPV.
7. Quality Control:
DigiMAC3 controls are hematology quality control (QC) materials which consist of stable suspensions of red blood cells, white blood cells and platelets of human or animal origin. There are three levels of controls (L1, L2 and L3), which are used in conjunction with each other for monitoring the performance of the cobas m 511 analyzer.
8. Software:
FDA has reviewed applicant’s Hazard Analysis and Software Development processes for this line of product types:
Yes___X_____ or No________
F. Regulatory Information:
1. Regulation section:
21 CFR 864.5220, Differential Cell Counter
21 CFR 864.5260, Automated Cell Locating Device
2. Classification:
Class II
3 Product code:
GKZ – Counter, Differential Cell
JOY – Device, Automated Cell Locating

5
4. Panel:
Hematology 81
G. Intended Use:
1. Indication(s) for Use: The cobas m 511 integrated hematology analyzer is a quantitative, automated analyzer with cell locating capability. It is intended for in vitro diagnostic use by a skilled operator in the clinical laboratory. The system prepares a stained microscope slide from EDTA-anticoagulated whole blood. It utilizes computer imaging to count the formed elements of blood and provide an image-based assessment of cell morphology, which may be reviewed by the operator, and also allows for manual classification of unclassified cells. The instrument reports the following parameters: RBC, HGB, HCT, MCV, MCH, MCHC, RDW, RDW-SD, %NRBC, #NRBC, WBC, %NEUT, #NEUT, %LYMPH, #LYMPH, %MONO, #MONO, %EO, #EO, %BASO, #BASO, PLT, MPV, %RET, #RET, HGB-RET.
2. Special Conditions for Use Statement(s):
For prescription use only.
H. Substantial Equivalence Information:
1. Predicate Device Name(s) and 510(k) numbers:
Sysmex® XN-Series (XN-10, XN-20) Automated Hematology Analyzer (Sysmex Analyzer) – K112605
CellaVision® DM1200 Automated Hematology Analyzer (CellaVision Analyzer) – K092868
2. Comparison with Predicate Device:
Similarities Item Device
cobas m 511 system Predicate
Sysmex XN Series Indications for use The cobas m 511 integrated
hematology analyzer is a quantitative, automated analyzer with cell locating capability. It is intended for in vitro diagnostic use by a skilled operator in the clinical laboratory. The system prepares a stained microscope
The XN-Series modules (XN-10, XN-20) are quantitative multi-parameter automated hematology analyzers intended for in vitro diagnostic use in screening patient populations found in clinical laboratories. The XN-Series modules classify and enumerate the

6
Similarities Item Device
cobas m 511 system Predicate
Sysmex XN Series slide from EDTA-anticoagulated whole blood. It utilizes computer imaging to count the formed elements of blood and provide an image-based assessment of cell morphology, which may be reviewed by the operator, and also allows for manual classification of unclassified cells. The instrument reports the following parameters: RBC, HGB, HCT, MCV, MCH, MCHC, RDW, RDW-SD, %NRBC, #NRBC, WBC, %NEUT, #NEUT, %LYMPH, #LYMPH, %MONO, #MONO, %EO, #EO, %BASO, #BASO, PLT, MPV, %RET, #RET, HGB-RET.
following parameters in whole blood: WBC, RBC, HGB, HCT,MCV, MCH, MCHC, PLT, NEUT%/#, LYMPH%/#, MONO%/#, EO%/#, BASO%/#, IG%/#, RDW-CV, RDW-SD, MPV, NRBC%/#, RET%/#, IPF, IRF, RET-He and has a Body Fluid mode for body fluids. The Body Fluid mode enumerates the WBC-BF, RBC-BF, MN%/#, PMN%/#, and TC-BF# parameters in cerebrospinal fluid (CSF),serous fluids (peritoneal, pleural) and synovial fluids. Whole blood should be collected in K2 or K3 EDTA anticoagulant and, Serous and Synovial fluids in K2 EDTA anticoagulant to prevent clotting of fluid. The use of anticoagulants with CSF specimens is neither required nor recommended.
Sample identification
Automated barcode reading of sample tube identifier. Manual keyboard entry. Bi-directional instrument to LIS interface: patient demographics, orders, results.
Same
Anticoagulant K2 and K3 ethylenediaminetetraacetic acid (EDTA)
Same
Service diagnostics On-board system diagnostics. Manufacturer can perform web-based diagnostics.
Same
Information transfer to and from instrument
Through LIS or manual entry on a computer screen.
Same

7
Differences Item Device: cobas m 511 system Predicate: Sysmex Analyzer
Parameters Not available Whole blood prameters - IG%/#, RDW-CV, IPF, IRF
Body fluid parameters parameters in cerebrospinal fluid (CSF),serous fluids (peritoneal, pleural) and synovial fluids - WBC-BF, RBC-BF, MN%/#, PMN%/#, and TC-BF#
Principle of operation
Characterizes and identifies cells using digital imaging of stained cells on a microscope slide.
Low magnification location and imaging of white and red blood cells and platelets using a 10x objective, combined with illumination optics and a camera. High magnification imaging of white blood cell types and cell morphology using a 50x objective, combined with illumination optics and a camera.
Hemoglobin measurement using LED light absorption.
Characterizes and identifies cells based on detection of direct-current resistance light scatter, fluorescence, and adaptive cluster analysis.
Flow cytometry method using a semiconductor laser to analyze physiological and chemical characteristics of cells and other biological particles Hydro Dynamic Focusing (DC Detection) with aperture to count the RBC and PLT and calculate the HCT via the RBC pulse height detection method.
SLS-Hemoglobin Method using hemoglobin absorption after chemically lysing cells and using LED light.
Sample preparation procedure
Printing of blood onto a microscope slide followed by staining of the slide.
Flow analysis after dilution and mixing with reagents.
Modes of operation Closed tube (automated rack) mode Open tube (manual) mode
Sampler Analysis Mode(Closed Cap) Manual Analysis Mode (Closed and Open Cap) Pre-dilute Analysis Mode Low WBC Analysis Mode Body Fluid Mode
Calibrator DigiMAC3 calibrator XN CAL XN CAL PF

8
Differences Item Device: cobas m 511 system Predicate: Sysmex Analyzer
Quality control DigiMAC3– control L1, L2, L3
XN Check (3 levels)
Sample types Whole blood Whole blood and body fluids Sample aspiration volume
30μL (closed-tube and open-tube mode)
88μL (Sampler Mode-Whole Blood) 88μL (Manual Mode- Whole Blood) 70μL (Manual Mode- Diluted Blood)
Throughput Approximately 60 samples/hour maximum
Approximately 100 samples/hour maximum
Reagents DigiMAC3 stain pack, including: DigiMAC3 fix (fixative) DigiMAC3 eosin (stain) DigiMAC3 methylene blue (stain) DigiMAC3 rinse (rinse) DigiMAC3 reticulocyte (stain)
CELLPACK DCL (Diluent) CELLPACK DFL (Diluent) LYSERCELL WNR (Lyse) LYSERCELL WDF (Lyse) LYSERCELL WPC (Lyse) FLUOROCELL WNR (Stain) FLUOROCELL WDF (Stain) FLUOROCELL RET (Stain) FLUOROCELL PLT (Stain) FLUOROCELL WPC (Stain) SULFOLYSER (Lyse)
Cleaning solutions DigiMAC3 wash DigiMAC3 clean
CELLCLEAN AUTO
Operational conditions
18 to 27°C ambient temperature 20-60% relative humidity
15 to 30°C ambient temperature 20-85% relative humidity
Similarities Item Device
cobas m 511 system Predicate
CellaVision DM1200 Indications for use The cobas m 511 integrated
hematology analyzer is a quantitative, automated analyzer with cell locating capability. It is intended for in vitro diagnostic use by a skilled operator in the clinical laboratory. The system prepares a stained microscope slide from EDTA-anticoagulated whole blood. It utilizes computer imaging to
DM1200 is an automated cell-locating device. DM1200 automatically locates and presents images of blood cells on peripheral blood smears. The operator identifies and verifies the suggested classification of each cell according to type. DM1200 is intended to be used by skilled operators, trained in the use of the device and in recognition

9
Similarities Item Device
cobas m 511 system Predicate
CellaVision DM1200 count the formed elements of blood and provide an image-based assessment of cell morphology, which may be reviewed by the operator, and also allows for manual classification of unclassified cells. The instrument reports the following parameters: RBC, HGB, HCT, MCV,MCH, MCHC, RDW, RDW-SD, %NRBC, #NRBC, WBC, %NEUT, #NEUT, %LYMPH, #LYMPH, %MONO, #MONO, %EO, #EO, %BASO, #BASO, PLT, MPV, %RET, #RET, HGB-RET.
of blood cells.
Methodology Performs automated analyses of whole blood cells using a combination of low and high magnification imaging of stained cells on a glass microscope slide, with subsequent operator review of computerized images or glass microscope slide for flagged cases.
Same
Sample identification
Automated barcode reading of sample identifier. Manual keyboard entry.
Same
Stains Romanowsky type stain Same Analysis technique Locates, identifies, and counts
the various types of white blood cells under the automated microscope. Red blood cell and platelet morphology can be assessed by the examiner.
Same
Presentation of samples
Cells can be observed on a computer display. Cells can be observed through a microscope.
Same

10
Similarities Item Device
cobas m 511 system Predicate
CellaVision DM1200 Analyte targets Stained components of cells
such as DNA, RNA, and proteins.
Same
Intrinsic color compensation
Algorithms and classifiers tolerate stain variations.
Display color cannot be adjusted.
Same
Information transfer to/from instrument
Through LIS or manual entry on a computer screen.
Same
Differences Item Device
cobas m 511 system Predicate
CellaVision DM1200 Principle of operation
Low magnification location and imaging of white and red blood cells and platelets. High magnification imaging of white blood cell types and cell morphology. Displays analysis results, graphics, and images on a computer screen. Results can be printed on available printer or transmitted to a host computer.
The analysis process consists of an overview image processing and a cell- location step. The overview image is used to find cells of interest and to obtain an overall impression of the sample. The overview image can have one 10x zoom level or both 10x and 50x zoom levels. The cell-location step uses the optical unit and a camera to obtain images of the identified images and stores the images in a database.
Specimen types Whole Blood Whole Blood Body Fluids
Sample preparation Automated slide preparation and staining.
Automated or manual slide preparation and staining.
Light sources and detector
LED light sources with specific blue, green, yellow and red wavelengths.
Black and White cameras.
White light source.
Color camera with RGB filters on individual pixels.
I. Special Control/Guidance Document Referenced (if applicable): Class II Special Controls Guidance Document: Premarket Notifications for Automated

11
Differential Cell Counters for Immature or Abnormal Blood Cells; Final Guidance for Industry and FDA
CLSI EP05-A3, Evaluation of Precision of Quantitative Measurement Procedures;Approved Guideline – Third Edition
CLSI EP06-A, Evaluation of the Linearity of Quantitative Measurement Procedures: A Statistical Approach; Approved Guideline
CLSI EP07-A2, Interference Testing In Clinical Chemistry; Approved Guideline -Second Edition
CLSI EP09-A3, Measurement Procedure Comparison and Bias Estimation Using Patient Samples; Approved Guideline – Third Edition
CLSI EP17-A2, Evaluation of Detection Capability for Clinical Laboratory Measurement Procedures; Approved Guideline – Second Edition
CLSI EP28-A3c, Defining, Establishing, and Verifying Reference Intervals in the Clinical Laboratory; Approved Guideline – Third Edition
CLSI H20-A2, Reference Leukocyte (WBC) Differential Count (Proportional) and Evaluation of Instrumental Methods; Approved Standard – Second Edition
CLSI H26-A2, Validation, Verification, and Quality Assurance of Automated Hematology Analyzers; Approved Standard – Second Edition
IEC 61010-1:2010, Safety requirements for electrical equipment for measurement, control, and laboratory use – Part 1: General requirements
IEC 62304:2006 Medical device software – Software life cycle processes
ISO 14971:2007 Medical devices – Application of risk management to medical devices
J. Performance Characteristics:
1. Analytical Performance:
a. Accuracy:
Accuracy and Comparison at Medical Decision Levels
This study was conducted to evaluate accuracy of the cobas m 511 system compared to reference methods and the Symex XN-10 for samples at medical decision levels for hemoglobin (HGB), hematocrit (HCT), mean cell volume (MCV), platelet (PLT) and reticulocytes (RET). The results of 50 samples from the cobas m 511 system were compared to the following methods: cyanmethemoglobin for the HGB parameter, packed cell volume (PCV) for the HCT parameter, and a ratio using the PCV and RBC count to determine the MCV parameter and Sysmex analyzer for PLT and RET paremeters. Bias to the applicable method and its 95% CI were determined both separately and combined using data obtained from each cobas m 511 system and each medical decision level studied. All results were within the predefined acceptance criteria.

12
Accuracy for Leukopenia Samples
This study was conducted to evaluate accuracy of the cobas m 511 system compared to the 200-cell manual differential of leukopenia samples performed by two medical technologists using the reference method. Ten granulocytopenia samples with granulocytes ≤ 1.5 x 10³/μL and 20 leukopenia samples with white blood cell counts ≤ 4.0 x 10³/μL were included in the analysis. For both the test and reference methods, the five WBC differential parameters, nucleated red blood cells and immature/abnormal cell types (e.g. blast and immature granulocytes) were differentiated and enumerated. Sensitivity and specificity were caluculated for the detection of distributional and morphological abnormalities for the cobas m 511 image, automated differential, system messages and slides versus the reference method. The test method results were compared with the results of the reference method to assess bias. The results met the overall acceptance criteria.
b. Method Comparison:
Method Comparison of Subjects with Medical Conditions
This study was conducted to demonstrate that results produced by the cobas m 511 system are comparable to those produced by the Sysmex XN-10 analyzer when samples from patients with specific medical conditions are evaluated. One-hundred thirty residual whole blood samples were obtained for 23 targeted medical conditions: leukopenia, leukocytosis, neutropenia, neutrophilia, lymphopenia, lymphocytosis, eosinophilia, basophilia, thrombocytopenia, thrombocytosis, polycythemia, chronic myeloid leukemia, chronic lymphocytic leukemia, acute myeloid leukemia, acute lymphocytic leukemia, myelodysplastic syndrome, lymphoma, sickle cell anemia, thalassemia, hemoglobin SC disease, hemolytic anemia, multiple myeloma and septicemia. Each sample was processed in singlicate on the cobas m 511 system and Sysmex XN-10. Deming regression (slope, intercept, 95% confidence intervals and correlation coefficient) was performed according to CLSI EP09-A3. The results met the predefined acceptance criteria.
Method Comparison
Method comparison studies were performed at five clinical sites (three sites in U.S. and two sites in the European Union) to evaluate the performance of the cobas m 511 system compared to the Sysmex XN-10 analyzer using a total of 1,859 residual K2EDTA venous whole blood samples. This study included both pediatric (neonate to ≤ 21 years) and adult subjects, as well as samples from patients with hematologicconditions and ditributional abnormalities (anemia, thrombocytopenia, leukopenia, leukocytosis, elevated hematocrit, elevated nucleated red blood cells).
Bias was determined based on the results of either a Passing-Bablok or Deming regression model. For all parameters, except those with an expected large number of valid results of zero (i.e., %EO, #EO, %BASO and #BASO), the Passing-Bablok regression model was used to determine the intercept and slope of the regression line.

13
For those parameters with a large number of valid results of zero, the Deming (orthogonal) regression model was used. For either regression model used, the sample size (N), Pearson’s correlation coefficient (r), slope and intercept along with their 95% CIs, and the range of comparative measurement procedure values are reported. Bias was determined based on the results of either a Passing-Bablok or Deming regression model. The calculated bias along with its 95% CI are also reported for the critical bias points at the low end, high end, and crossover point. All results were within the pre-defined acceptance criteria.
Correlation of Cobas m 511 vs. Sysmex XN-10 – Combined Sites
Parameter [Units] Sample Range Pearson’s
(r) Intercept (95% CI)
Slope (95% CI)
WBC [103/µL] 0.04–247.04 0.999 0.02
(-0.01, 0.05) 1.012
(1.007, 1.017) RBC
[106/µL] 1.15–7.21 0.974 0.02 (-0.01, 0.04)
0.991 (0.985, 1.000)
HGB [g/dL] 4.20–21.20 0.970 -0.33
(-0.41, -0.24) 1.046
(1.039, 1.053) HCT [%] 13.50–66.00 0.953 -0.72
(-1.06, -0.35) 1.043
(1.033, 1.053) MCV [fL] 58.20–119.20 0.887 -3.03
(-5.06, -0.87) 1.060
(1.035, 1.083) MCH [pg] 17.58–40.75 0.956 1.37
(0.73, 1.80) 0.974
(0.960, 0.996) MCHC [g/dL] 26.59–36.80 0.559 15.71
(14.73, 16.45) 0.522
(0.500, 0.552) RDW [%] 10.70–29.40 0.913 2.46
(2.15, 2.74) 0.870
(0.848, 0.892) RDW-SD
[fL] 31.70–97.10 0.912 5.48 (4.48, 6.46)
0.940 (0.917, 0.963)
PLT [103/µL] 1.00–1061.00 0.973 -11.03
(-13.21, -8.94) 1.020
(1.008, 1.031) MPV [fL] 8.00–13.00 0.772 -0.91
(-1.40, -0.20) 1.063
(1.000, 1.111) %NRBC
[/100 WBC] 0.00–186.10 0.981 N/A N/A
#NRBC [103/µL] 0.00–9.59 0.995 N/A N/A
%NEUT [%] 10.10–94.00 0.989 1.62
(1.12, 2.15) 1.012
(1.004, 1.019) %LYMPH
[%] 0.70–83.00 0.989 -0.23 (-0.37, -0.08)
0.977 (0.971, 0.983)
%MONO [%] 0.60–24.50 0.913 -0.60
(-0.82, -0.50) 1.000
(1.000, 1.026) %EO [%] 0.00–32.90 0.973 -0.08
(-0.13, -0.03) 1.042
(1.030, 1.054)

14
Parameter [Units] Sample Range Pearson’s
(r) Intercept (95% CI)
Slope (95% CI)
%BASO [%] 0.00–3.10 0.721 -0.30
(-0.35, -0.25) 1.649
(1.576, 1.723) #NEUT [103/µL] 0.37–37.66 0.994 0.12
(0.09, 0.15) 1.027
(1.021, 1.033) #LYMPH [103/µL] 0.02–12.66 0.990 -0.06
(-0.07, -0.05) 1.032
(1.022, 1.042) #MONO [103/µL] 0.01–6.14 0.940 -0.03
(-0.04, -0.02) 1.000
(0.976, 1.000) #EO
[103/µL] 0.00–7.17 0.976 -0.01 (-0.01, 0.00)
1.071 (1.060, 1.083)
#BASO [103/µL] 0.00–0.46 0.680 -0.02
(-0.03, -0.02) 1.661
(1.577, 1.744) %RET
[%] 0.05–12.93 0.964 -0.36 (-0.39, -0.32)
1.094 (1.072, 1.116)
#RET [106/µL] 0.00–0.42 0.924 -0.01
(-0.01, -0.01) 1.070
(1.047, 1.092) HGB-RET
[pg] 16.23–45.00 0.793 -3.29 (-4.69, -1.94)
1.141 (1.100, 1.184)
Estimated Bias of Cobas m 511 vs. Sysmex XN-10 – Combined Sites Parameter
[Units] Sample Range
Evaluation Range Bias (95% CI) Low End
Crossover Point
High End
At Low Limit Crossover Point At High
Limit
WBC [103/µL] 0.04–247.04 0.50 4.00 30.00 0.03
(0.00, 0.05)
0.07 (0.05, 0.08)
[103/µL]
1.7 (1.34, 2.09)
[%]
1.26 (0.87, 1.69)
RBC [106/µL] 1.15–7.21 4.00 N/A 5.50 -0.41
(-0.59, -0.25) N/A -0.56 (-0.82, -0.18)
HGB [g/dL] 4.20–21.20 4.50 10.00 21.20 -0.12
(-0.17, -0.07)
0.14 (0.11, 0.15)
[g/dL]
1.35 (1.15, 1.53)
[%]
3.08 (2.70, 3.42)
HCT [%] 13.50–66.00 14.00 N/A 66.00 -0.87
(-2.40, 0.71) N/A 3.20 (2.68, 3.68)
MCV [fL] 58.20–119.20 80.00 N/A 100.00 2.25
(1.97, 2.58) N/A 3.01 (2.65, 3.36)
MCH [pg] 17.58–40.75 28.00 N/A 34.00 2.33
(2.14, 2.52) N/A 1.47 (1.19, 1.76)
MCHC [g/dL] 26.59–36.80 32.00 N/A 36.00 1.26
(1.09, 1.43) N/A -4.19 (-4.44, -3.92)
RDW [%] 10.70–29.40 12.00 N/A 14.60 7.43
(6.98, 7.86) N/A 3.78 (3.39, 4.11)
RDW-SD [fL] 31.70–97.10 40.00 N/A 60.00 7.70
(7.31, 8.13) N/A 3.13 (2.42, 3.90)
PLT [103/µL] 1.00–1061.00 10.00 75.00 1000.00
-10.83 (-12.94, -
8.85)
-9.54 (-11.04, -8.10)
[103/µL]
-12.73 (-14.72, -10.80)
[%]
0.88 (-0.08, 1.84)
MPV [fL] 8.00–13.00 8.00 N/A 10.20 -5.08
(-6.62, -2.50) N/A -2.63 (-3.03, -1.96)
%NRBC 0.00–186.10 0.00 N/A 1.50 -0.03 N/A Ψmean

15
Parameter [Units]
Sample Range
Evaluation Range Bias (95% CI) Low End
Crossover Point
High End
At Low Limit Crossover Point At High
Limit [/100 WBC]
(-0.06, 0.01) difference
#NRBC [103/µL] 0.00–9.59 0.00 N/A 0.10 0.00
(0.00, 0.00) N/A Ψmean
difference %NEUT
[%] 10.10–94.00 40.00 N/A 85.00 5.21 (4.60, 5.84) N/A 3.06
(2.82, 3.30)
%LYMPH[%] 0.70–83.00 25.00 40.00 65.00 -0.81
(-0.91, -0.70)
-1.15(-1.32, -0.98) [%LYMPH]
-2.89 (-3.30, -2.44)
[%]
-2.66 (-3.13, -2.15)
%MONO [%] 0.60–24.50 2.00 N/A 10.00 -0.60
(-0.78, -0.50) N/A -0.60 (-0.70, -0.50)
%EO[%] 0.00–32.90 0.00 N/A 5.00 -0.08
(-0.13, -0.03) N/A 0.13(0.09, 0.17)
%BASO [%] 0.00–3.10 0.00 N/A 1.00 -0.30
(-0.35, -0.25) N/A 0.35(0.31, 0.39)
#NEUT [103/µL] 0.37–37.66 1.00 1.50 10.00 0.15
(0.12, 0.17)
0.16(0.14, 0.19)
[103/µL]
10.98 (9.18, 12.37)
[%]
3.92(3.43, 4.36)
#LYMPH[103/µL] 0.02–12.66 0.50 1.50 3.00 -0.04
(-0.05, -0.03)
-0.01 (-0.02, 0.00)
[103µL]
-0.71 (-1.30, -0.16)
[%]
1.26(0.58, 1.87)
#MONO [103/µL] 0.01–6.14 0.10 N/A 1.50 -0.03
(-0.04, -0.02) N/A -0.03 (-0.06, -0.03)
#EO [103/µL] 0.00–7.17 0.00 N/A 0.50 -0.01
(-0.01, 0.00) N/A 0.03(0.03, 0.04)
#BASO [103/µL] 0.00–0.46 0.00 N/A 0.10 -0.02
(-0.03, -0.02) N/A 0.04(0.04, 0.05)
%RET[%] 0.05–12.93 0.50 1.67 2.50 -0.31
(-0.34, -0.28)
-0.20 (-0.21, -0.18)
[%RET]
-11.91(-12.75, -10.83)
[%]
-4.84 (-5.80, -3.81)
#RET [106/µL] 0.00–0.42 0.02 N/A 0.15 -0.01
(-0.01, -0.01) N/A 0.00 (0.00, 0.00)
HGB-RET [pg] 16.23–45.00 23.00 N/A 40.00 -0.23
(-2.11, 1.61) N/A 5.84 (4.94, 6.83)
Ψbias was calculated using the mean difference between the cobas m 511 system result and the Sysmex XN-10
Sensitivity and Specificity
For the sensitivity and specificity analysis, the cobas m 511 automated differential,cobas m 511 system messages and cobas m 511 images were compared to a 400-cell differential derived from two independent 200-cell microscopic reviews of a blood smear (reference method). For this analysis, separate 2x2 tables were constructed in order to determine sensitivity for both morphological and distributional abnormalities. Results for sample size (N) and numbers of true positives (TP), false positives (FP), true negatives (TN), and false negatives (FN) are reported, as well as sensitivity, specificity, and efficiency.

16
Results Summary for cobas m 511 Images versus Reference Method for All Sites Combined
Distributional Abnormalities
N TP FP FN TN Sensitivity (95%CI)
Specificity (95%CI)
Efficiency (95%CI)
%NEUT 426 246 18 23 139 91.40% (87.5, 94.2)
88.50% (82.6, 92.6)
90.40% (87.2, 92.8)
%LYMPH 426 273 12 35 106 88.60% (84.6, 91.7)
89.80% (83.1, 94.1)
89.00% (85.6, 91.6)
%MONO 426 93 36 48 249 66.00% (57.8, 73.3)
87.40% (83.0, 90.7)
80.30% (76.2, 83.8)
%EO 426 85 75 20 246 81.00% (72.4, 87.3)
76.60% (71.7, 80.9)
77.70% (73.5, 81.4)
%BASO 426 8 67 6 345 57.10% (32.6, 78.6)
83.70% (79.9, 87.0)
82.90% (79.0, 86.1)
Any Distributional Abnormality or Combination of Distributional
Abnormalities 426 341 19 16 50 95.50%
(92.8, 97.2) 72.50%
(61.0, 81.6) 91.80%
(88.8, 94.0)
Morphological Abnormalities
N TP FP FN TN Sensitivity (95%CI)
Specificity (95%CI)
Efficiency (95%CI)
Blasts 426 59 8 9 350 86.80% (76.7, 92.9)
97.80% (95.7, 98.9)
96.00% (93.7, 97.5)
Immature Granulocytes 426 45 8 14 359 76.30% (64.0, 85.3)
97.80% (95.8, 98.9)
94.80% (92.3, 96.6)
NRBCs 426 14 1 7 404 66.70% (45.4, 82.8)
99.80% (98.6, 100.0)
98.10% (96.3, 99.0)
Any Morphological Abnormality or Combination of Morphological
Abnormalities 426 99 6 14 307 87.60%
(80.3, 92.5) 98.10%
(95.9, 99.1) 95.30%
(92.9, 96.9)
Overall – Acceptance Criteria Only Applied to These Results
N TP FP FN TN Sensitivity (95%CI)
Specificity (95%CI)
Efficiency (95%CI)
Any Morphological or Distributional Abnormality, or combination 426 351 16 15 44 95.90%
(93.3, 97.5) 73.30%
(61.0, 82.9) 92.70%
(89.9, 94.8)
Summary of Results for cobas m 511 Automated Differential versus Reference Method for All Sites Combined
Distributional Abnormalities
N TP FP FN TN Sensitivity (95% CI)
Specificity (95% CI)
Efficiency (95% CI)
%NEUT 355 186 18 21 130 89.9% (85.0, 93.3)
87.8% (81.6, 92.2)
89.0% (85.3, 91.9)
%LYMPH 355 228 8 23 96 90.8% (86.6, 93.8)
92.3% (85.6, 96.1)
91.3% (87.9, 93.8)
%MONO 355 57 31 38 229 60.0% (49.9, 69.3)
88.1% (83.6, 91.5)
80.6% (76.1, 84.3)
%EO 355 64 44 15 232 81.0% (71.0, 88.1)
84.1% (79.3, 87.9)
83.4% (79.2, 86.9)

17
Distributional Abnormalities
N TP FP FN TN Sensitivity (95% CI)
Specificity (95% CI)
Efficiency (95% CI)
%BASO 355 6 31 5 313 54.5% (28.0, 78.7)
91.0% (87.5, 93.6)
89.9% (86.3, 92.6)
Overall – Acceptance Criteria Only Applied to These Results
N TP FP FN TN Sensitivity (95% CI)
Specificity (95% CI)
Efficiency (95% CI)
Any Distributional Abnormality or Combination of Distributional
Abnormalities 355 272 17 16 50 94.40%
(91.2, 96.6) 74.60%
(63.1, 83.5) 90.70%
(87.2, 93.3)
Summary of Results for cobas m 511 System Messages versus Reference Method for All Sites Combined
Message
N TP FP FN TN Sensitivity (95% CI)
Specificity (95% CI)
Efficiency (95% CI)
"Suspect Blasts?" 439 76 5 0 358 100.00% (95.2, 100.0)
98.60% (96.8, 99.4)
98.90% (97.4, 99.5)
"Suspect Immature Granulocytes?" 439 53 10 8 368 86.90% (76.2, 93.2)
97.40% (95.2, 98.6)
95.90% (93.6, 97.4)
"Suspect Atypical Lymphocytes?" 439 13 8 1 417 92.90% (68.5, 98.7)
98.10% (96.3, 99.0)
97.90% (96.2, 98.9)
Overall – Acceptance Criteria Only Applied to These Results
N TP FP FN TN Sensitivity (95% CI)
Specificity (95% CI)
Efficiency (95% CI)
Any Message or Combination of Messages 439 118 10 9 302 92.90%
(87.1, 96.2) 96.80%
(94.2, 98.2) 95.70%
(93.3, 97.2)
Morphological Grading
To determine the performance of the cobas m 511 system (images and slides) with respect to reporting of morphology grading, data was analyzed using percent agreement analysis. The morphology grading of 163 sample results from cobas m 511 images and cobas m 511 slides was compared to morphology grading obtained by a trained independent reviewer (IR) from a single blood smear. WBC morphology, platelet morphology and RBC size, color and shape characteristics that were graded using a quantitative grading system (e.g., 0 to 4+ grading scale), the sample size (N), the number of results that agree (A), the number of results that disagree (D), and the percent agreement were reported. RBC inclusions (parasites, basophilic stippling, Howell-jolly bodies, and Pappenheimer bodies) were graded using a present/not present grading system, the sample size (N), the number of results that agree (A and D), the number of results that disagree (B and C), the percent positive and negative agreements (PPA and NPA, respectively), and total agreement are reported. The results met the predefined acceptance criteria.

18
Morphology Assessment Results for cobas m 511 Images (Graded Criteria) for All Sites Combined
Morphological Characteristic Sample Size (N) A D Percent Agreement
WBC Morphology Hypogranular/ Agranular
Granulocytes 163 162 1 99.4
Hyposegmentation 163 163 0 100.0 Toxic Vacuolation 163 158 5 96.9
Döhle Bodies 163 157 6 96.3 Toxic Granulation 163 148 15 90.8 Hypersegmentation 163 161 2 98.8
Smudge Cells 163 162 1 99.4 Platelet Satellitosis 163 163 0 100.0
RBC Morphology Anisocytosis 163 143 20 87.7 Microcytosis 163 141 22 86.5 Macrocytosis 163 148 15 90.8 Hypochromia 163 145 18 89.0 Polychromasia 163 155 8 95.1
Poikilocytosis Tear Drops 163 161 2 98.8 Blister Cells 163 163 0 100.0 Target Cells 163 140 23 85.9 Schistocytes 163 162 1 99.4 Echinocytes 163 158 5 96.9
Elliptocytes/Ovalocytes 163 151 12 92.6 Stomatocytes 163 162 1 99.4 Sickle Cells 163 162 1 99.4 Spherocytes 163 163 0 100.0
Acanthocytes 163 161 2 98.8 PLT Morphology
Large Platelets 163 143 20 87.7 Giant Platelets 163 155 8 95.1
Agranular/Hypogranular Platelets 163 163 0 100.0
Platelet Clumps 163 151 12 92.6 Megakaryocytic Cells 163 163 0 100.0

19
Morphology Assessment Results for cobas m 511 Images (Present/Not Present Criteria) for All Sites Combined Morphological Characteristic
Sample Size (N) A B C D PPA NPA Percent
Agreement Parasites 203 12 9 1 181 57.1 99.5 95.1
Basophilic Stippling 163 15 28 1 119 34.9 99.2 82.2
Howell-Jolly Bodies 163 9 2 3 149 81.8 98.0 96.9
Pappenheimer Bodies 163 4 2 3 154 66.7 98.1 96.9
Auer Rods 211 5 6 2 198 45.5 99.0 96.2
c. Precision/Reproducibility:
Two studies were conducted to assess repeatability on the cobas m 511 system. The first study evaluated inter-intrument precision of whole blood samples and the second study evaluted within-run precision.
Inter-instrument precision was evaluated using whole blood samples from five healthy volunteer donors and 21 residual abnormal samples. Eleven replicates were processed from each sample on three different cobas m 511 systems (33 replicates total per sample) at one site. Abnormal samples included low and high reticulocyte counts (%RET ≤ 0.5% and ≥ 5.0%, respectively) and medical decision level samples including anemia (HGB 6-10 g/dL), thrombocytopenia (PLT ≤ 10 x 103/μL), and severe leukopenia (WBC 0-2 x 10³/μL). The mean, standard deviation (SD) and percent coefficient of variation (% CV) with corresponding 95% confidence intervals were calculated for each parameter using a variance component analysis. Within-run precision (repeatability), between-instrument variability, and total variability (inter-instrument precision) were analyzed. All results met the predefined acceptance criteria.
To evaluate repeatability (i.e., within-run precision) whole blood samples were processed 31 consecutive times on the cobas m 511 system. Residual whole blood samples were selected for the WBC, RBC, HGB and PLT parameters at targeted low, middle and high ranges. In addition, samples at medical decision levels of anemia, thrombocytopenia, severe leukopenia, and nucleated red blood cells were evaluated. At each of the four sites, 48 samples were targeted for collection (36 residual whole blood samples and 12 medical decision level samples). Repeatability results were calculated for all sites combined and all results met their predefined acceptance criteria.
Reproducibility
Two studies were conducted to assess reproducibility on the cobas m 511 system. The first study evaluated total precision of a single cobas m 511 instrument at one site and

20
the second study evaluated total precision of the cobas system across multiple sites.
To evaluate single-site reproducibility, testing was performed using a single cobas m 511 system with three lots of DigiMAC3 stain packs, wash solution, and reticulocyte stain and three different lots of DigiMAC3 controls. Three different operators conducted the study over the course of 20 operating days with wo runs per day and two replicates per run. The following components of precision were evaluated: repeatability (within-run), between-run, between-day, between-lot, between-operator, and within-laboratory (total precision). All results met the predefined acceptance criteria.
To evalute precision at all sites, one lot of control material (L1, L2, L3) was used across four sites for five days with two runs per day and three replicates per run. The data generated from this assessment was used to calculate repeatability (within-run precision), between-day and between-run precision, between-laboratory precision (includes variability of different systems and operators), and reproducibility (total precision). For each reported parameter and for each level of control tested, the sample size (N), mean, SD and %CV of the various components of precision were calculated along with the 95% CI of the SD and %CV for repeatability and reproducibility (total precision). All results met the predefined acceptance criteria.
Reproducibility for Combined Sites
Parameter [Units]
Control Level N Mean
Repeatability Between-Run Between-Day Between-
Laboratory
Reproducibility (Total
Precision) SD %CV SD %CV SD %CV SD %CV SD %CV
WBC [103/µL]
L1 120 16.93 0.259 1.53 0.000 0.00 0.151 0.89 0.272 1.61 0.404 2.39 L2 120 8.00 0.209 2.62 0.022 0.28 0.065 0.82 0.158 1.97 0.271 3.39 L3 120 2.64 0.150 5.66 0.000 0.00 0.077 2.93 0.096 3.64 0.194 7.34
RBC [106/µL]
L1 120 2.56 0.018 0.72 0.006 0.25 0.019 0.75 0.064 2.50 0.070 2.72 L2 120 4.29 0.053 1.23 0.000 0.00 0.039 0.92 0.102 2.38 0.121 2.83 L3 120 5.58 0.056 1.00 0.000 0.00 0.052 0.94 0.116 2.08 0.139 2.50
HGB [g/dL]
L1 120 6.26 0.058 0.92 0.014 0.22 0.050 0.79 0.216 3.45 0.230 3.67 L2 120 12.31 0.143 1.16 0.019 0.15 0.112 0.91 0.374 3.04 0.417 3.38 L3 120 17.45 0.216 1.24 0.000 0.00 0.145 0.83 0.461 2.64 0.530 3.04
HCT [%] L1 120 18.11 0.154 0.85 0.065 0.36 0.144 0.79 0.409 2.26 0.465 2.57 L2 120 34.95 0.406 1.16 0.118 0.34 0.283 0.81 0.639 1.83 0.817 2.34 L3 120 49.24 0.596 1.21 0.000 0.00 0.331 0.67 0.735 1.49 1.003 2.04
MCV [fL] L1 120 70.77 0.305 0.43 0.265 0.37 0.226 0.32 0.268 0.38 0.535 0.76 L2 120 81.47 0.342 0.42 0.356 0.44 0.239 0.29 0.474 0.58 0.725 0.89 L3 120 88.27 0.413 0.47 0.285 0.32 0.464 0.53 0.499 0.56 0.846 0.96
MCH [pg]
L1 120 24.48 0.129 0.53 0.087 0.36 0.115 0.47 0.288 1.18 0.347 1.42 L2 120 28.68 0.110 0.38 0.114 0.40 0.110 0.38 0.232 0.81 0.301 1.05 L3 120 31.28 0.134 0.43 0.092 0.29 0.102 0.33 0.216 0.69 0.289 0.92
MCHC L1 120 34.58 0.122 0.35 0.110 0.32 0.213 0.62 0.448 1.29 0.522 1.51

21
Parameter [Units]
Control Level N Mean
Repeatability Between-Run Between-Day Between-
Laboratory
Reproducibility (Total
Precision) SD %CV SD %CV SD %CV SD %CV SD %CV
[g/dL] L2 120 35.20 0.107 0.30 0.116 0.33 0.138 0.39 0.441 1.25 0.489 1.39 L3 120 35.43 0.097 0.28 0.084 0.24 0.171 0.48 0.415 1.17 0.467 1.32
RDW [%] L1 120 15.62 0.277 1.77 0.090 0.57 0.060 0.38 0.236 1.51 0.379 2.43 L2 120 13.18 0.248 1.88 0.203 1.54 0.000 0.00 0.107 0.81 0.338 2.56 L3 120 13.12 0.277 2.11 0.000 0.00 0.028 0.21 0.112 0.86 0.300 2.29
RDW-SD [fL]
L1 120 39.79 0.587 1.48 0.307 0.77 0.263 0.66 0.744 1.87 1.030 2.59 L2 120 38.65 0.628 1.63 0.487 1.26 0.000 0.00 0.480 1.24 0.929 2.40 L3 120 41.71 0.759 1.82 0.000 0.00 0.211 0.51 0.449 1.08 0.907 2.18
PLT [103/µL]
L1 120 470.53 4.611 0.98 1.885 0.40 3.705 0.79 5.187 1.10 8.090 1.72 L2 120 215.97 3.213 1.49 0.771 0.36 2.524 1.17 2.262 1.05 4.734 2.19 L3 120 76.69 1.281 1.67 0.916 1.19 0.697 0.91 0.935 1.22 1.960 2.56
MPV [fL] L1 120 7.65 0.089 1.17 0.000 0.00 0.020 0.27 0.042 0.55 0.101 1.32 L2 120 7.49 0.103 1.38 0.039 0.52 0.045 0.60 0.058 0.77 0.133 1.77 L3 120 7.36 0.173 2.35 0.028 0.39 0.000 0.00 0.043 0.58 0.180 2.45
%NRBC [/100 WBC]
L2 120 18.30 0.931 5.09 0.250 1.37 0.000 0.00 1.185 6.48 1.528 8.35
L3 120 8.84 1.011 11.44 0.266 3.01 0.000 0.00 0.427 4.83 1.129 12.78
#NRBC [103/µL]
L2 120 1.46 0.067 4.59 0.023 1.59 0.000 0.00 0.110 7.50 0.131 8.94 L3 120 0.23 0.027 11.62 0.008 3.42 0.000 0.00 0.016 6.65 0.032 13.82
%NEUT [%]
L1 120 58.35 1.734 2.97 0.161 0.28 0.432 0.74 1.247 2.14 2.185 3.74 L2 120 59.79 1.867 3.12 0.000 0.00 1.010 1.69 1.256 2.10 2.466 4.13 L3 120 58.65 1.957 3.34 0.485 0.83 0.856 1.46 1.133 1.93 2.466 4.20
%LYMPH [%]
L1 120 39.37 1.667 4.23 0.000 0.00 0.266 0.68 1.280 3.25 2.119 5.38 L2 120 37.32 1.798 4.82 0.000 0.00 1.078 2.89 1.252 3.35 2.442 6.54 L3 120 37.47 1.997 5.33 0.000 0.00 0.721 1.93 1.088 2.90 2.386 6.37
%MONO [%]
L1 120 2.02 0.584 28.89 0.000 0.00 0.000 0.00 0.227 11.21 0.626 30.99 L2 120 2.45 0.663 27.02 0.167 6.80 0.096 3.90 0.279 11.39 0.744 30.35 L3 120 3.12 0.761 24.43 0.093 2.99 0.181 5.80 0.244 7.85 0.825 26.47
%EO* [%] L1 120 0.17 0.141 N/A 0.040 N/A 0.061 N/A 0.085 N/A 0.180 N/A L2 120 0.31 0.191 N/A 0.076 N/A 0.062 NA 0.110 N/A 0.241 N/A L3 120 0.68 0.351 N/A 0.000 N/A 0.078 N/A 0.247 N/A 0.436 N/A
%BASO* [%]
L1 120 0.09 0.127 N/A 0.000 N/A 0.000 N/A 0.059 N/A 0.140 N/A L2 120 0.13 0.129 N/A 0.039 N/A 0.037 N/A 0.083 N/A 0.163 N/A L3 120 0.08 0.114 NA 0.000 N/A 0.041 N/A 0.021 N/A 0.123 N/A
#NEUT [103/µL]
L1 120 9.87 0.307 3.11 0.052 0.52 0.103 1.04 0.090 0.92 0.340 3.44 L2 120 4.78 0.191 4.00 0.040 0.84 0.091 1.90 0.073 1.54 0.228 4.76 L3 120 1.55 0.098 6.31 0.000 0.00 0.058 3.76 0.035 2.28 0.119 7.70
#LYMPH [103/µL]
L1 120 6.67 0.314 4.71 0.000 0.00 0.076 1.14 0.321 4.81 0.455 6.83 L2 120 2.99 0.167 5.58 0.000 0.00 0.089 2.99 0.151 5.05 0.242 8.10 L3 120 0.99 0.078 7.85 0.000 0.00 0.027 2.72 0.062 6.24 0.103 10.39

22
Parameter [Units]
Control Level N Mean
Repeatability Between-Run Between-Day Between-
Laboratory
Reproducibility (Total
Precision) SD %CV SD %CV SD %CV SD %CV SD %CV
#MONO [103/µL]
L1 120 0.34 0.098 28.72 0.000 0.00 0.000 0.00 0.032 9.46 0.104 30.24 L2 120 0.20 0.054 27.46 0.009 4.64 0.007 3.55 0.017 8.89 0.058 29.45 L3 120 0.08 0.022 26.57 0.000 0.00 0.006 7.35 0.005 6.43 0.023 28.30
#EO* [103/µL]
L1 120 0.03 0.023 N/A 0.007 N/A 0.011 N/A 0.013 N/A 0.029 N/A L2 120 0.02 0.015 N/A 0.007 N/A 0.005 N/A 0.008 N/A 0.019 N/A L3 120 0.02 0.010 N/A 0.000 NA 0.002 N/A 0.006 N/A 0.012 N/A
#BASO* [103/µL]
L1 120 0.02 0.021 N/A 0.005 N/A 0.000 N/A 0.010 N/A 0.023 N/A L2 120 0.01 0.010 N/A 0.004 N/A 0.003 N/A 0.006 N/A 0.013 N/A L3 120 0.00 0.004 N/A 0.000 N/A 0.001 N/A 0.001 N/A 0.004 N/A
%RET [%] L1 120 7.46 0.525 7.03 0.310 4.16 0.155 2.07 0.397 5.32 0.744 9.97 L2 120 3.28 0.261 7.97 0.180 5.50 0.000 0.00 0.199 6.05 0.375 11.42
#RET [106/μL]
L1 120 0.19 0.014 7.40 0.008 4.06 0.004 2.09 0.010 4.99 0.019 10.03 L2 120 0.14 0.012 8.66 0.006 4.41 0.005 3.23 0.010 7.01 0.017 12.42
HGB-RET [pg]
L1 120 25.22 0.320 1.27 0.213 0.84 0.000 0.00 0.327 1.30 0.504 2.00 L2 120 26.11 0.369 1.41 0.146 0.56 0.149 0.57 0.362 1.39 0.557 2.14
*Parameters were evaluated based on SD.
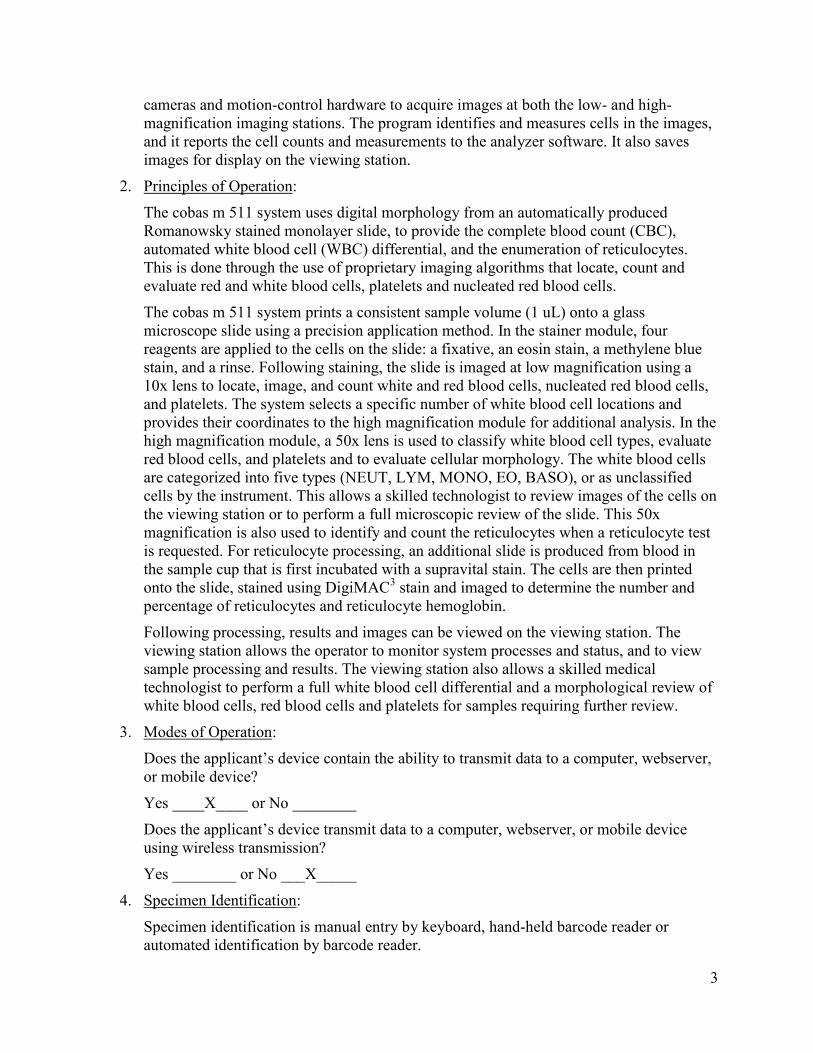
c. Linearity:
Linearity for RBC, HGB, HCT and WBC was evaluated using fresh whole blood samples. PLT linearity was evaluated using fresh platelet apheresis samples and corresponding whole blood samples. Reticulocyte (RET) linearity was evaluated using residual whole blood samples. Each sample was concentrated and diluted as necessary to create three separate linearity series, each consisting of a high pool, a low pool, and seven intermediate concentrations. The low pool concentrations for WBCs ranged from 0.04–0.07 x 10³/μL and the high pool concentrations ranged from 404.8–561.1 x 10³/μL. In the linearity series for PLT the low pool concentration ranged from 0–9 x 10³/μL and the high pool concentration ranged from 5000–5130 x 103/μL. The low pool concentrations in each of the three separate linearity series for RET ranged from 0.01–0.03 x 10⁶/μL and the high pool concentrations ranged from 0.63–0.75 x 10⁶/μL. Each of the nine concentrations, in each of the three linearity series, was processed to obtain six replicates in each of the closed tube and open tube modes. Each linearity series was processed in both open and closed tube modes on three cobas m 511 systems.
Regression analysis was used to assess linearity for first order model (e.g. linear), and weighted polynomial regression was used to assess linearity for second and third order models (e.g, quadratic and cubic). RBC achieved linearity with a first order model while for all other parameters linearity was achieved through polynomial regression.
23
Parameter Linear Range WBC (x103/µL) 0.07–404.8 RBC (x106/µL) 0.37–8.26
HGB (g/dL) 1.1–24.2.0 HCT (%) 3.2–72.2
PLT (x103/µL) 0–5130 RET (x106/µL) 0.01–0.63
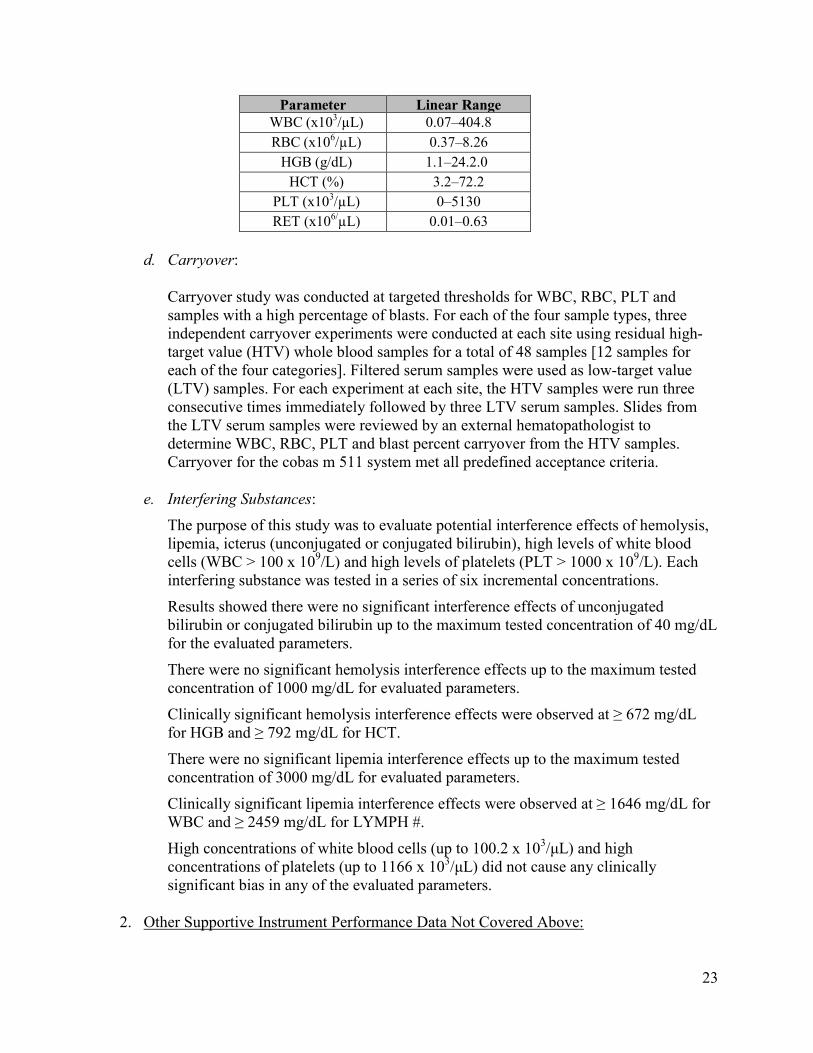
d. Carryover:
Carryover study was conducted at targeted thresholds for WBC, RBC, PLT and samples with a high percentage of blasts. For each of the four sample types, three independent carryover experiments were conducted at each site using residual high-target value (HTV) whole blood samples for a total of 48 samples [12 samples for each of the four categories]. Filtered serum samples were used as low-target value (LTV) samples. For each experiment at each site, the HTV samples were run three consecutive times immediately followed by three LTV serum samples. Slides from the LTV serum samples were reviewed by an external hematopathologist to determine WBC, RBC, PLT and blast percent carryover from the HTV samples. Carryover for the cobas m 511 system met all predefined acceptance criteria.
e. Interfering Substances: The purpose of this study was to evaluate potential interference effects of hemolysis, lipemia, icterus (unconjugated or conjugated bilirubin), high levels of white blood cells (WBC > 100 x 109/L) and high levels of platelets (PLT > 1000 x 109/L). Each interfering substance was tested in a series of six incremental concentrations.
Results showed there were no significant interference effects of unconjugated bilirubin or conjugated bilirubin up to the maximum tested concentration of 40 mg/dL for the evaluated parameters.
There were no significant hemolysis interference effects up to the maximum tested concentration of 1000 mg/dL for evaluated parameters.
Clinically significant hemolysis interference effects were observed at ≥ 672 mg/dL for HGB and ≥ 792 mg/dL for HCT.
There were no significant lipemia interference effects up to the maximum tested concentration of 3000 mg/dL for evaluated parameters.
Clinically significant lipemia interference effects were observed at ≥ 1646 mg/dL for WBC and ≥ 2459 mg/dL for LYMPH #.
High concentrations of white blood cells (up to 100.2 x 10³/μL) and high concentrations of platelets (up to 1166 x 103/μL) did not cause any clinically significant bias in any of the evaluated parameters.
2. Other Supportive Instrument Performance Data Not Covered Above:

24
a. Reference Intervals
The normal adult reference interval for all parameters reported by the cobas m 511 system was established by analyzing whole blood samples collected in K2EDTA from a total population of 489 healthy individuals (N=240 males, N=249 females).
A literature reference interval verification study was performed for the pediatric population. A total of 504 samples were collected from apparently healthy pediatric patients that ranged from < 1 day old to 18 years (258 samples) and 18 to ≤ 22 years (246 samples) to support the Intended Use. All samples were collected in K2EDTA anticoagulant and analyzed in singlet in the automated whole blood sampling mode.
b. Mode to Mode Comparison
To demonstrate equivalency between results of samples processed in the closed tube (i.e. automated) mode of operation and the open tube (i.e. manual) mode of operation on the cobas m 511 system, a comparison study was conducted using 140 residual samples collected in K2EDTA. Correlation and bias between the closed tube and open tube processing mode results were determined based on the results of either a Passing-Bablok or Deming regression model. For the %NRBC and #NRBC parameters the mean difference was used to calculate bias. All reportable parameters that were evaluated met their predefined bias acceptance criteria.
c. Open Mode studies
Precision (repeatability) To evaluate repeatability in open tube mode performance, 12 residual K2EDTA whole blood samples selected at random from the routine laboratory population as well as two residual whole blood samples with reticulocytes ≥ 5% were used for this study. Eleven replicates were processed from each random sample on three different cobas m 511 systems (33 replicates per sample) in the open tube mode. The results from all three systems were pooled for analysis. The mean, standard deviation (SD), and percent coefficient of variation (% CV) with corresponding 95% confidence intervals were calculated for each parameter using a variance component analysis in accordance with the CLSI EP05-A3 guideline. Within-run precision (repeatability), between-instrument variability, and total variability (inter-instrument precision) were analyzed. All results were within the predefined acceptance criteria.
Morphology To assess the WBC differential parameters and WBC, RBC and PLT morphology in open tube mode, two studies were conducted using 24 targeted residual K2EDTA whole blood samples. The samples were processed in both open tube and closed tube modes on each of three cobas m 511 systems. Two separate analyses were conducted. In Part IIA the cobas m 511 system automated WBC differential results for the 24 samples were compared between the open tube and closed tube modes. Correlation and bias were determined in accordance with the CLSI EP09-A3 guideline. In Part IIB, each of three medical technologists (MTs) reviewed on the viewing station all of the cobas m 511 images generated from the 24 samples from all three systems, which were run in both open tube and closed tube modes. This analysis was conducted to determine whether WBC, RBC and PLT morphology were consistent between the

25
two modes and between systems. Two analysis methods were used to evaluate results from this portion of the study. Agreement analysis was performed for each morphological characteristic using either a qualitative grading system (e.g., Present / Not Present) or a quantitative grading system (e.g., 0 to 4+ grading scale). All results were within the predefined acceptance criteria.
Carryover Carryover in the open tube mode was evaluated using four residual K2EDTA whole blood samples, each selected as a high target value (HTV) sample type. Three separate experiments were run for each of the WBC, RBC, PLT and blasts samples. In each experiment, the HTV sample was processed three consecutive times immediately followed by three tubes of low target value (LTV) samples. The HTV and LTV samples were run in open tube mode on a single cobas m 511 system. The LTV samples, were comprised of filtered serum equilibrated to room temperature. By design, when serum samples are run on the cobas m 511 system, the instrument will make a slide but will ultimately reject the sample when it is presented at the low-magnification imaging station because it does not contain sufficient cells for the imaging microscopes to focus. The LTV slides, however, were retrieved from the instrument and manually reviewed under a microscope to assess if any carryover was evident from the three prior runs of HTV samples. Carryover in the open tube mode for the cobas m 511 system met all predefined acceptance criteria.
d. Limits of Detection, Blank, and Quantitation (LoD, LoB, and LoQ)
This study was conducted to evaluate LoB, LoD and LoQ WBC and PLT parameters on the cobas m 511 system. The study was conducted using three cobas m 511 systems. To determine LoB, testing was performed on three individual test days, using five preserved Streck RBC samples which contained no white blood cells or platelets. These samples were processed two times per test day on each of two cobas m 511 systems, yielding a total of 60 measurements. To determine LoD, residual K2EDTA whole blood samples with targeted low level values that were greater than the LoB were used. The LoD samples were processed four consecutive times on each of three cobas m 511 systems, for a total of 72 measurements for both WBC and PLT samples. To determine LoQ, residual whole blood samples with targeted low level values that were greater than the LoD were used. The LoB, LoD and LoQ were successfully determined and met all pre-specified acceptance criteria.
Parameter LoB LoD LoQ WBC
(x103/µL) 0.05 0.08 0.24
PLT (x103/µL) 1 3 6
e. K2EDTA and K3EDTA Performance Comparison
This study was conducted to demonstrate comparability between whole blood samples collected into K2 and K3 EDTA. This study was performed using 44 whole blood samples from healthy volunteer donors. For each sample, the K2EDTA results

26
were compared to K3EDTA results for all parameters. All acceptance criteria were met, demonstrating equivalency of results between samples collected into K2EDTA and K3EDTA.
To evaluate whole blood samples collected with K3EDTA a method comparison study was conducted with 40 abnormal samples on the cobas m 511 and Sysmex XN-10. Bias was determined based on the results of either a Passing-Bablok or Deming regression model, except for the %NRBC and #NRBC parameters. For these two parameters, no regression analysis was used; rather, the bias was calculated as the mean difference between the cobas m 511 system and Sysmex Analyzer. Results were within predefined critical bias limits.
f. Venous and Capillary Blood Performance Comparisons
This study was conducted to demonstrate comparability between capillary and venous blood processed on the cobas m 511 system from the same donor. This study was performed using 40 paired whole blood samples from healthy volunteer donors. Blood was drawn twice from each donor, once via venipuncture (venous) and once via finger-stick (capillary). For all samples, results from the cobas m 511 system were comparable for capillary and venous blood. Overall, the data demonstrate that both capillary and venous blood can be processed on the cobas m 511 system and produce similar results.
To evaluate abnormal capillary whole blood samples on the cobas m 511 system a method comparison study was conducted with 40 abnormal capillary samples on the cobas m 511 and Sysmex XN-10. Bias was determined based on the results of either a Passing-Bablok or Deming regression model, except for the %NRBC and #NRBC parameters. For these two parameters, no regression analysis was used; rather, the bias was calculated as the mean difference between the cobas m 511 system and Sysmex Analyzer. Results were within predefined bias limits.
g. Sample Stability
Sample stability was determined for normal and abnormal samples at two clinical sites. Normal samples were processed in duplicate at each of the following time points: baseline (time zero (0)) and after 9, 20, 26, 38, and 50 hours in both ambient (15ºC–25ºC) and refrigerated (2ºC–8ºC) storage conditions. Abnormal samples were processed in duplicate at each of the following time points: baseline (time zero (0)) and after 9, 26, and 50 hours in both ambient (15ºC–25ºC) and refrigerated (2ºC–8ºC) storage conditions. For each time point, results were compared to the respective baseline (zero (0) hour) results. The combined results from both protocols demonstrated stability for normal and abnormal samples for 48 hours.
h. Stability of cobas m 511 Slides
This study was conducted to demonstrate that cobas m 511 slides stored for 30 days produce similar results compared to original (baseline) results, with respect to manual microscopic reviews for the WBC differential and morphology. The results from all evaluations performed during this study were successful and met predefined acceptance criteria. This demonstrates that slides generated by the cobas m 511 system are stable for manual microscopic review for a minimum of 30 days.

27
K. Proposed Labeling:
The labeling is sufficient and it satisfies the requirements of 21 CFR Part 809.10.
L. Conclusion:
The submitted information in this premarket notification is complete and supports a substantial equivalence decision.