Embed Size (px)
Citation preview

Juvenile Salmonid Species Composition, Timing, Distribution, and Diet in Nearshore Marine Waters of Central Puget Sound in 2001-2002 – King County 5-1
SECTION 5: RECOMMENDATIONS It is the opinion of the authors that, based on the results of this study, it is apparent that there are a number of management actions that should be taken to improve habitat conditions for juvenile salmonids, which would lead to increased survival and productivity. The advancements in our understanding of salmon ecology and use of marine nearshore areas in Central Puget Sound as a result of this study also helps to elucidate key questions to be answered, or hypotheses to be tested. This, in turn, could provide additional critical information for salmon recovery actions and shoreline management.
The following recommendations are divided into two nonprioritized lists: (1) Management actions; and, (2) Future studies/Additional analyses. Although recommendations are made for specific actions, there are a number of general actions that are needed to protect and restore marine nearshore ecosystems for the benefit of salmon and other living resources. Protection actions include regulatory, enforcement, acquisition, incentive programs, public education, and other actions that stop, or reduce further harm. Similarly, restoration actions, which include replacement, enhancement, mitigation, and other actions taken to replace, or improve ecological functions and processes, are not well developed and are generally lacking in most nearshore areas. Therefore, for each of these recommendations, there are a number of general actions that should be used to achieve management goals of protection and restoration.
5.1. MANAGEMENT ACTIONS Protect and Restore Marine Riparian Vegetation
Riparian areas provide multiple functions that may be important to salmonids, including prey production, water quality/pollution abatement, and habitat structure. Terrestrial insects are an important component of juvenile salmonid diets, especially for Chinook. This strongly suggests that riparian and/or upland vegetation may play an important role in the feeding ecology of juvenile Chinook salmon in Puget Sound.
Protect and Restore Shallow Water Habitat
Alteration and degradation of shallow marine nearshore areas has involved extensive armoring, filling, construction of overwater structures, and other modifications of natural hydrological and geological processes along the shores of Puget Sound. These shallow areas serve as important corridors for migration, refuge, prey production, and feeding by juvenile salmonids. Due to the extensive modification and degradation of river mouth estuaries, marine shoreline areas may have become increasingly important for young salmon as they make the transition from freshwater to a life at sea.
Protect and Restore the Marine Nearshore Habitat Complex
Juvenile and adult salmon use a diverse array of habitat types that serve different functions in space and time. Therefore, it is the complex of habitats, composed of varying substrate types, vegetation types, tidal stages, and other physical, chemical, and biological factors that support salmon in the nearshore. Ecologically, there are linkages between salmon and both terrestrial and aquatic environments, which suggests that a more holistic approach must be taken to protect and restore salmon and their habitats. Protecting and restoring the natural processes that form and maintain habitats is the key to success. The natural processes that form and maintain habitat in the nearshore serve as the foundation of the structure and functions that support salmon. Disruption of sediment and prey inputs, changes in hydrology and other processes results in a chain reaction, ultimately leading to lost or dysfunctional habitat for salmon. Impediments to natural processes need to be prevented or removed to allow for conditions conducive to salmon production.

Juvenile Salmonid Species Composition, Timing, Distribution, and Diet in Nearshore Marine Waters of Central Puget Sound in 2001-2002 – King County 5-2
Require 100% Marking and Accurate Measurements of All Hatchery Fish
The ability to distinguish hatchery and wild fish, determine relative proportions, or monitor individual stocks, depends upon accurate marking and measuring of hatchery releases. Research results are less accurate and fisheries management is much less precise or valuable given the inconsistent marking rates of hatchery fish throughout Puget Sound.
Update the Washington Administrative Code’s saltwater work closure periods to reflect the timing of ESA listed Chinook salmon.
The saltwater closure period (construction work window) in the Washington Administrative Code (WAC) is currently out of date. The juvenile salmonid closure period corresponds with the timing of chum and pink salmon, and not ESA listed Chinook. While WDFW area habitat biologists have the ability to modify the work closure timing for any one project to reflect best available science, it would be prudent to correct the WAC with more accurate salmonid timing data.
Support Collaborative/Cooperative Research and Management Efforts.
Although this study has advanced our knowledge regarding juvenile salmonids in the central Puget Sound basin, numerous data gaps remain, many of which require large scale analyses. The fragmented manner in which some management actions, research, and planning occur has resulted in disconnected and often inadequate results for the level of information and actions necessary for larger-scale issues. It is abundantly clear that Chinook recovery is not the issue of a single watershed and that the common thread between all Puget Sound watersheds is found in the marine environment.
5.2. FUTURE STUDIES/ADDITIONAL ANALYSES Numerous data gaps in our understanding of salmon in the nearshore remain. While this research enhances our understanding of juvenile salmonids in central Puget Sound, additional studies are needed for scientifically-based management decisions about protection, restoration, and enhancement of nearshore habitats and salmon. Larger scale (both temporal and spatial) sampling is needed to understand onshore, offshore, and cross-Sound distribution patters. Multiple sampling methods will be required to capture patterns in horizontal, vertical, tidal, and temporal (day and night) distributions, as well as various habitat types. In addition, more information is needed about the physical forces (e.g. winds and currents) and shoreline geomorphology that may play a role in the timing, distribution, and abundance of salmon in the nearshore. Marking fish is critically important for tracking specific stocks and determining population dynamics. More information about marine nearshore carrying capacity, competitive interactions, and prey ecology is also necessary if the risk of extinction of salmonids within the Puget Sound ESU is to be eliminated. In light of these needs, the following recommendations for future study and additional analyses are made.
Evaluate hatchery practices to reduce potential competitive interactions with wild fish.
The carrying capacity of Puget Sound may or may not be able to support the number of smolts being produced by Puget Sound hatcheries along with wild production. The wild juvenile Chinook that enter the Puget Sound are vastly outnumbered by hatchery Chinook and other hatchery salmonids. Considering the similar timing, distribution, and feeding patterns, it is likely that negative competitive interactions might occur, especially in areas where food is limited.

Juvenile Salmonid Species Composition, Timing, Distribution, and Diet in Nearshore Marine Waters of Central Puget Sound in 2001-2002 – King County 5-3
Conduct a combined prey availability/prey selectivity study for juvenile Chinook salmon in the shallow nearshore areas.
While this study was able to quantify Chinook diets, no attempt was made to quantify prey availability and little is known about prey habitats. It is possible that Chinook are opportunistic feeders, eating whatever is the most abundant/available.
Conduct a study to determine the source and the ecology of terrestrial insects and other prey found in the Chinook diets.
The source of insects is likely from MRV, but production levels, role of proximity, and importance of vegetation composition/structure are all unknown at present. Large wood and beach wrack deposits on beaches may also play an important role in prey production. Currently little is known about the ecology of terrestrial prey items or marine prey organisms.
Identify and quantify the factors that influence distribution patterns of juvenile salmon and their prey.
Little is known about what drives juvenile salmon to be shoreline oriented, and/or distributed broadly across/throughout Puget Sound. Some indicators suggest physical forces (e.g., surface or tidal currents, wind) play a role, but these are poorly studied. Biological factors (e.g., volitional/innate migration, prey abundance/availability, predator avoidance) may also play a role, or it may be a combination of multiple factors. Additionally, offshore and day/night sampling are also needed to learn more about diel behaviors and use of various depths by different size classes of salmon.
Conduct a study of subyearling Chinook smolts movement in the Duwamish estuary.
As noted previously, it appears that Chinook migration appears to be both active and passive. A detailed migration study would allow a look at how long juvenile Chinook spend in different parts of the Duwamish estuary and open shorelines. It could also help elucidate how, when and where juvenile Chinook migrate across the open waters of Puget Sound in order to get to Vashon and Maury Islands, or move offshore at larger sizes. This would increase the understanding of what processes drive Chinook migration.
Conduct studies on marine forage fishes to learn more about their biology and population dynamics.
Although limited surveys of spawning areas have been conducted, little is known about the biology, population dynamics, and stock status of surf smelt and sand lance. These species are critical components of marine nearshore ecosystems and serve as important prey for salmonids (at all life stages) and other marine organisms.
Undertake a multivariate analysis of the diet data along with environmental data to further elucidate site-related diet differences.
Few consistent differences were seen in Chinook prey between the site groups. One exception was that the fish from a northern group of sites consumed fewer polychaete worms and more terrestrial insects than at the other two site groups. The reasons for this are unknown, but a multivariate analysis of the diet data along with a better understanding of the distribution of prey taxa could further elucidate these and other site-related differences.

Juvenile Salmonid Species Composition, Timing, Distribution, and Diet in Nearshore Marine Waters of Central Puget Sound in 2001-2002 – King County 5-4
Run additional analyses on diet data.
While data qualitatively suggests that the diets of hatchery and wild Chinook overlap, it would be more powerful to quantify the amount of overlap of specific prey groups.
Explore the relationship between adipose fin clipping of juvenile salmonids and survival.
Almost 60% of the CWT Chinook examined in this study were not adipose fin clipped, even though the percentage of nonclipped CWT Chinook released throughout Puget Sound is approximately 40% (RMIS database). (Note: This pattern may be influenced by bad clipping rates, which reinforces the management recommendation to make a greater effort to clip all hatchery Chinook and coho).
Conduct long-term and larger scale ecological monitoring of juvenile salmon throughout Puget Sound.
The types of studies being conducted in the Skagit system (Beamer et al. 2004) serve as an example of what is needed throughout Puget Sound. Using multiple gear types in various habitats and environmental conditions is critical for understanding the relationships between habitat use, marine growth, year class strength, and marine carrying capacity (Orsi et al. 2000).
Conduct directed study of juvenile coho salmon.
The ecology of planktivorous salmon such as coho in Puget Sound is poorly known. Plankton biology, productivity, oceanography, and other environmental conditions need to be better studied and integrated in order to understand these fish.
Develop standard methods for recording and monitoring environmental data
Environmental variables (e.g., substrate, vegetation, water chemistry/quality beach slope) likely play important roles in salmon distribution and survival. However, there are currently no standard protocols and procedures for collecting and analyzing these data relative to describing fish-habitat relationships in the nearshore.

Juvenile Salmonid Species Composition, Timing, Distribution, and Diet in Nearshore Waters of Central Puget Sound in 2001-2002 – King County 6-1
SECTION 6: REFERENCES Aitkin, J.K., 1998. The importance of estuarine habitats to anadromous salmonids of the Pacific
Northwest: A literature review. Report prepared for the U.S. Department of the Interior, Fish and Wildlife Service, Lacey, WA.
Anderson, E.P., and M. Galbraith 1984. Stomach contents of juvenile Chinook salmon from the Campbell River estuary March-November 1982. Contract report in partial fulfillment of DSS file number 03SB. FP957-2-7474. 30 pp.
Anderson, M. 1993. The living landscape. Volume 2: Pacific Salmon and Federal Lands. The Wilderness Society, Bolle Center for Forest Ecosystem Management, Washington D.C.
Argue, A.W., B. Hillaby, and C.D. Shepard. 1986. Distribution, timing, change in size, and stomach contents of juvenile Chinook and coho salmon caught in Cowichan estuary and bay, 1973, 1975, 1976. Can. Tech. Rep. Fish. Aquat. Sci. 1431. 168 pp.
Bax, N.J. 1981. Seasonal and annual variations in the movement of juvenile chum salmon through Hood Canal, Washington. In: Salmon and Trout Migratory Behavior Symposium Proceedings, E.L. Brannon and E.O. Salo, editors.
Bax, N.J. 1983. Early marine mortality of marked juvenile chum salmon (Oncorhynchus keta) released into hood canal, Puget Sound, Washington, in 1980. Canadian Journal of Fisheries and Aquatic Science. 40: 426-435.
Beamish, R.J., M. Folkes, R. Sweeting, and C. Mahnken. 1998. Chinook and chum salmon in Puget Sound in 1997. In: Puget Sound Research Conference ’98. Puget Sound Action Team, Olympia, Washington.
Bollens, S.M., J.R. Cordell, M. Butler, and B.W. Frost. In preparation. Diet, feeding selectivity, and potential resource competition of juvenile Pacific Salmon (Onchorhynchus spp.) in a temperate marine fjord. To be submitted to Can. J. Fish. Aquat. Sci.
Bottom, D.L., J.A. Lichatowich, C.A. Frissell. 1998. Variability of Pacific northwest marine ecosystems and relation to salmon production. In: Change in Pacific Northwest Coastal Ecosystems. G.R. McMurray and R.J. Bailey (eds). Proceedings of the Pacific Northwest Coastal Ecosystems Regional Study Workshop, August 13-14, 1996, Troutdale, Oregon. NOAA Coastal Ocean Program Decision Analysis Series No. 11. NOAA Coastal Ocean Office, Silver Spring, MD. pp. 181-238.
Bousfield, E.L., and E.A. Hendrycks. 1997. The amphipod superfamily Eusiroidea in the North American Pacific region. II. Family Calliopiidae. Systematics and distributional ecology. Amphipacifica II(3): 3-66.
Bowden, J. and C.G. Johnson. 1976. Migrating and other terrestrial insects at sea. Chapter 5 in Cheng, (ed.). Marine Insects. North Holland Publ. Co., Amsterdam, 581 pp.
Brodeur, R.D. 1989. Neustonic feeding by juvenile salmonids in coastal waters of the Northeast Pacific. Can. J. Zool. 67: 1995-2007.
Brodeur, R.D. and W.G. Pearcy. 1990. Trophic relations of juvenile Pacific salmon off the Oregon and Washington coast. Fish Bull. 88(4): 617-636
Brodeur, R.D., R.C. Francis, and W.G. Pearcy. 1992. Food consumption of juvenile coho (Oncorhynchus kisutch) and Chinook salmon (O. tshawytscha) on the continental shelf of Washington and Oregon. Can. J. Fish. Aquat. Sci. 49:1670-1685.

Juvenile Salmonid Species Composition, Timing, Distribution, and Diet in Nearshore Marine Waters of Central Puget Sound in 2001-2002 – King County
6-2
Burns, R. 985. The shape and form of Puget Sound. Puget Sound Books. Washington Sea Grant Publication. University of Washington Press. 100 pp.
Caceres, C.E., and D.A. Soluk. 2002. Blowing in the wind: a field test of overland dispersal and colonization by aquatic invertebrates. Oecologia 131: 402-408.
Cheng, L., and M.C. Birch. 1978. Insect flotsam: an unstudied marine resource. Ecol. Entomol. 3: 87-97.
Damkaer, D.M. 1964. Vertical distribution of Copepoda in Dabob Bay, December 1960. M.S. Thesis, University of Washington, Seattle, WA. 84 pp.
Dawley, E.M., C.W. Sims, R.D. Ledgerwood, D.R. Miller, and J.G. Williams. 1981. A study to define the migrational characteristics of Chinook and coho salmon in the Columbia River estuary and associated marine waters. Final Repp. Northwest and Alaska Fish. Cent., National Marine Fisheries Service, NOAA, 68 pp.
Dawley, E.M., R.D. Ledgerwood, T.H. Blahm, C.W. Sims, J.T. Durkin, R.A. Kirn, A.E. Rankis, G.E. Monan, and F.J. Ossiander. 1986. Migrational characteristics, biological observations, and relative survival of juvenile salmonids entering the Columbia River estuary, 1966-1983. Res. Rep., U.S. Dep. Energy, Bonneville Power Adm., Div. Fish Wildl., Portland, OR. 256 pp.
Dempster, R.P. 1938. The seasonal distribution of plankton at the entrance to Hood Canal. M.S. Thesis, University of Washington, Seattle, WA.
Dethier, M.N. 1990. A Marine and Estuarine Habitat Classification System for Washington State. Washington Natural Heritage Program, Dept. Natural Resources. 56 pp. Olympia, Wash.
DeVries, P. 2002. PIT Tagging of Juvenile Salmon Smolts in the Lake Washington Basin: Second Year (2001) Pilot Study Results. Prepared for U.S. Army Corps of Engineers, Seattle District.
DeVries, P. 2003. PIT Tagging of Juvenile Salmon Smolts in the Lake Washington Basin: Second Year (2002) Pilot Study Results. Prepared for U.S. Army Corps of Engineers, Seattle District.
Dumbauld, B.R. 1985. The distributional ecology of zooplankton in East Passage and the Main Basin of Puget Sound, Washington. M.S. Thesis, University of Washington, Seattle, WA. 211 pp.
Duffy, E.J. 2003. Early marine distribution and trophic interactions of juvenile salmon in Puget Sound. Masters Thesis. University of Washington, Seattle, WA.
Ebbesmeyer, C.C., J.M. Cox, C.A. Coomes, J.M. Helseth, L.R. Hinchey, G.A. Cannon, and C.A. Barnes. 1984. Synthesis of current measurements in Puget Sound, Washington, Volume 3. Circulation in Puget Sound: an interpretation based on historical records of currents. NOAA Technical Memorandum NOW OMS 5. 99pp.
Emmett, R.L., S.A. Hinton, S.L. Stone, and M.E. Monaco. 1991. Distribution and abundance of fishes and invertebrates in West Coast estuaries, Vol. II: Species life history summaries. ELMR Report No. 8. Strategic Environmental Assessments Division, National Ocean Service, NOAA, Rockville, MD. 329pp.
Fisher, J.P., and W.G. Pearcy. 1989. Distribution and residence times of juvenile fall and spring Chinook salmon in Coos Bay, Oregon. Fishery Bulletin, 88:51-58.
Flagg, T.A., B.A. Berejikian, J.E. Colt, W.W. Dickhoff, L.W. Harrell, D.J. Maynard, C.E. Nash, M.S. Strom, R.N. Iwamotom, and C.V.W. Mahnken. 2002. Ecological and behavioral impacts of artificial production strategies on the abundance of wild salmon populations. U.S. Dept. of Commerce., NOAA Tech. Memo. NMFS-NWFSC-41, 92 pp.

Juvenile Salmonid Species Composition, Timing, Distribution, and Diet in Nearshore Marine Waters of Central Puget Sound in 2001-2002 – King County
6-3
Fong, P.P. 1993. Lunar control of epitokal swarming in the polychaete Platynereis bicanaliculata (Baird) from central California. Bull. Mar. Sci. 52(3): 911-924
Fresh, K.L., R.D. Cardwell, and R.R. Koons. 1981. Food habitats of Pacific Salmon, baitfish, and their potential competitors and predators in the marine waters of Washington, August 1978 to September 1979. State of Washington, Department of Fisheries, Progress Report No. 145.
Haggarty, D.R. 2001. An evaluation of fish habitat in Burrad Inlet, British Columbia. M.S. Thesis, University of British Columbia, 124 pp.
Haring, D. 2002. Salmonid habitat limiting factors analysis-Snohomish River. Watershed Water Resource Inventory Area 7 Final Report. Prepared by the Washington State Conservation Commission.
Healey, M.C. 1980a. Utilization of the Nanaimo River estuary by juvenile Chinook salmon, Oncorhyncus tshawytscha. Fishery Bulletin 77:653-668.
Healey, M.C. 1980b. The ecology of juvenile salmon in Georgia Strait, British Columbia, pp. 203-229 in W.J. McNeil and D.C. Himsworth (eds.). Salmonid ecosystems of the North Pacific. Oregon State University Press, Corvallis.
Healey, M.C. 1982a. The distribution and residency of juvenile Pacific salmon in the Strait of Georgia, British Columbia, in relation to foraging success.
Healy, M.C. 1982b. Juvenile Pacific salmon in estuaries: the life support system. In: Estuarine Comparisons (V.S. Kennedy, ed), pp. 315-341. Academic Press, NY.
Healey, M.C. 1991. Life history of Chinook salmon, pp. 313-393 in C. Groot and L. Margolis (eds.), Pacific Salmon Life Histories. University of British Columbia Press, Vancouver.
Hebard, J.F. 1956. The seasonal variation of zooplankton in Puget Sound. M.S. Thesis, University of Washington, Seattle, WA. 64 pp.
Hendrycks, E.A., and E.L. Bousfield. 2001. The amphipod genus Allorchestes in the North Pacific region: systematics and distributional ecology. Amphipacifica 3(2): 3-38.
Hyslop, E. J. 1980. Stomach contents analysis: a review of methods and their application. J. Fish. Biol. 17: 411-429.
Jauqet, J.M. 2002. Coastal cutthroat trout (Onchorynchus clarki clarki) diet in south Puget Sound, Washington 1999-2002. MS Thesis, The Evergreen State College. 79 pp.
Johnston, J.M. 1982. Life histories of anadromous cutthroat with emphasis on migratory behavior. In E.L. Brannon and E.O. Salo, eds. Salmon and trout migratory behavior symposium. University of Washington Press, pp. 123-127.
Kerwin, J. 2001. Salmon and steelhead habitat limiting factors report for the Cedar-Sammamish Basin. Watershed Resource Inventory Area 8 Final Report. Prepared by the Washington State Conservation Commission.
Levings, C.D., C.D. McAllister, and B.D. Chang. 1986. Differential use of the Campbell River estuary, British Columbia, by wild and hatchery-reared juvenile Chinook salmon (Oncorhynchus tshawytscha). Canadian Journal of Fisheries and Aquatic Science, 43:1386-1397.
Lichatowich, J. 1997. Evaluating salmon management institutions: The importance of performance measures temporal scales, and production cycles. In: D.J. Stouder, P.A. Bisson, R.J. Naiman (eds.). Pacific Salmon and Their Ecosystems; status and future options. Chapman and Hall, NY, NY, pp. 69-91.

Juvenile Salmonid Species Composition, Timing, Distribution, and Diet in Nearshore Marine Waters of Central Puget Sound in 2001-2002 – King County
6-4
Locke, A. and S. Corey. 1986. Terrestrial and freshwater invertebrates in the neuston of the Bay of Fundy, Canada. Can. J. Zool. 64: 1535-1541.
Martin Environmental and Shreffler Environmental. 2002. Pilot survey of juvenile salmonids in the Snohomish and Snoqualmie Rivers and nearshore waters of Vashon Island, Spring 2002. Data report and summary of findings. Development of Salmonid conservation strategies. Report prepared for King County Water & Land Resources Division.
Meyer, J.H., T.A. Pearce, and R.S. Boomer. 1981. An examination of the food habits of juvenile chum and Chinook salmon in Hylebos waterway. Report prepared for U.S. Dept. of the Interior, Fisheries Assistance Office, U.S. Fish and Wildlife Service, Olympia, WA.
Miller, B.A., and S. Sadro. 2003. Residence time and seasonal movements of juvenile coho salmon in the ecotone and lower estuary of Winchester Creek, South Slough, Oregon. Transactions of the American Fisheries Society 132:546-559.
Minoru, S., M. Omori, and K. Taniguchi. 2003. Predator-prey systems of drifting seaweed communities off the Tohoku coast, northern Japan, as determined by feeding habit analysis of phytal animals. Fish. Sci. 69(2): 260-268.
Moser, M.L., A.F. Olson, and T.P. Quinn. Riverine and estuarine migratory behavior of coho salmon (Oncorhynchus kisutch) smolts. Canadian Journal of Fisheries and Aquatic Science, Vol. 48, 1670-1678.
Moulton, L.L. 1997. Early marine residence, growth, and feeding by juvenile salmon in northern Cook Inlet, Alaska.. Alaska Fish. Res. Bull. 4(2): 154-177.
Myers, K.W.W. 1980. An investigation of the utilization of four study areas in Yaquina Bay, Oregon, by hatchery and wild juvenile salmonids. M.S. Thesis, Oregon State University, Corvallis, 234 pp.
National Research Council 1996. Upstream: Salmon and Society in the Pacific Northwest. National Academy Press, Washington, DC.
Nehlsen, W., J.E. Williams, and J.A. Lichatowich. 1991. Pacific salmon at the crossroads: stocks at risk from California, Oregon, Idaho and Washington. Fisheries 16: 4-21.
Orsi, J.A., and H.W. Jaenicke. 1996. Marine distribution and origin of prerecruit Chinook salmon, Oncorhynchus tshawytscha, in southeastern Alaska. Fishery Bulletin 94:482-497.
Orsi, J.A., M.V. Sturdevant, J.M. Murphy, D.G. Mortensen, and B.L. Wing. 2000. Seasonal habitat use and early marine ecology of juvenile Pacific salmon in southeastern Alaska. Fish Comm. Bull. No.2: 111-122.
Pearce, T.A., J.H. Meyer, and R.S. Boomer. 1982. Distribution and food habits of juvenile salmon in the Nisqually estuary, Washington, 1979-1980. . Report prepared for U.S. Dept. of the Interior, Fisheries Assistance Office, U.S. Fish and Wildlife Service, Olympia, WA.
Pearcy, W.G. and J.P. Fisher. 1987. Migrations of coho salmon, Oncorhynchus kisutch, during their first summer in the ocean. Fishery Bulletin: Vol. 86:2.
PSNERP. 2003. Puget Sound Nearshore Ecosystem Restoration Program. http://www.prism.washington.edu/lc/PSNERP/
Rondorf D.W.; G.A. Gray, and R.B. Fairley. 1990. Feeding ecology of subyearling Chinook salmon in riverine and reservoir habitats of the Columbia River. Trans. Am. Fish. Soc. 119(1): 16-24
Russel, R.W., and J.W. Wilson. 2001. Spatial dispersion of aerial plankton over east-central Florida: aeolian transport and coastline concentrations. Int. J. Rem. Sens. 22: 2071-2082.

Juvenile Salmonid Species Composition, Timing, Distribution, and Diet in Nearshore Marine Waters of Central Puget Sound in 2001-2002 – King County
6-5
Salo, E.O., G.J. Paulik, D.M. Miller, W. Lenarz, G. Stauffer, C.D. Becker, J. Wetherall, R.C. Francis, and D.H. McKenzie. 1967. Ecology of Elliott and Everett Bays, pp. 20-25. In: F.B. Taub and J.R. Matches (eds.), 1966 Research in Fisheries. University of Washington, College of Fisheries, Seattle, WA.
Sandercock, F.K. 1991. Life history of coho salmon. pp. 397-445 in C. Groot and L. Margolis (eds.), Pacific Salmon Life Histories. University of British Columbia Press, Vancouver.
Simenstad, C.A., K.L. Fresh, and E.O. Salo. 1982. The role of Puget Sound and Washington coastal estuaries in the life history of Pacific salmon: an unappreciated function. Pages 343-364 In: V.S. Kennedy, editor. Estuarine comparisons. Academic Press, New York.
Simenstad, C.A., C.T. Tanner, R.M. Thom, and L.L. Conquest. 1991. Estuarine Habitat Assessment Protocol. Report to U.S. Environmental Protection Agency, Region 10, Seattle, Washington. EPA 910/9/91/037. 201 pp.
Sobocinski, K.L. 2003. The impact of shoreline armoring on supratidal beach fauna of central Puget Sound. MS Thesis, University of Washington School of Aquatic and Fishery Sciences. 83 pp.
Spence, B.C., G.A. Lomnicky, R.M. Hughes, and R.P. Novitzki. 1996. An ecosystem approach to salmonid conservation. TR-4501-96-6057. ManTech (Management Technology) Environmental research Services Corp., Corvallis, Oregon.
Strickland, R.M. 1983. The fertile fjord. University of Washington Press, Seattle, Washington.
Stober, Q.J. and K.K. Chew. 1984. Renton sewage treatment plant project, Seahurst Baseline Study: Circulation in South Central Puget Sound Basin and Seahurst Bay. Volume 3. Prepared by University of Washington, Seattle, WA.
Taylor Associates, Inc. 2002. King County bull trout program: 2001 bull trout surveys. Freshwater and marine nearshore. Final Report. Prepared for King County Department of Natural Resources and Parks.
Thom, R.M. 1987. The biological importance of Pacific Northwest estuaries. Northwest Environmental Journal 3(1):21-42.
WDNR. 1999. Shorezone Inventory. Washington Department of Natural Resources, Olympia.
Williams, G. D., R. M. Thom, J. E. Starkes, J. S. Brennan, J. P. Houghton, D. Woodruff, P. L. Striplin, M. Miller, M. Pedersen, A. Skillman, R. Kropp, A. Borde, C. Freeland, K. McArthur, V. Fagerness, S. Blanton, and L. Blackmore. 2001. Reconnaissance Assessment of the State of the Nearshore Ecosystem: Eastern Shore of Central Puget Sound, Including Vashon and Maury Islands (WRIA’s 8 and 9). J. S. Brennan, Editor. Report prepared for King County Department of Natural Resources, Seattle, WA.
Wissmar, R.C. and C.A. Simenstad. 1998. Variability of riverine and estuarine ecosystem productivity for supporting Pacific salmon. Change in Pacific Northwest Coastal Ecosystems: A NOAA Decision Analysis Series Report. http://www.pncers.org/pdfs/cpnce Ch. 6.
Woodin, S.A. 1977. Algal 'gardening' behavior by nereid polychaetes: effects on soft-bottom community structure. Mar. Biol. 44(1): 39-42
Yoshimoto, C.M., and J.L. Gressitt. 1960. Trapping air-borne insects on ships in the Pacific. Part 3. Pac. Insects, 2: 239-243.
Zar, J.H. 1984. Biostatistical analysis, Second Edition. Prentice Hall, Inc., New Jersey


APPENDIX 1

Juvenile Salmonid Species Composition, Timing, Distribution, and Diet in Nearshore Marine Waters of Central Puget Sound in 2001-2002 – King County
A1-2
INSECTA AND SPIDERS FROM TERRESTRIAL HABITATS
Hymenoptera, Formicidae (ants) Coleoptera, Staphylinidae (rove beetle)
Diptera, Empididae (dance flies) Diptera, Sciaridae (fungus gnat)
Diptera, Chironomidae (midges) Arachnida, Araneae (spider)

Juvenile Salmonid Species Composition, Timing, Distribution, and Diet in Nearshore Marine Waters of Central Puget Sound in 2001-2002 – King County
A1-3
INSECTA AND SPIDERS FROM TERRESTRIAL HABITATS, CONTINUED
Homoptera, Cicadellidae (leafhopper) Homoptera, Aphididae (aphids)
Psocoptera (bark lice) Lepidoptera, Malacosoma sp. (tent caterpillar moth)

Juvenile Salmonid Species Composition, Timing, Distribution, and Diet in Nearshore Marine Waters of Central Puget Sound in 2001-2002 – King County
A1-4
AMPHIPODA GAMMARIDEA FROM BENTHIC/EPIBENTHIC HABITATS
Allorchestes sp. Anisogammarus pugettensis
Calliopiidae Corophium sp. Corophium sp.
Gammaropsis sp. Photis brevipes

Juvenile Salmonid Species Composition, Timing, Distribution, and Diet in Nearshore Marine Waters of Central Puget Sound in 2001-2002 – King County
A1-5
OTHER TAXA FROM BENTHIC/EPIBENTHIC HABITATS
Cumella vulgaris (cumacean) Gnorimoshpaeroma insulare (isopod)
Idotea sp. (juvenile isopod) Euphilomedes carcharodonta (ostracods)
Platynereis bicanaliculata (polychaete worm) Barnacle exuvia with attached naupliar mass (inset shows close-up of naupiar mass)

Juvenile Salmonid Species Composition, Timing, Distribution, and Diet in Nearshore Marine Waters of Central Puget Sound in 2001-2002 – King County
A1-6
PELAGIC/PLANKTONIC PREY TAXA
Cancer sp. megalopae (crab larvae) Cancer sp. zoae (crab larvae)
Pinnotheridae zoea (crab larva) Fabia subquadrata (commensal crab, swimming form)
Hyperia sp. (hyperiid amphipod) Ammodytes hexpaterus (juvenile sand lance)

APPENDIX 2
Juvenile Salmonid Species Composition, Timing, Distribution, and Diet in Nearshore Marine Waters of Central Puget Sound in 2001-2002 A2-2
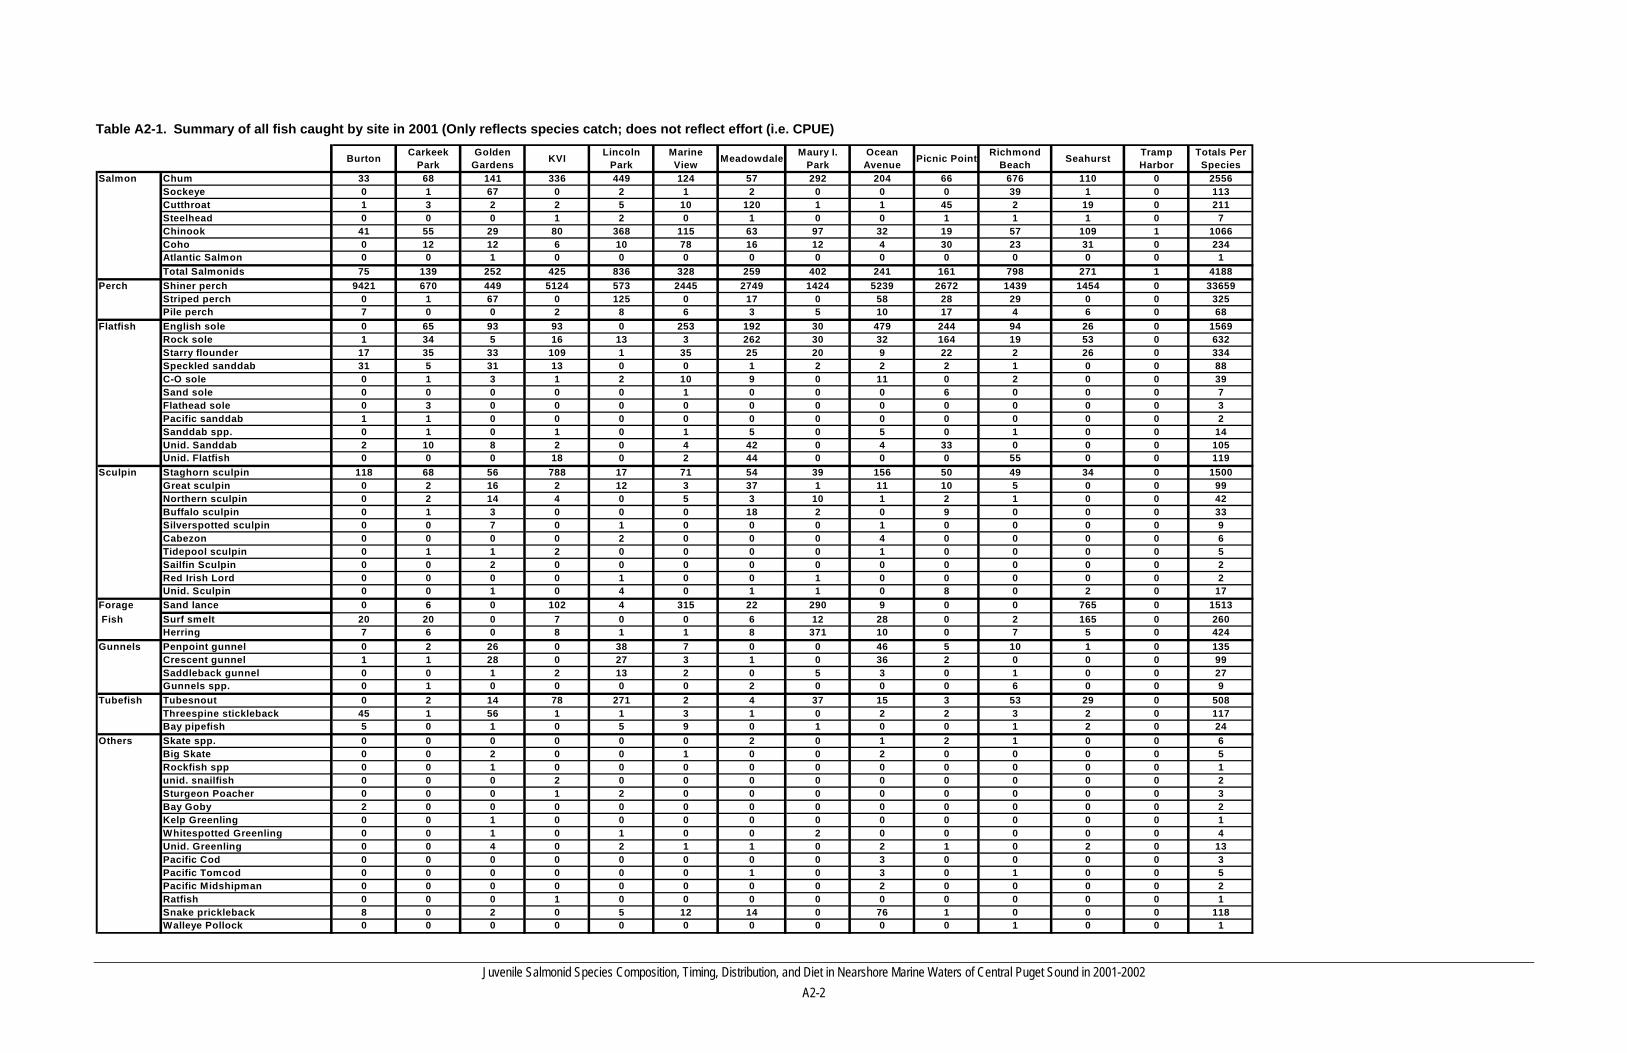
Table A2-1. Summary of all fish caught by site in 2001 (Only reflects species catch; does not reflect effort (i.e. CPUE)
Burton Carkeek Park
Golden Gardens KVI Lincoln
ParkMarine View Meadowdale Maury I.
ParkOcean
Avenue Picnic Point Richmond Beach Seahurst Tramp
HarborTotals Per
SpeciesSalmon Chum 33 68 141 336 449 124 57 292 204 66 676 110 0 2556
Sockeye 0 1 67 0 2 1 2 0 0 0 39 1 0 113Cutthroat 1 3 2 2 5 10 120 1 1 45 2 19 0 211Steelhead 0 0 0 1 2 0 1 0 0 1 1 1 0 7Chinook 41 55 29 80 368 115 63 97 32 19 57 109 1 1066Coho 0 12 12 6 10 78 16 12 4 30 23 31 0 234Atlantic Salmon 0 0 1 0 0 0 0 0 0 0 0 0 0 1Total Salmonids 75 139 252 425 836 328 259 402 241 161 798 271 1 4188
Perch Shiner perch 9421 670 449 5124 573 2445 2749 1424 5239 2672 1439 1454 0 33659Striped perch 0 1 67 0 125 0 17 0 58 28 29 0 0 325Pile perch 7 0 0 2 8 6 3 5 10 17 4 6 0 68
Flatfish English sole 0 65 93 93 0 253 192 30 479 244 94 26 0 1569Rock sole 1 34 5 16 13 3 262 30 32 164 19 53 0 632Starry flounder 17 35 33 109 1 35 25 20 9 22 2 26 0 334Speckled sanddab 31 5 31 13 0 0 1 2 2 2 1 0 0 88C-O sole 0 1 3 1 2 10 9 0 11 0 2 0 0 39Sand sole 0 0 0 0 0 1 0 0 0 6 0 0 0 7Flathead sole 0 3 0 0 0 0 0 0 0 0 0 0 0 3Pacific sanddab 1 1 0 0 0 0 0 0 0 0 0 0 0 2Sanddab spp. 0 1 0 1 0 1 5 0 5 0 1 0 0 14Unid. Sanddab 2 10 8 2 0 4 42 0 4 33 0 0 0 105Unid. Flatfish 0 0 0 18 0 2 44 0 0 0 55 0 0 119
Sculpin Staghorn sculpin 118 68 56 788 17 71 54 39 156 50 49 34 0 1500Great sculpin 0 2 16 2 12 3 37 1 11 10 5 0 0 99Northern sculpin 0 2 14 4 0 5 3 10 1 2 1 0 0 42Buffalo sculpin 0 1 3 0 0 0 18 2 0 9 0 0 0 33Silverspotted sculpin 0 0 7 0 1 0 0 0 1 0 0 0 0 9Cabezon 0 0 0 0 2 0 0 0 4 0 0 0 0 6Tidepool sculpin 0 1 1 2 0 0 0 0 1 0 0 0 0 5Sailfin Sculpin 0 0 2 0 0 0 0 0 0 0 0 0 0 2Red Irish Lord 0 0 0 0 1 0 0 1 0 0 0 0 0 2Unid. Sculpin 0 0 1 0 4 0 1 1 0 8 0 2 0 17
Forage Sand lance 0 6 0 102 4 315 22 290 9 0 0 765 0 1513 Fish Surf smelt 20 20 0 7 0 0 6 12 28 0 2 165 0 260
Herring 7 6 0 8 1 1 8 371 10 0 7 5 0 424Gunnels Penpoint gunnel 0 2 26 0 38 7 0 0 46 5 10 1 0 135
Crescent gunnel 1 1 28 0 27 3 1 0 36 2 0 0 0 99Saddleback gunnel 0 0 1 2 13 2 0 5 3 0 1 0 0 27Gunnels spp. 0 1 0 0 0 0 2 0 0 0 6 0 0 9
Tubefish Tubesnout 0 2 14 78 271 2 4 37 15 3 53 29 0 508Threespine stickleback 45 1 56 1 1 3 1 0 2 2 3 2 0 117Bay pipefish 5 0 1 0 5 9 0 1 0 0 1 2 0 24
Others Skate spp. 0 0 0 0 0 0 2 0 1 2 1 0 0 6Big Skate 0 0 2 0 0 1 0 0 2 0 0 0 0 5Rockfish spp 0 0 1 0 0 0 0 0 0 0 0 0 0 1unid. snailfish 0 0 0 2 0 0 0 0 0 0 0 0 0 2Sturgeon Poacher 0 0 0 1 2 0 0 0 0 0 0 0 0 3Bay Goby 2 0 0 0 0 0 0 0 0 0 0 0 0 2Kelp Greenling 0 0 1 0 0 0 0 0 0 0 0 0 0 1Whitespotted Greenling 0 0 1 0 1 0 0 2 0 0 0 0 0 4Unid. Greenling 0 0 4 0 2 1 1 0 2 1 0 2 0 13Pacific Cod 0 0 0 0 0 0 0 0 3 0 0 0 0 3Pacific Tomcod 0 0 0 0 0 0 1 0 3 0 1 0 0 5Pacific Midshipman 0 0 0 0 0 0 0 0 2 0 0 0 0 2Ratfish 0 0 0 1 0 0 0 0 0 0 0 0 0 1Snake prickleback 8 0 2 0 5 12 14 0 76 1 0 0 0 118Walleye Pollock 0 0 0 0 0 0 0 0 0 0 1 0 0 1

Juvenile Salmonid Species Composition, Timing, Distribution, and Diet in Nearshore Marine Waters of Central Puget Sound in 2001-2002 A2-3
Table A2-2. Summary of all fish caught by site in 2002 (Only reflects species catch; does not reflect effort (i.e. CPUE) (continued on next page)
Burton Carkeek Park CMP DNR83 Deer Creek Edmonds EEG1 EEG2 Golden
Gardens KLP1 KLP2 KVI Lincoln Park MD1 MD2
Salmon Chum 15 13 5 398 92 210 2347 19 175 6688 398 152 538 15 15Sockeye 0 0 0 0 0 0 0 0 0 0 0 0 0 0 0Cutthroat 2 6 14 2 0 0 0 2 8 5 1 1 9 4 1Steelhead 0 1 0 0 0 0 0 0 0 1 0 0 0 0 0Chinook 2 48 15 153 1 1 1 4 86 340 4 98 245 1 0Coho 1 23 2 0 22 0 0 167 30 228 2 2 61 0 1Char 0 0 0 0 0 0 0 0 1 0 0 0 0 0 0Pink Salmon 0 0 0 0 1 65 0 0 0 0 0 0 0 0 0Total Salmonids 20 91 36 553 116 276 2348 192 300 7262 405 253 853 20 17
Perch Shiner perch 848 1466 476 208 509 2 818 1726 1801 20 119 1600 1677 608 1448Striped perch 0 15 0 0 0 0 0 0 58 38 0 7 27 0 0Pile perch 8 28 0 0 2 0 0 0 12 0 1 1 17 0 0
Flatfish Butter Sole 0 0 0 0 0 0 0 0 0 0 0 0 0 0 2English sole 0 259 37 0 1 19 0 1 125 0 0 69 0 0 0Rock sole 0 30 6 0 1 0 0 1 8 0 0 14 16 0 0Starry flounder 3 37 14 4 1 6 4 6 9 1 0 420 3 2 92Speckled sanddab 3 18 0 0 0 0 0 9 2 0 0 3 0 6 20C-O sole 0 0 0 0 0 0 0 0 2 0 0 0 0 0 0Sand sole 0 20 0 0 0 0 0 0 12 0 0 1 0 0 0Pacific sanddab 4 6 0 0 0 0 0 1 0 0 0 0 0 0 0Sanddab spp. 0 0 0 0 0 0 0 0 0 0 0 0 0 0 0Unid. Flatfish 0 2 0 16 0 0 8 2 4 36 0 0 0 5 2
Sculpin Staghorn sculpin 10 193 14 291 0 0 1 31 41 1 0 391 17 316 35Great sculpin 0 1 0 0 0 1 0 0 7 0 1 10 3 0 0Northern sculpin 0 0 0 0 0 0 0 0 4 0 0 1 0 0 0Buffalo sculpin 0 1 1 0 0 1 1 3 10 6 0 29 2 0 0Silverspotted sculpin 0 0 0 0 0 0 0 0 3 0 0 0 0 0 0Cabezon 0 0 0 0 0 0 0 0 3 0 0 0 0 0 0Tidepool sculpin 0 0 0 0 0 0 0 15 5 0 0 0 2 0 0Padded Sculpin 0 15 1 0 0 0 0 0 7 0 0 73 4 0 0Sailfin Sculpin 0 0 0 0 0 0 0 0 0 0 0 1 0 0 0Unid. Sculpin 0 20 2 0 0 1 8 11 6 3 0 25 7 0 0
Forage Sand lance 0 0 0 1 0 81 0 0 3 27 0 23 571 4 19 Fish Surf smelt 5 13 2 0 0 0 0 0 5 2 0 0 66 1 0
Herring 0 2 0 0 0 0 0 0 8 297 0 1 4 0 0Gunnels Penpoint gunnel 0 7 5 0 1 0 0 2 16 2 0 6 3 0 1
Crescent gunnel 0 5 0 0 0 1 0 4 14 1 5 14 3 0 0Saddleback gunnel 0 3 8 0 2 0 0 2 1 2 7 29 33 0 0
Tubefish Tubesnout 0 66 65 0 0 0 192 4 12 0 2 7 9 0 0Threespine stickleback 1 2 0 1 0 0 1 1 4 4 0 0 0 1 38Bay pipefish 0 0 2 1 0 0 8 25 1 0 0 2 3 0 1
Other Big Skate 0 4 0 0 0 0 0 0 0 0 0 1 0 0 0Brown Rockfish 0 0 0 0 0 0 0 0 1 0 0 1 0 0 0Rockfish spp 0 0 0 0 0 0 0 0 0 0 0 0 1 0 0Sturgeon Poacher 0 0 3 0 0 0 1 0 0 0 0 17 0 0 0Whitespotted Greenling 0 1 0 0 0 0 0 0 3 0 1 0 2 0 0Unid. Greenling 0 0 1 0 0 0 0 0 2 0 0 1 0 0 0Pacific Tomcod 0 0 0 0 0 0 0 0 1 0 0 1 2 0 0Pacific Midshipman 0 0 0 0 0 0 0 16 0 0 0 0 0 0 7Arrow Goby 34 0 0 0 0 0 0 11 0 0 0 0 0 40 12Ratfish 0 0 0 0 0 0 0 0 0 0 0 0 2 0 0Northern Spearnose 0 0 1 0 0 0 0 0 0 0 0 0 0 0 0Spiney Lumpsucker 0 0 0 0 0 0 0 1 0 0 0 0 0 0 0Snake prickleback 2 0 0 0 0 0 0 7 1 0 0 3 0 0 0
Continued horizontally next page

Juvenile Salmonid Species Composition, Timing, Distribution, and Diet in Nearshore Marine Waters of Central Puget Sound in 2001-2002 A2-4
Table A2-2 continued. Summary of all fish caught by site in 2002 (Only reflects species catch; does not reflect effort (i.e. CPUE)
Maury I.Park Picnic Point PTR Richmond
Beach Seahurst SGB1 SGB2 SGF1 SGF2 Totals PerSpecies
Salmon Chum 649 1917 0 2413 67 100 561 5940 404 24740Sockeye 0 0 0 4 0 0 0 0 0 4Cutthroat 1 9 4 6 13 1 0 0 0 133Steelhead 0 0 0 0 0 0 0 0 0 2Chinook 86 15 37 124 35 1 17 24 3 1354Coho 34 198 1 102 9 4 18 4 0 1053Char 0 0 0 0 0 0 0 0 0 1Pink Salmon 63 636 0 775 0 0 0 0 0 2518Total Salmonids 833 2775 42 3424 124 106 596 5968 407 29805
Perch Shiner perch 1345 4161 1280 2073 4148 2739 363 225 9296 38965Striped perch 1 4 1 20 1 7 0 0 0 179Pile perch 4 1 3 19 0 92 0 0 0 188
Flatfish Butter Sole 0 0 0 0 0 0 0 0 0 2English sole 175 25 11 214 176 0 0 5 5 1131Rock sole 11 13 10 19 75 0 0 0 0 213Starry flounder 55 8 25 28 39 11 0 20 0 794Speckled sanddab 0 3 0 52 2 35 0 0 5 161C-O sole 0 0 0 6 0 0 1 0 0 9Sand sole 11 0 0 4 2 0 0 0 0 50Pacific sanddab 0 0 0 0 0 0 0 0 4 15Sanddab spp. 0 2 0 0 0 0 0 0 0 2Unid. Flatfish 4 0 0 2 8 1 1 14 4 109
Sculpin Staghorn sculpin 46 8 19 38 152 9 5 4 5 1633Great sculpin 1 0 3 14 0 0 0 0 0 43Northern sculpin 1 0 0 0 4 0 0 0 0 10Buffalo sculpin 28 6 5 4 2 0 3 0 0 109Silverspotted sculpin 0 0 0 3 0 0 0 0 0 6Cabezon 0 0 0 0 0 0 0 0 0 3Tidepool sculpin 0 0 0 0 0 0 0 0 0 22Padded Sculpin 28 0 6 1 11 0 0 0 0 146Sailfin Sculpin 0 0 1 0 0 0 0 0 0 2Unid. Sculpin 5 0 10 26 31 1 3 5 0 166
Forage Sand lance 357 21 0 36 9 0 0 0 4 1176 Fish Surf smelt 1 10 0 1 3 0 1 0 0 110
Herring 1 0 0 13 11 5 1 0 0 343Gunnels Penpoint gunnel 0 0 0 42 1 0 2 0 2 90
Crescent gunnel 3 0 0 8 0 0 10 1 10 80Saddleback gunnel 19 0 6 3 6 0 46 1 10 178
Tubefish Tubesnout 5 8 5 135 16 0 0 14 12 553Threespine stickleback 0 3 0 3 4 3 0 0 1 67Bay pipefish 0 2 0 0 5 1 0 0 5 56
Other Big Skate 0 0 0 3 1 0 0 0 0 9Brown Rockfish 0 0 0 0 0 0 0 0 0 2Rockfish spp 1 0 0 0 0 0 0 0 0 2Sturgeon Poacher 1 0 0 0 2 0 3 0 6 33Whitespotted Greenling 0 1 1 4 0 0 0 0 0 14Unid. Greenling 0 0 0 1 0 0 0 0 0 5Pacific Tomcod 0 0 0 3 0 0 0 0 0 7Pacific Midshipman 0 0 0 0 0 3 0 0 0 26Arrow Goby 0 0 0 0 0 10 0 0 0 107Ratfish 10 0 1 0 0 0 0 0 0 13Northern Spearnose 0 0 0 0 0 0 0 0 0 1Spiney Lumpsucker 0 0 0 0 0 0 0 0 0 1Snake prickleback 1 0 0 0 4 6 0 0 0 24

Juvenile Salmonid Composition, Timing, Distribution, and Diet in the Marine Nearshore Waters of Central Puget Sound
in 2001-2002 – King County A3-1
APPENDIX 3

Juvenile Salmonid Composition, Timing, Distribution, and Diet in the Marine Nearshore Waters of Central Puget Sound in 2001-2002 – King County
A3-1
Figure A3-1. CPUE of salmonids over time at Picnic Point from May 15th (week 20) to September 24th (week 39) in 2001.
0
0.2
0.4
0.6
0.8
120 22 24 26 28 30 32 35 37 39
Clipped Chinook Unclipped ChinookClipped CohoUnclipped Coho
Wee
kly
CPU
E (S
E)
Sampling Week
0
2
4
6
8
10
0
1
2
3
4
5
15 20 25 30 35 40
ChumPink
Cutthroat
Wee
kly
CPU
E (S
E)Pi
nk/C
hum
Weekly C
PUE (SE)
Cutthroat
Sampling Week May June July Aug Sept May June July Aug Sept

Juvenile Salmonid Composition, Timing, Distribution, and Diet in the Marine Nearshore Waters of Central Puget Sound in 2001-2002 – King County
A3-2
Figure A3-2. CPUE of salmonids over time at Picnic Point from April 17th (week 16) to May 20th (week 21) in 2002.
0
2
4
6
8
10
1216 17 18 19 20 21
Clipped Chinook Unclipped ChinookClipped CohoUnclipped Coho
Wee
kly
CPU
E (S
E)
Sampling Week
0
20
40
60
80
100
120
140
0
0.1
0.2
0.3
15 16 17 18 19 20 21 22
ChumPink
Cutthroat
Wee
kly
CPU
E (S
E)Pi
nk/C
hum
Weekly C
PUE (SE)
Cutthroat
Sampling Week May June May June

Juvenile Salmonid Composition, Timing, Distribution, and Diet in the Marine Nearshore Waters of Central Puget Sound in 2001-2002 – King County
A3-3
Figure A3-3. CPUE of salmonids over time at Meadowdale from May 15th (week 20) to October 8th (week 41) in 2001.
0
1
2
3
4
5
6
0
0.5
1
1.5
2
2.5
3
15 20 25 30 35 40 45
ChumPink
Cutthroat
Wee
kly
CPU
E (S
E)
Pink
/Chu
m
Weekly C
PUE (SE)
Cutthroat
Sampling Week
0
0.5
1
1.5
2
2.5
3
3.5
4
20 22 24 26 28 30 32 35 37 39 41
Clipped Chinook Unclipped ChinookClipped CohoUnclipped Coho
Wee
kly
CPU
E (S
E)
Sampling WeekMay June July Aug Sept Oct May June July Aug Sept Oct

Juvenile Salmonid Composition, Timing, Distribution, and Diet in the Marine Nearshore Waters of Central Puget Sound in 2001-2002 – King County
A3-4
Figure A3-4. CPUE of salmonids over time at Meadowdale from April 17th (week16) to May 20th (week 21) in 2002.
0
20
40
60
80
100
120
140
0
0.5
1
1.5
2
2.5
3
15 16 17 18 19 20 21 22
ChumPink
Cutthroat
Wee
kly
CPU
E (S
E)Pi
nk/C
hum
Weekly C
PUE (SE)
Cutthroat
Sampling Week
0
2
4
6
8
1016 17 18 19 20 21
Clipped Chinook Unclipped ChinookClipped CohoUnclipped Coho
Wee
kly
CPU
E (S
E)
Sampling Week May June May June

Juvenile Salmonid Composition, Timing, Distribution, and Diet in the Marine Nearshore Waters of Central Puget Sound in 2001-2002 – King County
A3-5
Figure A3-5. CPUE of salmonids over time at Ocean Avenue from May 29th (week 22) to October 8th (week 41) in 2001.
0
2
4
6
8
10
12
0
0.01
0.02
0.03
0.04
0.05
0.06
15 20 25 30 35 40 45
ChumPink
Cutthroat
Wee
kly
CPU
E (S
E)
Pink
/Chu
m
Weekly C
PUE (SE)
Cutthroat
Sampling Week
0
0.5
1
1.5
220 22 24 26 28 32 35 37 41
Clipped Chinook Unclipped ChinookClipped CohoUnclipped Coho
Wee
kly
CPU
E (S
E)
Sampling WeekMay June June July Aug Sept Oct

Juvenile Salmonid Composition, Timing, Distribution, and Diet in the Marine Nearshore Waters of Central Puget Sound in 2001-2002 – King County
A3-6
Figure A3-6. CPUE of salmonids over time at Richmond Beach from May 15 (week 20) to September 24 (week 39) in 2001.
0
10
20
30
40
50
0
0.01
0.02
0.03
0.04
0.05
15 20 25 30 35 40
ChumPink
Cutthroat
Wee
kly
CPU
E (S
E)Pi
nk/C
hum
Weekly C
PUE (SE)
Cutthroat
Sampling Week
0
0.5
1
1.5
2
20 22 24 26 28 32 37 39
Clipped Chinook Unclipped ChinookClipped CohoUnclipped Coho
Wee
kly
CPU
E (S
E)
Sampling WeekMay June July Aug Sept May June July

Juvenile Salmonid Composition, Timing, Distribution, and Diet in the Marine Nearshore Waters of Central Puget Sound in 2001-2002 – King County
A3-7
Figure A3-7. CPUE of salmonids over time at Richmond Beach from April 7 (week16) to October 7 (week 41) in 2002.
0
50
100
150
200
0.05
0.1
0.15
0.2
0.25
15 20 25 30 35 40 45
ChumPink
Cutthroat
Wee
kly
CPU
E (S
E)Pi
nk/C
hum
Weekly C
PUE (SE)
Cutthroat
Sampling Week
0
2
4
6
8
10
12
1416 17 18 19 20 21 23 25 29 30 32 33 36 37 41
Clipped Chinook Unclipped ChinookClipped CohoUnclipped Coho
Wee
kly
CPU
E (S
E)
Sampling Week April May June July Aug Sept May June July Aug Sept Oct
Juvenile Salmonid Composition, Timing, Distribution, and Diet in the Marine Nearshore Waters of Central Puget Sound in 2001-2002 – King County
A3-8
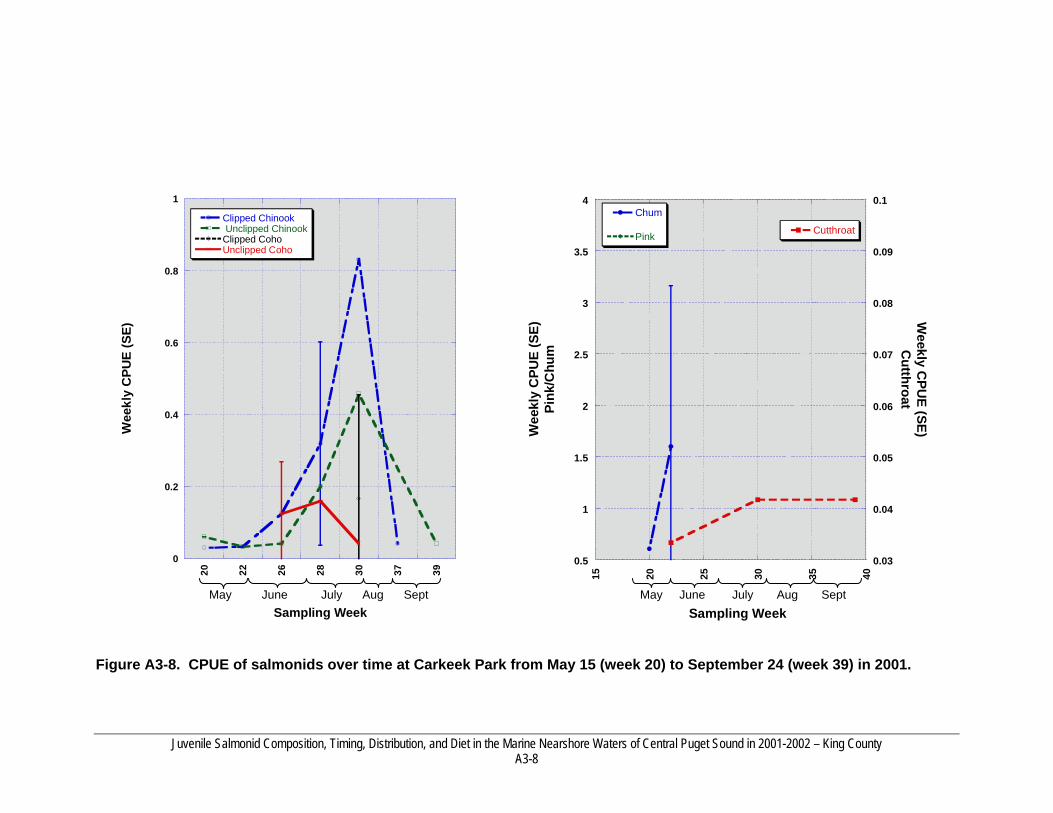
Figure A3-8. CPUE of salmonids over time at Carkeek Park from May 15 (week 20) to September 24 (week 39) in 2001.
0.5
1
1.5
2
2.5
3
3.5
4
0.03
0.04
0.05
0.06
0.07
0.08
0.09
0.1
15 20 25 30 35 40
Chum
Pink Cutthroat
Wee
kly
CPU
E (S
E)Pi
nk/C
hum
Weekly C
PUE (SE)
Cutthroat
Sampling Week
0
0.2
0.4
0.6
0.8
120 22 26 28 30 37 39
Clipped Chinook Unclipped ChinookClipped CohoUnclipped Coho
Wee
kly
CPU
E (S
E)
Sampling WeekMay June July Aug Sept May June July Aug Sept

Juvenile Salmonid Composition, Timing, Distribution, and Diet in the Marine Nearshore Waters of Central Puget Sound in 2001-2002 – King County
A3-9
Figure A3-9. CPUE of salmonids over time at Carkeek Park from May 20 (week 21) to October 21 (week 43) in 2002.
0
0.5
1
1.5
2
2.5
3
0
0.1
0.2
0.3
0.4
0.5
0.6
20 25 30 35 40 45
ChumPink
Cutthroat
Wee
kly
CPU
E (S
E)Pi
nk/C
hum
Weekly C
PUE (SE)
Cutthroat
Sampling Week
0
0.5
1
1.5
221 23 25 29 30 33 36 43
Clipped Chinook Unclipped ChinookClipped CohoUnclipped Coho
Wee
kly
CPU
E (S
E)
Sampling Week May June July Aug Sept Oct May June

Juvenile Salmonid Composition, Timing, Distribution, and Diet in the Marine Nearshore Waters of Central Puget Sound in 2001-2002 – King County
A3-10
Figure A3-10. CPUE of salmonids over time at Golden Gardens Park from May 15 (week 20) to September 24 (week 39) in 2001. Chum and cutthroat were caught in very small numbers in 2001 and not graphed.
0
0.2
0.4
0.6
0.8
1
22 24 26 28 30 32 35
Clipped Chinook Unclipped ChinookClipped CohoUnclipped Coho
Wee
kly
CPU
E (S
E)
Sampling WeekMay June July Aug

Juvenile Salmonid Composition, Timing, Distribution, and Diet in the Marine Nearshore Waters of Central Puget Sound in 2001-2002 – King County
A3-11
Figure A3-11. CPUE of salmonids over time at Golden Gardens Park from May 20 (week 21) to October 7 (week 41) in 2002.
0
5
10
15
20
25
30
0
0.05
0.1
0.15
0.2
0.25
0.3
20 25 30 35 40 45
ChumPink
Cutthroat
Wee
kly
CPU
E (S
E)Pi
nk/C
hum
Weekly C
PUE (SE)
Cutthroat
Sampling Week
0
1
2
3
4
5
6
721 23 25 27 29 30 32 33 37 41
Clipped Chinook Unclipped ChinookClipped CohoUnclipped Coho
Wee
kly
CPU
E (S
E)
Sampling WeekMay June July Aug Sept Oct May June July Aug Sept

Juvenile Salmonid Composition, Timing, Distribution, and Diet in the Marine Nearshore Waters of Central Puget Sound in 2001-2002 – King County
A3-12
Figure A3-12. CPUE of salmonids over time at Lincoln Park from May 15 (week 20) to October 8 (week 41) in 2001.
0
5
10
15
20
0
0.02
0.04
0.06
0.08
0.1
15 20 25 30 35 40 45
ChumPink
Cutthroat
Wee
kly
CPU
E (S
E)Pi
nk/C
hum
Weekly C
PUE (SE)
Cutthroat
Sampling Week
0
2
4
6
8
10
1220 22 24 26 28 30 32 35 37 39 41
Clipped Chinook Unclipped ChinookClipped CohoUnclipped Coho
Wee
kly
CPU
E (S
E)
Sampling WeekMay June July Aug Sept Oct May June July Aug Sept Oct

Juvenile Salmonid Composition, Timing, Distribution, and Diet in the Marine Nearshore Waters of Central Puget Sound in 2001-2002 – King County
A3-13
Figure A3-13. CPUE of salmonids over time at Lincoln Park from May 20 (week 21) to December 9 (week 50) in 2002.
0
10
20
30
40
50
60
70
0
0.1
0.2
0.3
0.4
0.5
0.6
0.7
20 25 30 35 40 45 50 55
ChumPink
Cutthroat
Wee
kly
CPU
E (S
E)Pi
nk/C
hum
Weekly C
PUE (SE)
Cutthroat
Sampling Week
0
2
4
6
8
10
21 23 25 27 29 30 32 33 36 37 39 41 43 50
Clipped Chinook Unclipped ChinookClipped CohoUnclipped Coho
Wee
kly
CPU
E (S
E)
Sampling Week May June July Aug Sept Oct Dec May June July Aug Sept Oct

Juvenile Salmonid Composition, Timing, Distribution, and Diet in the Marine Nearshore Waters of Central Puget Sound in 2001-2002 – King County
A3-14
Figure A3-14. CPUE of salmonids over time at Seahurst Park from May 15 (week 20) to October 8 (week 41) in 2001.
0
0.5
1
1.5
2
2.5
3
3.5
4
0
0.1
0.2
0.3
0.4
0.5
0.6
0.7
0.8
15 20 25 30 35 40 45
ChumPink
Cutthroat
Wee
kly
CPU
E (S
E)Pi
nk/C
hum
Weekly C
PUE (SE)
Cutthroat
Sampling Week
0
0.5
1
1.5
2
2.5
320 22 24 26 28 30 32 35 37 39 41
Clipped Chinook Unclipped ChinookClipped CohoUnclipped Coho
Wee
kly
CPU
E (S
E)
Sampling WeekMay June July Aug Sept Oct May June July Aug Sept Oct

Juvenile Salmonid Composition, Timing, Distribution, and Diet in the Marine Nearshore Waters of Central Puget Sound in 2001-2002 – King County
A3-15
Figure A3-15. CPUE of salmonids over time at Seahurst Park from May 20 (week 21) to October 21 (week 43) in 2002.
0
1
2
3
4
5
0
0.2
0.4
0.6
0.8
1
20 25 30 35 40 45
ChumPink
Cutthroat
Wee
kly
CPU
E (S
E)Pi
nk/C
hum
Weekly C
PUE (SE)
Cutthroat
Sampling Week
0
0.1
0.2
0.3
0.4
0.5
0.6
0.721 23 25 27 29 30 32 33 36 39 41 43
Clipped Chinook Unclipped ChinookClipped CohoUnclipped Coho
Wee
kly
CPU
E (S
E)
Sampling WeekMay June July Aug Sept Oct May June July Aug Sept

Juvenile Salmonid Composition, Timing, Distribution, and Diet in the Marine Nearshore Waters of Central Puget Sound in 2001-2002 – King County
A3-16
Figure A3-16. CPUE of salmonids over time at Marine View Park from May 15 (week 20) to October 8 (week 41) in 2001.
0
1
2
3
4
5
6
0
0.05
0.1
0.15
0.2
0.25
0.3
15 20 25 30 35 40 45
ChumPink
Cutthroat
Wee
kly
CPU
E (S
E)Pi
nk/C
hum
Weekly C
PUE (SE)
Cutthroat
Sampling Week
0
0.5
1
1.5
2
2.5
3
3.5
420 24 26 28 30 32 35 37 39 41
Clipped Chinook Unclipped ChinookClipped CohoUnclipped Coho
Wee
kly
CPU
E (S
E)
Sampling WeekMay June July Aug Sept Oct May June July Aug Sept Oct

Juvenile Salmonid Composition, Timing, Distribution, and Diet in the Marine Nearshore Waters of Central Puget Sound in 2001-2002 – King County
A3-17
Figure A3-17. CPUE of salmonids over time at KVI Beach from May 29 (week 22) to October 8 (week 41) in 2001.
0
2
4
6
8
10
12
14
0
0.01
0.02
0.03
0.04
0.05
0.06
0.07
15 20 25 30 35 40 45
ChumPink
Cutthroat
Wee
kly
CPU
E (S
E)Pi
nk/C
hum
Weekly C
PUE (SE)
Cutthroat
Sampling Week
0
0.5
1
1.5
2
2.5
320 22 24 26 28 30 32 35 37 39 41
Clipped Chinook Unclipped ChinookClipped CohoUnclipped Coho
Wee
kly
CPU
E (S
E)
Sampling Week May June July Aug Sept Oct May June July Aug Sept Oct

Juvenile Salmonid Composition, Timing, Distribution, and Diet in the Marine Nearshore Waters of Central Puget Sound in 2001-2002 – King County
A3-18
Figure A3-18. CPUE of salmonids over time at KVI Beach from May 20 (week 21) to September 9 (week 37) in 2002.
0
5
10
15
20
0
0.05
0.1
0.15
0.2
20 25 30 35 40
ChumPink
Cutthroat
Wee
kly
CPU
E (S
E)Pi
nk/C
hum
Weekly C
PUE (SE)
Cutthroat
Sampling Week
0
1
2
3
4
5
6
7
821 23 25 29 30 32 33 36 37
Clipped Chinook Unclipped ChinookClipped CohoUnclipped Coho
Wee
kly
CPU
E (S
E)
Sampling Week May June July Aug Sept May June July Aug Sept

Juvenile Salmonid Composition, Timing, Distribution, and Diet in the Marine Nearshore Waters of Central Puget Sound in 2001-2002 – King County
A3-19
Figure A3-19. CPUE of salmonids over time at Maury Island Marine Park from May 15 (week 20) to October 8 (week 41) in 2001.
0
2
4
6
8
10
12
14
0.041
0.042
0.043
0.044
0.045
0.046
15 20 25 30 35 40 45
ChumPink
Cutthroat
Wee
kly
CPU
E (S
E)Pi
nk/C
hum
Weekly C
PUE (SE)
Cutthroat
Sampling Week
0
0.5
1
1.5
2
2.5
3
3.5
420 22 24 26 28 30 32 35 37 39 41
Clipped Chinook Unclipped ChinookClipped CohoUnclipped Coho
Wee
kly
CPU
E (S
E)
Sampling WeekMay June July Aug Sept Oct May June July Aug Sept Oct

Juvenile Salmonid Composition, Timing, Distribution, and Diet in the Marine Nearshore Waters of Central Puget Sound in 2001-2002 – King County
A3-20
Figure A3-20. CPUE of salmonids over time at Maury Island Marine Park from May 20 (week 21) to October 7 (week 41) in 2002.
0
20
40
60
80
100
120
0
0.01
0.02
0.03
0.04
0.05
0.06
20 25 30 35 40 45
ChumPink
Cutthroat
Wee
kly
CPU
E (S
E)Pi
nk/C
hum
Weekly C
PUE (SE)
Cutthroat
Sampling Week
0
1
2
3
4
5
6
21 23 25 29 30 32 33 36 37 41 43
Clipped Chinook Unclipped ChinookClipped CohoUnclipped Coho
Wee
kly
CPU
E (S
E)
Sampling WeekMay June July Aug Sept Oct May June July Aug
Juvenile Salmonid Composition, Timing, Distribution, and Diet in the Marine Nearshore Waters of Central Puget Sound in 2001-2002 – King County
A3-21
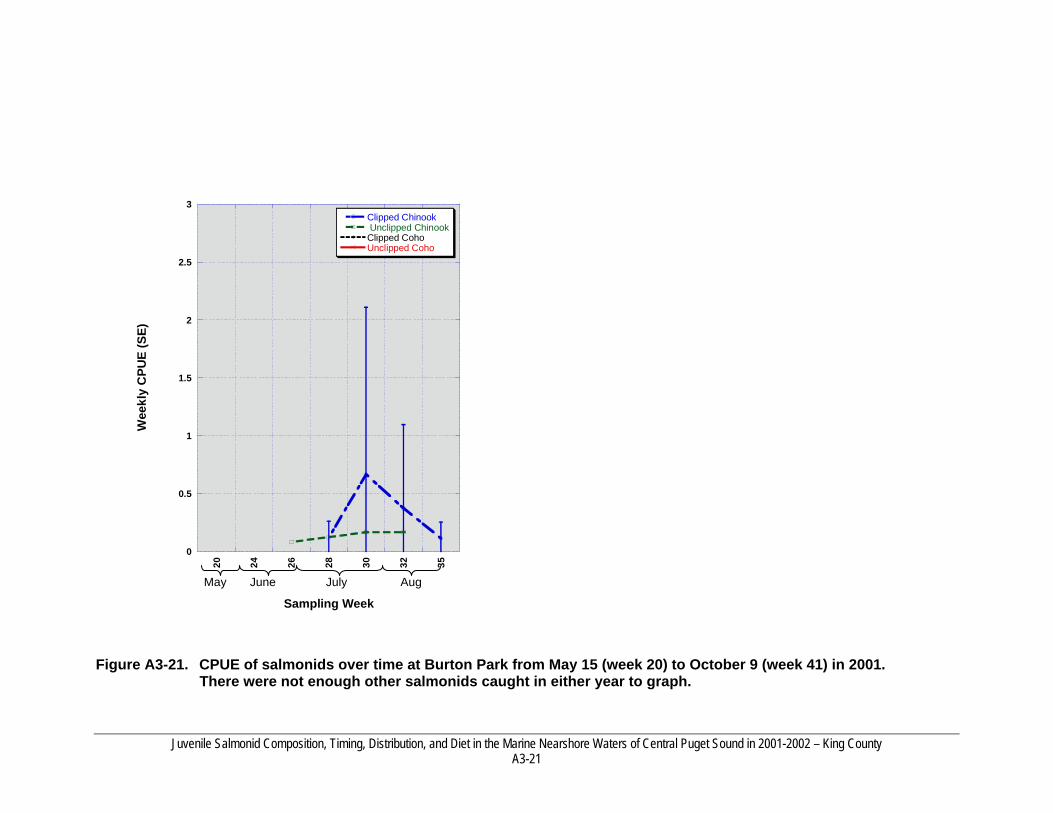
Figure A3-21. CPUE of salmonids over time at Burton Park from May 15 (week 20) to October 9 (week 41) in 2001. There were not enough other salmonids caught in either year to graph.
0
0.5
1
1.5
2
2.5
320 24 26 28 30 32 35
Clipped Chinook Unclipped ChinookClipped CohoUnclipped Coho
Wee
kly
CPU
E (S
E)
Sampling Week
May June July Aug

Juvenile Salmonid Composition, Timing, Distribution, and Diet in the Marine Nearshore Waters of Central Puget Sound in 2001-2002 – King County
A3-22
Table A3-1. Weekly catch per unit effort values and standard effort for north mainland (WRIA 8) {see figure 3-5}. Note, shaded areas represent no sampling and NA means not applicable.
Week
CPUE Clipped Chinook
SE CPUE Clipped Chinook
CPUE Unclipped Chinook
SE CPUE Unclipped Chinook
CPUE Clipped Chinook
SE CPUE Clipped Chinook
CPUE Unclipped Chinook
SE CPUE Unclipped Chinook
CPUE Chum
SE CPUE Chum
CPUE Chum
SE CPUE Chum
16 0.0000 NA 0.0000 NA 77.0000 41.013417 0.1250 NA 0.0000 NA 175.7500 61.665218 0.0000 NA 0.1250 NA 132.8750 72.156419 0.2857 0.0000 0.0000 NA 25.2857 11.936120 1.4000 0.7303 1.4000 0.6831 0.5714 0.2182 0.1429 NA 3.2667 1.7512 292.2857 101.640121 0.8000 0.2582 1.9000 0.6481 82.6000 55.995322 1.7222 0.6983 0.9444 0.3436 64.2222 20.954023 3.8750 0.7555 3.1250 1.0596 28.6250 17.838124 0.1667 NA 1.5000 0.7071 0.0833 NA25 19.8333 12.2763 13.0000 10.7083 22.8333 16.260026 1.6667 0.6455 1.0000 1.1547 0.4167 NA27 10.5000 4.5000 4.0000 0.0000 1.0000 0.000028 1.6667 0.5774 1.0833 0.5244 0.0833 NA29 0.3750 NA 1.5000 0.6455 0.2500 0.000030 2.2500 2.3857 1.0833 1.6667 1.0000 0.4082 0.8333 0.4714 0.0000 NA 0.0000 NA32 0.0833 NA 0.2500 0.2041 0.1667 NA 0.0000 NA 0.0000 NA 0.0000 NA33 1.7143 0.7838 2.8571 1.1019 0.2857 NA35 0.9167 0.3764 0.5000 0.1291 0.0000 NA36 0.0000 NA 1.0000 0.4082 0.0000 NA37 0.5833 0.4330 0.0833 NA 0.0000 NA 0.7500 NA 0.0000 NA 0.0000 NA39 0.3333 0.1667 0.5000 0.2887 0.0000 NA41 0.0909 NA 0.0000 NA 0.0000 NA 0.7143 0.2182 0.0000 NA 0.0000 NA43 0.0000 NA 0.5714 NA 0.0000 NA
2001 2002 2001 2002

Juvenile Salmonid Composition, Timing, Distribution, and Diet in the Marine Nearshore Waters of Central Puget Sound in 2001-2002 – King County
A3-23
Table A3-1 concluded.
Week
CPUE Clipped Coho
SE CPUE Clipped Coho
CPUE Unclipped
Coho
SE CPUE Unclipped
Coho
CPUE Clipped Coho
SE CPUE Clipped Coho
CPUE Unclipped
Coho
SE CPUE Unclipped
Coho CPUE
Cutthroat SE CPUE Cutthroat
CPUE Cutthroat
SE CPUE Cutthroat
16 0.0000 NA 0.0000 NA 0.0000 NA17 0.0000 NA 0.0000 NA 1.3750 NA18 0.0000 NA 0.0000 NA 1.2500 0.816519 3.0000 1.6147 8.1429 5.6432 1.4286 1.069020 0.0667 NA 0.4000 0.7303 6.0000 1.5721 10.5714 3.6489 0.4667 0.2981 0.4286 NA21 2.3000 1.4480 16.7000 10.1512 2.3000 1.234422 0.0000 NA 1.0556 1.1230 0.7778 0.463523 0.2500 0.0000 2.3750 0.5204 0.0000 NA 0.2500 0.000024 0.0833 NA 0.7500 0.3764 2.2500 1.163725 0.6667 0.2357 11.0000 5.9395 1.1667 0.390926 0.5000 0.1667 2.5000 0.8695 2.2500 2.215827 0.0000 NA 1.5000 NA 0.5000 NA28 0.1667 0.0000 0.4167 0.1667 0.9167 0.625829 0.7500 0.6124 0.8750 0.3385 0.0000 NA30 0.4167 0.3333 0.5833 0.1581 0.3333 NA 0.3333 0.0000 0.6667 0.4082 0.0000 NA32 0.0000 NA 0.0000 NA 0.0000 NA 0.5000 0.2887 0.4167 0.6124 0.5000 NA33 0.5714 0.2182 0.4286 0.2673 0.0000 NA 0.1429 NA35 0.0833 NA 0.0000 NA 0.2500 0.204136 0.0000 NA 0.0000 NA 0.0000 NA37 0.0000 NA 0.3333 NA 0.0000 NA 0.0000 NA 1.3333 2.1667 0.2500 NA39 0.0000 NA 0.0833 NA 2.3333 3.091241 0.0000 NA 0 NA 0.0000 NA 0.0000 NA 2.4545 1.0660 0.0000 NA43 0.0000 NA 0.0000 NA 0.0000 NA
WeekCPUE Pink
SE CPUE Pink
16 56.8571 36.477617 156.7500 68.826618 4.3750 3.973919 0.4286 NA20 7.4286 7.327121 71.3000 0.6708
2002
2002
2001 2002 2001
Juvenile Salmonid Composition, Timing, Distribution, and Diet in the Marine Nearshore Waters of Central Puget Sound in 2001-2002 – King County
A3-24
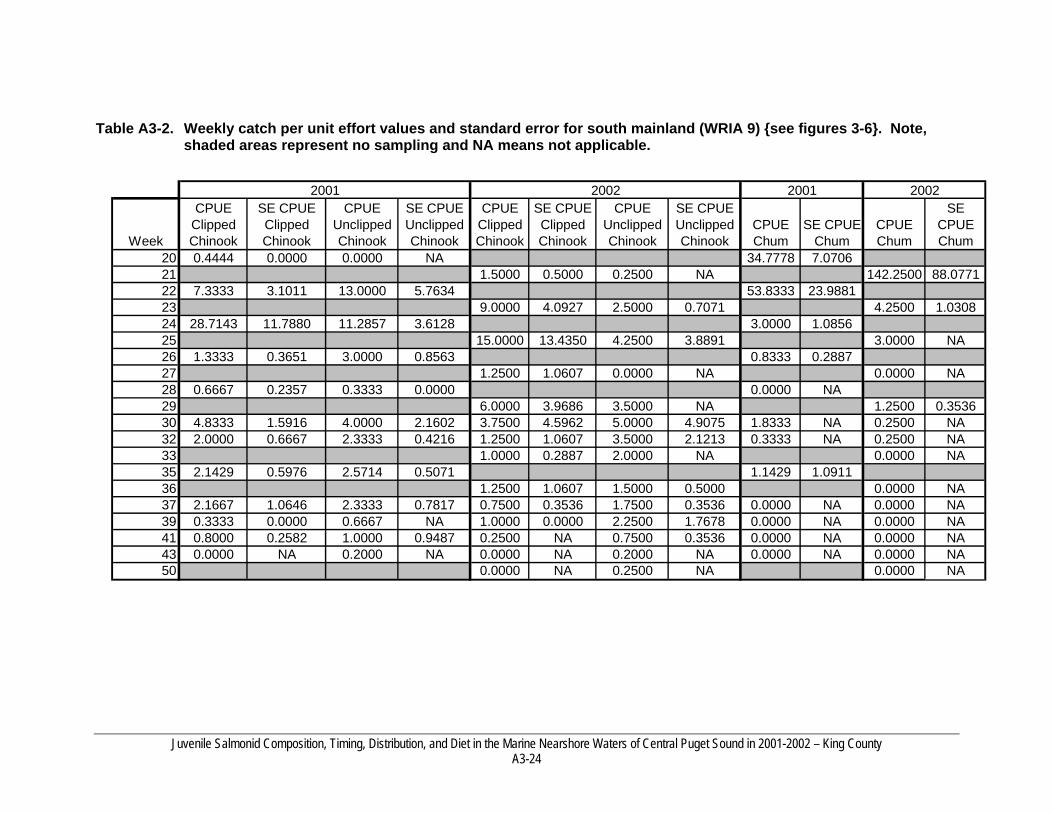
Table A3-2. Weekly catch per unit effort values and standard error for south mainland (WRIA 9) {see figures 3-6}. Note, shaded areas represent no sampling and NA means not applicable.
Week
CPUE Clipped Chinook
SE CPUE Clipped Chinook
CPUE Unclipped Chinook
SE CPUE Unclipped Chinook
CPUE Clipped Chinook
SE CPUE Clipped Chinook
CPUE Unclipped Chinook
SE CPUE Unclipped Chinook
CPUE Chum
SE CPUE Chum
CPUE Chum
SE CPUE Chum
20 0.4444 0.0000 0.0000 NA 34.7778 7.070621 1.5000 0.5000 0.2500 NA 142.2500 88.077122 7.3333 3.1011 13.0000 5.7634 53.8333 23.988123 9.0000 4.0927 2.5000 0.7071 4.2500 1.030824 28.7143 11.7880 11.2857 3.6128 3.0000 1.085625 15.0000 13.4350 4.2500 3.8891 3.0000 NA26 1.3333 0.3651 3.0000 0.8563 0.8333 0.288727 1.2500 1.0607 0.0000 NA 0.0000 NA28 0.6667 0.2357 0.3333 0.0000 0.0000 NA29 6.0000 3.9686 3.5000 NA 1.2500 0.353630 4.8333 1.5916 4.0000 2.1602 3.7500 4.5962 5.0000 4.9075 1.8333 NA 0.2500 NA32 2.0000 0.6667 2.3333 0.4216 1.2500 1.0607 3.5000 2.1213 0.3333 NA 0.2500 NA33 1.0000 0.2887 2.0000 NA 0.0000 NA35 2.1429 0.5976 2.5714 0.5071 1.1429 1.091136 1.2500 1.0607 1.5000 0.5000 0.0000 NA37 2.1667 1.0646 2.3333 0.7817 0.7500 0.3536 1.7500 0.3536 0.0000 NA 0.0000 NA39 0.3333 0.0000 0.6667 NA 1.0000 0.0000 2.2500 1.7678 0.0000 NA 0.0000 NA41 0.8000 0.2582 1.0000 0.9487 0.2500 NA 0.7500 0.3536 0.0000 NA 0.0000 NA43 0.0000 NA 0.2000 NA 0.0000 NA 0.2000 NA 0.0000 NA 0.0000 NA50 0.0000 NA 0.2500 NA 0.0000 NA
2001 2002 2001 2002

Juvenile Salmonid Composition, Timing, Distribution, and Diet in the Marine Nearshore Waters of Central Puget Sound in 2001-2002 – King County
A3-25
Table A3-2 concluded.
Week
CPUE Clipped Coho
SE CPUE Clipped Coho
CPUE Unclipped
Coho
SE CPUE Unclipped
Coho
CPUE Clipped Coho
SE CPUE Clipped Coho
CPUE Unclipped
Coho
SE CPUE Unclipped
Coho CPUE
Cutthroat SE CPUE Cutthroat
CPUE Cutthroat
SE CPUE
Cutthroat 20 7.7778 15.5563 0.3333 NA 0.1111 NA21 2.7500 0.3536 9.2500 4.5092 0.7500 NA22 0.1667 NA 1.0000 0.2357 0.5000 NA23 0.7500 0.3536 1.2500 1.0607 0.2500 NA24 1.2857 0.5669 0.1429 1.0000 0.207025 0.2500 NA 1.2500 0.3536 1.2500 1.060726 0.8333 0.4714 2.1667 0.7416 1.3333 0.577427 0.0000 NA 0.2500 NA 0.7500 0.000028 0.3333 NA 0.1667 NA 0.5000 0.000029 0.5000 0.0000 0.7500 0.3536 0.0000 NA30 0.3333 0.0000 0.6667 0.5774 0.0000 NA 0.0000 NA 0.1667 NA 0.0000 NA32 0.0000 NA 0.0000 NA 0.0000 NA 0.0000 NA 0.1667 NA 1.2500 0.250033 0.0000 NA 0.2500 NA 0.5000 0.000035 0.0000 NA 0.0000 NA 0.1429 NA36 0.2500 NA 0.0000 NA 0.0000 NA37 0.0000 NA 0.0000 NA 0.0000 NA 0.0000 NA 0.0000 NA 0.0000 NA39 0.0000 NA 0.3333 0.0000 0.0000 NA 0.0000 NA 0.3333 0.0000 0.5000 NA41 0.0000 NA 0.0000 NA 0.0000 NA 0.0000 NA 1.4000 1.0328 0.2500 NA43 0.0000 NA 0.0000 NA 0.0000 NA 0.0000 NA 0.0000 NA 0.0000 NA50 0.0000 NA 0.0000 NA 0.0000 NA
2001 2002 2001 2002

Juvenile Salmonid Composition, Timing, Distribution, and Diet in the Marine Nearshore Waters of Central Puget Sound in 2001-2002 – King County
A3-26
Table A3-3. Weekly catch per unit effort values and standard error for island sites (WRIA 9) {see figures 3-7}. Note, shaded areas represent no sampling and NA means not applicable.
Week
CPUE Clipped Chinook
SE CPUE Clipped Chinook
CPUE Unclipped Chinook
SE CPUE Unclipped Chinook
CPUE Clipped Chinook
SE CPUE Clipped Chinook
CPUE Unclipped Chinook
SE CPUE Unclipped Chinook
CPUE Chum
SE CPUE Chum
CPUE Chum
SE CPUE Chum
20 0.3333 0.2357 0.0000 NA 5.8095 7.8478 0.4286 0.7715 25.4444 10.4425 290.0000 138.309721 5.8333 6.5107 0.1667 NA 89.6667 100.870922 2.6667 3.4641 0.3333 0.0000 4.3929 4.1405 0.3571 0.5669 48.8333 11.0013 371.3214 207.583223 7.6667 5.9048 0.3333 NA 22.6667 10.387024 3.0000 2.5927 2.5000 3.1754 10.3333 6.908125 26.6667 14.3170 2.8333 1.0737 85.3333 38.968126 0.1667 1.0000 0.4082 3.0000 1.732128 0.8571 0.2182 0.5714 0.5345 0.8571 0.534529 2.6000 0.7483 0.8000 0.0000 4.0000 2.206130 4.5000 1.8394 3.1667 0.7923 2.6667 1.2019 0.8333 0.2357 0.3333 0.0000 1.3333 0.577432 3.1667 1.0567 2.5000 0.8165 1.0000 0.4082 1.5000 0.7071 0.8333 0.2887 0.6667 0.235733 2.0000 0.8165 3.5000 1.4549 0.1667 NA35 1.7143 1.0235 0.7143 0.2182 4.7143 NA36 0.3333 NA 0.8333 0.2357 0.0000 NA37 1.3333 1.7321 0.5000 NA 1.7143 0.3381 2.2857 0.8194 0.3333 NA 0.0000 NA39 0.0000 NA 0.1667 NA 0.0000 NA41 0.8667 1.4907 1.7333 2.8402 0.2857 NA 0.7143 0.4364 0.7333 0.7454 0.0000 NA 43 0.0000 NA 0.2727 0.2132 0.0000 NA
2001 2002 2001 2002

Juvenile Salmonid Composition, Timing, Distribution, and Diet in the Marine Nearshore Waters of Central Puget Sound in 2001-2002 – King County
A3-27
Table A3-3 concluded.
Week
CPUE Clipped Coho
SE CPUE Clipped Coho
CPUE Unclipped
Coho
SE CPUE Unclipped
Coho
CPUE Clipped Coho
SE CPUE Clipped Coho
CPUE Unclipped
Coho
SE CPUE Unclipped
Coho CPUE
Cutthroat
SE CPUE
Cutthroat CPUE
Cutthroat SE CPUE Cutthroat
20 0.1111 NA 0.0000 NA 15.1429 13.7548 2.0476 2.0410 0.0000 NA 0.0000 NA21 3.5000 2.6771 2.0000 NA 0.3333 0.000022 0.0000 NA 0.0000 NA 1.0714 2.0845 0.6429 0.5225 0.0000 NA 0.4643 0.224523 0.0000 NA 0.1667 NA 0.0000 NA24 0.0000 NA 0.6667 0.0000 0.3333 0.000025 0.0000 NA 0.1667 NA 0.3333 0.000026 0.0000 NA 0.1667 NA 0.0000 NA28 0.1429 NA 0.0000 NA 0.0000 NA29 0.0000 NA 0.0000 NA 0.0000 NA30 0.0000 NA 0.0000 NA 0.1667 NA 0.1667 NA 0.1667 NA 1.3333 1.732132 0.0000 NA 0.0000 NA 0.0000 NA 0.0000 NA 0.0000 NA 0.1667 NA33 0.1667 NA 0.0000 NA 0.1667 NA35 0.0000 NA 1.0000 NA 0.0000 NA36 0.1667 NA 0.0000 NA 0.6667 NA37 0.0000 NA 0.0000 NA 0.0000 NA 0.0000 NA 0.0000 NA 0.2857 0.000039 0.0000 NA 0.1667 NA 0.1667 NA41 0.0000 NA 0.2000 NA 0.0000 NA 0.0000 NA 0.0000 NA 0.4286 0.267343 0.0000 NA 0.0000 NA 0.1818 0.0000
20022001 2002 2001

Juvenile Salmonid Composition, Timing, Distribution, and Diet in the Marine Nearshore Waters of Central Puget Sound in 2001-2002 – King County
A3-28
Table A3-4. Catch per unit effort values and standard error for annual CPUE by region (see figure 3-8)
RegionClipped Chinook
SE Clipped Chinook
Unclipped Chinook
SE Unclipped Chinook
Clipped Chinook
SE Clipped Chinook
Unclipped Chinook
SE Unclipped Chinook
North Mainland 1.0357 0.2839 0.7857 0.2026 1.7190 1.1898 1.5702 0.7989South Mainland 4.8000 1.7829 3.6571 0.9300 2.9649 1.3012 1.9474 0.6439Vashon/Maury 1.5375 0.4500 1.2000 0.5054 4.4634 1.8654 0.8699 0.2020
Clipped Coho
SE Clipped Coho
Unclipped Coho
SE Unclipped Coho
Clipped Coho
SE Clipped Coho
Unclipped Coho
SE Unclipped Coho
North Mainland 0.1143 0.0550 0.5786 0.2254 0.8595 0.3634 3.3140 1.5600South Mainland 1.2714 2.1995 0.4286 0.1504 0.3158 0.2719 0.9123 0.8483Vashon/Maury 0.0250 0.0000 0.2000 0.2517 3.0244 4.0080 0.6179 0.5726
Chum SE Chum Chum SE Chum Pink SE Pink Pink SE Pink North Mainland 8.6571 6.4472 53.1322 15.5678 0.0000 0.0000 20.2893 13.9202South Mainland 9.7571 4.2430 10.6140 14.9279 0.0000 0.0000 0.0000 0.0000Vashon/Maury 8.2625 2.9375 143.9512 69.0087 0.0000 0.0000 0.5122 3.8892
Cutthroat SE
Cutthroat Cutthroat
2002SE Cutthroat
2002North Mainland 1.2357 0.4538 0.6033 0.2740South Mainland 0.4857 0.1316 0.3860 0.1213Vashon/Maury 0.0500 0.0000 0.3089 0.1349
2001 2002
2001 2002
2001 2002
2001 2002 2001 2002

Juvenile Salmonid Composition, Timing, Distribution, and Diet in the Marine Nearshore Waters of Central Puget Sound in 2001-2002 – King County
A3-29
Table A3-5. Catch per unit effort values and standard error for annual CPUE by site (see figures 3- 9).
LocationClipped Chinook
SE Clipped Chinook
Unclipped Chinook
SE Unclipped Chinook
Clipped Chinook
SE Clipped Chinook
Unclipped Chinook
SE Unclipped Chinook
Clipped Coho
SE Clipped
CohoUnclipped
Coho
SE Unclipped
CohoRichmond Beach 1.2609 0.4445 1.2174 0.5517 3.1842 3.7075 2.9737 2.3270 0.1739 0.1204 0.8261 0.6516Carkeek 1.4167 1.3966 0.8750 0.7817 0.9545 0.4959 1.2273 0.5576 0.1667 0.2887 0.3333 0.1118Golden Gardens 0.9524 0.4912 0.4286 0.1065 1.8333 0.8014 1.0333 0.2518 0.0952 0.0000 0.4762 0.9258Lincoln Park 8.6250 4.5704 6.7083 2.2151 5.5357 2.1150 3.2143 1.0068 0.2083 0.1021 0.2083 0.0000Seahurst Park 2.4800 1.0793 1.8800 0.5750 0.4828 0.2579 0.7241 0.5867 0.6000 0.2430 0.6400 0.2760KVI 1.5172 1.0363 1.2414 0.5814 2.7500 1.9608 1.3333 0.5074 0.0345 0.0000 0.1724 0.1072Maury Is. Park 1.6207 0.5565 1.7241 1.2380 3.3182 1.5477 0.5909 0.2261 0.0345 0.0000 0.3793 0.5673
2001 2002 2001
LocationClipped
Coho
SE Clipped
CohoUnclipped Coho
SE Unclipped
CohoChum 2001 SE Chum Chum SE Chum Cutthroat
SE Cutthroat Cutthroat
SE Cutthroat Pink SE Pink
Richmond Beach 0.4474 0.3086 1.8684 1.8848 29.3913 28.3928 63.5000 29.8973 0.0870 0.0000 0.1579 0.1622 20.3947 29.9379Carkeek 0.3182 0.0870 0.7273 0.2780 2.8333 1.4814 0.5909 1.2309 0.1250 0.0000 0.2727 0.1231 0.0000 0.0000Golden Gardens 0.2000 0.1054 0.8000 0.2611 6.7143 15.7162 5.8333 9.6183 0.0952 0.0000 0.2667 0.1633 0.0000 0.0000Lincoln Park 0.4286 0.2827 1.7500 1.2707 18.7083 9.7056 19.2143 25.8073 0.2083 0.0000 0.3214 0.0922 0.0000 0.0000Seahurst Park 0.2069 0.0000 0.1034 0.0000 4.4000 2.4972 2.3103 5.2333 0.7600 0.1992 0.4483 0.2206 0.0000 0.0000KVI 0.0000 0.0000 0.0833 0.0000 11.5862 5.3605 6.3333 7.0257 0.0690 0.0000 0.0417 0.0000 0.0000 0.0000Maury Is. Park 0.9545 1.3981 0.5455 0.0000 10.0690 4.9720 29.5000 30.5893 0.0345 0.0000 0.0455 0.0000 2.8636 9.1961
20022002 2001 2002 2001 2002

Juvenile Salmonid Composition, Timing, Distribution, and Diet in the Marine Nearshore Waters of Central Puget Sound in 2001-2002 – King County
A3-30

APPENDIX 4

Juvenile Salmonid Species Composition, Timing, Distribution, and Diet in Nearshore Marine Waters of Central Puget Sound in 2001-2002 A4-2
Numbers, locations, and dates of all juvenile chinook salmon analyzed for diet contents.
Chinook 2001 Chinook 2002 Region Site Date n Region Site Date n
Island Burton 6/28/01 2 Island Burton 5/22/02 1
7/12/01 2 6/5/02 1
7/26/01 15 Camp Sealth 7/23/02 6
8/9/01 12 8/6/02 1
8/30/01 1 10/22/02 2
KVI 5/31/01 5 DNR 6/18/02 15
6/13/01 6 7/16/02 5
6/28/01 4 KVI 6/5/02 7
7/12/01 5 6/18/02 9
7/26/01 4 7/16/02 2
8/9/01 4 7/23/02 5
8/30/01 2 8/6/02 5
9/14/01 10 8/13/02 5
9/27/01 1 9/4/02 2
10/10/01 1 9/10/02 6
Maury Is 5/31/01 2 Maury Is 5/13/02 3
7/26/01 12 5/14/02 5
8/9/01 12 5/15/02 4
8/30/01 9 5/22/02 10
9/14/01 1 5/30/02 2
10/9/01 10 6/5/02 5
North Carkeek 5/16/01 1 6/18/02 5
6/26/01 4 7/16/02 7

Juvenile Salmonid Species Composition, Timing, Distribution, and Diet in Nearshore Marine Waters of Central Puget Sound in 2001-2002 A4-3
Chinook 2001 Chinook 2002 Region Site Date n Region Site Date n
7/10/01 4 7/23/02 4
7/24/01 12 8/6/02 7
9/25/01 1 8/13/02 9
Golden Gardens
5/29/01 3 9/4/02 1
6/26/01 2 9/10/02 5
7/10/01 1 10/8/02 1
7/24/01 2 Pt Robinson 8/13/02 6
8/7/01 1 9/4/02 4
8/28/01 4 9/10/02 5
Meadowdale 5/15/01 7 10/8/02 6
5/30/01 2 10/22/02 1
6/11/01 2 North Carkeek 5/20/02 4
7/9/01 11 6/6/02 8
7/23/01 6 7/17/02 7
8/27/01 2 7/24/02 3
9/24/01 1 8/14/02 5
Oceanview 5/30/01 6 9/5/02 2
6/12/01 6 10/23/02 1
7/9/01 1 Edmonds 5/3/02 1
8/6/01 1 5/16/02 1
8/27/01 3 Golden Gardens 6/4/02 5
9/10/01 3 6/6/02 2
10/11/01 1 6/17/02 5
Picnic Pt 5/15/01 2 7/1/02 13
5/30/01 1 7/15/02 4

Juvenile Salmonid Species Composition, Timing, Distribution, and Diet in Nearshore Marine Waters of Central Puget Sound in 2001-2002 A4-4
Chinook 2001 Chinook 2002 Region Site Date n Region Site Date n
8/27/01 8 7/22/02 4
9/24/01 5 8/12/02 5
Richmond 5/29/01 2 10/9/02 2
6/12/01 6 Meadowdale 5/10/02 1
6/26/01 10 5/16/02 2
9/11/01 4 Picnic Pt 5/16/02 1
9/25/01 2 Richmond 5/10/02 2
South Lincoln 6/14/01 19 6/6/02 6
6/27/01 8 6/19/02 18
7/11/01 2 7/17/02 3
7/25/01 7 7/24/02 4
8/8/01 6 8/7/02 1
8/29/01 11 8/14/02 10
9/12/01 1 9/5/02 4
9/26/01 5 9/11/02 5
10/10/01 6 10/7/02 3
Marineview 6/14/01 6 South Lincoln 5/21/02 5
6/27/01 5 6/4/02 11
7/11/01 3 6/17/02 14
8/8/01 7 7/1/02 5
8/29/01 10 7/15/02 11
9/26/01 1 7/22/02 12
10/10/01 2 8/5/02 5
Seahurst 6/1/01 3 8/12/02 7
6/14/01 10 9/3/02 6

Juvenile Salmonid Species Composition, Timing, Distribution, and Diet in Nearshore Marine Waters of Central Puget Sound in 2001-2002 A4-5
Chinook 2001 Chinook 2002 Region Site Date n Region Site Date n
6/27/01 4 9/9/02 5
7/11/01 2 9/23/02 5
7/25/01 14 10/9/02 2
8/8/01 11 10/21/02 1
8/29/01 7 Seahurst 5/21/02 2
9/12/01 12 6/4/02 5
10/10/01 1 7/15/02 2
Total 410 7/24/02 2
8/5/02 5
8/12/02 1
9/3/02 2
9/23/02 4
10/9/02 2
10/21/02 1
Total 409