Embed Size (px)
Citation preview

Chapter 5: Tissue equivalence correction Page 120
120
5. Tissue equivalence correction for siliconmicrodosimeters
ICRU report 44 [32] states "Tissue substitutes are often mixtures formulated so that
their radiation interaction properties rather than their atomic composition, match those
of the body tissue to the degree necessary for the specific application". Similarly,
radiation detectors due to operational and construction requirements (such as electrical
conductivity, stability, mechanical strength, and shape construction) are rarely made of
components with identical composition to tissue. Instead, the pertinent radiation
characteristics and mass densities of the body tissue and detector are evaluated and
correction factors frequently employed.
The macrodosimetric tissue equivalency of silicon or silicon dioxide for integral low
LET photon irradiation is well established [175]. However, methods for converting
silicon based microdosimetric measurements to tissue volumes have previously not been
investigated.
For macrodosimetric measurements, dose may be scaled according to the Bragg-Gray
theorem [176-178]. Assuming that the detector is small in comparison with the range of
secondary particles then the relationship between detector dose Ddetector and tissue dose
Dtissue is given by:
DS
SDtissue
tissueector=
/
/det
ρ
ρ
c hc h
detector
(5.1)
where S / ρ is mass collision stopping power averaged over the energy spectrum of
charged particles. For photons, provided the detector does not perturb the photon
spectrum, equation (5.1) becomes
D D
k D
tissueen tissue
endetector
detector
=
=
µ ρ
µ ρ
/
/
b gb g
detector
for Silicon Detector
(5.2)
where µ ρen / is the mass energy absorption coefficient averaged over the photon
spectrum. The scaling factor k is simply 1.09 for silicon with photons in the energy
range 0.3 to 3 MeV [179].

Chapter 5: Tissue equivalence correction Page 121
121
For microdosimetric measurements, a spectrum is produced as opposed to a single dose
measurement. A simple method for interpreting silicon microdosimetric spectra as
equivalent tissue measurements is described in this chapter.
The results are presented using boron neutron capture therapy (BNCT) as a test case.
We first compare silicon and tissue range-energy relationships for H, He, Li and C ion
deposition. The Monte-Carlo method is used to compare energy deposition spectra for
some simple geometrical cases relevant to boron neutron capture therapy. The tissue
equivalency of silicon detector/converter systems under fast neutron and proton
irradiation is also considered.
5.1 Definition of Tissue and Detector MaterialsBefore comparing silicon to tissue, the composition of tissue must first be defined.
Biological tissue composition varies significantly between tissue types and individuals.
The subject of tissue references is comprehensively discussed in ICRU report #44 [32]
and a report by the ICRP [180]. These reports identified the most important tissues
needing simulation as muscle, adipose tissue and the skeleton. Together these make up
over 70% of the body mass. Lung tissue is also important due to its large density
difference. Muscle includes the connective tissue, blood vessels, blood, lymph, etc.,
generally associated with skeletal (striated) muscle. Adipose tissue is composed of a
protein matrix supporting cells (adipocytes) highly specialized for the storage of lipids.
The most common tissue reference in microdosimetric literature [11], and the one we
shall use here, is commonly identified as muscle (striated, ICRU, 1964) [181]. ICRU
report 44 [32] identifies a composition called muscle (skeletal, ICRU, 1989) as the
recommended muscle composition. However, the difference with muscle (striated) is
small (an additional 2% carbon content and 2% less oxygen content) and we maintain
conformity with the literature in using muscle (striated). The composition of muscle
(striated ICRU, 1964), heretofore called muscle, is defined in Table 5.1. In addition, the
term "tissue equivalent" refers to muscle (striated ICRU, 1964) equivalence. The
primary elements in tissue are hydrogen, carbon, oxygen and nitrogen. For a given
tissue substitute the quality of the tissue approximation depends on the composition and
density matching along with the type and energy of the radiation being used. Also
described in Table 5.1 are the composition and some relevant properties of several
materials (A150, Lucite, and silicon) which will be compared to muscle.

Chapter 5: Tissue equivalence correction Page 122
122
The standard wall material used in the majority of proportional gas counters is a plastic
designated A150, which is considered "muscle equivalent". A150 is a mixture of
polyethylene, nylon, carbon and calcium fluoride, which is easily molded, welded and
machined. The material was originally developed by Shonka and collaborators [33] and
subsequently modified by Smathers [182]. The elemental composition of A150 is very
close to muscle in regard to hydrogen and nitrogen content. However, the oxygen
content is much lower and this has been substituted by an increased carbon content to
obtain suitable electrical conductivity. Note that no usable solid exists with the required
oxygen content of tissue. The effect of this discrepancy in elemental composition on
neutron microdosimetric measurements is discussed further in section 5.5.
Lucite (or Perspex) is a readily available material often used as a tissue substitute in
phantoms. The tissue converter placed above the silicon microdosimeter in this work
was constructed of Lucite. This material was selected due to availability, low cost and
construction ease. The hydrogen content is slightly lower than for muscle and there is
no nitrogen. Like A150, the carbon and nitrogen contents do not correctly reflect
muscle. Again, the effect of this discrepancy in elemental composition will be discussed
further in section 5.5.
Table 5.1. Elemental composition of important tissue types, substitutes and detector materials.
Muscle(StriatedICRU, 1964)
A150 Lucite Silicon
Atom Z A Atomic%
Mass%
Atomic%
Mass%
Atomic%
Mass %
Mass &Atomic %
H 1 1.01 63.31 10.2 58.26 10.1 53.33 8.05 -C 6 12.01 6.41 12.3 37.61 77.7 33.33 59.98 -N 7 14.01 1.56 3.5 1.45 3.5 - - -O 8 16.00 28.51 72.91 1.89 5.2 13.33 31.96 -F 9 19.00 - - 0.52 1.7 - - -Na 11 22.99 0.02 0.08 - - - - -Si 14 28.09 - - - - - - 100.00P 15 30.97 0.04 0.2 - - - - -S 16 32.06 0.10 0.5 - - - - -K 19 39.10 0.05 0.3 - - - - -Ca 20 40.08 0.001 0.007 0.26 1.8 - - -Mean Atomic Mass 14.10 11.80 12.40 28.09Density (g/cm3) 1.04 1.127 1.2 2.32Atomic Density×1023 atoms/cm3
1.00 1.17 1.08 0.50
Electron Density×1023 atoms/cm3
3.44 3.73 3.90 6.99
Note 1: The Mean Atomic Mass was calculated as the mass weighted average (i.e. sum(mass fractioni × Ai))2: Lucite (or Perspex) is Polymethyl Methacrylate, C5H802 [126].3: Definition of Muscle (Striated ICRU,1964) and A150 from Appendix C [11]

Chapter 5: Tissue equivalence correction Page 123
123
5.2 Microdosimetry TE Correction FactorFrequently when analyzing microdosimeter performance researchers have often
concentrated on LET. However, the energy deposited in a microdosimeter depends upon
the integral of the particle LET over the chord length traversed. This implies that one
should consider the particle range-energy relationship rather than the LET-range
relationship as a starting point in analyzing microdosimetry tissue equivalence. The
equation for range of a particle with initial energy Emax is
RdE
dxdE
E= −FHG
IKJ
−
z1
0
max
(5.3)
where dE/dx is the particle LET or linear stopping power. Particles primarily lose
energy via coulomb interactions with the material's electrons. An approximate
relationship for dE/dx is given by the Bethe formula based on relativistic quantum
mechanics [23]:
− = − − −LNM
OQP
dE
dx
e z
m vNZ
m v
I
v
c
v
c
4 21
4 2
02
02 2
2
2
2
πln ln( ) (5.4)
where v and ze are the velocity and charge of the particle, N and Z are the number
density and atomic number of the absorber atoms, m0 is the electron rest mass, and e is
the electronic charge. The parameter I represents the average excitation and ionization
potential of the absorber and is normally treated as an experimental parameter for each
element. The following approximate empirical formula may be used to estimate the I
value in eV for an element with atomic number Z [183].
I
Z
Z==
+ ≤ ≤RS|T|
19 0 1
112 117
. ,
. .
eV (hydrogen)
eV, 2 Z 13
52.8 +8.71Z eV, Z > 13
(5.5)
When the material is a compound or mixture, the stopping power may be calculated by
simply adding the contributions from the individual constituents (Bragg additivity rule).
If there are T elements with the i-th element described by an atomic density Ni
atoms/cm3, atomic number Zi and mean excitation energy Ii then we use:
n I N Z Ii i ii
T
ln ln==∑
1
(5.6)

Chapter 5: Tissue equivalence correction Page 124
124
where n is the total number of electrons/cm3 in the material (= NZ). For non-relativistic
particles, only the first term in the brackets of equation (5.4) is significant. In comparing
different materials as absorbers dE/dx depends primarily on NZ (the electron density),
which is outside the logarithmic term.
Unfortunately, the integral formed by applying equation (5.4) into (5.3) does not have a
simple analytic solution. Nevertheless, a semi-empirical scaling formula for range
(sometimes called the Bragg-Kleeman rule) enables the comparison of ranges in
different materials [23].
R
R
A
A2
1
1 2
2 1
≅ρ
ρ(5.7)
where ρ and A represent density and atomic weight and the subscripts refer to different
materials. The accuracy of this estimate diminishes with large differences in atomic
number. Note that the equation is independent of the ion type, charge or energy. Higher
accuracy in range comparisons may be gained by using Ziegler's SRIM (Stopping and
Ranges of Ions in Matter) program [126, 184]. Note that the range considered in this
discussion is the mean range since as discussed in chapter 3, range and energy
straggling produce a distribution of ranges for a given incident particle energy.
The general shape of the range-energy and LET-range relationships is quite similar
between different materials for all ion types. Therefore, the range-energy curve in one
material E1(R) will approximate the range-energy curve of another E2(r) provided the
ranges are scaled appropriately according to equation (5.7) or using other range
calculations. That is,
E R E R
RR
R
A
A
1 2
2
1
1 2
2 1
( ) ( )≅
≅
ζ
ζρ
ρwhere = range and =
(5.8)
The energy deposited Edep1 by a charged particle traversing a reference volume with
material denoted by subscript 1 is given by
EdE
dxdx
E b E a
dep a
b
11
1
1
1 1 1 1
=
= −
z( ) ( )
(5.9)

Chapter 5: Tissue equivalence correction Page 125
125
where s1 = b1-a1 is the chord length. Similarly, for another volume of differing material
denoted by subscript 2 the energy deposited Edep2 is given by
EdE
dxdx
E b E a
dep a
b
22
2
2
2 2 2 2
=
= −
z( ) ( )
(5.10)
where s2 = b2-a2 is the chord length. Using equation (5.8) substituted into (5.10) gives
E E b E adep2 1 2 1 2≅ −( / ) ( / )ζ ζ (5.11)
Comparing equations (5.9) and (5.11) indicates that the energy deposited in the two
volumes will be equal (Edep1= Edep2) provided that b1 = b2/ζ and a1 = a2/ζ which equates
to s2 = ζs1. That is, the energy deposited is equal in the two volumes if the chord lengths
are scaled by the factor ζ. For multiple chords, the scaling requires equivalent shapes
(and chord length distribution shape) with a scaling of the linear dimensions. More
generally, assuming identical charged particle spectra, the microdosimetric energy
spectrum will be equivalent in two volumes of differing composition if the shape of the
volumes is the same and the dimensions are scaled by the factor ζ.
For a tissue rectangular parallelepiped (RPP) with dimensions x×y×z the required
scaling is ζ x×ζ y×ζ z of silicon. Note that this holds for any RPP (it is not necessary
that x=y=z) and for other shapes such as a cylinder (the radius and length are scaled) or
a sphere (radius scaling only). The scaling factor simply applies to each linear
dimension. To obtain equal TE lineal energy (E/ l ) in both a tissue volume and a
correctly scaled silicon volume we must use the same mean chord length l ,
corresponding to the tissue volume, since the energy deposited is the same.
The required scaling factor ζ may be estimated by equation (5.7). Values calculated for
various materials with respect to muscle are shown in Table 5.2. The scaling factor
calculated for 1 MeV protons, using the projected range algorithm (PRAL) option of
SRIM [126, 184], is within 7% of the factor calculated using the approximate equation
(5.7). The tissue equivalence factor for Lucite is quite close (within 5%) of the factor for
A150.
Note that the possible equivalence of silicon and tissue via a geometrical scaling factor
assumes that the charged particle spectra are equivalent. To obtain equivalent charged

Chapter 5: Tissue equivalence correction Page 126
126
particle spectra the atomic composition of the volumes should closely match in order to
obtain the same interactions (capture, elastic, inelastic and nuclear reactions) and
subsequent reaction products. In the case of a silicon detector, we require the use of a
tissue substitute converter lying above the detector. Furthermore, the range of recoil
particles should be such that crossers and stoppers dominate the microdosimetric
spectrum as discussed extensively in chapter 3.
Table 5.2. Tissue equivalence scaling factor for A150, Lucite and Silicon
A150 Lucite Siliconζ from equation (5.7) 0.84 0.81 0.63ζ from PRAL (1MeV protons) 0.88 0.84 0.68
Note: The range of 1 MeV proton in muscle is 23.03 um calculated using PRAL, the projected range algorithm option of SRIM [126, 184]
5.3 Summary of Conditions for Tissue EquivalenceIn summary, to obtain tissue equivalence the silicon detector/ TE converter must satisfy
four main conditions
1. The geometrical TE scaling factor for the silicon detector (ζ = 0.63) should apply to
all ion products
2. T.E converter must closely approximate tissue atomic composition with respect to
atoms generating the dominant secondary charged particles.
3. The proportion of interactions with silicon must be negligible in comparison with
converter interactions. That is, events should originate from converter recoil
products or primary ions rather than from within silicon.
4. The range of recoil particles should be such that crossers and stoppers dominate the
microdosimetric spectrum as discussed extensively in chapter 3
The effect of tissue substitute composition will be further discussed in section 5.5 were
we consider Fast Neutron Therapy (FNT) and Proton Therapy (PT) conditions. The
concept of scaling ranges to establish tissue equivalence will be further clarified by
consideration of the Boron Neutron Capture Therapy (BNCT) reactions in the following
section.

Chapter 5: Tissue equivalence correction Page 127
127
5.4 Boron Neutron Capture Therapy Tissue EquivalenceThe principle and application of microdosimetry to BNCT is described in chapter 7. In
this section, the interaction of neutron capture products with silicon and tissue will be
considered in detail to test TE relationships uncovered in the previous section.
5.4.1 Comparison of Silicon and Tissue BNCT Range-EnergyRelationships1
The BNCT reactions provide an excellent platform for testing the geometrical TE factor
discussed in the previous section. Four ion types over a range of energies are involved.
The primary thermal neutron reactions with tissue are as follows:
714
01
614
11
510
01 6 3%
37
24
93 7%.37
24
630
2790
2310
N n C p Q keV
B n Li He Q keV
Li He Q keV
+ → + =
+ → + =
→ + + =
.
.
. γ
Table 5.3. Summary of Energy-Range data for ions produced by thermal neutron interactions withnitrogen and boron
Energy Range(µµm)Reaction Ion (keV) Tissue Silicon
14N(n,p)14C p 590 10.5 7.214C 40 0.20 0.12
10B(n,α)7Li α (6.3%) 1780 9.3 6.37Li (6.3%) 1010 4.6 2.8α (93.7%) 1470 7.7 5.17Li (93.7%) 840 4.1 2.5
Table 5.4. Summary of interaction data for selected BNCT conditions♣♣
Reaction σσ(barns/atom)
Interactions/µµm3
Ions P(ion pairemitted)
14N(n,p)14C 1.81 0.0272 p, 14C 0.3710B(n,α)7Li 3837 0.0462 α, 7Li (6.3%) 0.04
α, 7Li (93.7%) 0.59♣ Both reactions are for a neutron fluence of 1013
n/cm2 [186]Nitrogen concentration 3.5g/100g, Boron concentration 20µg/g.For other concentrations and fluence the interactions per unit volume changes proportionally.P(ion pair emitted) is the proportion of interactions which produce the respective ion pair.
The ion products and their energies are summarized in Table 5.3. Ion range and energy
data for each of these ions was calculated using the computer code SRIM [126]. The
data was calculated for both silicon and tissue using the projected range algorithm
1 The work presented in this section and the following one was originally published by the author in 1998[185] P. D. Bradley and A. B. Rosenfeld, "Tissue Equivalence Correction for Silicon MicrodosimetryDetectors in Boron Neutron Capture Therapy," Med. Phys., vol. 25, pp. 2220-2225, 1998..

Chapter 5: Tissue equivalence correction Page 128
128
(PRAL) option of SRIM [126, 184]. This option provides range-energy tables that are
within a few percent of the more accurate but time consuming TRIM-Monte-Carlo
calculations available in SRIM. The accuracy of PRAL was considered adequate for our
purposes given that we are primarily interested in a comparative study between silicon
and tissue. TRIM-Monte-Carlo calculations using the ion/energy combinations given in
Table 5.3 yielded average longitudinal range estimates within 2% of the PRAL
estimated ranges.
Tissue was modeled as per ICRU striated muscle, which is defined with an elemental
composition and density given in Table 5.1. Using these models, the range-energy data
is plotted in Figure 5.2 for the ions relevant to BNCT. The corresponding LET versus
energy and LET versus range relationships are provided in Figure 5.3 as a useful
reference. A 5th order polynomial was fitted to the range-energy data for each of the
ion/target combinations with the results given below.
H, He, Li and C ions in Silicon:
E r H Silicon r r r r r
E r He Silicon r r r r r
E r Li Silicon r r r r r
E r C Silicon r r r r r
( , , ) . . . . .
( , , ) . . . . .
( , , ) . . . . .
( , , ) . .
= − + − + +
= − + − + +
= − + − +
= − × + − + +
0 07492 1713 13 27 34 89 80 99
0 2455 1581 5149 198 7 9 229
4 398 44 75 1416 6399 1411
2 442 10 862600 109200 5922 2118
5 4 3 2
5 4 3 2
5 4 3 2
6 5 4 3 2
H, He, Li and C ions in Muscle:
E r H Mucsle r r r r r
E r He Muscle r r r r r
E r Li Muscle r r r r r
E r C Muscle r r r r r
( , , ) . . . . .
( , , ) . . . . .
( , , ) . . . . .
( , , ) . .
= − + − + +
= + − + +
= − + + +
= − × + − + +
0 01148 0 398 4 787 212 40 05
0 00564 01188 584 58 06 17 36
0 03762 1534 1173 6 404 72 66
1660 10 97530 20210 1727 146 5
5 4 3 2
5 4 3 2
5 4 3 2
5 5 4 3 2
The above equations are only valid up to the ion ranges specified in Table 5.3.
Comparison of the range-energy relationships for tissue and silicon indicates that the
data may be related by a simple scaling factor, ζ. Scaling the silicon plots by
substituting 0.63 r (ζ = 0.63) into the above equations yields a close approximation to
the tissue range-energy relationship as shown in the right hand plots of Figure 5.2.
These results are completely consistent with the previous discussion and value of ζ
given in Table 5.2. As predicted by equation (5.7), the ratio ζ of the ion range in silicon
to the range in tissue is only weakly dependent on the ion species and energy. Note that

Chapter 5: Tissue equivalence correction Page 129
129
the geometrical scaling is not obvious by inspection of the LET curves provided in
Figure 5.3.
An average value of ζ was calculated for each ion using the following equation:
ζ ( )( , , )
( , , )max
max
ionE
R E ion silicon
R E ion tissuedE
E= z1
0(5.12)
where R(E, ion, target) is the range as a function of energy (E) for the required ion and
target. Values of ζ for each ion are shown in Table 5.5. The optimum scaling factor, ζ,
is dependent on the contribution of each ion to the energy deposition spectra which in
turn is dependent on the segment length distribution of the sensitive volume, ion energy
and relative frequency of ion generation. An approximate scaling factor was calculated
by weighting each ion according to the energy of the ion and the relative frequency of
generation. The required cross-section and boron and nitrogen concentrations are given
in Table 5.4 taken from typical values used by Charlton [186]. The final weighted
average scaling factor is ζ = 0.63. The maximum deviation from this scaling factor is
8% and occurs for the highest energy proton. This factor is in excellent correspondence
with the approximate range ratio equation (5.7). Note, that a more accurate weighting of
ions would consider the difference in contribution to dose mean lineal energy yD of the
various ions. Ions depositing a higher energy (usually higher LET ions) contribute more
to yD and thus should be assigned a higher weighting factor.
Table 5.5. Mean ratio of BNCT ion ranges in silicon and tissue
Ion ζζ WeightH 0.65 0.13He 0.64 0.55Li 0.60 0.31C 0.60 0.01Weighted Av. 0.63
Note: Weight is an approximate measure of thecontribution of the ion to BNCT energy deposition spectra

Chapter 5: Tissue equivalence correction Page 130
130
-5
0
5
10 0
2
40
2
4
Alpha
Li
Proton
C
-5
0
5
10
0
2
4
-5
0
5
10 0
2
40
2
4
Alpha
Li
Proton
C
-5
0
5
10
0
2
4
Silicon (RPP: 3.15××3.15××3.15µµm3) Tissue (RPP: 5××5××5µµm3)
Figure 5.1. Comparison of BNCT ion product ranges in tissue and silicon. The silicon RPPdimensions have been scaled by 0.63 times the tissue dimensions. Note that the figure on the left(silicon) is an exact scale miniaturization of the figure on the right (tissue). These volumes will haveequivalent microdosimetric spectra assuming equal concentrations of nitrogen and boron.

Chapter 5: Tissue equivalence correction Page 131
131
2 4 6 8 10
rH mmL100
200
300
400
500
EH VekL
Muscle HICRU LSilicon
Energy-Range of H ion
2 4 6 8 10
rH mmL100
200
300
400
500
EH VekL
Muscle HICRULSiliconHr scaled 1ê0.63LEnergy-Range of H ion
2 4 6 8
rHmmL250
500
750
1000
1250
1500
1750
EH VekL
Muscle HICRU LSilicon
Energy-Range of He ion
2 4 6 8
rHmmL250
500
750
1000
1250
1500
1750
EH VekL
Muscle HICRULSiliconHr scaled 1ê0.63LEnergy-Range of He ion
1 2 3 4
rHmmL
200
400
600
800
1000
EH VekL
Muscle HICRU LSilicon
Energy-Range of Li ion
1 2 3 4
rHmmL
200
400
600
800
1000
EH VekL
Muscle HICRULSiliconHr scaled 1ê0.63LEnergy-Range of Li ion
0.05 0.1 0.15 0.2
rHmmL5
10
15
20
25
30
35
40
EH VekL
Muscle HICRU LSilicon
Energy-Range of C ion
0.05 0.1 0.15 0.2
rHmmL5
10
15
20
25
30
35
40
EHVek L
Muscle HICRULSiliconHr scaled 1ê0.63LEnergy-Range of C ion
Figure 5.2. Range-Energy relationships for BNCT products (H, He, Li and C) in ICRU muscle andSilicon. The right-hand side shows the same plot as the left except for the silicon range scaled by1/0.63. In addition, the plots display original SRIM generated data points used for the 5th orderpolynomial fit.

Chapter 5: Tissue equivalence correction Page 132
132
0 100. 200. 300. 400. 500. 600.Energy HkeVL
0
20.
40.
60.
80.
100.
120.
TEL
H Vekêmu
L
H in Muscle
H in Si
0 2. 4. 6. 8. 10.RangeHumL
0
20.
40.
60.
80.
100.
120.
TEL
HVekêmu
L
H in Muscle
H in Si
0 250. 500. 750. 1000. 1250. 1500. 1750.Energy HkeVL
0
50.
100.
150.
200.
250.
300.
350.
TEL
H Vekêmu
L
He inMuscle
He inSi
0 2. 4. 6. 8.RangeHumL
0
50.
100.
150.
200.
250.
300.
350.
TEL
HVekêmu
LHe inMuscle
He inSi
0 200. 400. 600. 800. 1000.Energy HkeVL
0
100.
200.
300.
400.
500.
TEL
HVek êmu
L
Li in Muscle
Li in Si
0 1. 2. 3. 4.RangeHumL
0
100.
200.
300.
400.
500.
TEL
HVekêmu
L
Li in Muscle
Li in Si
0 10. 20. 30. 40.Energy HkeVL
0
50.
100.
150.
200.
250.
TEL
HVek êmu
L
C in Muscle
C in Si
0 0.05 0.1 0.15 0.2RangeHumL
0
50.
100.
150.
200.
250.
TEL
HVekêmu
L
C in Muscle
C in Si
Figure 5.3. LET versus energy (left) and LET versus range(right) for BNCT Products(H, He, Li and C) in ICRU muscle and Silicon. The maximum range is plotted only up to thecorresponding maximum energy.

Chapter 5: Tissue equivalence correction Page 133
133
5.4.2 Comparison of Silicon and Tissue BNCT Energy Deposition Spectra
5.4.2.1 Method: Monte Carlo Program
A Monte Carlo program was developed in order to confirm that the energy deposition in
appropriately scaled silicon volumes may approximate the deposition in tissue. The use
of Monte Carlo methods to calculate microdosimetric spectra in cell sized volumes
exposed to BNCT and other high LET ions is well established [186]. It is generally
assumed that the path of the ions follow straight lines with negligible straggling and that
the width of the track is negligible in comparison to the volume size. These assumptions
are valid for micrometer sized volumes and low energy ions as confirmed by
comparative calculations performed by Charlton [187] on detailed track structure versus
simple chord length/LET calculations.
The program description begins by defining two types of volumes:
1. Generation volume (GV) in which ions are generated assuming a nitrogen
concentration of 3.5 g/100g and a boron concentration of 20 µg/g. These are typical
values as used by Charlton [186]. The probability of formation of the various ion
pairs and the number of interactions per µm3 are given in Table 5.4.
2. Sensitive volume (SV) in which we compute the energy deposited by the traversal of
ions generated in the GV.
The shape of both volumes is defined as an RPP with dimensions x×y×z all in µm. Such
a shape is selected on the basis that the SV of silicon reverse biased p-n junctions has
traditionally been modeled as an RPP (See chapter 3 for a complete discussion on
detector shape). The position of the GV with respect to the SV has no restriction with
partial or even complete overlapping allowed.
The Monte Carlo process may be summarized by the following steps:
1. Randomly select an ion pair with initial energy and range given by Table 5.3
according to the probability specified in Table 5.4.
2. Randomly select the position of the interaction within the GV and the angle of ion
emission with equal probability for all points within the GV and all angles. Note that
ion pairs are emitted at 180 degrees.

Chapter 5: Tissue equivalence correction Page 134
134
3. Calculate the points of intersection of the emitted ions with the SV. This may be
approached by solving the simultaneous equations of a line intersecting an RPP in a
similar manner as Charlton [188] for an ellipsoid. Alternatively, one may
incrementally follow the ion path at sufficiently small increments (0.01µm), testing
at each increment to check for traversal of the SV boundary. The latter approach
was adopted despite the longer computation time since it is more adaptable to future
versions that may operate on complex geometry.
The main Monte-Carlo routines were coded in C for computational speed. These
routines were encapsulated within a Mathematica [141] based input/output framework
to provide flexibility in program input and output analysis.
Software validation of such programs is a non-trivial task since it is often difficult to
construct cases of sufficient simplicity that analytic solutions may be derived for result
comparison. The software was modified slightly to calculate segment length
distributions. Such distributions have been analytically derived by Bradford [122, 137]
(based on the work of Kellerer [128]) for an RPP volume under the condition of µ-
randomness and fixed length tracks as discussed in chapter 3. Exact segment length
distributions were calculated using the Mathematica notebook shown in Appendix B
(and described in chapter 3) and compared against the Monte Carlo results. Figure 5.4
displays the close correspondence between the analytic and Monte Carlo derived
distributions thus validating a substantial portion of the software. The remainder of the
software was tested by thorough review and testing of individual functions.
1 2 3 4 5 6
sHsegment length- mmL
0.1
0.2
0.3
0.4
0.5
ps
Figure 5.4. Comparison of analytic and Monte Carlo generated segment length distribution (P(s))for an RPP volume 3.5 ×× 3 ×× 2.5 µµm enclosed in a uniform isotropic field of 7 µµm length rays.

Chapter 5: Tissue equivalence correction Page 135
135
Silicon
5
5
5
Silicon
5
5
5
Rest: Silicon
Figure 5.5. Geometry Case 1 - SV and GV are identical in size and position
500 1000 1500 2000 2500
Energy HkeV L
0.0005
0.001
0.0015
0.002
evitaleR
ycneuqerF
ytilibaborP
SiliconSV: 3.15x3.15x3.15um
TissueSV:5.x5.x5.um
Samples : 100000.
Figure 5.6. Geometry Case 1 (Example 1):Energy Deposition Spectra comparison of Silicon (3.15 ×× 3.15 ×× 3.15 µµm) and Tissue (5 ×× 5 ×× 5µµm).
500 1000 1500 2000 2500
EnergyHkeV L0.00025
0.0005
0.00075
0.001
0.00125
0.0015
evitaleR
ycneuqerF
ytilibaborP
TissueSV:7.94x7.94x7.94um
SiliconSV: 5.x5.x5.um
Samples : 100000.
Figure 5.7. Geometry Case 1 (Example 2):Energy Deposition Spectra comparison of Silicon (5 ×× 5 ×× 5 µµm) and Tissue (7.9 ×× 7.9 ×× 7.9 µµm).

Chapter 5: Tissue equivalence correction Page 136
136
Silicon
5
5
5Tissue
26.2
26.2
10.6
Rest: Silicon
Figure 5.8. Geometry Case 2 - GV is a large tissue volume above a much smaller silicon/tissue SV
200 400 600 800 1000 1200 1400 1600
Energy HkeV L
0.001
0.002
0.003
0.004
0.005
evitaleR
ycneuqerF
ytilibaborP SiliconSV: 3.15x3.15x3.15um
TissueSV: 5.x5.x5.um
Samples : 100000.
Figure 5.9. Geometry Case 2 (Example 1):Energy Deposition Spectra comparison of Silicon (3.15 ×× 3.15 ×× 3.15 µµm) and Tissue (5 ×× 5 ×× 5µµm).
200 400 600 800 1000 1200 1400 1600
Energy HkeV L
0.001
0.002
0.003
0.004
0.005
evitaleR
ycneuqerF
ytilibaborP TissueSV: 7.94x7.94x7.94um
SiliconSV: 5.x5.x5.um
Samples : 100000.
Figure 5.10. Geometry Case 2 (Example 2):Energy Deposition Spectra comparison of Silicon (5 ×× 5 ×× 5 µµm) and Tissue (7.9 ×× 7.9 ×× 7.9 µµm).

Chapter 5: Tissue equivalence correction Page 137
137
5.4.2.2 Results: Geometry Case 1 - Ion generation in RPP volumes with SV=GV.
Geometry Case 1 consists of identical SV and GV of the same material (silicon or
tissue). Figure 5.5 illustrates the case for a 5×5×5 µm3 volume of silicon. We assume
that both silicon and tissue contain the same concentration of boron and nitrogen. This
case corresponds to the BNCT scenario in which a B-10 compound is uniformly
distributed throughout the cell. However, a corresponding silicon detector cell is limited
to measuring only the boron capture component. Boron may be easily introduced by
using p doped Si arrays as proposed by Rosenfeld [71]. The introduction of nitrogen
into the body of a silicon diode is a much more difficult proposition. Nitrogen
concentrations required for an acceptable probability of nitrogen capture are too high for
maintaining device operation. Note, that nitrogen may be introduced into surrounding
insulating layers (e.g. Si3N4 is commonly used for passivation). Nevertheless, for the
purpose of testing the silicon/tissue scaling factor, we compare a hypothetical device
assuming tissue concentrations of nitrogen and boron.
Figure 5.6 and Figure 5.7 illustrate the energy deposition spectra (normalized) for
silicon and tissue with the dimensions of silicon scaled by 0.63 in each case. Clearly, the
energy deposition spectra are vastly different for similar volumes of tissue and silicon.
However, a comparison of silicon volumes scaled by ζ =0.63 with tissue volumes
indicates quite good correspondence between spectra. Note that the step in probability at
840 keV corresponds to the lithium ion as given in Table 5.3. This ion has a range small
enough to be a complete insider. A similar step occurs at 40 keV corresponding to the
carbon recoil.
5.4.2.3 Results: Geometry Case 2-Ion generation above RPP volume
Geometry Case 2 consists of a large GV placed directly on top of a much smaller SV.
The GV material is tissue whilst the remaining volume including the SV consists of
either tissue or silicon. This case is not hypothetical since it is easy to construct an
overlayer with the appropriate concentrations of boron and nitrogen without
compromising silicon device operation. Figure 5.8 illustrates the case for a silicon SV of
dimensions 5×5×5 µm3. The GV dimensions are selected such that the boundaries are
further from the SV than the longest range ion (590 keV proton -10.5 µm). Thus, we
effectively model a volume of infinite extent away from the SV. Such a situation
models a layer of tissue equivalent plastic (or real cells) impregnated with appropriate
boron concentrations and placed above a silicon cell (within an integrated circuit). We

Chapter 5: Tissue equivalence correction Page 138
138
then compare the energy deposition in an appropriately scaled silicon cell to that which
may occur if a tissue cell was substituted as the SV. Again the normalized results shown
in Figure 5.9 and Figure 5.10 confirm that, with appropriate geometrical scaling, silicon
detectors with well known geometry will record energy deposition spectra
representative of tissue cells of equivalent shape. Again, note the significant differences
in spectra between the two figures (tissue 5×5×5 µm3 in Figure 5.9 and silicon 5×5×5
µm3 in Figure 5.10) indicating the importance of using an appropriate scaling factor.
5.5 Fast Neutron Therapy and Proton Therapy TissueEquivalenceExperimental microdosimetry is commonly applied to the characterization of fast (>1
MeV) neutron and proton beams. The conditions necessary for TE of a silicon/TE
converter microdosimeter were summarized in section 5.3. Each of these conditions will
now be addressed for the case of fast neutron therapy (FNT) and proton therapy (PT).
The emphasis will be on FNT since for PT the absorbed dose for proton energies less
than 250 MeV is dominated by electronic interactions with the protons. The recoil
products in PT are similar in energy and type (but not relative contribution) to FNT so
the discussion on TE of FNT is largely applicable to PT. Further discussion of neutron
therapy and proton therapy are provided in chapter 8 and chapter 9, respectively.
5.5.1 Geometrical TE scaling factor for FNT and PTThe main ion products from fast neutron reactions include protons, alphas, and heavy
ion recoils (carbon, oxygen recoil and to a lesser extent nitrogen). As an example, the
initial spectrum of charged particles for 14 MeV neutrons in ICRU tissue was
calculated by Caswell and Coyne [125] and shown in Figure 5.11. From this data for 14
MeV neutrons; protons have energies up to 14 MeV, alphas may have energies up to
about 13 MeV, carbon up to 6 MeV and oxygen up to 3 MeV. The range-energy
relationships for these ions are shown in Figure 5.14 and the LET relationships are
given in Figure 5.15. In addition, the range-energy relationship for fast protons is
displayed up to 200 MeV in Figure 5.13. The mean ratios of ranges in tissue and
silicon, calculated as per equation (5.12), are displayed in Table 5.6. In general, the
previously calculated scaling factor of 0.63 is reasonable, although the mean ratio drops
to 0.58 for high energy protons. For microdosimetric spectrum dominated by high
energy protons, one may consider reducing the geometric scaling factor. Note, that in

Chapter 5: Tissue equivalence correction Page 139
139
many cases the higher LET ions, although relatively infrequent, contribute significantly
to the dose mean lineal energy. Additional weighting should then be applied to such
ions when estimating the optimal scaling factor.
Figure 5.11. Initial spectrum of charged particles for a neutron fluence of 1 cm-2 of 14 MeVneutrons in ICRU tissue (from Caswell and Coyne [125] and ICRU report 36 p39 [11]). Thesymbols p, d and αα refer to recoil protons, deuterons and alpha particles, respectively,
Table 5.6. Mean ratio of Fast Neutron/Proton Therapy ion ranges in silicon and tissue
Ion ζζH (0-14 MeV) 0.62H (0-200 MeV) 0.56He 0.66C 0.63O 0.61

Chapter 5: Tissue equivalence correction Page 140
140
0.1 0.5 1. 5. 10. 50. 100.EnergyHMeVL
0.56
0.58
0.6
0.62
0.64
0.66
0.68
HeussiT
egnaR
LêHnocili
Segna
RL
O
C
He
H
Figure 5.12. Ratio of tissue range over silicon range as a function of ion energy for main ions inNeutron and Proton Therapy.
The ratio of tissue range over silicon range as a function of ion energy is shown for
various ions up to 200 MeV in Figure 5.12. This provides a useful reference for
calculating the required ζ factor given information on the energy spectrum of secondary
recoil products. Curves for different ions follow a common shape shifted to the right
according to the ion's atomic number. The Bragg peak in the LET curve for each ion
shifts to higher energies as the atomic number rises, although the main peak in Figure
5.12 is at an energy somewhat higher than the Bragg peak for each ion. An empirical
equation should be extractable from Figure 5.12, with ion atomic number as a
parameter, although this was not attempted.
50 100 150 200 250
rHmmL25
50
75
100
125
150
175
200
EH VeML
MuscleHICRULSilicon
Energy-Range of H ion
50 100 150 200 250
rHmmL25
50
75
100
125
150
175
200
EHVeM L
MuscleHICRU LSiliconHr scaled 1ê0.63LEnergy-Range of H ion
Figure 5.13. Range-Energy relationships for fast protons in ICRU muscle and Silicon. The right-hand side shows the same plot as the left except for the silicon range scaled by 1/0.63.

Chapter 5: Tissue equivalence correction Page 141
141
500 1000 1500 2000
rHmmL2000
4000
6000
8000
10000
12000
14000E
HVek L
MuscleHICRULSilicon
Energy-Range of H ion
500 1000 1500 2000
rHmmL2000
4000
6000
8000
10000
12000
14000
EHVek L
MuscleHICRU LSiliconHr scaled 1ê0.63LEnergy-Range of H ion
20 40 60 80 100 120 140 160
rHmmL2000
4000
6000
8000
10000
12000
EVek
MuscleHICRULSilicon
Energy-Range of He ion
20 40 60 80 100 120 140 160
rHmmL2000
4000
6000
8000
10000
12000
EVek
MuscleHICRU LSiliconHr scaled 1ê0.63LEnergy-Range of He ion
2 4 6 8
rHmmL1000
2000
3000
4000
5000
6000
EH VekL
MuscleHICRULSilicon
Energy-Range of C ion
2 4 6 8
rHmmL1000
2000
3000
4000
5000
6000
EHVek L
MuscleHICRU LSiliconHr scaled 1ê0.63LEnergy-Range of C ion
1 2 3 4 5
rHmmL500
1000
1500
2000
2500
3000
3500
4000
EHVekL
MuscleHICRULSilicon
Energy-Range of O ion
1 2 3 4 5
rHmmL500
1000
1500
2000
2500
3000
3500
4000
EHVek L
MuscleHICRU LSiliconHr scaled 1ê0.63LEnergy-Range of O ion
Figure 5.14. Range-Energy relationships for the main reaction products of fast neutron beams (H,He, C and O) in ICRU muscle and Silicon. The right-hand side shows the same plot as the leftexcept for the silicon range scaled by 1/0.63.

Chapter 5: Tissue equivalence correction Page 142
142
0 2000. 4000. 6000. 8000. 10000.12000.14000.Energy HkeVL
0
20.
40.
60.
80.
100.
120.
TEL
H Vekêmu
L
H in Muscle
H in Si
0 500. 1000. 1500. 2000.RangeHumL
0
20.
40.
60.
80.
100.
120.
TEL
HVekêmu
L
H in Muscle
H in Si
0 2000. 4000. 6000. 8000. 10000. 12000.Energy HkeVL
0
50.
100.
150.
200.
250.
300.
350.
TEL
H Vekêmu
L
He inMuscle
He inSi
0 25. 50. 75. 100. 125. 150.RangeHumL
0
50.
100.
150.
200.
250.
300.
350.
TEL
HVekêmu
LHe inMuscle
He inSi
0 1000. 2000. 3000. 4000. 5000. 6000.Energy HkeVL
0
200.
400.
600.
800.
1000.
1200.
TEL
H Vekêmu
L
C in Muscle
C in Si
0 2. 4. 6. 8.RangeHumL
0
200.
400.
600.
800.
1000.
1200.
TEL
HVekêmu
L
C in Muscle
C in Si
0 1000. 2000. 3000. 4000.Energy HkeVL
0
250.
500.
750.
1000.
1250.
1500.
TEL
H Vekêmu
L
Oin Muscle
Oin Si
0 1. 2. 3. 4. 5.RangeHumL
0
250.
500.
750.
1000.
1250.
1500.
TEL
HVekêmu
L
Oin Muscle
Oin Si
Figure 5.15. LET versus energy (left) and LET versus range (right) for Fast Neutron TherapyProducts (H, He, C and O) in ICRU muscle and Silicon. The maximum range is plotted only up tothe corresponding maximum energy.

Chapter 5: Tissue equivalence correction Page 143
143
5.5.2 Effect of converter atomic composition in FNT
Given that the TE geometrical scaling factor ζ = 0.63 is a reasonable approximation for
a wide range of ion types and energy, one must now consider the production of
secondary particles in a fast neutron environment. At neutron energies below 10 MeV
the bulk of absorbed energy is due to hydrogen recoils except for some narrow
resonances in heavy elements. The proportion of hydrogen in muscle is well
approximated by A150 and 20% lower than desired in Lucite. Both A150 and Lucite
substitute carbon for oxygen in their atomic composition when compared with the
desired muscle composition as shown in Table 5.1. At higher neutron energies elastic
and inelastic collisions with carbon and oxygen become important and appreciable
(>20%) TE induced errors in yd may occur. Table 5.7 gives values of yd for various
substances calculated theoretically by Green [189]. Furthermore, calculations by
Caswell and Coyne [190] have shown considerable differences in the lineal energy
spectra for 20 MeV neutrons between a simulated A150 proportional counter and ICRU
muscle as shown in Figure 5.16.
Table 5.7. Calculated values of yd in A150 and Muscle for various neutron energies En
Material En=5 MeV En=10 MeV En=15 MeV En=19.5 MeVA150 53.8 73.4 101.1 124.7Muscle 49.3 60.3 68.9 64.7
Figure 5.16. Comparison of analytic calculations of yd(y) of 20 MeV neutrons performed for ICRUtissue and for A150 plastic. (from Caswell and Coyne [190] and ICRU report 36 p42 [11])

Chapter 5: Tissue equivalence correction Page 144
144
Aside from simulation comparisons, a first order comparison of tissue equivalent
performance may be gauged by comparing kerma ratios. Kerma is defined as the initial
kinetic energy of all charged particles liberated by the radiation per unit mass and has
the unit of Grays. Kerma data for various materials are tabulated in ICRU report 44
[32] based on the work of Caswell and Coyne [191]. Data is readily available for
Acrylic, A150 and Muscle (Skeletal-ICRU 44). Acrylic (C6H4O2, ρ = 1.17 gm/cm3, H =
7%, C = 56%, O = 37%) is quite close in composition and density to Lucite (C5H8O2, ρ
= 1.2 gm/cm3, H = 8%, C = 60%, O = 32%) and will be used in this comparative study.
Note that the Acrylic mass composition provided in Appendix A of ICRU report 44 is
fortunately in error since it corresponds to Lucite's mass composition. As mentioned in
section 5.1, Muscle (Skeletal-ICRU 1989) is quite close in composition to Muscle
(Striated-ICRU 1964) and sufficient for this comparative study.
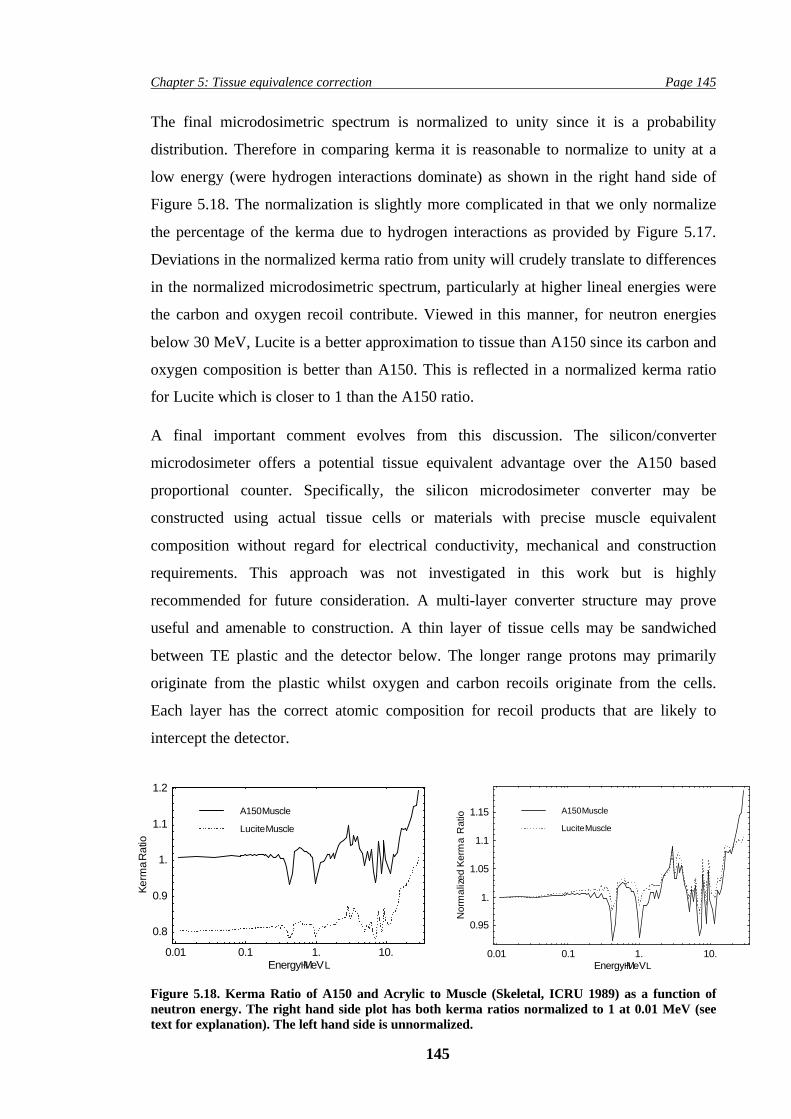
The kerma ratio of A150 and Lucite to muscle (Skeletal, ICRU 1989) is shown in
Figure 5.18. The Lucite kerma is generally 20% lower than A150 due to the 20% lower
hydrogen content. The dips at 0.4 and 1 MeV occur due to oxygen elastic reactions,
which are present in muscle and not in the plastics due to their lower oxygen content.
These reactions have several resonances in the cross-section above 0.4 MeV as shown
in Figure 5.22. The relative contribution of each element to tissue kerma is shown in
Figure 5.17. Above 10 MeV the ratio rise is due to the effect of increasing carbon
kerma contribution from the plastics.
Figure 5.17. Relative contribution from interaction processes with different elements to kerma inmuscle (skeletal) over the neutron energy interval 10 keV-30 MeV. (From p9 ICRU report 44 [32])
Chapter 5: Tissue equivalence correction Page 145
145
The final microdosimetric spectrum is normalized to unity since it is a probability
distribution. Therefore in comparing kerma it is reasonable to normalize to unity at a
low energy (were hydrogen interactions dominate) as shown in the right hand side of
Figure 5.18. The normalization is slightly more complicated in that we only normalize
the percentage of the kerma due to hydrogen interactions as provided by Figure 5.17.
Deviations in the normalized kerma ratio from unity will crudely translate to differences
in the normalized microdosimetric spectrum, particularly at higher lineal energies were
the carbon and oxygen recoil contribute. Viewed in this manner, for neutron energies
below 30 MeV, Lucite is a better approximation to tissue than A150 since its carbon and
oxygen composition is better than A150. This is reflected in a normalized kerma ratio
for Lucite which is closer to 1 than the A150 ratio.
A final important comment evolves from this discussion. The silicon/converter
microdosimeter offers a potential tissue equivalent advantage over the A150 based
proportional counter. Specifically, the silicon microdosimeter converter may be
constructed using actual tissue cells or materials with precise muscle equivalent
composition without regard for electrical conductivity, mechanical and construction
requirements. This approach was not investigated in this work but is highly
recommended for future consideration. A multi-layer converter structure may prove
useful and amenable to construction. A thin layer of tissue cells may be sandwiched
between TE plastic and the detector below. The longer range protons may primarily
originate from the plastic whilst oxygen and carbon recoils originate from the cells.
Each layer has the correct atomic composition for recoil products that are likely to
intercept the detector.
0.01 0.1 1. 10.EnergyHMeVL
0.8
0.9
1.
1.1
1.2
amre
Koita
R
LuciteêMuscle
A150êMuscle
0.01 0.1 1. 10.EnergyHMeVL
0.95
1.
1.05
1.1
1.15
dezila
mroN
amre
Koita
R LuciteêMuscle
A150êMuscle
Figure 5.18. Kerma Ratio of A150 and Acrylic to Muscle (Skeletal, ICRU 1989) as a function ofneutron energy. The right hand side plot has both kerma ratios normalized to 1 at 0.01 MeV (seetext for explanation). The left hand side is unnormalized.

Chapter 5: Tissue equivalence correction Page 146
146
5.5.3 Silicon versus tissue interactions in FNT and PT and range ofsecondary products.To maintain tissue equivalence the silicon microdosimeter must generate a relatively
low proportion of insiders and starters compared with the tissue converter crossers and
stoppers. Therefore, a brief summary of neutron-silicon and proton-silicon interactions
is appropriate, followed by an analysis of relative kerma with tissue.
The important nuclear interactions of neutrons with silicon are summarized as
• Si28(n,n)Si28 elastic scattering
• Si28(n,n`)Si28 inelastic scattering
• Si28(n,p)Al28 nuclear reaction
• Si28(n,α)Mg25 nuclear reaction Q=-2.654 MeV
For neutron energies above a few MeV, nuclear reactions begin to contribute to the
silicon kerma. Nevertheless, elastic scattering dominates the total cross-section (~2
barns) for energies in the tens of MeV range. The silicon recoil energy is often small.
with the maximum recoil energy from an elastic scatter reaction occurring for a
backward scatter event. In this special case, the recoil energy is 0.133 E, where E is the
nucleon incident energy [192]. Small recoil energies are much more probable and these
result in much lower silicon recoil energies.
Similar nuclear reactions also occur for protons incident on silicon. The characteristics
of high-energy proton-nucleus and neutron-nucleus reactions are very similar above 100
MeV. Below 100 MeV, the proton cross-section for silicon interactions is slightly lower
than for neutrons. From about 20 MeV or below, the proton reaction cross section
decreases rapidly because of the proton-nucleus Coulomb barrier. This barrier, however,
does not apply to neutrons.
In general, microdosimetric measurements in proton therapy are only important at the
end of the proton range. In this region, the relevant interactions correspond to no more
than the tens of MeV energy range of fast neutron therapy. Therefore, we restrict the
remainder of this comparative study to fast neutron therapy with typical neutron
energies of less than 30 MeV.

Chapter 5: Tissue equivalence correction Page 147
147
We may consider the kerma ratio with tissue to ascertain the relative probability of
silicon interactions as shown in Figure 5.19. The kerma ratio of silicon to tissue is less
than 0.05 for neutron energies less than 5 MeV. Above this value, the cross-section for
silicon neutron interactions rises more rapidly than for tissue resulting in the kerma ratio
increasing to 0.2 at 15 MeV. The total cross-section (elastic + reaction(inelastic)) is high
for silicon in the tens of MeV range, typically about 2 barns, with the inelastic reaction
cross-section being 40% of the total cross-section as shown in Figure 5.22 and Figure
5.23.
0.01 0.05 0.1 0.5 1. 5. 10.EnergyHMeVL
0.001
0.002
0.005
0.01
0.02
0.05
0.1
0.2
nocili
Sê
elcsu
Ma
mre
Koita
R
Figure 5.19. Kerma Ratio of Silicon to Muscle (Skeletal, ICRU 1989) as a function of neutronenergy .
Some useful data is provided by Schrewe [37] in a very recent and excellent paper on
the experimental estimation of kerma coefficients and dose distributions in various
materials (C, N, O, Mg, Al, Si, Fe, Zr, A-150 plastic, Al2O3, AlN, SiO2 and ZrO2) for
neutron energies up to 66 MeV. Proportional counters of various wall construction were
used to measure dose in mono-energetic neutron fields which under charged particle
equilibrium (CPE) conditions is almost equal to kerma. More precisely, the kerma
coefficients (kΦ or k= kerma/fluence) were derived by the following sequence: measure
the absorbed dose in the cavity gas of the microdosimeter, derive the absorbed dose in
the wall using Bragg-Gray cavity theory, determine the kerma in the wall under CPE
conditions, and then correct for the neutron fluence attenuation in the wall. The kerma
coefficients for materials in the silicon microdosimeter and their ratio to A150 plastic
are shown in Table 5.8.

Chapter 5: Tissue equivalence correction Page 148
148
Table 5.8. Neutron kerma coefficients (k in fGy m2) for Si microdosimeter materials and ratio toA150 from Schrewe [37]. The ratio of Si to A150 kerma is shaded for clarity.
Material 5 MeV 8 MeV 15 MeV 17 MeV 34 MeV 44 MeV 66 MeVA150 (k) 4.546 5.364 6.732 7.505 8.67 8.07 7.95 (k/kA150) 1 1 1 1 1 1 1Si (k) 0.175 0.812 1.436 1.571 2.75 3.05 3.84 (k/kA150) 0.038 0.151 0.213 0.209 0.32 0.38 0.48SiO2 (k) 0.406 0.757 1.914 2.048 3.62 3.99 4.77 (k/kA150) 0.089 0.141 0.284 0.273 0.42 0.49 0.60Al (k) 0.196 0.438 1.140 1.436 2.40 2.82 3.82 (k/kA150) 0.043 0.082 0.169 0.191 0.28 0.35 0.48
Figure 5.20. Dose distributions d(y)k for A150, Si, Al and SiO2 at neutron energies of 5, 8, 15, 17, 34,44 and 66 MeV (from Schrewe [37]). Note, to improve presentation, fixed offsets were added. Inaddition, take care to consider the different scale for the A150 plot.

Chapter 5: Tissue equivalence correction Page 149
149
The values of tissue to silicon kerma derived from Schrewe's data [37] and given in
Table 5.8 are in good agreement with Figure 5.19 although they extend the ICRU data
to several higher energies. The kerma ratios with A150 for the main materials present in
the detector overlayer (Al, SiO2) are similar to Si. The Al ratio is generally lower by a
few percent and the SiO2 kerma ratio with A150 is 20-25% higher than Si at neutron
energies above 15 MeV due to inelastic reactions with oxygen.
Schrewe [37] also provides dose distributions d(y)kΦ weighted by the kerma coefficient
for measurements made using microdosimeters constructed with various materials and
filled with a tissue equivalent propane gas mixture to provide an equivalent site
diameter of 2 µm. These distributions, as shown in Figure 5.20, enable an approximate
estimation of the expected contribution from different elements in the device
construction to the silicon/converter microdosimeter dose distribution. Consider a
hypothetical device with equal volumes of A150 and Si contributing to the detected
secondary charged particle. This may be a reasonable first order approximation to the
current device with an A150 converter located above the detector. At low neutron
energies (<8 MeV) the contribution from silicon to the dose distribution is relatively
small as reflected in the kerma ratio and visual comparison of the dose distributions. As
the neutron energy increases above 8 MeV the contribution to the dose distribution
increases particularly for lineal energies greater than 100 keV/µm. Given that as much
as 30% of the dose may be due to silicon interactions at these lineal energies then one
may expect discernible spectral distortion at neutron energies between 8 and 34 MeV.
Clearly, the minimisation of silicon versus converter volume is required, a point that
will be discussed later in this section. Interestingly, at high neutron energies >34 MeV,
the distortion will be less significant since the shape of the dose distribution for both a
silicon and A150 device are quite similar, particularly at 66 MeV. This behaviour arises
from the decrease in significance of hydrogen reactions and the increased importance of
inelastic reactions with sufficiently similar secondary product deposition spectra in
silicon and A150.
An alternative analysis based on cross-section data will now be presented. Given
appropriate cross-section data the probability of an interaction with silicon and tissue
may also be compared. For sufficiently thin volumes the probability Pc of an incident
particle encountering a nuclear collision is estimated by:

Chapter 5: Tissue equivalence correction Page 150
150
P tc ≅ ρσ (5.13)
where ρ is the atomic density (in atoms/cm3), σ is the cross section (in cm2) and t is the
thickness (in cm). Total interaction cross-section data for silicon and the important
elements of tissue are shown in Figure 5.22 with the inelastic (reaction) cross-sections
compared in Figure 5.23. The hydrogen total cross-section is relatively high for
energies less than about 8 MeV. Above 10 MeV, the cross-section magnitudes are in
order of atomic number with silicon having the highest cross section.
As an example, the relevant data for 14 MeV neutrons is provided in Table 5.9 along
with the probability of interaction for a particle traversing 1 cm of material. The
probability of an interaction is similar in both silicon and tissue. However, 40% of the
interactions in silicon are elastic collisions with poor energy transfer to the recoiling
nucleus. The tissue, with its high hydrogen content, obtains high energy transfer due to
the efficient energy exchange in elastic reactions with hydrogen. The difference in the
energy of the secondary particles accounts for the higher kerma in tissue than in silicon.
The probability of interaction in 1 cm was calculated for energy ranges from 0.1 to 150
MeV in tissue and silicon. The ratio of these interaction probabilities for both total
interactions and inelastic events is displayed in Figure 5.24. The total interaction ratio
ranges from 0.2 to just over 1 in the energy range of most interest to fast neutron
therapy. At neutron energies greater than 20 MeV the ratio steadily rises. For inelastic
reactions, the high silicon cross-section produces a probability of inelastic reaction
which is 2-3 times higher in silicon than tissue.
Nuclear reactions (inelastic) and elastic reactions with oxygen and carbon are of
particular interest in microdosimetry since they produce recoil products with high LET.
The recoil products typically have ranges of the order of a few microns as shown in
Figure 5.14 and Figure 5.15. The alpha and proton by-products of inelastic reactions
have longer ranges typically in the tens of micron range. In comparing silicon to tissue,
the volume in which secondary particles are generated is important in assessing the
probability that an excessive number of events will be generated from within the silicon
compared to the tissue converter. To reduce the probability of silicon events, the silicon
volume should be as small as practicable subject to the shape requirements discussed in
chapter 3 and the practical signal to noise issues discussed in chapter 4. Accurate
estimation of the maximum allowable silicon detector dimensions requires considerable

Chapter 5: Tissue equivalence correction Page 151
151
work in completely simulating (Monte Carlo) the interaction of the required neutron and
proton environments with various tissue converter, overlayer and silicon detector
constructions. Such time consuming calculations were not pursued in this work
although they are highly recommended for follow-on studies. As an interim solution to
gauge the extent of this problem we consider existing calculations for A150
proportional counters.
Fidorra and Booz [106] performed Monte Carlo simulations of a 5.85 MeV neutron
beam incident on an A150 proportional counter with a simulated site size of 1 µm
diameter. As shown in Figure 5.21 the proportion of starters and insiders within the
tissue volume is quite small. The same volume of silicon would have even fewer starters
and insiders since the ratio of interaction probabilities is 0.9. Thus, a silicon
microdosimeter and TE converter with silicon dimensions of around 1 µm should
provide a microdosimetric spectrum which is reasonably free of silicon interactions. The
microdosimetric spectrum produced by thicker silicon detectors in fast neutron
environments will have silicon interaction products contributing to spectral components
at high lineal energies.
Figure 5.21. Monte Carlo calculations of yd(y) of 5.85 MeV neutrons in TE A150 plastic andmethane based TE gas (1 µµm simulated diameter). Contributions of stoppers, starters, and crossersto the total. The contributions of insiders is insignificantly small. (from p42 ICR report 36 [11] andFidorra and Booz [106].
Complicating matters is the fact that the silicon microdosimeter is not completely
surrounded by the TE converter, which is placed above the detector. For elastic
collisions, this is not a significant problem since the neutron beam is generally normally
incident to the detector. In this configuration, the majority of recoils will originate from

Chapter 5: Tissue equivalence correction Page 152
152
above the detector. Products from inelastic events are more isotropic and may originate
from the silicon substrate. This may be a concern in silicon microdosimeters exposed to
neutron energies around 10 MeV, where the inelastic cross-section is relatively high.
The implications of these results are significant for silicon microdosimetry design and
experimentation. The silicon microdosimeter should be as small as practicable with the
maximum amount of tissue equivalent material surrounding the detector.
Table 5.9. Nuclear interaction cross sections for 14 MeV neutrons incident on silicon and muscle.
Nuclear Reactions All Nuclear InteractionsMaterial σσinelastic at 14 MeV
(barns)P(interaction)
in 1 cmσσtotal at 14 MeV
(barns)P(interaction)
in 1 cmSilicon 1.09 0.05 1.75 0.09Muscle Note 1 0.02 Note 1 0.1Ratio(Si/Muscle) 2.5 0.9
Note 1: Muscle calculation uses elemental cross-sections from Figure 5.22 and Figure 5.23 and atomic density from Table 5.1.Note 2: σtotal=σelastic+σinelastic
0.1 1. 10. 100.Energy HMeVL
2.5
5.
7.5
10.
12.5
15.
17.5
20.
lato
Tssor
C-
noitces
Hsnr
abL
SiliconHTotalL
0.1 1. 10. 100.Energy HMeVL
2.5
5.
7.5
10.
12.5
15.
17.5
20.
latoTssor
C-
noitcesH
snrabL
O-16 HTotalLC-12 HTotalLH-1 HTotal L
Figure 5.22. Total (elastic+inelastic) cross section for neutrons interacting with silicon (left side)and hydrogen, carbon and oxygen (right side). Si data is from Evaluated Neutron Data File,ENDF/B-VI library (>10MeV) and JENDL-3(300K) library (<10MeV). H,C and O data is fromENDF/B-VI library [193].
2. 5. 10. 20. 50. 100.Energy HMeVL
0.2
0.4
0.6
0.8
1.
1.2
1.4
citsalenIssor
C-
noitcesH
snrabL
O-16 HInelasticLC-12 HInelasticLSi-28 HInelasticL
Figure 5.23. Inelastic (nuclear reaction) cross-section for neutrons interacting with silicon, carbonand oxygen. Data is from ENDF/B-VI library. [193]. Note that hydrogen, of course, does notundergo inelastic reactions.

Chapter 5: Tissue equivalence correction Page 153
153
0.5 1. 5. 10. 50. 100.Energy HMeVL
0.5
1.
1.5
2.oita
RnoitcaretnI
ytilibaborP
SiêMuscleTotal Interactions
10. 15. 20. 30. 50. 70. 100.Energy HMeVL
2.5
3.
3.5
4.
4.5
5.
5.5
oitaR
noitcaretnIytilibabor
P
SiêMuscleInelastic Reactions
Figure 5.24. Ratio of probability of interaction between silicon and muscle as a function of neutronenergy. Left side is for all interactions (elastic+inelastic); right side is for inelastic reactions only.
5.6 Summary of Tissue Equivalence StudyThe requirements for TE were summarized in 5.3. To obtain tissue equivalence, the
silicon detector/ TE converter should have a geometrical TE scaling factor of 0.63, a
converter composition closely approximating tissue, and a minimum silicon detector
size subject to shape and noise considerations (as discussed in chapters 3 and 4,
respectively) in order to reduce the probability of nuclear interactions with silicon.
A Monte-Carlo program was developed to simulate the energy deposition of ions in a
BNCT radiation field. The Monte Carlo results confirm that with appropriate
geometrical scaling (ζ = 0.63) silicon detectors with well-known geometry will record
energy deposition spectra representative of tissue cells of equivalent shape. That is,
silicon is tissue equivalent for BNCT ion products under appropriate linear geometrical
scaling. The scaling factor is also applicable to FNT but may need to be reduced for PT
to around 0.56.
A brief study comparing tissue and silicon neutron interactions in FNT was described.
For neutron energies less than 5 MeV, microdosimetric measurements in silicon
volumes with dimensions of the order of 1 µm will not be significantly affected by
events generated within the silicon. At higher neutron energies, the spectrum at high
lineal energies may be affected by silicon elastic and inelastic reactions. A more
detailed study is required to fully ascertain design requirements and the conditions
under which satisfactory operation may be achieved. As a general guideline, the silicon
microdosimeter should be as small as practicable with a maximum amount of tissue
equivalent material surrounding the detector. The issue of tissue equivalence will be
further discussed in the analysis of experimental results in subsequent chapters.


![Relapsed clubfoot correction with soft-tissue …correction often associated with soft tissue healing prob-lems and neurovascular complications [7, 10]. In this study, we retrospectively](https://img.dokumen.tips/doc/110x75/5e5b98048771c216b76cd9b2/relapsed-clubfoot-correction-with-soft-tissue-correction-often-associated-with-soft.jpg)