Embed Size (px)
Citation preview

CHAPTER 5
Silica Gels and Powders
DEFINITIONS
The forms o f silica considered here are solids having specific surface areas o f more than about 5 m2 g-’ . The state of subdivision ranges from large, solid masses to submicroscopic particles, and the degree of hydration from almost anhydrous SiO, to soft gelatinous masses containing 100 parts of water per part of silica. The com- mon feature of gels and powders is that they consist of ultimate silica particles of colloidal size, ranging from 1 to 100 nm in diameter.
Silica gel may be described a s a coherent, rigid three-dimensional network of contiguous particles of colloidal silica. The formation of silica gel by eolymerization o f silicic acid has been discussed in detail in Chapter 3 and by aggregation of parti- cles of colloidal silica in Chapter 4 .
Silica powder may consist of small granules of silica gel or of coherent aggregates of submicron particles that are linked together in extremely weak networks. Theoretically. a silica powder might consist of separate, discrete silica particles, but when the particle diameter is less than 100 nm, the particles spontaneously adhere together i n loose aggregates. I t is only when the discrete particles are much larger, that is. 5-50 microns (5000-50.000 nm), that the cohesive forces become so low that the particles do not attract each other and are very “dusty.” that is, small enough to form a “smoke” when shaken in air.
There are silicas which are borderline between gels and powders. When the bonds between the ultimate colloidal particles are very weak, and can be readily broken by mechanical means, the silica can be classed as a powder that is not a gel. O n the other hand, when the colloidal particles form a strong, coherent structure, the silica is classed as a gel even though the size of the gel granules may be as small as a few microns.
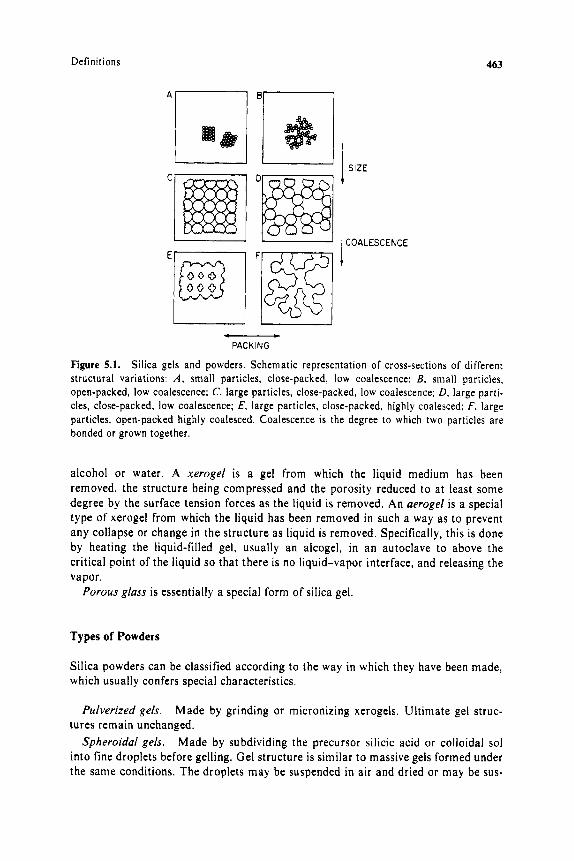
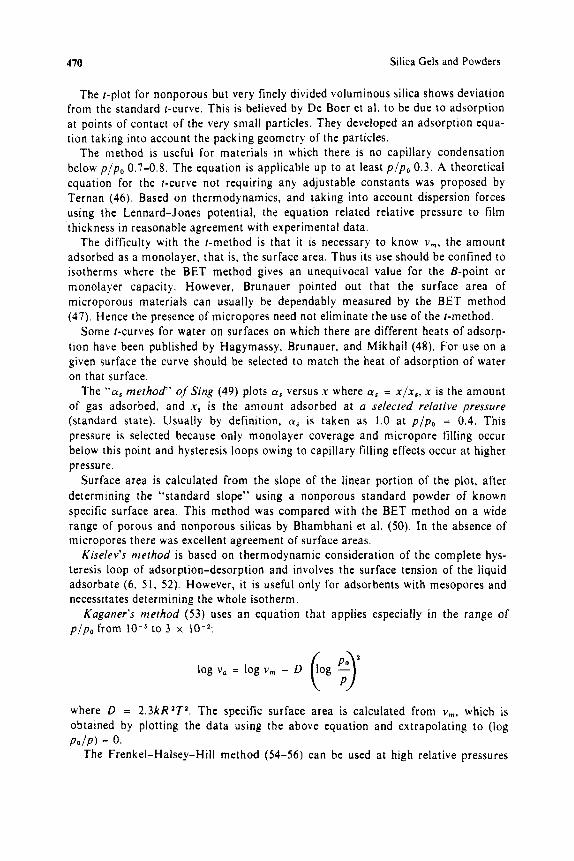
Figure 5. I schematically represents the variables of particle size, packing density, porosit j , and interparticle coalescence or aggregate strength.
Types of Gels
Silica gel is formed in a liquid medium, usually aqueous. The terms alcogel and ayuagel are gels in which the pores are filled with the corresponding liquid, that is,
462
Definitions 463
COALESCENCE 1 -
PACKING
Figure 5.1. Silica gels and powders. Schematic representation of cross-sections of different structural variations: A , small particles, close-packed, low coalescence: B , small particles. open-packed, low coalescence; C, large particles, close-packed, low coalescence: D, large parti- cles, close-packed, low coalescence; E , large particles, close-packed, highly coalesced: F, large particles. open-packed highly coalesced. Coalescence is the degree to which two particles are bonded or grown together.
alcohol or water. A xerogel is a gel from which the liquid medium has been removed, the structure being compressed and the porosity reduced to at least some degree by the surface tension forces as the liquid is removed. An aerogel is a special type of xerogel from which the liquid has been removed in such a way as to prevent any collapse or change in the structure as liquid is removed. Specifically, this is done by heating the liquid-filled gel, usually an alcogel, in a n autoclave to above the critical point of the liquid so that there is no liquid-vapor interface, and releasing the vapor.
Porous glass is essentially a special form of silica gel.
Types of Powders
Silica powders can be classified according to the way in which they have been made, which usually confers special characteristics.
Pulverized gels.
Spheroidal gels.
Made by grinding or micronizing xerogels. Ultimate gel struc- tures remain unchanged.
Made by subdividing the precursor silicic acid or colloidal sol into fine droplets before gelling. Gel structure is similar to massive gels formed under the same conditions. The droplets may be suspended in air and dried or may be sus-

464 Silica Gels and Powders
pended in an immiscible liquid in which the droplets solidify. The droplets may also be formed in the aqueous phase by coacervation of colloidal silica with an organic agent to form droplets which are then solidified.
Formed when the ultimate silica particles are coagulated as loose aggregates in the aqueous medium, recovered, washed, and dried. Coagulation may be effected by high salt concentration or other coagulants such as ammonia, water-miscible solvents, or certain types of organic materials. When the ultimate particles are larger than 5-10 nm they may be only weakly joined together and if in an open-packed condition subsequently they can easily be broken apart and dis- persed, for example, i n oils or rubber.
Powders made by condensing silica from the vapor phase at elevated temperature. The silica vapor is produced by ( a ) direct volatiliza- tion of S O z , ( b ) reduction of S O , to volatile S i 0 which is reoxidized, (c) oxidation of volatile silicon compounds such as chloride or esters, or (6) vapor phase hydrolysis of SiF,.
Less well known and i l l - defined, but generally consisting of particles with a laminary or sheetlike shape. These are of several types, depending on how they are made, as described in Chap- ter I .
Made from all the foregoing types of powders by covering the surface with a monomolecular chemisorbed layer of organic groups attached to the surface atoms through Si-C, Si-0-C, Si-0-N+-C, Si-0-M-0-C types of linkages (M is a polyvalent metal cation).
May be implanted into the silica surface to provide a stronger anionic surface with greater cation exchange capacity and acidic catalyst activity.
Precipitaled silica.
Aerosils or pyrogenic silica.
Phyllosilicas (leaflike) or lepidoidal (scalelike) silicas.
Organophilic silicas.
Aluminosilicate anions.
Current literature relating to various aspects of finely divided silicas is growing rapidly, usually in connection with particular applications or areas of technology. Various aspects of silica gels and powders have been summarized, often in detail, in reviews by various authors ( I-1Oc).
In spite of the great volume of literature, it appears that the diverse aspects of the subject have not yet been brought together into one convenient source of infor- mation.
PHYSICAL CHARACTERIZATION
Most of the methods of characterization apply equally to gels and powders. Von Buzagh (IOd) in 1937 clearly identified the variables that must be taken into account to define an aggregate structure:
I . The size and shape of the primary particles. 2. The spatial distribution of the particles, including the order and density of pack-
3. The strength of the bond between particles (coalescence). ing (see Figure 5. I ) .
Physical Characterization 465
He further pointed out that the size of the particles determines the specific surface area; also, for a given density of packing, the size of the particles determines the size of the pores or “intermicellar spaces” throughout the aggregate or gel.
Ultimate Particle Size
Methods have been covered in detail in Chapter 4 relating to colloidal particles in silica sols, which in many cases were dried to a gel or powder before being characterized. The same methods therefore are applicable in the present instance.
Electron Micrographs
Even in dense gels, i n which the ultimate particles are closely packed together, it is possible to discern the ultimate particles in a thin section of a gel fragment. By using techniques developed for carbon black by Cohan and Watson ( 1 I ) , the apparent particle diameter can be measured in those cases where the particles are lying in such a way that the silhouettes present more than a semicircle of cross-section. After measuring several hundred particles, the average particle diameters can be calcu- lated as d,, the number-average diameter, and as d,, the surface-average diameter, which is the diameter of a particle having a specific surface area equal to the average calculated for all the measured particles:
1 1 1 d , = - n,d:
where n, is the number of particles in the ith range of sizes, the mean diameter of each being d , , and k is the number of size ranges.
The specific surface area, S,, can be calculated from d, on the assumption that the particles are dense amorphous silica with a specific gravity of 2 .2 . Thus S, equals 2720/d,, where S , is expressed in square meters per gram and d, is in millimicrons.
Medalia and Heckman ( 1 2 , 13) describe a method for determing the sizes of both the ultimate particle and the aggregates in carbon blacks which should be equally applicable to silica powders. The procedure gives particles per aggregate, a measure of bulkiness which corresponds to porosity as well as ultimate particle size. A similar study of the porosity of a meso-porous silica gel was presented by Havard and Wilson (14). The silica was considered as a surface area standard (Gasil 1) and its surface area described by Everett et ai. (15) was 286.1 * 3.5 rnz g-’. Havard and Wilson obtained electron micrographs of remarkably high resolution from which the average particle diameter of 8.8 nm was calculated. Then an anomaly developed: in the case of particles this small, which should correspond to a specific surface area of about 2750/d, where d is diameter in millimicrons, and assuming the particle density to be 2 . 2 g cm-l, the specific surface area should be about 2750/8.8 or 312 mz g - I .

Silica Gels and Powders 466
Actually, 286 mz g - ' was measured. The difference is explained by the fact that around each point of contact between spherical particles there is an area or annular crevice too small to be penetrated by nitrogen molecules during the measurement of specific surface area, the diameter of the nitrogen molecule being 0.4 nm. For larger particles, the specific surface area, calculated from particle size in electron micro- graphs, is in better agreement wi th the area measured by adsorption methods (see Chapter 4, Ref. 142).
Specific Surface A r e a
The specific surface area is most dependably measured by the widely accepted method of adsorption of nitrogen or other gases and vapors. However, methods involving adsorption of specific ions or molecules from solution, either aqueous or organic, may require less equipment or prove to be more convenient, especially for routine use.
In all cases the key question is whether the ultimate silica particles are sufficiently separated so that the pores between them are accessible to the adsorbed ions or molecules and so that the silica surface can become covered with at least a single layer of adsorbed material. There are numerous instances, as in microporous gels, where water molecules or O H - ions can penetrate where nitrogen or other large molecules cannot. I t will be assumed that the pores of the solids on which surface areas are being determined are such that the surface is generally accessible to the material being adsorbed.
Other properties, which are a function of surface area, can also be measured but are not widely used. Various techniques available up to 1954 were surveyed by Moll (16), including all the types of solids on which the methods were used, along with about 150 references. Methods for nitrogen adsorption developed to 1953 were reviewed by Joy (17) . A symposium was held on the general subject in 1969 (18), especially reviewing all aspects of the BET method.
BY ADSORPTION OF GASES AND VAPORS. A large number of summaries and reviews are available on this subject, which has been the main topic in numerous symposia (l-8* 18, 19).
Standards for specific surface area have been established. One is a hydroxylated silica powder free from pores, "Fransil EF" (20) with a surface area of 38.7 m2 g-* . Subsequently, a worldwide search for suitable standards settled upon two carbon blacks and two silica powders. The latter are designated as TK-800 with an area of 165.8 f 2.1 m* g- l and Gasil I with an area of 286.2 * 3.5 (21).
Of course it was long ago necessary to establish the area covered by one nitrogen molecule by measuring adsorption on a nonporous surface of accurately measured geometric area. Uniform crystals or glass spheres measured microscopically have been used. A typical example is the work of Dietz and Turner (22a) who used E glass fibers of uniform, accurately measured diameter. Resulting values were: nitrogen, 16.2 A'; argon, 13.8 A*; and krypton, 20.2 A'at 77.4"K. Similar values had earlier been established by other methods. McCIellan and Harnsberger (22b) recom- mended the following values: nitrogen ( - 195"C), 16.2 A'; argon ( - 195C, - 183"C),
Physical Characterization 467
13.8 A'; krypton ( - 195"C), 20.2 A'; benzene (20"C), 43.0 A'; and n-butane (0°C) 44.4 A'.
Nitrogen has been by far the most widely employed adsorbate at -196°C. In similar facilities, argon and krypton can also be used and suitable values for atomic cross-sectional areas are known (23). The advantage of krypton for penetrating smaller pores was shown by Vezina and Berube (24).
A general survey of the adsorption of nitrogen on solids and the various methods of interpreting the data is included in a broad review of porous solids by Broek- hoff (25).
The BET (Brunauer, Emmeft, Teller) (26-28) mefhod of calculating specific sur- face area from an adsorption isotherm has been mainly applied to nitrogen as the adsorbate a t - 196°C. Innes (29) developed a rapid automatic technique for measur- ing the isotherm. Lippens and Hermans described suitable apparatus in detail (30, 3 I ) . Also, commercial equipment has been developed using the static equilibrium method, which does not require calibration and gives surface area by automatic digital readout (e&, Micromeritics, Inc.).
In spite of alternative equations to describe the isotherm, the BET equation has retained its utility for many years. Subsequent proposed schemes are useful for certain situations but the BET equation is still widely used. The BET equation is
1 ( c - 1lP =-+ - P V ~ @ O - P) VmC vrncpo
where v, is the moles of gas adsorbed per gram of adsorbent when the gas pressure is p, v, is the monolayer capacity of the surface, that is, the number of moles of gas per gram of adsorbent required to form a monomolecular layer, po is the saturation gas pressure at the temperature used, and c is a constant. When p/vQ0 - p) is plot- ted as ordinate versus p/po as abscissa a line is obtained with slope (c - l)/vmc and intercept on the ordinate equal to l/v,c. The constant c is a function of the heat of adsorption and depends on the chemical nature of the surface.
From Y,, calculated from the experimental data using the above equation, the area is determined from the equation
where SBET is the specific surface area in square meters per gram, as determined by this method, a, is the molecular cross-sectional area of one gas molecule in square angstroms, and N is 6 x IOzs. The value of a, for nitrogen may vary on different surfaces, but is commonly assumed to be about 16.3 A for oxide surfaces.
To compare different solids, it is convenient to use a term v,, the "reduced pressure," which is defined as vs = v/v,,, where v0,, is the volume of gas adsorbed at p/po = 0.4. Carruthers et al. (20) compared the adsorption of nitrogen on four types of silica powders plotting v/v, versus v8 (where v, is the monolayer value from the BET equation) and found direct proportionality.
The BET method gives the same results whether or not the surface of the silica is hydroxylated or dehydrated. On 19 specimens with widely different stages of

468 Silica Gels and Powders
dehydration of the surface, the effect on the measured surface area was less than 5% (32). Lowen and Broge (33) showed that as an initially fully hydroxylated powder was dehydrated, along with some loss of surface owing to sintering there was a marked decrease in the constant c in the BET equation, which corresponded to a lower energy of adsorption:
Dehydration Surface Area SiOH Constant Temperature ("C) (mP g-') Groups (nm-l) C
120 620 8 IO
I82 170 141
10 3 2
104 53 45
Upon rehydrating the surface the value of c returned to about 100 while the surface area remained unchanged. The effect of surface hydroxylation on nitrogen adsorp- tion also has been examined at various temperatures by Koberstein and Voll (34).
Microporous materials might be thought to be unsuitable for area determination by the BET method. However, Brunauer (35) pointed out that since small pores fill at a lower partial pressure than larger ones, there is a compensating effect so that by coincidence the method still gives a true value for the specific surface area provided there are no pores wi th radii smaller than about 12 A .
The Harkins and Jura (36) absolute method of calculating specific surface area from adsorption data apparently gives more consistent results than the BET method when different adsorbates are used on different kinds of solids. It is based on an empirical equation:
P A l o g - = B - -
Po v',
where A and B are constants, v. is the volume of gas adsorbed, and p / p o is the partial pressure of the adsorbate.
Plotting log p / p o versus v i z a straight line of slope s is obtained. From this, the area is calculated
where S is specific surface area in square meters per gram and k is a constant for the particular adsorbate determined by the "absolute" method (36). Some values of k are as follows:
Vapor Temperature ("C) k
Nitrogen - 195.8 4.04 Butane 0 13.6 Water 25 3.83

Physical Characterization 469
Many workers subsequently verified agreement between the Harkins and Jura and the BET methods of calculating surface area from adsorption data. According to Dreving et al. (37) the BET equation is obeyed on silica gels a t p/po from 0.035 to 0.33, and the Harkins and Jura equation is obeyed from 0.075 to 0.58.
The l-plot method of plotting the amount of nitrogen adsorbed versus the thick- ness of the adsorbed nitrogen film on a flat, nonporous surface was proposed by Shull (38). Cranston and Inkley (39) assembled available data and published a com- posite 1-plot which they and others have used widely in characterizing porous solids.
De Boer et al. (Ref. 4, p. 32) extensively studied the application of the method to numerous solids free from micropores, using the equation
V a t = 3.54 -
v m
where I = thickness of adsorbed nitrogen film (A) Y, = volume of nitrogen adsorbed
v, = volume of nitrogen adsorbed to form a monomolecular layer
The surface area, S,, is calculated from the equation
where I is taken from a table or equation relating t to p/po, based on extensive experimental data. The area, S,, is in square meters per gram and va is in cubic centimeters of nitrogen gas a t STP adsorbed per gram of solid.
Details and examples are given in a series of papers by De Boer et al. (40-42) and summarized by Broekhoff and Linsen (Ref. 4, p. 23).
To calculate I from p/po, Dollimore and Heal (43) examined 36 samples of silica and alumina and concluded that the formula given by De Boer should be recom- mended:
I = 3.54 - [ln;;P]'l3
where t is in Angstroms.
Various investigators have tried to improve upon the original 1-curve of Cranston and Inkley, mainly by trying to ensure that no pores are present in the adsorbent. Girgis (44) developed a different type of I-curve and corresponding equation but the values must be used with a special equation.
I = 6.15 - 2.25 In In - + 10.5 - ( :) (;J
470 Silica Gels and Powders
The t-plot for nonporous but very finely divided voluminous silica shows deviation from the standard t-curve. This is believed by De Boer et al. to be due to adsorption at points of contact of the very small particles. They developed an adsorption equa- tion taking into account the packing geometry of the particles.
The method is useful for materials in which there is no capillary condensation below p / p o 0.7-0.8. The equation is applicable up to at least p / p o 0.3. A theoretical equation for the t-curve not requiring any adjustable constants was proposed by Ternan (46). Based on thermodynamics, and taking into account dispersion forces using the Lennard-Jones potential, the equation related relative pressure t o film thickness i n reasonable agreement with experimental data.
The difficulty with the t-method is that it is necessary to know v,, the amount adsorbed as a monolayer, that is. the surface area. Thus its use should be confined to isotherms where the BET method gives an unequivocal value for the E-point or monolayer capacity. However, Brunauer pointed out that the surface area of microporous materials can usually be dependably measured by the BET method (47). Hence the presence of micropores need not eliminate the use of the t-method.
Some 1-curves for water on surfaces on which there are different heats of adsorp- tion have been published by Hagymassy, Brunauer, and Mikhail (48). For use on a given surface the curve should be selected to match the heat of adsorption of water on that surface.
The ‘&as method” of Sing (49) plots a , versus x where a , = x /x , , x is the amount of gas adsorbed, and x, is the amount adsorbed a t a selected relative pressure (standard state). Usually by definition, a, is taken as 1.0 a t p/po = 0.4. This pressure is selected because only monolayer coverage and micropore filling occur below this point and hysteresis loops owing to capillary filling effects occur at higher pressure.
Surface area is calculated from the slope of the linear portion of the plot, after determining the “standard slope” using a nonporous standard powder of known specific surface area. This method was compared with the BET method on a wide range of porous and nonporous silicas by Bhambhani et al. (50). In the absence of micropores there was excellent agreement of surface areas.
Kiselev’s method is based on thermodynamic consideration of the complete hys- teresis loop of adsorption-desorption and involves the surface tension of the liquid adsorbate (6, 51, 52). However, it is useful only for adsorbents with mesopores and necessitates determining the whole isotherm.
Kaganer’s method (53) uses an equation that applies especially in the range of p / p o from to 3 x IO-*:
where D = 2 . 3 k R Z T 2 . The specific surface area is calculated from v,, which is obtained by plotting the data using the above equation and extrapolating to (log Palp) = 0.
The Frenkel-Halsey-Hill method (54-56) can be used a t high relative pressures
Physical Characterization 471
where the adsorbed film is several molecular layers in thickness. The isotherm can be described by the following equation:
where s is based on the decrease in surface forces with distance. Pierce ( 5 7 ) showed that for nitrogen the equation holds beyond the first molecular layer and that for p / p o above 0.3 the isotherm is
1.305 (;y5 =
where v , is the volume of nitrogen adsorbed a t the monolayer stage, v is the volume adsorbed a t pressure p, and po is the saturated vapor pressure. Since in this case nitrogen is being adsorbed on nitrogen, the adsorption is independent of the substrate.
A continuous f low technique of measuring surface area by adsorption of nitrogen or other adsorbate from an inert gas stream is now widely used. It was described by Nelsen and Eggertsen (58 ) and confirmed by Lee and Stross (59) . Many improve- ments have been made and compact commercial instruments are available (e.g., Quantachrome Corp.). Details are further described by Ettre and Cieplinski (60) . A known mixture, for example, 20% N, and 80% He, is passed over a previously degassed sample at room temperature and then through a thermal conductivity detector. When the sample is suddenly cooled in liquid nitrogen it absorbs nitrogen but quickly reaches saturation. This causes a temporary decrease i n the nitrogen content of the stream which is shown as an inverted peak by the continuous recorder. When the sample is warmed suddenly to room temperature nitrogen is evolved, giving a peak i n the opposite direction. Peak area and/or heights are obtained on standard samples of known area (determined by the regular BET method) and serve for calibration. Usually the desorption peak is used. Commercial instruments give the integrated area under the peak and direct area readout.
Gaziev, Yanovskii, and Brazhnikov (61) pointed out that the method ignores variations in heat of adsorption which corresponds to variations in the c value of the BET method. Reviews of the method appeared in 1972 (62 , 63) . Pommier, Juillet, and Teichner demonstrated that very small areas could be determined. Lowell (65 ) used krypton instead of nitrogen to measure specific surface areas as low as 0.019 m z g - l . Payne, Sing, and Turk (66) compared argon and nitrogen on hydroxylated silicas and found that the area covered per argon molecule is 18.2 A2, assuming the value for nitrogen is 16.2 A2. For microporous solids nitrogen was preferred.
Other gases and vapors may be used, especially where liquid air temperatures are inconvenient. Methanol has been used a t ordinary temperature to measure area and pore properties (67) . At p / p o = 0.1 the surface area is 145a mz g-I where a is milli- moles adsorbed per gram, or about 4 CH,OH molecules nm-2. Furan a t 2 3 O C and butane and isobutane a t O°C gave monolayer coverages of 42, 54, and 53 A2 per

Silica Gels and Powders 412
molecule, respectively (68). Ammonia at its boiling point gave variable molecular coverages depending on the nature of the silica surface (69). Nitrogen monoxide (NO) was adsorbed at temperatures from 181 to 293°K as the magnetic suscepti- bility was measured (70). When benzene was adsorbed at p / p o 0.214, a monolayer was present on silica from which area could be calculated (71). The adsorption isotherms for different gels varying in area, pore size, and surface hydroxylation were calculated from basic principles by Kiselev (72).
Water vapor is a useful adsorbate provided the surface is fully hydroxylated. With silicas that are rendered hydrophobic by surface treatments or that have been dehydrated above about 300°C. the adsorption of water is useful for determining only the hydrophilic area. However, for gels and powders formed in water and dried at moderate temperature, the adsorption isotherm for water giveS a dependable measure of specific surface area. Water adsorption on silica was studied, for example, by Gans, Brooks, and Boyd (73) and Kantro, Brunauer, and Wise (74), who found that the surface area could be calculated using the BET equation. Adsorption was measured by weight increase as the sample absorbed moisture for 7 days at 25OC from solutions of known vapor pressures of water. Vapor pressures ranged from 0.07 to 0.33. The method is slow but requires only simple laboratory glassware. Adsorption on gels of widely varied structures was examined by Bel- yakova, Dzhigit, and Kiselev (75), who reported that one H,O occupied an area of 25 A* in the monolayer.
Carbon retrachloride adsorption was measured at 28°C with a microbalance giv- ing a linear BET plot from which the specific area agreed with that by nitrogen adsorption. There was no chemical interaction (76). Carbon dioxide at the tempera- ture of -78OC can be used in the same equipment as employed for nitrogen at - 196°C and gives the same results within 10% (77).
With the flow method using butane in carbon dioxide, the butane desorbed can be recovered and the volume measured after adsorbing the carbon dioxide i n alkali solution (78).
Adsorption.frorn solution has already been mentioned in Chapter 4 relating to the specific surface area of colloidal silica. These and other methods have also been applied to silica powders and gels. Adsorbates include organic compounds from organic and aqueous solutions as well as organic and inorganic cations and the O H - ion from water. Polar compounds in nonpolar (hydrocarbon) solvents are adsorbed on the polar SiOH surface. Adsorption on the dehydrated siloxane surface is not as well understood. However, there is evidence that in water, the siloxane surface is hydrophobic. I t adsorbs only hydrophobic materials or groups.
Surface areas of hydrophilic (hydroxylated) silicas have been measured by adsorp- tion of nitrophenol from water or benzene (79) and phenol from decane or carbon tetrachloride (80, 81). The system must be anhydrous and the solvents dried by molecular sieves. The phenol may be determined by bromine titration or interferometer. Stearic acid is adsorbed from anhydrous methanol and determined by difference by potentiometric titration with alkali. The data given indicate that each stearic acid molecule covers only 20.6 A* (82).
Adsorption of Zn(en):+ on silica gels and powders was already mentioned in Chapter 4 and can be used to determine surface areas of silica powders free from

Physical Characterization 473
micropores, according to Unger and Vydra (83). The decrease i n zinc content of the solution in the pH range 6-9, determined by a titration procedure, provides a measure of surface area within about +3%. Coverage is about 1.26 molecules nm-*, or 79 A z per molecule.
Adsorption of dyes on powders has long been used to estimate areas since the analysis requires only colorimetry. Methylene blue has been studied by a number of investigators and factors influencing the adsorption have been explored (84, 85). Giles. D’Silva, and Trivedi (86, 87) compared a series of cationic dyes including methylene blue and crystal violet as adsorbates on various powders from solutions in p-nitrophenol or water and correlated results with areas determined by the BET method using nitrogen and krypton as well as electron micrographs.
Adsorption of cationic surfacfants (cationic soaps) on silica has been studied by Ter-Minassian-Sarage (88) and by Bijsterbosch (89), who have shown that either a monolayer or a bi-layer may be formed. Similar complexities may exist with some micelle-forming dyes, and special conditions would have to be worked out for each adsorbate to eliminate confusion. Also, the adsorption of these ionic species is affected by pH and by aluminosilicate ion impurities on the silica surface. Use of cationic dyes and surfactants is generally restricted to rapid comparison of surface areas of a series of silica powders of the same type.
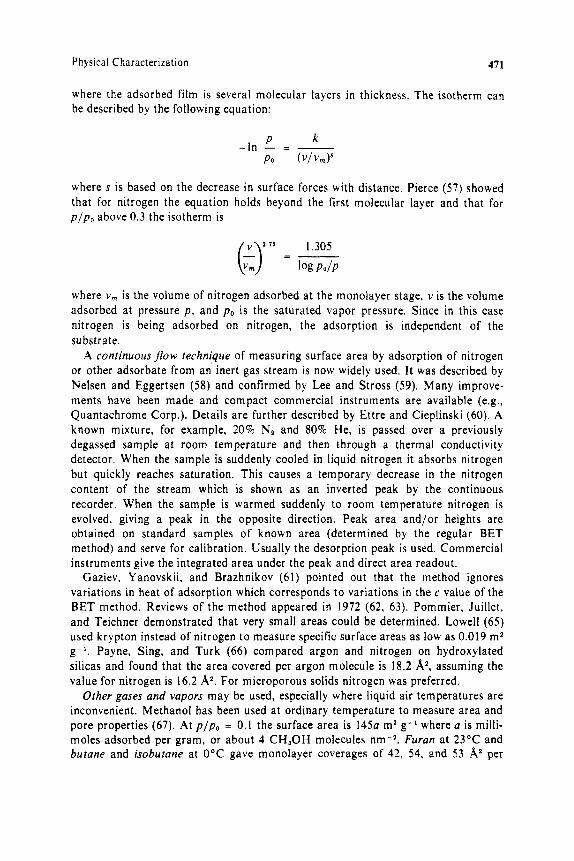
Nonionic dyes such as methyl red are useful for determining the hydroxylated sur- face area of silicas, especially those of which the surface has been partly dehydroxylated or rendered organophilic. Lowen and Broge (33) used the method of Shapiro and Kolthoff (90) involving physical adsorption of methyl red dye from ben- zene solution onto the polar silica surface. In parallel experiments, the silanol groups were reacted with (CH,),SiCI and the number of chemisorbed (CH,),SiO groups related to the number of S iOH groups remaining on the surface after dehydration a t a series of elevated temperatures. It is clear that with fully hydroxylated silicas free from micropores, surface area can be measured with either reagent (Figure 5.2). Each methyl red molecule covers 116 A1 and each (CH,),Si group 45 A*.
Adsorption of monomolecular Hf(OH), from neutral solution onto silica was proposed by Stryker and MatijeviC (91) a s a way to determine specific surface area, using radiolabeled hafnium. Murphy, Posner, and Quirk (92) reported that attempts to repeat the method failed. There followed an interchange of notes which left the question unresolved (93).
Phenyl trichlorosilane, C6H,SiC13, reacts quantitatively with dry silica gels and the amount irreversibly reacted with the silanol surface permits estimation of surface area. There are 2.16 phenyl groups anchored to the surface per square nanometer (3.6 micromoles m-*) (94).
Titration with alkali in salt solution between pH 4.5 and 9.0 is a very useful, rapid method for determining the area of hydroxylated silica. The OH- ions are small enough to penetrate pores not accessible even to nitrogen. Details of this Sears titra- tion method are given in Chapters 3 and 4. When gels or powders are involved, equi- librium is rather slowly reached a t the final end point a t pH 9. Meffert and Langen- feld have studied titration of silica powders (95) using an automatic titrator t o reach the end point. The need for a high salt concentration to permit titration of surface within fine pores has been accounted for by Abendroth (96).
474 Silica Gels and Powders
1000/ K O
08 I O 12 14 16 18 20 N g 2 5 a
n m 8 15 v) 0 a
a” 2 0 W
v) I O IL! -I 3
05 0 = o
0 1 2 3 4 5 6 7
SiOH PER nrn*
Figure 5.2. Relationship between silanol groups per square nanometer, temperature of dehydration, and adsorption of ( A ) trimethylsilyl groups and ( B ) methyl red molecules.
Chromarographic methods using adsorption from the liquid phase have been developed. When a large enough sample of silica is available it can be packed into a column 2 mm in diameter. The length of the chromatographed colored zone of methyl red in benzene is measured and related to specific surface area (97). Adsorp- tion of C,-C, alcohols from various concentrations in benzene was measured by Hoffman et al. (98), from which the surface areas covered by the physically adsorbed molecules on silica were calculated as follows:
Alcohol Molecular Area (A*)
Methanol Ethanol I-Propanol 2-Propanol 1 -Butanol
19.9 25.5 30.2 30.8 34.4
Hoffman et al. then used the liquid chromatographic system of CH,OH-H,O-silica developed by Frenkel et al. (99) and determined the surface area of the silica which agreed wi th the BET method using nitrogen adsorption. I t was concluded that the lower aliohol-benzene system offers a simple method for measuring surface area requiring little equipment or skill.
Another procedure for measuring hydroxylated surface areas uses octadecyl alcohol as adsorbate which is determined by gas chromatography. Serpinet et al. (100) used this method to check the accuracy of the flow method using nitrogen adsorption.
DIELECTRIC MEASUREMENTS. This method has been used to follow the adsorption of liquids and vapors on silica. As benzene penetrates micropores, the interaction with

Physical Characterization 475
the surface changes the dielectric isotherm. Changes in behavior after heating the silica were also observed (101). In earlier studies, McIntosh, Rideal, and Snelgrove (102) had noted discontinuity of the slope of the curve relating electrical capacity of silica versus the amount of water adsorbed. For relative humidity under 40%, Kurosaki (103) found the adsorption of water follows the BET equation, but dielectric capacity and loss show discontinuities related to changes in the freedom of rotation of molecules on the silica surface.
The dielectric constant of a given type of silica powder is related to the S iOH sur- face groups and therefore t o specific surface area. Pyrogenic silicas, low in silanol groups, have a lower constant (104).
THERMAL EFFECTS. Numerous measurements of heats of adsorption on silicas of known areas have been reported, but there are many factors affecting the results and the equipment is complex. Harkins and Jura (105) developed an absolute method in which the sample powder is equilibrated with water vapor isothermally until the sur- face is coated with a film of water and then it is immersed in water in a highly sensi- tive calorimeter. The liberated heat in ergs per gram divided by the total surface energy of water ( 1 18 ergs cm-l) gives the specific surface area. The method can be used only with limited types of silica. The heats of immersion of various powders, including silica, have also been related to surface area by Okuda (106).
One of the complications is the higher heat of adsorption in very fine micropores (107) which, of course, can be used to characterize the porosity of gels of known area. Another important variable is the state of hydration of the silica surface which can cause a threefold difference in heats of immersion in benzene or cyclohex- ane (108).
A heat of immersion in water of 160 =t 3 ergs ~ m - ~ was found on hydroxylated silicas of specific surface areas in the range from 8 to 150 m z g-’ free from micropores. Taylor and Hockey (109) reported the value to be constant in this range provided the surface properties were similar. In all cases the surface had been dehydrated at elevated temperature as the silica was sintered for various times at 700-1O4O0C to reduce the surface area and then rehydroxylated to 4.71 O H groups nm-l. Thus, at least theoretically, the surface area of silica after suitable preparation of the surface could be determined by measuring the heat of immersion in water.
M E R C U R Y PENETRATION. The pressure, p , required to force mercury into a pore is inversely related to its diameter, and the volume of mercury, v, which penetrates at that pressure measures the volume and thus the “length” of the pore. From this the internal area of the pore can be calculated. However, in practice, the pores are widely different in size and the surface area is determined by an integral:
I s = - -
where u and e are respectively the surface tension and the contact angle of mercury with the pore wall, and V, and v,,, are the volumes of mercury penetrating the

476 Silica Gels and Powders
pores at 1 atm pressure and maximum pressure, respectively. The method is generally applicable only when S is less than 100 m z g-’ ( I IO).
PERMEABILIT), The resistance of a packed powder to the flow o f a gas can be used under certain circumstances to measure particle size or specific surface area. Methods of this type are described by Arnell ( I 1 1 ) and Deryagin, Fridlyand, and Krylova (1 12). Such procedures are probably now seldom used since the rapid flow method of nitrogen adsorption has become available.
T H E HYDROXYL CONTENT. The amount of “bound water” in silica, after complete surface hydration and drying under vacuum at less than IOO’C, is a direct measure of surface area. In the case of nonmicroporous silicas, the area determined in this way agrees with the BET area by nitrogen adsorption. According to Zhuravlev and Kiselev ( I 13) when the surface OH content is measured by deuterium exchange, it corresponded to 5.0 OH groups nm-* on more than 40 different amorphous silicas. I n the case of microporous or so-called lepidoidal and hydrated silicic acids, the OH content is a measure of “surface” in the sense that it measures all silicon atoms that are not completely linked through oxygen atoms to surrounding silicon atoms.
For many colloidal and precipitated silicas, Tiwari et al. (114) found that dif- ferential thermal analysis (DTA) peaks, which are proportional to the number of SiOH groups that are dehydrated, can be closely correlated to the BET surface areas. The OH coverage per unit surface (BET) area is independent of particle size or pore size as long as micropores are absent.
Low Angle X - R a y Scatrering
The use, of this technique for determining the size of ultimate silica particles was reviewed in Chapter 4 . Early studies by Shull, Elkin, and Roess ( 1 15) correlated dif- fraction data with other structural features of silica gel. Also Bastick and Faivre (1 16) found that the dimensions of the “micellar surface” of silica gels calculated from dif- fraction data correlated with surface area as determined by nitrogen adsorption. Shul l found average particle diameters in different gels (2.9-8.8 nm) were in agreement with measured specific surface areas, assuming dense spherical particles were linked into the three-dimensional gel network with little loss of area at the points of contact. Correction of the scattering curve for scattering aside from silica, and measurements of ultimate particle diameter in silica gels were described by Kakudo et al. (117). The particle diameter of Ludoxs HS colloidal silica was determined by Tamagusuku and S h u i n to be 15.5 nm (118). On pyrogenic silicas good agreement with particle size from electron micrographs was obtained by Bradaczek ( 1 19), that is, 8 . 2 versus 8.9 nm diameter.
As discussed later, gel structure can also be elucidated by this technique.
Aggregate Size-Powder Particles, Gel Granules
In powders and gels the ultimate of primary particles are always aggregated into what have been variously called “secondary particles,” “clusters,” or “aggregate

Physical Characterization 477
particles.” They will be referred to simply as “aggregates.” The “ultimate particles” will generally be assumed to be nonporous although in a few special cases may contain micropores less than 5 nm in size as described in Chapter 4. In the aggregates the ultimate particles are linked together by siloxane bonds and are not dispersible without mechanical rupture.
Silica powders consisting of discrete nonporous particles or granules larger than half a micron or so in diameter, such as made by grinding massive silica, are outside the scope of this book. Discrete particles of silica coated with large organic cations or covered with alumina and chloride anions, which can be dried to powders that spontaneously disperse in water, or discrete silica particles covered with chemisorbed alkoxy or organosilyl groups and dried to colloidal powders spontaneously redis- persible in organic solvents, have been reviewed in Chapter 4.
It is interesting to visualize the extremely small size of the ultimate particles. I f a small granule of typical silica gel 1 mm in diameter were enlarged or magnified to a diameter of 50 m, then the ultimate silica particles of which it is made would be about I mm in diameter!
Aggregate size can be measured by a number of conventional methods including screening. Screens are now available in mesh sizes down to microns. In the case of some pyrogenic silicas, otherwise referred to as “silica smoke” or “white soot,” the linkage between the ultimate particles are extremely weak and thus the aggregates are so fragile that the measured screen size changes as the powder is subjected to the mechanical action of the screen. On the other hand, the aggregates of precipitated silicas and especially of dried silica gels are sufficiently coherent to give reproducible measurements.
Wet methods may be used in which the powder is suspended in a liquid, usually water with a surfactant to overcome flocculation of aggregates. Aggregate size can then be determined by diluting out the suspension and measuring aggregate sizes by optical microscopy.
Various sedimentation and elutriation methods are available but these are of value only after standardization for a given type of powder or gel with constant aggregate density. The same applies to measurement of permeability to a stream of air or liquid. The external surface area of porous aggregates, which is an indirect measure of aggregate size, can be measured by “ambient pressure permeametric” measure- ments. Gas is forced through a bed of powder and the flow rate and pressure drop are measured. The apparatus that is used for the flow method of measuring surface area by nitrogen adsorption (Quantasorb from Quantochrome Corporation) can be adapted to this measurement.
A complete bibliography up to 1950 to the foregoing techniques is found in Chemical Engineer’s Handbook (120). For research purposes wet or dry screening is generally the simplest available method. However, Van den Hul and Lyklema have considered the broad question of ultimate particle sizes versus aggregate size (121) and examined various techniques, especially “negative adsorption.” This approach may prove practical for gels of certain pore sizes.
Negative adsorption is a rather contradictory term referring to the phenomenon by which, in a suspension of the adsorbent in a solution, one component is more highly concentrated and the other less concentrated within one or two molecular diameters of the surface than in the bulk liquid. Thus, for example, in a suspension
478 Silica Gels and Powders
of silica with a negative surface charge i n water, anions are expelled from the immediate surface and especially from narrow pores. In comparing six methods of determining the surface area of silica, among other finely divided solids, Lyklema and Van den Hul (122) included the negative adsorption method. With a silica powder of a specific area of 56 m 2 g- I by the BET method, the negative adsorption method gave 34.5 m’g-’ .
Pore Characterization
Measurement and definition of porosity is possible only with aggregates that are mechanically strong enough not to be affected by the method of test. For example, i n characterizing porosity by measuring the penetration by mercury under pressure, conventional catalyst gels are not affected but with aerogels or precipitated silicas the structure would be collapsed and the results meaningless. On the other hand, measuring the pore size by filling the pores with liquid nitrogen is far less destruc- tive, and analysis by low angle X-ray scattering is obviously nondestructive.
The structure of aggregates and gels has been described in Chapter 3 and also there is some discussion in Chapter 4 of gels formed from discrete colloidal particles. The volume of literature on this subject is enormous, especially relating to silica gel- based catalysts and more recently silica packings for chromatographic columns. Several comprehensive reviews and discussions are available (1-6). Unger (6) has given an especially clear and concise description of the nature and characterization of pores in silica.
A monograph on pore structures was published by Linsen and Van den Heuvel ( 1 23) with a review of methods of measurements.
The following structural variables characterize pores:
I . Specific surface area ( m Z g-l) . This includes the total surface of the solid phase. Except for extremely small aggregates that are submicron in size, the external area is negligible in comparison with the area of the pore wall surfaces. Methods of measurement have been discussed in a previous section.
2. Specific pore volume ( v p , ml g - I ) is the total volume of pores per gram of solid. This is usually determined by measuring the volume of a liquid required to f i l l the pores but not the spaces between aggregates.
3. Average pore diameter (dp, A). 4. Pore size distribution in terms of a distribution function Avp/Adp = Ad,). 5 . Degree to which entrance to larger pores is restricted by smaller pores (“bottle-
necks” or “ink-bottle’’ pores).
These parameters are usually derived from one or more types of experimental data:
I . Gas or vapor adsorption i s o t h e r m whereby the quantity of adsorbate x, is measured as nearly as possible over the range of partial pressures p / p o 0-1 .O.

Physical Characterization 479
2. Mercurj, penetration whereby the volume of mercury forced into pores is measured as a function of pressure. The pores must be completely nonwetted by the penetrating liquid and mercury is the only suitable liquid available at ordinary tern pera t u re.
3 . Low angle X-ray scattering provides a measurement of distance between solid-gas interfaces; that is, pore diameter (and particle diameter).
4. Electron microscopy is useful for confirming the mathematical models used in interpreting adsorption or penetration data.
5. Permeability to gases is in some cases a measurable function of average pore size. 6. Exclusion of ions or molecules of known size can be used to measure pore size
under suitable circumstances. 7 . Volume ofimbibed liquid provides a measure of pore volume, if measured under
suitably controlled conditions.
Because adsorption characteristics change with pore size, i t is convenient to classify porosity by the terms submicro-, micro-, meso- (intermediate), and macropores. This terminology was proposed and later modified by Dubinin (IO, 124) who defined the terms as follows:
Diameter (A)
Micropores 10-12 t o 26-28 Mesopores 30-32 t o 2000-4000 Macropores 2000-4000
Particle Size and Packing
The structure of silica gels remained for many years a matter of debate. The gel structure was often visualized as a cross-linked network of molecular “chains” of polysilicic acid similar to organic gels. However, in 1926, Freundlich suspected and, in 1940, Carmen clearly proposed that silica gel was made up of ultimate spherical particles.
Before it was discovered how to make uniform silica particles larger than 5-10 nm in diameter, the only silica gels were those made by acidifying sodium silicate or hydrolyzing silicic esters. Even with the electron microscope it was difficult to discern the structure of such gels. However, there is no longer any doubt that silica gels and powders are primarily formed from “corpuscular” or “globular” discrete particles as discussed by Iler (2), Kiselev (3), Vysotskii (in ref. (5 ) ) and Unger (6). A technique for preparing thin sections of very fine gel structures was developed by Sugar and Guba (125) permitting magnification of 105-fold, by which it was seen that the structure indeed consisted of fiberlike threads made up of a chain of glob- ules. From measurements of the pore size and particle diameter, a specific surface area and average pore size was calculated which compared satisfactorily with values obtained by nitrogen adsorption. Carbon replicas of silica gel structures were used

480 Silica Gels and Powders
for electron micrograph studies of various silicas by Leont'ev and Luk'Yanovich ( 1 26a).
The chaining together of spherical silica particles into a gel structure has been dis- cussed in detail in Chapter 3. Now the effects of particle size and particle packing on porosity will be considered.
A typical pore in a dense silica gel is shown in Figure 5.3a. Here the silica spheres are i n cubic packing and the pore volume is 48% of the total volume. Since the 52% by volume of silica has a density of 2.2 g
As long ago as 1954, Kiselev (126b) calculated the surface area, pore volumes and sizes, and coordination number of the average particle as the packing density of spherical particles was varied. As seen in Figure 5.3b, when the geometry of packing remains the same, then the pore diameter decreases with particle diameter. On the other hand, by changing the packing particles of a constant size, the pore diameter can be changed. Also, both packing and particle size can be changed simultaneously to maintain a constant pore diameter.
From the experimental standpoint all silica gels and precipitates tend to be compressed by the shrinkage forces of the surface tension of water as water dries out of the pores. Unless special precautions are taken to strengthen the structure and
the specific porosity is 0.42 cm3 g- l .
Figure 5.3s. Model of an "elementary pore" in a regular 6-coordination sphere packing.

Physical Characterization 481
COORDINATION NUMBER
12
6
3
3-2-3
3-2-2-3
VI
SOLI[
74 5
- -
52
5
13
0 83
UME D )ORE! 25 5
48
95
90 7
99 17
'ORE
0.155
0 42
86
35
54
Figure 5.3b. The size of the ultimate particles and the coordination number (number of parti- cles touching each particle) control the pore volume and average pore diameter. (Drawing is schematic; actual structure is three-dimensional.)
reduce the surface-tension forces, the wet precipitate or gel is strongly compacted to about the same coordination number 5-6. In this case the pore diameter is propor- tional to the particle size and varies inversely with specific surface area. For example, Unger (6) gives the following associated values:
Specific Surface Area (m* g-I) Pore Diameter (A)
(Dubinin) (Unger)
Micropores < 20 Mesopores 20-2000 Macropores > 2000
> 500 500- I O < 10
However, this relation does not always exist; some very low density aerogels can have both a large pore diameter a s well as a high specific surface area.
The relation of particle size and packing to the pore characteristics has been considered in terms of several models. Mason (127) considered random packing of spheres, since certainly in silica gels the packing is not regular (except in opals as discussed in Chapter 4). H e considered the pore as a tetrahedral subunit formed by joining the centers of neighboring spheres which do not necessarily touch each other.

482 Silica Gels and Powders
Table 5.1. Characteristics of Bodies of Packed Spheres of Radius R
Radius of Radius of
Type of Number (cm' pores/ of Body Inscribed Inscribed Packing n cm- ' body) (g cm-3) in Cavities in Throats
Coordination Porosity Density" Sphere Circle
Hexagonal I 2 0.260 I .63 0.225R 0.155R (close packed) 0.414R Tetragonal I O 0.302 I .54 0.291R 0.265R (body centered) 0. I55R Hexagonal 8 0.395 1 . 3 3 0.527R 0.414R (primitive) 0. I55R Cubic 6 0.476 1 .15 0.732R 0.414R (primitibe)
Tetragonal 4 0.666 0.73 I .OOR 0.732R
Source. Avery and Ramsay (129). a Assuming sphere (silica) density of 2.2 g cm-l.
The pores are thus defined by the coordinates of the centers of the spheres. The properties of the pores were evaluated by computer. According to Mason, the random packing of spheres gives a volume density of 0.63 which is about halfway between 0.52 for open packing (cubic) and 0.72 for close packingihexagonal).
Particle packing has been studied experimentally by starting with very fine silica powders of uniform particle size in a voluminous state of low bulk density where each particle touches only two, three, or four others. When this is mechanically compressed there are more and more interparticle contacts.
The absorption characteristics and geometry of packed spherical particles have been calculated by Dollimore and Heal (128). Using coordination numbers of 4, 6, and 8, equations were developed to calculate the amount of adsorbate a t different partial pressures.
The characteristics of different modes of packing uniform spheres have also been calculated by Avery and Ramsay (129). and values are given in Table 5 . 1 . Although in actual gels no such regularity is likely, nevertheless from the porosity of a gel one can approximate the coordination number, n. The density of the gel permits an esti- mate of the pore diameter if the average particle diameter is known. This presup- poses that the ultimate particles in a gel are all of uniform size and this is generally true unless special means are taken to have two particle sizes present.
is frac- tion of porosity) calculated for different coordination numbers, have been considered by Meissner, Michaels, and Kaiser (130), who cited earlier similar considerations by Heesch and Laves (131) and Manegold, Hoffman, and Soff (132) . Meissner proposed a general equation
Alternative packing arrangements with fraction of solids, 4 (where I -
n = 2 exp(2.44)

Physical Characterization 483
POROSITY crn’/crn’ OF BODY PORE RADIUS - 1 \ R: PARTICLE RADIUS 1 l o x R
I O
0 5
0 5 xR
0 a R
0 2 4 6 e IO 12
COORDINATION NUMBER
Figure 5.4. Calculated variation of A , volume porosity (cm’ of pores per cmS of body); B, radius of pores at throats; C, radius of pores in cavities with varying coordination number of spheres forming a three-dimensional gel-type network. [Dashed line from the equation of Meissner, Michaels. and Kaiser (130).]
for which calculated values are shown in Figure 5.4. The fractional volume porosity is I - 4.
To more closely simulate actual gel structures, the studies of random close pack- ing of spheres is pertinent. Scott reports that loose random packing of uniform spheres gives a volume packing density of 0.60 and dense random packing gives 0.64 (133). Results were discussed by Bernal, Mason, and Knight (134, 135). The ef- fect of random sphere packing on capillary properties has been described by Ma- son (127).
Loss of Surface Area by Particle Packing
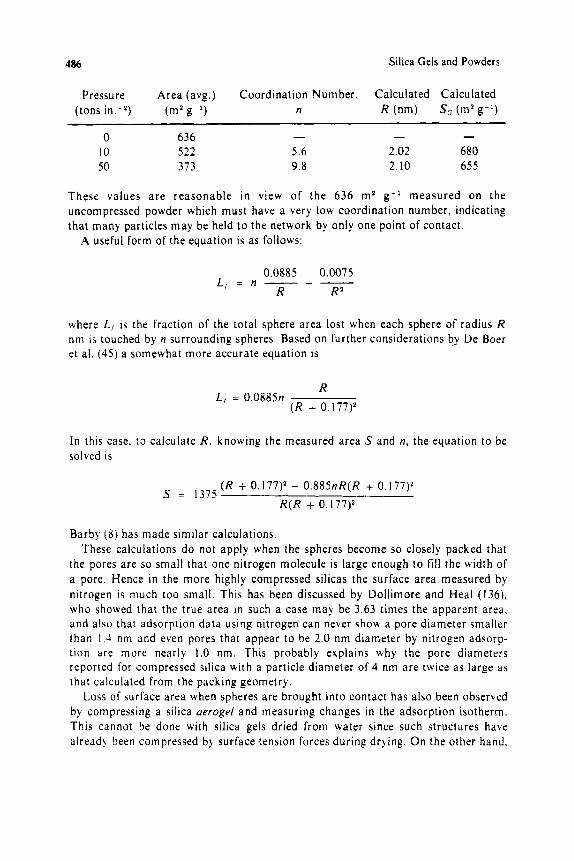
Avery and Ramsay (129) prepared 50, (also ZrOz) particles about 4 nm in diameter as a voluminous powder by a vapor condensation method and compacted this in stages up to 100 tons in . - z . In the original fluffy powder it was not possible to determine any definite “pores” but at the point beyond where a coherent body was obtained, the approximate relation between pressure and the coordination number of silica particles was as follows:

484 Silica Gels and Powders
Pressure Surface Coordination Porosity (tons i n . - 2 ) (mz g-'1 Number (cm3 pores c m - J body)
0 636 3 I O 522 5.6 50 373 9.8
100 219 -
- 0.51 0.33 0.204
It is noted that it is easy to compress particles to a state of approximating cubic packing where the body has about 50% by volume of pores. However, at 100 tons in . -2 the porosity drops to 0.204, which is even less than that of perfect close-packed spheres, which is 0.255. Under this pressure some of the particles may have become flattened together in which case the formulas are not applicable.
The specific surface area of the compressed powder was predicted by an approxi- mate equation assumed by the authors to be
S = S , I - n - ( 4 3
where S is the accessible specific surface area in square meters per gram of a com- pact of spheres of radius R in nanometers, n is the number of contacts of each sphere with other spheres, d is the assumed diameter of the nitrogen molecule 0.375 nm, and S, is the specific surface area of the original separate spheres. For discrete spheres the specific surface S, = 2750/2R m2 g-l , where R is in nanometers. Substi- tuting in the above equation,
SR2 - l375R + 128.9n = 0
Calculation of the ultimate sphere size, R, is thus possible from data of specific surface area and of specific pore volume from which the coordination number can be estimated. Taking the indicated values for S and n, R and SG a re calculated using the above equation:
S (measured) R (calc.) SG (calc.) (m2 g - ' ) n (nm) (m2 g-'1
522 5.6 1.91 719 373 9.8 1.95 70 5
However, this equation may not be valid for such small particles because it was assumed that the nitrogen molecule is of negligible size relative to the silica particles.
A more exact expression for the loss of available surface area when two spheres of radium R are in contact is given i n Figure 5.5.

Physical Characterization 485
Figure 5.5. Area lost to nitrogen adsorption at the point of contact between spherical particles: R , radius of sphere in nanometers; a, radius of nitrogen molecule, 0.177 nm; b, radius of inaccesible circular area.
( R + a)' = R z + bz; b2 = o(2R + U )
Approximate area lost per contact per particle =
rb2 . Fraction of area of sphere lost per contact =
a(2R + a ) / 4 R z . A slightly more accurate value is O.SaR/(R + but this is less convenient in solving for R.
Then in a body of uniformly aggregated spheres the resulting surface area S, is a fraction of the surface area, SG before the spheres came together:
When the variation of S with n is known, the value of R can be calculated from the above equation by substituting for S,:
2750 SG = -- 2R
where (I and R are in nanometers. According to Broekhoff and Linsen (Ref. 4, p. 24) the diameter of the nitrogen molecule should be taken as 3.54 8, so that a is 0.177 nm. The equation becomes:
S R S - 1375.2R2 + 121.7nR - 10.76n = 0
The pore volume pu, in cubic centimeters per gram of S O 2 , can be converted to porosity, pI , by the equation
PU p u + 0.455 P / =
where pI is cubic centimeters of pores per cubic centimeter of the silica body. From this the average coordination number can be found from curve A of Figure 5.4. Then taking the data for surface area S and the coordination number n, the value of R , the particle radius, can be calculated from the above cubic equation. Then SG is cal- culated from 2750/2R.
From the data of Avery and Ramsay:
486 Silica Gels and Powders
Pressure Area (avg.) Coordination Number, Calculated Calculated (tons i n . - 2 ) (m2 g- '1 n R (nm) SG (m2 g- l )
- - - 0 636 I O 522 5 .6 2.02 680 50 3 7 3 9.8 2. IO 655
These values a re reasonable in view of the 636 m 2 g - l measured on the uncompressed powder which must have a very low coordination number, indicating that many particles may be held to the network by only one point of contact.
A useful form of the equation is as follows:
0.0885 0.0075
R R' L / = n - - -
where L , is the fraction of the total sphere area lost when each sphere of radius R n m is touched by n surrounding spheres. Based on further considerations by De Boer et al. (45) a somewhat more accurate equation is
R
( R + 0.177)' L , = 0.0885n
In this case, to calculate R , knowing the measured area S and n, the equation to be solved is
( R + 0.177)' - 0.885nR(R + 0.177)' S = 1375
R ( R + 0. I77)*
Barby ( 8 ) has made similar calculations. These calculations do not apply when the spheres become so closely packed that
the pores are so small that one nitrogen molecule is large enough to f i l l the width of a pore. Hence i n the more highly compressed silicas the surface area measured by nitrogen is much too small. This has been discussed by Dollimore and Heal (136), who showed that the true area in such a case may be 3.63 times the apparent area. and also that adsorption data using nitrogen can never show a pore diameter smaller than 1.3 nm and even pores that appear to be 2.0 nm diameter by nitrogen adsorp- tion are more nearly 1.0 nm. This probably explains why the pore diameters reported for compressed silica with a particle diameter of 4 nm are twice as large as that calculated from the packing geometry.
Loss of surface area when spheres are brought into contact has also been observed by compressing a silica aerogel and measuring changes in the adsorption isotherm. This cannot be done with silica gels dried from water since such structures have alread) been Compressed by surface tension forces during drying. On the other hand,
Physical Characterization 487
Table 5.2. Characteristics of Compressed Aerogel
Figure 5.6 Specific
Curve Compaction Pore Volume Surface Symbol (kg (cma g-I) (m* g-!)
A 0 2.38 906 B 2,000 I .28 858 C 10,000 0.40 660
Source. Nicolaon and Teichner (137).
highly porous aerogels are made without collapse of the structure so that wide pores and very large pore volume can be attained with small particles of high specific sur- face area.
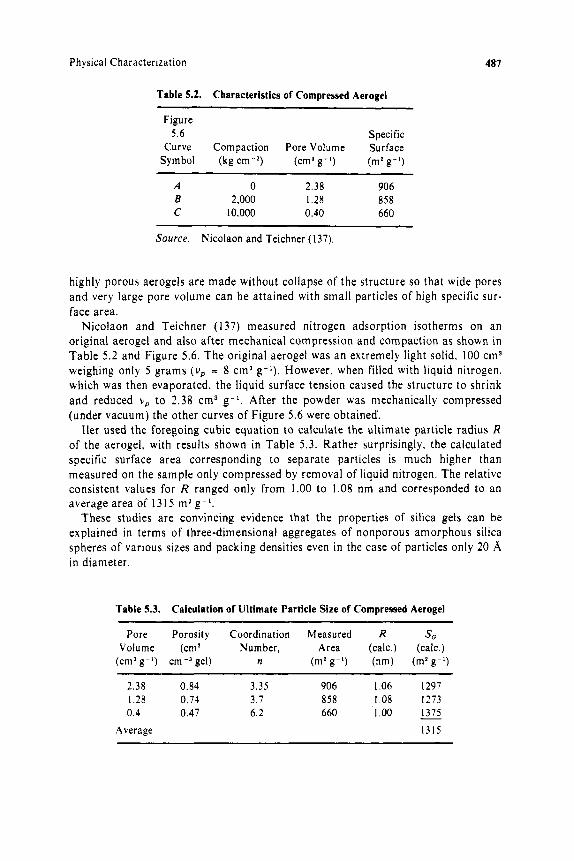
Nicolaon and Teichner (137) measured nitrogen adsorption isotherms on an original aerogel and also after mechanical compression and compaction as shown in Table 5.2 and Figure 5.6. The original aerogel was an extremely light solid, 100 cm3 weighing only 5 grams (v , = 8 cm3 g-l) . However, when filled with liquid nitrogen, which was then evaporated, the liquid surface tension caused the structure to shrink and reduced v p t o 2.38 cm3 g-'. After the powder was mechanically compressed (under vacuum) the other curves of Figure 5.6 were obtained.
Iler used the foregoing cubic equation to calculate the ultimate particle radius R of the aerogel, with results shown in Table 5.3. Rather surprisingly. the calculated specific surface area corresponding to separate particles is much higher than measured on the sample only compressed by removal of liquid nitrogen. The relative consistent values for R ranged only from 1.00 to 1.08 nm and corresponded to an average area of 1315 m2 g- ' .
These studies are convincing evidence that the properties of silica gels can be explained in terms of three-dimensional aggregates of nonporous amorphous silica spheres of various sizes and packing densities even in the case of particles only 20 A in diameter.
Table 5.3. Calculation of Ultimate Particle Size of Compressed Aerogel
Pore Porosity Coordination Measured R sc Volume (cm3 Number, Area (calc.) (calc.)
(cm3 g-l) ~ m - ~ gel) n (mz g-') (nm) (mz g-I)
2.38 0.84 3.35 906 1.06 1297 I .28 0.74 3.7 858 1.08 1273
Average 1315 0.4 0.47 6.2 660 1.00 !375

488 Silica Gels and Powders
1500
N
0 fn w 1000
a U w
z"
500 z
0 0 05
P/ Po
0 977
Figure 5.6. Nitrogen adsorption and desorption isotherms of aerogel. A , not compacted; B, after compaction at 2000 kg cm-': C, after compaction at l0,OOO kg cm-*. (Nicolaon and Teichner ( 1 3 7 ) . ]
Characterizing Pores by Adsorption Isotherms
Sing (8) has presented an exceptionally clear and concise description of adsorption isotherms and methods for their interpretation in terms of pore size distribution. As shown i n Figure 5.7, an adsorbate vapor such as nitrogen or water is adsorbed in a porous gel or powder in increasing amounts a s the relative vapor pressure, p/po, is increased, po being the saturated vapor pressure of the liquid.
Starting at zero pressure ( A ) a typical adsorption isotherm exhibits several stages: first, an increasing fraction of the surface is covered by adsorbed molecules ( E ) . At a certain point around C the surface becomes covered with a single layer of molecules. At this stage those pores with diameters only two or three times the diameter of the adsorbate molecules will also be filled. At higher vapor pressure ( D ) larger pores begin to be filled. When p nears po, ( E ) liquid fills all pores and gives a measure of the pore volume. At first it was thought that pore diameter could be calculated from the Kelvin equation (138) based on the theory that liquid remains in pores even when the vapor pressure is lower than that of the massive liquid phase. since the vapor pressure of the liquid in the pores is lowered because of surface-tension effects in small capillaries. Kelvin's equation (138) relates the vapor pressure, p. a t which

Physical Characterization 489
vapor will condense in a cylindrical capillary, to radius r k :
-2 a v c o ~ e rk =
R T(2.303)log p/p0
wherea = surface tension of liquid nitrogen at its boiling point ( - 195.8"C) = 8.85 ergs
0 = angle of wetting, taken as zero so that cos 8 = I V = molar volume of liquid nitrogen = 34.7 cm3 R = gas constant = 8.314 x IO' ergs deg-I mole-' T = absolute temperature = 77OK
For nitrogen the equation simplifies to
4. I46 r k = -
1% PolP
where rk is the capillary radius which fills at a partial pressure ofplp,. However, this is substantially true only for larger capillaries. When the diameter of a capillary approaches molecular dimensions it is necessary to take into account the fact that when p/po exceeds about 0.2-0.3, even a flat surface becomes covered with a monomolecular layer of adsorbate. For example, a t p/po = 0.93 the layer is four
0.5 P / P o 1 .o
A C D E
Figure 5.7. partial pressure. [Iler (2), by permission of Cornell University Press,]
Stages in adsorption of vapor and filling of pores with liquid with increasing

490 Silica Gels and Powders
molecules thick (I4 A ) . The Kelvin equation indicates the additional amount of adsorbate over and above that which condenses on a flat surface a t a given p / p o . Hence i f t is the thickness of the adsorbed layer on a flat surface, the pore radius, rp . that is filled at p / p o is then
As shown in A in Figure 5.8. after pores are filled and the pressure is again reduced. the isotherm often follows a different course because a somewhat lower pressure is required to evaporate the liquid. This "hysreresis loop" occurs because in most gel structures there are pore cavities which are larger i n diameter than the openings leading into them. As a pore is emptied, the pressure is controlled by the smaller diameter of the opening which retains a liquid meniscus as the inner larger cavity is emptied.
A different situation exists i f all the pores are so small that they are no larger than only a few times the diameter of the adsorbate molecule, for example, 20 A diameter pores with nitrogen molecules 3.54 A i n diameter. As shown in B in Figure 5.8, the pores may become filled even at low pressure. In this case it is difficult to determine the point corresponding to a monolayer.
"Persorption" was a term coined by McBain (139) for adsorption in pores only one or two molecular diameters wide. More recently, pores generally less than 20 A in diameter have been designated as "micropores." I n such pores, the heat of adsorption is higher than on planar surfaces, and pores can become filled even below the pressure where a monomolecular layer is formed on a plane surface. Some silica gels. even those having large pores, have a certain volume of very small pores (140). These may occur as the crevices between colloidal particles making up the gel, as postulated b j Carman (141). Adsorption of alcohol vapors on random-packed glass spheres. with capillary condensation in the crevices at the points of contact of the spheres, has been studied by Shereskefsky and Russel (142). This is essentially a large-scale model of the probable structure of certain silica gels, particularly those made by drying down sols of uniform colloidal silica particles. O n the other hand,
K 0
N W a
z a i n " W m
K
0 s: a
B 400m! A
0.5 1.0 p, 0.5 I .O
Figure 5.8. Representative nitrogen adsorption isotherms o f A , mesoporous gel with 36 A radius pores: B. microporous gel with 10 A radius pores. [Iler (2). by permission of Cornell University Press.]
Physical Characterization 491
N
0 v)
LL 0
I E W a
6
5i
%
a w
m
m
U
4
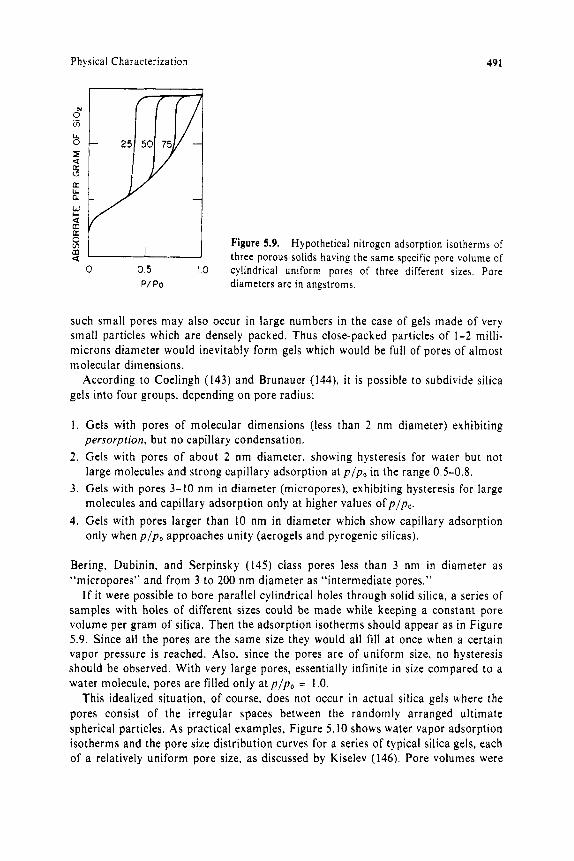
Figure 5.9. Hypothetical nitrogen adsorption isotherms of three porous solids having the same sDecific Dore volume of
0 0 5 I O cylindrical uniform pores of three ‘different sizes. Pore diameters are in angstroms. P/ Po
such small pores may also occur in large numbers in the case of gels made of very small particles which are densely packed. Thus close-packed particles of 1-2 milli- microns diameter would inevitably form gels which would be full of pores of almost molecular dimensions.
According to Coelingh (143) and Brunauer (144), it is possible to subdivide silica gels into four groups, depending on pore radius:
1 . Gels with pores of molecular dimensions (less than 2 nm diameter) exhibiting
2 . Gels with pores of about 2 nm diameter, showing hysteresis for water but not
3. Gels with pores 3-10 nm in diameter (micropores), exhibiting hysteresis for large
4. Gels with pores larger than IO nm in diameter which show capillary adsorption
persorplion. but no capillary condensation.
large molecules and strong capillary adsorption at p / p o in the range 0.5-0.8.
molecules and capillary adsorption only at higher values of p / p o .
only when p / p o approaches unity (aerogels and pyrogenic silicas).
Bering, Dubinin, and Serpinsky (145) class pores less than 3 nm i n diameter as “micropores” and from 3 to 200 nm diameter as “intermediate pores.”
I f i t were possible to bore parallel cylindrical holes through solid silica, a series of samples with holes of different sizes could be made while keeping a constant pore volume per gram of silica. Then the adsorption isotherms should appear as in Figure 5.9. Since all the pores are the same size they would all fill at once when a certain vapor pressure is reached. Also, since the pores are of uniform size, no hysteresis should be observed. With very large pores, essentially infinite in size compared to a water molecule, pores are filled only at p / p o = 1.0.
This idealized situation, of course, does not occur i n actual silica gels where the pores consist of the irregular spaces between the randomly arranged ultimate spherical particles. As practical examples, Figure 5. I O shows water vapor adsorption isotherms and the pore size distribution curves for a series of typical silica gels, each of a relatively uniform pore size, as discussed by Kiselev (146). Pore volumes were

492 Silica Gels and Powders
0 50 I00 I50 200 250 d l
0 0 4 0 8 0 4 0 8 0 4 08 0 4 0 8 0 4 0 8 0 4 0 8
P I Po
90 0
6 z 70 (L
x) n
t 4 0
cn $ 30
20
IO
0
Figure 5.10. distribution curves. Peak pore diameters given in angstroms. [Kiselev (146).]
Adsorption isotherms of water on various silica gels and corresponding pore size
essentially the same in gels 2 and 3 and i n 4 and 5 as shown by about the same amounts of water required to f i l l the pores. Thus for gels 2 and 3, 50 millimoles H,O per gram of gel equals 0.9 cm3 of H 2 0 per gram. The areas under the pore size dis- tribution curves for the same samples, 2 and 3, are about equal and also amount to the same value of 0 .9 cms g-I. These isotherms are representative of the range of silica gels that are commonly made.
Pore Volume
The pore volume is indicated by the volume of liquid nitrogen required to f i l l the pores as the pressure approaches p / p o = I . The volume of liquid = 1.55 x I O - s V,, where V , is the gas volume a t STP. As shown in Figure 5.10, the volume adsorbed is clearly indicated at the end of the curve. This is true as long as the specimen has a certain rigidity and form, that is, occupies a definite volume and has a measurable density. However, in the case of very fragile aerogels or loose, easily compressed powders, the isotherm continues upward with no measurable break as bulk liquid nitrogen begins to condense.
T o determine the total pore volume, Lard and Brown (147) recommended a flow method whereby a nitrogen-helium mixture containing 96.7% nitrogen is equili- brated with the sample at liquid nitrogen temperature. Then the sample is warmed

Physical Characterization 493
to 25°C and the volume of evolved nitrogen gas is measured. Only simple volumetric apparatus is needed. Presumably, for very wide-pored material a mixture containing 99% or more nitrogen would be used to ensure pore filling.
The oil absorption test, long used to evaluate carbon blacks and pigments, can give an indication of pore volume. A nonvolatile liquid that readily penetrates the pores in silica, is used. Using the term “oil” in this sense, for example, glycol, the amount of “oil” absorbed by a silica powder is an indirect measure of porosity. As the oil is mixed with the silica, the mass remains pulverulent until the pores are filled, at which point the mass loses its friable nature and can be molded into a single mass held together by the surface tension of a thin film of liquid on the outer surface of the porous aggregates (148). However, with finely divided aggregates the space between the aggregates also is filled with oil, and the volume of oil needed to make a coherent mass about equals the volume of the gel aggregates plus the pore volume, assuming aggregates of uniform size.
Pore Size and Size Distribution
These characteristics can be estimated in several ways from desorption isotherms. Broekhoff and Linsen have reviewed this subject in some detail (149): In addition to the laborious process of accurately measuring the adsorption isotherm, most methods involve separate calculations for a large number of intervals of the isotherm. However, with greatly improved control and read-out capabilities for get- ting the data and computer programs to calculate pore size, the labor has been greatly reduced.
Two types of commercial apparatus are available, one using a vacuum system as i n the original BET method (Micromeritics) and another the flow system (Quantachrome). An isotherm with 10-15 points can be determined i n a few hours and surface area and pore size distribution quickly obtained (150, 151).
Various mathematical approaches to calculation of pore size distribution have evolved during the past century.
The t-plot is involved in most of the methods for the reason that on a relatively flat surface in the absence of pores, adsorption occurs and the adsorbed film becomes several molecular layers thick before the vapor pressure reaches p/po = 1 .O for the bulk liquid. Obviously, in the multilayer film the properties of the nitrogen are not the same as in the bulk. As already pointed out, determination of pore size requires not only the Kelvin equation to calculate the size of pores that fill with bulk liquid nitrogen but also the thickness of the adsorbed film on the inner surface of pores that are not filled.
To obtain experimental data on film thickness the silica must be free of micropores. Harris and Sing ( I 52) examined a number of such silicas of low surface area (less than 12 m2 g-l) and published an average isotherm in terms of v / v , versus pip,,. However, since then numerous workers have made suitable nonporous silicas for more accurate determination of t-values. Very uniform large pores in silica with no micropores were prepared by Bebris, Kiselev, and Nikitin (153), by heating the pyrogenic “Aerosil” in steam at 750°C, giving a silica with an area about 70-80 m2 g- l with pores about 400 A in diameter. Generally accepted values o f t for various

494 Silica Gels and Powders
values of p/po. using nitrogen. are based on data by Lippens, Linsen, and De Boer ( 1 54) and De Boer. Linsen, and Osind ( I 55).
Table 5.4 lists typical (-values versus p/po, and the following equation represents the average of most of the available data at p / p o greater than 0.3:
Man) workers contributed to the development of methods for calculating pore size distribution from the adsorption isotherm, a s described by Broekhoff and Linsen (156). The original approach and general equation developed by Barret, Joyner, and Halenda ( I 57) was followed up by Pierce (I 58) and later by Cranston and Inkley. The subsequent evolution of the subject has been described in detail by Gregg and Sing ( 7 ) .
C R A S S I O N ASD I N K L E Y METHOD. Cranston and lnkley (39) used the known thick- ness, I . of the film of nitrogen on the inner walls of the pores, along with the diameter of pores filled by nitrogen according to the Kelvin equation, to develop a procedure for calculating the volume and size o f pores from the desorption or adsorption isotherm. Use is made of the portion of the isotherm for p/po above 0.3 where at least a monomolecular layer of nitrogen is adsorbed.
It is a stepwise procedure which, though simple, involves several calculations a t each step. The desorption isotherm consists of a series of experimental points at each of which the adsorbed volume of gas is measured a t a given pressure. Start ing at p / p o = 1 .O with full pores, the pressure is reduced stepwise and the adsorbed volume noted at each step. (This applies to desorption, but the calculations are the same i f the adsorption isotherm is used.) As pressure is reduced from a value o f p , / p , to p2/po. the following are true:
I . A volume of liquid nitrogen A V , , , is evaporated from pores, forming a gas volume AVg, usually expressed as cubic centimeters at S T P per gram of adsorbent.
Table 5.4. Nonporous Surface at - 195°C versus Partial Pressure of Nitrogen
Film Thickness of Nitrogen Adsorbed on
PIP0 ( ( A ) PIP0 f ( A ) P I P 0 [ ( A ) ~~~~~~~
0 3 5 6 0 6 6 8 0 090 1 2 7 0 4 6 2 070 8 5 093 1 4 4 0 5 6 8 0 7 6 9 2 0 9 6 1 7 3 0 5 6 7 2 080 9 9 098 2 2 1 0 6 7 5 0 8 6 I I 2 099 278
Sortrcr Lippens. Linsrn. and De Boer (154)

Physical Characterization 495
Figure 5.1 1. An idealized adsorbent with cylindrical pores shown in cross-section with nitrogen adsorbed at pressure pI and pz. A , pressure p l : all pores of radius less than r l are filled with liquid. The adsorbed film thickness is I , and the Kelvin radius filled by the surface tension effect is r * , . E. a lower pressurep,: more pores are empty; those with radius less than rz remain filled. The adsorbed film thickness, tZ. is less than t l . The Kelvin radius rllt is also smaller than r k , . L is the total length of pores emptied as pressure was reduced. (see text)
2. A volume P V,,, of liquid nitrogen has emptied from the pores with radii between
3. In pores emptied in previous steps. the nitrogen film thickness on the walls is V , and Vz. leaving a film of nitrogen on the walls of thickness t Z .
reduced from r , to 1,.
For the uninitiated, Figure 5. I 1 may be helpful. This represents a cross-section of a sample with idealized cylindrical pores of different sizes, showing the decrease in thickness of the film of nitrogen on the walls of empty capillaries from I , t o rz . and also the decrease in liquid nitrogen that is desorbed. leaving more empty pores, when the pressure is reduced from p 1 in A to p z in B .
In A of Figure 5.1 1, there is one partly filled pore with diameter Zr,, in which the liquid nitrogen is just in equilibrium with the vapor a t pressure pl. Similarly, in B,
Next Page