Embed Size (px)
Citation preview
5
Reducing Tariffs versus Expanding Tariff Rate Quotas
Harry de Gorter and Erika Kliauga
Tariff rate quotas (TRQs) are two-level tariffs, with a limited volume of imports permitted at the
lower “in-quota” tariff and all subsequent imports charged the (often much) higher “out-of-
quota” tariff (Ingco 1996; OECD 2001). In lieu of high bound tariffs resulting from tariffication
in the Uruguay Round Agreement on Agriculture (URAA), TRQs were adopted for commodities
previously subject to nontariff protection. They were meant to guarantee minimum levels of
market access (initially 3 percent of domestic consumption, gradually expanded to 5 percent by
the end of the implementation period) through “minimum access quotas” and to safeguard
current levels of access through “current access quotas” (IATRC 2001a). Hence TRQs may have
expanded imports during the URAA implementation period. A total of 1,425 TRQs have been
notified to the World Trade Organization (WTO) by 43 countries (WTO 2002c). The
implementation was envisioned to maintain or improve preferential market access for developing
countries, while often continuing to maintain a managed trade regime (Abbott 2002). Since a
substantial proportion of agricultural production in developed countries is protected by TRQs,
there is an interest in determining the potential effects of the different ways of liberalizing TRQs.
When demand for imports at the low, in-quota tariff is greater than the level of imports
allowed by the quota, imports must be rationed, and so the method by which the rights to the
quotas are allocated also becomes important. The rights to the quota are allocated by one of
several methods, each with numerous conditions that affect “fill” rates and efficiency. Although
TRQs may have provided for more trade, a majority of the TRQs are not being filled (WTO
2002a, 2003b, 2003c). While market forces may be a factor, there is widespread agreement that
quota under-fill is in part attributable to the administration methods employed to implement
TRQs.1
The purpose of this chapter is to evaluate the relative importance of tariff reductions
versus quota expansion in liberalizing agricultural trade. In doing so, the extent of quota underfill
and the potential influence of quota administration methods on imports is explored. The effects
of expanding TRQs or reducing tariffs in the WTO negotiations on agriculture depend on several
1

key factors: which instrument is binding (the quota itself, or the in-quota or out-of-quota tariff),
whether there are imports above the quota at in-quota tariff rates (“overquota imports”), the
extent if any of quota underfill, the levels of in-quota and out-of-quota tariffs, the level of water
in the tariffs and tariff binding overhang, the methods of administering the rights to the quotas
(with or without licenses), and any government responses in changing domestic policy
instruments. 2
The rest of this chapter is organized as follows. The next section presents data showing
the importance of TRQs in protecting domestic agricultural production and trade in developed
countries. We then explain the economics of liberalizing TRQs by identifying four basic
regimes: the first three are where the in-quota tariff, the quota, and the out-of-quota tariff,
respectively, determine imports, while the fourth regime is where the government allows for
overquota imports at the in-quota tariff (where no trade liberalization occurs initially with either
an out-of-quota tariff reduction or an increase in the quota). Data are presented on the value of
trade, quota under- or overfill, and tariff levels for each of these regimes. We then evaluate the
trade liberalizing effects of a 35 percent reduction in tariffs compared with a 50 percent increase
in quotas to obtain a glimpse of the situation regarding TRQs and the relative importance of each
initial regime. Data are then presented along with an analysis of the administration methods and
additional regulations for the TRQs notified to the WTO. Summary data by country and
commodity are presented on tariff levels, import values, and quota underfill. We touch on some
important issues that may affect the efficacy of TRQs, including minimum versus current access
quotas, changes in TRQ administration methods over time, dynamic rent-seeking activities, and
domestic policy responses. The chapter ends with some concluding comments and identifies
priorities for further research.
<<A>>The Importance of TRQs<<end>>
As many as 43 of the nearly 150 members of the WTO employ TRQs in agriculture, and 20
percent of their agricultural tariff lines involve TRQs (Gibson and others 2001; Wainio 2001).
Table 5.1 summarizes the value of production protected by TRQs for the countries and
commodities monitored by the Secretariat of the OECD (Organisation for Economic Co-
operation and Development). It shows that 51 percent of the total is protected by tariff quotas.
This number understates the true magnitude because it omits the lightly shaded cells in table 5.1,
2
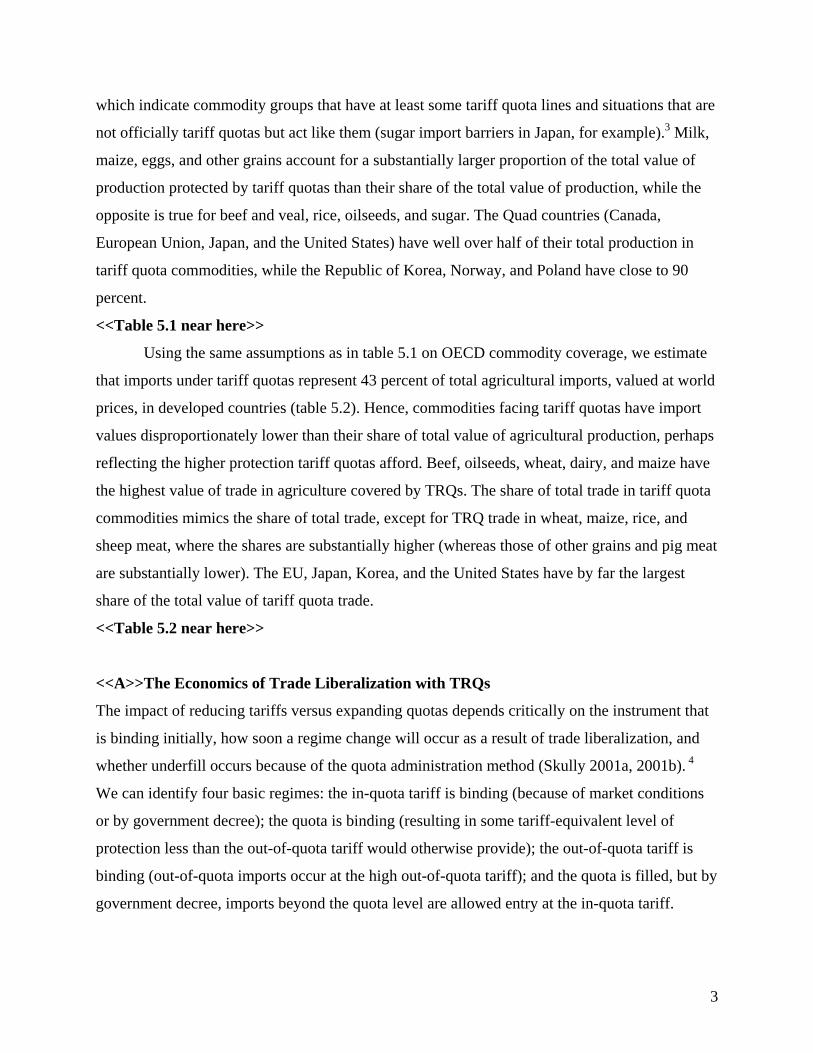
which indicate commodity groups that have at least some tariff quota lines and situations that are
not officially tariff quotas but act like them (sugar import barriers in Japan, for example).3 Milk,
maize, eggs, and other grains account for a substantially larger proportion of the total value of
production protected by tariff quotas than their share of the total value of production, while the
opposite is true for beef and veal, rice, oilseeds, and sugar. The Quad countries (Canada,
European Union, Japan, and the United States) have well over half of their total production in
tariff quota commodities, while the Republic of Korea, Norway, and Poland have close to 90
percent.
<<Table 5.1 near here>>
Using the same assumptions as in table 5.1 on OECD commodity coverage, we estimate
that imports under tariff quotas represent 43 percent of total agricultural imports, valued at world
prices, in developed countries (table 5.2). Hence, commodities facing tariff quotas have import
values disproportionately lower than their share of total value of agricultural production, perhaps
reflecting the higher protection tariff quotas afford. Beef, oilseeds, wheat, dairy, and maize have
the highest value of trade in agriculture covered by TRQs. The share of total trade in tariff quota
commodities mimics the share of total trade, except for TRQ trade in wheat, maize, rice, and
sheep meat, where the shares are substantially higher (whereas those of other grains and pig meat
are substantially lower). The EU, Japan, Korea, and the United States have by far the largest
share of the total value of tariff quota trade.
<<Table 5.2 near here>>
<<A>>The Economics of Trade Liberalization with TRQs
The impact of reducing tariffs versus expanding quotas depends critically on the instrument that
is binding initially, how soon a regime change will occur as a result of trade liberalization, and
whether underfill occurs because of the quota administration method (Skully 2001a, 2001b). 4
We can identify four basic regimes: the in-quota tariff is binding (because of market conditions
or by government decree); the quota is binding (resulting in some tariff-equivalent level of
protection less than the out-of-quota tariff would otherwise provide); the out-of-quota tariff is
binding (out-of-quota imports occur at the high out-of-quota tariff); and the quota is filled, but by
government decree, imports beyond the quota level are allowed entry at the in-quota tariff.
3
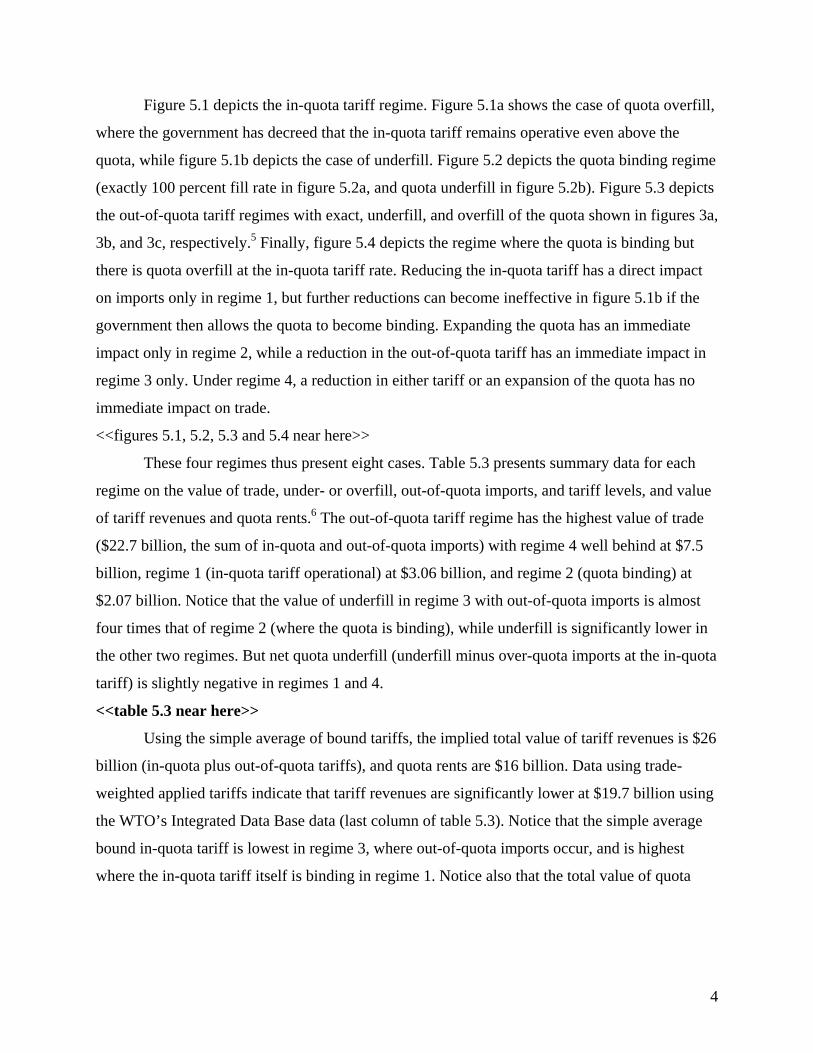
Figure 5.1 depicts the in-quota tariff regime. Figure 5.1a shows the case of quota overfill,
where the government has decreed that the in-quota tariff remains operative even above the
quota, while figure 5.1b depicts the case of underfill. Figure 5.2 depicts the quota binding regime
(exactly 100 percent fill rate in figure 5.2a, and quota underfill in figure 5.2b). Figure 5.3 depicts
the out-of-quota tariff regimes with exact, underfill, and overfill of the quota shown in figures 3a,
3b, and 3c, respectively.5 Finally, figure 5.4 depicts the regime where the quota is binding but
there is quota overfill at the in-quota tariff rate. Reducing the in-quota tariff has a direct impact
on imports only in regime 1, but further reductions can become ineffective in figure 5.1b if the
government then allows the quota to become binding. Expanding the quota has an immediate
impact only in regime 2, while a reduction in the out-of-quota tariff has an immediate impact in
regime 3 only. Under regime 4, a reduction in either tariff or an expansion of the quota has no
immediate impact on trade.
<<figures 5.1, 5.2, 5.3 and 5.4 near here>>
These four regimes thus present eight cases. Table 5.3 presents summary data for each
regime on the value of trade, under- or overfill, out-of-quota imports, and tariff levels, and value
of tariff revenues and quota rents.6 The out-of-quota tariff regime has the highest value of trade
($22.7 billion, the sum of in-quota and out-of-quota imports) with regime 4 well behind at $7.5
billion, regime 1 (in-quota tariff operational) at $3.06 billion, and regime 2 (quota binding) at
$2.07 billion. Notice that the value of underfill in regime 3 with out-of-quota imports is almost
four times that of regime 2 (where the quota is binding), while underfill is significantly lower in
the other two regimes. But net quota underfill (underfill minus over-quota imports at the in-quota
tariff) is slightly negative in regimes 1 and 4.
<<table 5.3 near here>>
Using the simple average of bound tariffs, the implied total value of tariff revenues is $26
billion (in-quota plus out-of-quota tariffs), and quota rents are $16 billion. Data using trade-
weighted applied tariffs indicate that tariff revenues are significantly lower at $19.7 billion using
the WTO’s Integrated Data Base data (last column of table 5.3). Notice that the simple average
bound in-quota tariff is lowest in regime 3, where out-of-quota imports occur, and is highest
where the in-quota tariff itself is binding in regime 1. Notice also that the total value of quota
4
underfill is 48 percent of the total value of the quota, which has implications for how the quota is
administered (see below). 7
Approximately 45 percent of all tariff quotas are minimum access quotas, representing a
lower share of total value of TRQ trade (42 percent; see the third column in table 5.3). Under the
URAA, these quotas increased from 3 to 5 percent of consumption during each country’s
implementation period.8 Note that the highest share of minimum access quota trade is in regimes
that have lower trade liberalization effects with quota expansion, namely, regimes 1b and 2b.
Quotas do not matter in regime 1, but quota underfill in 2b and overfill in regime 4 lower the
impact of increases in quotas. The other 55 percent of the quotas are current access quotas, which
were implemented to allow developed countries (such as the EU) to continue to extend
preferential access to developing countries or to maintain historical access in cases where
imports are a large proportion of domestic consumption (for example, wheat in Japan). If only
minimum access quotas were to be expanded in the negotiations, as in the URAA, only 45
percent of quotas would be expanded, substantially reducing the impact of any given expansion
of TRQs.
<<B>>An Empirical Assessment of Trade Liberalization<<end>>
An estimate of the effect on the total value of TRQ imports of a 35 percent reduction in tariffs
and a 50 percent expansion in import quotas is presented in table 5.4. A 35 percent reduction in
the out-of-quota tariffs has a larger impact, expanding trade by $18.3 billion which is a 51.5
percent increase in the value of total TRQ trade. Most of the increase in trade with a reduction in
out-of-quota tariffs comes from changes in imports under regime 3; very little comes from
regime 2. The relative increase in imports from regimes 2, 3, and 4 with a decrease in the out-of-
quota tariff depends on the level of trade initially in each regime and on the level of out-of-quota
tariffs. The trade liberalization effects also depends critically on the amount of water in the tariff
for regimes 2 and 4 (assumed here to be 50 percent of the gap between the out-of-quota and in-
quota tariff levels, as assumed by Bouët, Fontagné and Jean 2005). We also assume that the
elasticity of excess demand is -4.63 and that world prices do not change.9 These assumptions
affect the results (the most critical assumption relates to water in the tariff), but a sense of the
relative impacts of tariff reductions versus quota expansion is nonetheless obtained.
5
<<table 5.4 near here>>
Expanding quotas by 50 percent, in contrast, results in a 14.5 percent increase in the
value of total TRQ imports ($5.1 billion). The increase in trade comes from regimes 2, 3, and 4,
the latter case where the quota is not binding initially. Note that quotas up to a 105 percent fill
rate were included in regime 4 (instead of assuming the out-of-quota tariff is automatically
binding for fill rates between 100 and 105 percent). This means overquota imports are a lower
percent of the quota in many instances in regime 4, so a quota expansion has a relatively larger
impact.
Three key factors determine the relative amount of trade expansion resulting from an
increase in quotas: the level of initial trade in each regime; the degree of underfill in regimes 2b
and 3b, and the level of overfill in regimes 3c and 4. If quota overfill is significant, then an
increase in quotas will have no effect on trade. The impact of underfill on trade liberalization
with a quota increase (regimes 2b and 3b) depends on the assumption one makes as to how the
fill rate changes (de Gorter and Boughner 1999). Here we assume the fill rate remains constant,
so an increase in the quota has a proportionate increase in observed imports. But one could
consider two other plausible scenarios: the underfill has to disappear before trade shows a
change, or the absolute level of the underfill is fixed so that the initial change in trade equals the
change in the import quota. Which of the three assumptions one makes in analyzing the impact
of quota expansion rests heavily on one’s view as to why there is underfill in the first place, a
topic we take up later with our discussion of the importance of administration methods on quota
underfill.
Imports can expand in regimes 2, 3, and 4 if the quota expands substantially (but this is
less likely in regime 3, where imports are initially above the quota), but the in-quota tariff may
put a brake on the effectiveness of the quota increase. Hence, it is important to emphasize the
benefits of a simultaneous reduction in in-quota tariffs, even though these tariffs directly affect
imports only in regime 1. Negotiators will have to decide whether to increase both current and
minimum access quotas (by, say, 50 percent) or to increase minimum access quotas to 10 percent
of consumption (current consumption or that in the base year 1986–88) and require no increases
in current access quotas.10
6
Average in-quota tariffs are still very high, compared with tariffs on products not
attached to TRQs, so room for either increasing imports or increasing quota rents remains
substantial. However, trade-weighted tariffs are lower: 54 percent, compared with 59 and 115
percent for in-quota and out-of-quota simple average tariffs, respectively (table 5.3). Using the
simple average tariff may not be so misleading because bound tariffs are to be negotiated, and if
an average tariff-cut formula is used, or sensitive products are not controlled tightly, tariff peaks
may remain. Average tariffs need to be interpreted with care because production-weighted tariff
equivalents of import barriers as calculated by the OECD are not directly comparable with
average tariffs. This is because so many tariff lines and associated imports do not directly protect
domestic production. Take the U.S. dairy case as an example: because so many different cheeses
and other dairy products are imported (with more than half the value of U.S. dairy imports being
nonquota), the average applied tariff (whether a weighted or a simple average) is far lower than
the level of protection of domestically produced dairy products.
The last column of table 5.4 gives an estimate of the minimum increase in value of trade
across the two possible instruments to liberalize for each of the eight cases presented. The
change in total value of trade under the minimum is $2.8 billion, significantly less than the
increase with either the quota expansion or the out-of-quota tariff reduction scenarios. This
finding emphasizes the importance of not allowing importing countries to choose between
reducing tariffs or expanding quotas, as has been proposed.
The reduction of out-of-quota tariffs holds much promise in liberalizing trade, as the
simulations earlier indicated. The outcome depends heavily on what level of tariff reduction
versus quota expansion one assumes and also on the level of water in the tariffs. Table 5.5
provides some estimates of water in the tariff for selected countries and commodities. Estimates
of the tariff equivalent of the binding quota are given (taken from nominal protection coefficients
given in OECD 2003), alongside the implied tariff equivalent with our assumption of the water
to be 50 percent of the difference between the out-of-quota and in-quota tariff levels. We present
two possibilities: using the average out-of-quota tariff or the line with the highest tariff included
in the quota category. The actual and assumed water in the tariff are then compared, with the last
two columns of table 5.5 indicating the error in our assumption using the average and the
maximum out-of-quota tariffs, respectively. We overestimate the water and hence underestimate
7
the trade liberalizing effects of an out-of-quota tariff reduction when using average tariffs, but
we underestimate water and so overestimate trade liberalization effects when we assume that a
maximum tariff protects domestic production. Hence, substantial reductions in out-of-quota
tariffs may be needed in regimes 2 and 4 before trade liberalization occurs, especially with the
high number of tariff peaks and tariff dispersion.
<<table 5.5 near here>>
Finally, one has to allow for the possibility of tariff binding overhang for both in-quota
and out-of-quota tariffs, where the applied tariff is below the bound tariff. Overhang would make
tariff reductions in table 5.4 even more muted, given that bound rates are assumed to be affecting
trade levels in our analysis. Jean, Laborde, and Martin (2005) present estimates of the binding
overhang. They find that the average applied tariff is about half of the bound tariff in several
developed countries and even less in developing countries.
<<B>> Preliminary Conclusions from Empirical Evidence
Our empirical data thus indicate that reducing out-of-quota tariffs is the most effective means of
liberalizing trade—the same result that the OECD found. Our conclusion, however, is heavily
dependent on the level of water assumed in the tariffs. Also, we do not know what would happen
if all three liberalizations occurred simultaneously. Reducing the in-quota tariff for those cases
where the in-quota tariff is binding and there is no in-quota tariff binding overhang has limited
effects (as shown in table 5.4), because the in-quota tariff is binding initially for so little trade in
TRQ commodities. In cases where the in-quota tariff is not binding, however, an increase in
quota rents will occur, perhaps spurring more political pressure from domestic firms to maintain
the status quo and reducing efficiency, depending on the quota administration method (discussed
later).
Reductions in out-of-quota tariffs will be more effective only if water in the tariffs can be
eliminated and only where fill rates are less than 100 percent because of administration methods
and additional regulations. Which approaches to reform are of greatest benefit to developing
countries will depend critically on who obtains the quota rents. Reductions in out-of-quota tariffs
can reduce rents while expansion of the quota can increase rents, even when the per unit rent
falls.
8
<<A>>Methods of Quota Administration and Additional Regulations<<end>>
TRQ administration involves distributing the rights to import at the in-quota tariff. Whoever
obtains such rights can make a risk-free profit from the difference between the domestic price
and the world price inclusive of the in-quota tariff (Skully 1999, 2001a). Therefore, governments
need to ration or otherwise administer the TRQ. We summarize the definitions of the alternative
tariff quota administration methods in table 5.6. Applied tariffs are by far the most used method,
representing 39.3 percent of the total number of TRQs (but only 14.4 percent of the total value of
TRQ trade). Licenses on demand; first-come, first-served; and historical importers are the next
most commonly used methods in descending order of importance, representing 28, 12, and 9
percent of total TRQs (but each having 17–19 percent of the total value of trade). Auctions are
the next most commonly used method, representing only 5.4 percent of the total number of
TRQs and less than 1 percent of the total value of trade. Other administration methods include
state trading enterprises (STEs) (producer groups are subsumed in this category) and mixed
methods (a combination of at least two administration methods), for which the share of trade was
much higher than the corresponding share of TRQs. Finally, for some TRQs, no administration
methods are specified, so the information on how these TRQs are administered is incomplete.
<table 5.6 near here>>
First-come, first-served is the third most widely used administration method in terms of
trade value. The high use of this method has several implications, one of which is that some of
the potential quota rents are likely to be appropriated by consumers or middlemen (Chau, de
Gorter, and Hranaiova 2003). Furthermore, there is the likelihood of rent dissipation in rent
seeking as firms try to mitigate the negative impacts of first-come, first-served on prices when
imports are brought forward in order to obtain the quota rents.
Approximately 36 percent of all tariff quotas are filled (407 TRQs have a fill rate above
100 percent, divided by a total of 1,121 TRQs in table 5.6). Quota overfill occurs in the applied
tariff, state trading enterprise, and mixed allocation categories. A total of 278 quotas were
overfilled (at the in-quota tariff) and 129 quotas exactly filled at 100 percent fill rate (data are not
reported in table). There is a bimodal distribution of fill rates, with 339 TRQs having a fill rate of
less than 20 percent with a simple average fill rate of only 4 percent, but the trade-weighted fill
9
rates are significantly higher (no average was calculated for the trade weighted fill rates). The
simple average fill rates as reported by the WTO and cited by many academic studies give the
same picture as the trade-weighted fill rates developed in this paper. The average fill rate as
reported in this paper is 60.6 percent excluding overquota imports, while the trade-weighted fill
rate is 60.9 percent. Indeed, the quota overfill for the applied tariff, state trading enterprise, and
mixed allocation categories, amounted to $3.1 billion (see table 5.3). Underfill net of overquota
imports, in contrast, is $13.7 billion, with license on demand; first-come, first-served; and
historical importer categories having the largest underfill levels. These three administration types
have the highest share of trade and so are important to analyze. As we show later, these three
administration types are prone to inefficiency. Finally, the value of quota underfill is estimated to
be $16.8 billion, approximately 48 percent of the value of the quota when filled (assuming world
prices do not change), thereby representing a huge amount of trade and rents forgone.11 This lost
potential value of tariff revenues and quota rents may be dissipated to a large extent (or
appropriated by other countries or groups), so further analysis of tariff quota administration
methods and additional regulations is warranted (see later discussion).
Average in-quota tariffs are highest for applied tariffs and auctions, while the average
out-of-quota tariffs are also high for these same methods, as well as for the state trading
enterprise method. Reducing in-quota tariffs would have an impact on trade only for cases
described by regime 1. Even then, the benefits of some reductions in the in-quota tariff would
end when it causes a regime change to a binding quota, thereby generating quota rents. Either
way, the reduction of in-quota tariffs increases quota rents and hence political opposition to trade
liberalization. As we show later, the increase in per unit rent can have very different effects on
efficiency, depending on the quota administration method in place.
Several other key regulations can also affect the fill rate, such as time limits, past trading
performance (applied to methods other than historical importers), license limits per firm,
seasonal quotas (quarterly or semiannual), domestic purchase requirements, and taxes for
licenses and nonuse. Table 5.7 summarizes the number of quotas, countries, commodities, and
filled quotas for each additional type of regulation. These additional conditions imposed on firms
are very significant, affecting many quotas, countries, and commodities. Time limits, for
example, affect $7.7 billion of trade. Fill rates are particularly low for seasonal, export
10
certificates, license fees, and provision for unused licenses. For example, less than 10 percent of
the seasonal quotas are filled, while the “provision for entry” has a high proportion of filled
quotas, second only to license fees; later, we show how fees can increase efficiency. Note that
“use-it-or-lose-it” is one of three regulations with a trade-weighted fill rate over 100 percent,
implying that firms perhaps import when it does not pay in order to hold the valuable asset for
later use, thereby adding to inefficiencies.
<<table 5.7 near here>>
The next step is to match each additional regulation with the principal quota
administration method (table 5.8). Analysis of this table reveals a high number of additional
regulations for licenses on demand; historical importers; first-come, first-served; and state
trading enterprise administration methods. The implications of additional conditions are
manifold. For example, one cannot automatically assume “applied tariffs” are represented by
regime 1 (in-quota tariff binding) because one of several additional conditions associated with
applied tariffs (such as domestic purchase requirements) may increase the costs of importation
(or act as a nontariff barrier), thus creating rents. At the same time, methods other than applied
tariffs could produce a regime 1 result, especially if there are no additional conditions and the
quota is not binding. Notice that the value of trade affected by additional regulations for the
license auction method is higher than the value of trade under auctions, implying that no trade
may occur under a basic auction system that economists appear to favor. Additional regulations
impose costs on the classic textbook case of efficiency with auctions.
<<table 5.8 near here>>
<<A>>A Note on TRQ Fill Rates<<end>>
Fill rates do not give a complete picture of the efficacy of a tariff quota regime. A fill rate of less
than 100 percent may not imply inefficiency if demand and supply conditions are such that the
in-quota tariff is binding. But a fill rate of 100 percent does not necessarily mean efficiency
either, because the lowest-cost supplier may not have been used.
Average fill rates as reported by the WTO and academic studies can be misleading
because of aggregation problems: a subset of some commodity or country groupings may have
zero fill rates and others 100 percent fill rates. Trade-weighted fill rates are more indicative of
11

import performance (OECD 2002). Data published so far do not take into account overquota
imports assessed the in-quota tariff rate, biasing the fill rates downward. Furthermore, some
countries only report imports up to the quota level (ignoring imports at the in-quota tariff that are
over the quota), while others simply report the number of import licenses issued, which may not
be fully used.
To overcome these difficulties, we present both the number and the value of trade
corresponding to the simple average (truncated) fill rate reported by the WTO as well as the
trade-weighted fill rates. Fill rates weighted by value take into account overquota imports at the
in-quota tariff.
<<A>>TRQs by Country and Commodity Group<<end>>
The number of tariff quotas by country and commodity group is given in tables 5.9 and 5.10,
respectively. The total value of in-quota plus out-of-quota trade is $35.4 billion, while net quota
underfill (subtracting overquota imports) is $13.7 billion, or 39 percent of the total TRQ trade.
Countries with the highest levels of in-quota trade are Canada, China, Colombia, the EU,
Indonesia, Japan, Korea, Mexico, Thailand, Switzerland, the United States, and República
Bolivariana de Venezuela. Notice countries with high levels of overquota imports (in absolute
terms and even more so in relative terms) are predominantly developing countries. Countries
with high levels of out-of-quota imports are China, the EU, Hungary, Japan, Korea, the
Philippines, Poland, República Bolivariana de Venezuela, and the United States. Quota underfill
is dominated by six economies: China, the EU, Hungary, Poland, República Bolivariana de
Venezuela, and the United States.<<AU: Date the data to account for Hungary and Poland now
being part of the EU??>> The simple average in-quota and out-of-quota bound tariffs are also
presented in table 5.9. The simple average fill rates and trade-weighted fill rates for each country
also are presented in table 5.9.
<<tables 5.9 and 5.10 near here>>
Corresponding data by commodity in table 5.10 show that the value of in-quota trade and
the quota are evenly distributed by level of trade. The highly traded group of commodities
includes cereals, dairy, fruit and vegetables, meat, oilseeds, and sugar. Over-quota imports are
highest for cereals and oilseeds. Out-of-quota imports are high for cereals, fruit and vegetables,
12
meat, and sugar. Net quota underfill is highest for beverages, cereals, fibers, fruit and vegetables,
and meat. Trade-weighted fill rates are below average for beverages, cereals, eggs, fibers, fruit
and vegetables, and other. Notice that the trade-weighted fill rate is substantially higher that of
the simple average for coffee and tea, dairy, meat, and sugar.
In-quota tariffs are above average for beverages, cereals, eggs, fruit and vegetables, meat,
other products, and tobacco. Except for beverages, the same commodities have an above-average
out-of-quota tariff.<<AU: Text does not fully agree with table 5.10 -- please check for
accuracy>> Average tariffs for quotas with several tariff lines that differ may be misleading
because of aggregation problems. A simple or trade-weighted average does not overcome the
impact of a few high tariffs protecting most of domestic production.
<<A>>Can TRQ Administration Methods and Regulations Affect Trade?<<end>>
Earlier we discussed five major quota administration methods (or combinations thereof) and a
host of additional conditions that have the potential to affect not only efficiency but also quota
fill rates (Mönnich 2003; Skully 2001a). At first glance, one would expect that applied tariffs
would allow for unrestricted levels of imports at the in-quota tariff. But several applied tariff
quotas are restricted by time limits, past trading performance, volume limits per firm, domestic
purchase requirements, and license fees. These regulations are in the notifications (several may
be unreported) and can all reduce fill rates. The number and significance of these regulations are
shown in table 5.8.
License allocation on the basis of historical imports is the second most commonly used
method of quota administration. This trade liberalization has the opposite effect on efficiency
from licenses on demand. For example, a decrease in the in-quota tariff decreases efficiency
under licenses on demand, but increases efficiency under historical shares unless high-cost firms
hold a disproportionate share of the quota licenses according to historical performance.
Meanwhile, an increase in the quota, holding per unit rents constant, increases efficiency with
licenses on demand because high-cost firms are already at their desired level of licenses and
additional imports are allocated to lower-cost firms only. The decline in per unit rent resulting
from a quota increase reinforces this increase in efficiency effect with high-cost firms exiting
(unless no high-cost firms exist and the most efficient allocation is achieved. With historical
13
shares, however, an increase in the quota unambiguously reduces efficiency (and potentially
reduces fill rates), except in the unlikely event that the historical share to each firm corresponds
exactly to optimal shares with an auction. This example emphasizes the potential importance of
quota administration methods on trade patterns and how trade-liberalizing effects can have
opposite effects, depending on the method used.
Licenses on demand are the third most commonly used administration method in terms of
the value of trade. Licenses are allocated on a prorated basis, whereby the amount that can be
imported is reduced proportionately if total requests exceed the quota. Inefficiency is incurred
because licenses tend to be allocated to high-cost firms away from low-cost firms (Hranaiova, de
Gorter, and Falk 2003). The higher the firm’s costs, the closer the allocated quantity to its
desired allocation and the higher the probability that it will receive its desired allocation. Quota
expansion causes high-cost firms to decrease their bids and so reduces inefficiency. The entry of
a new firm causes all incumbent firms to increase bids or bid the quota. How that affects
efficiency depends on whether high-cost or low-cost firms enter. Failure to penalize firms for not
using their licenses almost guarantees quota underfill, which also increases with the
heterogeneity of cost structures across firms. In-quota tariff reductions cause per unit rents to
increase and so provide incentives for high-cost firms not to exit (or to enter), thereby increasing
inefficiency.12 When a limit is imposed on the licenses received by each firm, inefficiency
increases because the limit is more binding on low-cost firms.
First-come, first-served is the next most commonly used method. It can generate
inefficiencies due to hurrying up imports and waiting in line (Chau, de Gorter, and Hranaiova
2002). Time limits are very common under this method (see table 5.8). Countries that are close
to the exporting country and so easier to reach will benefit, and uncertainty as to whether the
quota will be filled upon arrival at the border is increased with the time limits. Commodities that
are more perishable reduce rents, to the disadvantage of importing firms, exporting countries,
and producers in the importing region. The degree of “rent appropriation” (rather than “rent
dissipation”) depends critically on, among other things, the ratio of the import quota volume to
free trade levels. Given that first-come, first-served represents 16.8 percent of the total value of
TRQ commodities traded, the scope for rent appropriation is very large indeed. Licenses
allocated on a first-come, first-served basis reduce the effectiveness of quotas in protecting
14
domestic producers in the importing country but aid domestic consumers. Furthermore, some of
the rents may be dissipated in rent seeking where firms try to avoid the consequences of hurried-
up imports and reduced domestic prices by changing the timing of domestic production or
storing the domestically grown product. Although these latter practices increase profits for the
firms involved, they also increase social costs relative to what they would be if property rights to
the import licenses were clearly defined.
State trading enterprises can also have significant impacts on efficiency and fill rates,
because such enterprises are immune to some degree from market forces and so may not have the
incentive to fill the quota. If the STE represents producers’ interests, it may choose to limit the
quota to lower-valued imports within the category or to pay exporters lower prices for the goods
in question. STEs also have been alleged to price discriminate and to allocate export quotas to
higher-cost exporters for political reasons. If the quota rents are blended with revenues from
domestic production, domestic production expands beyond efficient levels for a given domestic
price determined by the import quota.
The impact of the STE on efficiency and fill rates depends on its objective function
(maximizing producer profits, for example, or stabilizing prices) and on the degree of control it
has over imports and the domestic market. In many countries with STEs, some of the import
quotas are given directly to private traders. STE influence on domestic market prices and
production varies by country and over time. The outcome also depends on whether the STE feels
obligated to fill the quota or, when it does, whether it sells the product on the domestic market or
uses it in noncompetitive markets (livestock feed, for example). The effect of the STE also
depends on what the initial regime of the tariff quota would be under perfect competition (quota
binding, in-quota tariffs, or out-of-quota tariffs), while the effects of trade liberalization through
tariff reductions and quota expansion depend on which instrument is binding under the initial
STE equilibrium.
Imperfect competition can result in higher quota fill rates. It can also alter the effects of
liberalization because of monopoly or monopsony water in the tariff and the interaction effects
between the two tariffs and the quota (Hranaiova and de Gorter 2002; de Gorter and Hranaiova
2004). The effectiveness of market power increases with the tariff, but trade liberalization may
not increase social welfare. Regime switches may occur, with the possibility of losses in
15
efficiency and social welfare. Trade liberalization outcomes depend on the initial optimal
solution for the imperfect competitor (that is, which tariff quota instrument is binding), the level
of the binding instrument, and the type and degree of trade liberalization (McCorriston and
Sheldon 1994).
The import quota fill rate is not necessarily an indicator of economic efficiency. A quota
may be underfilled under perfect competition, yet can be fully filled under a monopoly solution.
For a monopsonist, there is no partial underfill of the quota. A decrease in the in-quota tariff may
induce a switch in regimes from a price taker to a monopsonist.
Import quotas may be superior to tariffs in achieving the same level of protection in the
case of monopsony. This is because the domestic buyer can exercise full monopsony power at
low levels of tariffs, while the introduction of a quota increases welfare. The decrease in
economic efficiency due to a switch to a monopsonistic solution when sufficiently high tariffs
are introduced may offset any efficiency advantages of tariffs over quotas. For a monopolist-
monopsonist, the outcome is further complicated by the possibility of two discrete changes in the
optimal solution and two supply curves to choose from.
<<B>>The Role of Dynamic Rent Seeking<<end>>
The widespread use of additional regulations in combination with each other and with major
quota administration methods can also potentially affect trade in a dynamic rent-seeking context.
For example, rules governing entry of new firms can either increase or decrease efficiency,
depending on the administration method, the level of out-of-quota tariffs, and the regulations
determining entry.<<AU: We’ve got rules determining entry dependent on rules governing
entry—please fix>> Some firms, either high- or low-cost, may import at a loss to build up a
historical import level so that they can then receive licenses under the historical share allocation
method or qualify to be either a bona fide importing firm (potentially relevant to all
administration methods) or fulfill the “past trading performance” additional condition for
nonhistorical administration methods. Use-it-or-lose-it rules imply access to the quota in the
following year, so firms may import—even at a loss—in order to have access to excess rents in
the future.
16
A firm may engage in rent-seeking activities to mitigate the costs (in forgoing economies
of scale) of a limit on the number of licenses it can receive. For example, firms try to obtain
more licenses by splitting up into smaller entities, yet incur extra costs in so doing. Seasonal
licenses (quarterly or semiannual) are very common and do not allow for the exploitation of
seasonality in the gap between world and domestic prices. Not taking advantage of seasonal high
prices may be particularly important for developing countries where harvest seasons are often
different from those of countries in the North.
Once a license is allocated, time limits on its use introduce uncertainty and transactions
costs. The resulting inefficiency also depends on whether other conditions are required (such as
losing the right to the license).
Domestic purchase requirements may result in consolidation of the importing and
domestic production sectors, which can dissipate rents and perhaps spark an increase in the
domestic price.
The notifications do not indicate whether licenses are permanent or must be renewed
annually, or whether licenses can be traded to other firms within a year. These two features can
have significant impacts on the efficiency of quota administration methods. Undocumented
regulations also may have a significant impact on efficiency and fill rates. Mexico, for example,
has issued quarterly import permits (cupos) for imports into specific regions of the domestic
market.
<<B>>Changes in Administration Methods<<end>>
There have been significant increases in the level of the quotas for each administration method
category since 1995, especially for applied tariffs and licenses on demand. This increase
probably reflects relatively more minimum, versus current access, quotas designated in these
administration categories (WTO 2002a). Table 5.11 provides summary data on the number of
tariff quotas that changed from one administration method to another. A total of 64 applied
tariffs were switched to other methods, with most becoming historical importers or licenses on
demand.
<<table 5.11 near here>>
17
<<A>>Potential Domestic Policy Responses to TRQ Liberalization
Import quotas give domestic firms, STEs, or domestic governments more latitude in fixing
domestic prices and hence reducing their volatility. This means world prices are more volatile
except in some circumstances (Tyers and Anderson 1992). Imperfect competitors can charge
higher prices under a quota than under tariffs; STEs and producer groups that control import
licenses can also charge higher prices under a quota than under a tariff At the same time,
governments often try to stabilize domestic prices (albeit at levels sometimes much higher than
world prices) through several mechanisms, depending on the country and commodity. Both an
expansion of the quota and reductions in out-of-quota tariffs increase efficiency and decrease
international price volatility.
It is also possible that inefficiency increases with domestic policy responses to trade
liberalization (Schmitz, de Gorter, and Schmitz 1995). In almost all cases, government employs
domestic policy price supports and other instruments in tandem with a TRQ. Canada, for
example, has supply management schemes, whereas the European Union employs acreage
restrictions, production quotas, stockpiling, and export subsidies. The U.S. sugar program uses
the loan rate as the target farm price and allocates “flexible marketing allotments” to farmers
who accept bids from processors to obtain defaulted loans in exchange for reducing sugar
production. So the benefits of liberalizing TRQs can be at least partially offset by adjusting
domestic policy parameters.
To illustrate, consider Asian rice markets with TRQs that employ several domestic policy
instruments simultaneously to stabilize domestic prices. Mandatory acreage set-asides, purchase
limits by the STEs (or marketing controls), the importation of low-quality rice (sometimes fed to
livestock and even destroyed in one country; see Choi and Sumner 2000) by that proportion of
the TRQ controlled by the STE, an increase in stocks year to year, and the use of exports as food
aid represent the portfolio of policy instruments typically used to stabilize prices. An example of
how this works in Japan is given in table 5.12. Although Japan’s rice imports increased
substantially (from zero before the URAA), the increase in supply to domestic markets has often
been less than half the increase in imports. Exports as food aid have increased over the years, and
stocks have always been increasing. Acreage reduction requirements have been ratcheted upward
as well. Imports by private traders represent a growing share of the import quota, but rents
18
remain high for the STE. All of these actions illustrate the potential for government policy
responses to mitigate the positive liberalization effects of TRQs.
<<A>>Concluding Comments
This chapter shows that TRQs protect more than 50 percent of agricultural production and
approximately 43 percent of agricultural trade of developed countries, even though the total
number of tariff lines under TRQs is relatively low. Using applied tariffs, annual total tariff
revenues and quota rents are estimated to be on the order of $19.6 billion. We identify four key
TRQ regimes associated with the in-quota tariff, quota, out-of-quota tariff, and overquota
imports that determine the market equilibrium. There are a total of eight cases under these four
regimes, depending on whether there is exact fill, underfill or overfill of the TRQ. Data show
that the out-of-quota regime has the largest value of trade at $22.7 billion, followed by the
overquota import regime at $7.5 billion and the quota binding regimes at $2 billion. The value of
trade for the in-quota tariff regime is $3 billion. <<AU: Why isn’t this in third place above, and
the quota binding regime in 4th place? Dollar figures correct?>>
A reduction in out-of quota tariffs has the largest impact on trade liberalization. Our
analysis shows that out-of quota reductions increase the value of trade by $18.2 billion, while a
quota expansion increases trade by $5.1 billion. But the outcome also depends critically on the
level of water assumed to be in the tariff, the relative values of tariff reduction versus quota
expansion (assumed to be 35 percent and 50 percent, respectively) and the level of under- and
overfill in each case. We also assume simple average bound tariffs are reduced (rather than trade-
weighted applied tariffs). The analysis shows that in-quota tariffs may stifle trade liberalization
in the quota expansion and out-of-quota tariff reduction scenarios, the extent to which was not
analyzed empirically. Nevertheless, this finding highlights the importance of including in-quota
tariff reductions in the WTO negotiations, even though they are not officially bound and no in-
quota tariff reductions were required in the URAA. Furthermore, if countries are allowed to
choose the least liberalizing of the two trade liberalization options, we show empirically that it is
possible that the increase in the total value of trade would only be 40 percent of that under the
quota expansion case for all countries and 25 percent of the trade expansion if all countries
followed the out-of-quota tariff reduction case only.
19
The trade-weighted fill rates were calculated by administration method and additional
regulation. Although applied tariffs are used in 39 percent of the cases, they represent only 14
percent of trade. Auctions, in contrast, are used about 5 percent of the time but account for only
0.5 percent of the total value of trade. The importance of licenses on demand; historical
importers; first-come, first-served; and state trading enterprises were also analyzed. Fill rates for
quotas are sharply split, with many falling below 20 percent, many at 100 percent or above, and
comparatively few in the middle ranges. The average fill rate is 60.5 percent, similar to the
percentage reported by the WTO (2002b, 2002c), and our calculated trade-weighted fill rate is
almost identical at 61.1 percent. We discuss how licenses on demand and historical importer
methods allow high-cost importers to operate; and how the first-come, first-served method
results in lower prices earlier in the season; that in turn results in rent appropriation by
consumers and middlemen or in rent dissipation as producers trying to circumvent the price
declines. State trading enterprises can negatively affect efficiency as well, depending on their
objective function, constraints such as international obligations, and their control of domestic
market parameters such as marketings, stocks, or prices.
The interaction of additional regulations with each of these major administration methods
is also shown to be important for fill rates and efficiency. Fully $7.6 billion worth of trade is
subject to time limits on quotas, $3.7 billion to past importing performance, $3.5 billion to export
certificates, and $1.9 billion to domestic purchase requirements. Each of these regulations and
others (including seasonal licenses and limits per firm) increase the costs of importing and so
inevitably affect fill rates. Even applied tariffs have significant regulations associated with them;
pure tariff regimes do not exist in many cases. More analysis is required on the extent to which
additional regulations are pervasive in either out-of-quota or in-quota tariff regimes before
definitive conclusions can be made about how much they limit the effects of trade liberalization.
We also present summary data on the levels of out-of-quota and overquota imports and
quota underfill by commodity and country. These data can be cross-referenced to administration
type, additional regulation, minimum or current access, and other relevant indicators in analyzing
various factors that may influence TRQ fill rates. The total value of TRQ trade is $35.4 billion,
with net quota underfill (after adjusting for overquota imports) at $13.7 billion, or about 39
percent of total TRQ trade. Quota underfill by itself totals $16.8 billion, amounting to 48 percent
20
of the value of the total quotas. The average applied tariff is 53.5 percent, considerably lower
than the average bound in-quota tariff of 59 percent and out-of-quota tariff of 115 percent. But
this trade-weighted applied average tariff for TRQ commodities is much higher than the average
applied tariff for all of agriculture (World Bank 2003, ch. 3).
We also determined that 42 percent of TRQ trade is under minimum access quotas, which
were required to expand during the URAA implementation time period. But the majority of
minimum access quotas are in regimes where a quota increase has no immediate impact on
imports. We also found that a significant numbers of TRQs once administered as applied tariffs
had been shifted to the license-on-demand and historical importer categories, both methods that
are deemed fraught with inefficiencies (along with first-come, first-served and state trading
enterprises). Consideration was also given to the ways in which some administration methods
can lead to dynamic rent seeking and further inefficiencies in the quota administration system.
Finally, we consider potential domestic policy responses to TRQ liberalization that mitigate the
effects of trade liberalization.
The data and analysis in this chapter cannot come to any definitive conclusion as to how
well the TRQs liberalized trade in agriculture, not least because of the assumptions that had to be
made and the further work required in analyzing the extensive database that has been developed.
In particular, analysis of a combination of tariff reductions and quota expansion is warranted,
along with an analysis of how in-quota tariffs stifle quota expansion. To obtain a better
understanding of TRQs, even more data and information are required, especially on the exact
levels of water in the tariffs and tariff binding overhang. The impact of preferential tariffs also
requires investigation, as does the distribution of rents between importers and exporters. The
analysis here also does not analyze TRQs that are not administered under the WTO, nor does it
compare our results to non-TRQ imports and tariffs.
<<A>>Endnotes<<end>>
1. This and various other problems identified in the implementation of TRQs have been analyzed by, for example, Skully (1999, 2001a, 2001b); Abbott and Paarlberg (1998); and de Gorter and Sheldon (2000, 2001).
21

2. Water in the tariff and tariff binding overhang refer to situations where a reduction in out-of-quota tariffs has no initial impact on trade. Water refers to situations where there are no out-of-quota imports and the domestic price is below the out-of-quota tariff-inclusive world price. Binding overhang refers to the gap between bound tariffs (to be reduced in the negotiations) and applied tariffs.
3. At the same time, the data overestimates the level of coverage in that it includes commodities that are heavily exported (such as wheat for Canada).
4. See Moschini (1991), Boughner, de Gorter, and Sheldon (2000), and IATRC (2001b) for more detail on the economics of TRQs.
5. Figure 5.3b shows that there can be quota underfill and out-of-quota imports at the same time. This necessarily implies inefficiency in the quota administration method because traders are forgoing potential quota rents that, if available, they would gladly have taken.
6. Although the total number of TRQs notified to the WTO is 1,425, totals for the data presented in the tables are often less than that because of missing data.
7. Calculated as quota underfill of 16,744 as a percentage of quota calculated as in-quota imports of 21,424 less overquota imports of 3,102 plus quota underfill of 16,744.
8. Six years from 1995 for developed countries and ten years for developing countries. 9. For consistency with other estimates in this volume, the import elasticity used is the
average of the elasticities of substitution used in the LINKAGE model for agriculture discussed in chapter 12 of this volume.
10. For example, a minimum access quota of 5 percent of baseline consumption is equivalent to 8 percent of current rice consumption in Japan today.
11. This ignores the fact that in many cases, out-of-quota imports replace the quota
under-fill so the actual value of trade at observed prices attributed to quota under-fill is even
lower.
12. A tariff reduction has the opposite effect of introducing a license fee.
<<A>>References<<end>>
Abbott, P. 2002. “Tariff Rate Quotas: Failed Market Access Instruments.” European Review of
Agricultural Economics 29 (1):109–30.
Abbott, P., and P. Paarlberg. 1998. “Tariff Rate Quotas: Structural and Stability Impacts in
Growing Markets.” Agricultural Economics 19: 257–67.
Bouët, A., L. Fontagné, and S. Jean. 2005. “Is Erosion of Tariff Preferences a Serious Concern?”
Agricultural Trade Reform and the Doha Development Agenda, ed. K. Anderson and W.
Martin. Washington, DC: World Bank.
22
Boughner, D., H. de Gorter, and I. Sheldon. 2000. “The Economics of Tariff-Rate Quotas in the
Agricultural Agreement in the WTO.” Agricultural and Resource Economics Review 20:
58–69.
Chau, N., H. de Gorter, and J. Hranaiova. 2003. “Rent Dissipation versus Consumer
Appropriation of Rents with First-Come, First-Served Import Quotas in Agriculture.”
Paper presented at International Agricultural Trade Research Consortium Summer
Symposium on Agricultural Policy Reform and the WTO, Capri, Italy, June 23–26.
Choi, J. S., and D. A. Sumner. 2000. “Opening Markets while Maintaining Protection: Tariff
Rate Quotas in Korea and Japan.” Agricultural and Resource Economics Review 29 (1):
91–102.
de Gorter, H., and D. Boughner. 1999. “U.S. Dairy Policy and the Agreement on Agriculture in
the WTO.” Canadian Journal of Agricultural Economics 47 (5): 31–42.
de Gorter, H., and J. Hranaiova. 2004. “Quota Administration Methods: Economics and Effects
with Trade Liberalization.” In Agriculture and the WTO: Creating a Trading System for
Development, ed. M. Ingco and J. Nash. New York: Oxford University Press.
de Gorter, H., and I. Sheldon. 2000. “Issues in the Administration of Tariff-Rate Import Quotas
in the Agreement on Agriculture in the WTO: An Introduction.” Agricultural and
Resource Economic Review 20: 52–57.
de Gorter, H., and I. Sheldon, eds. 2001. “Issues in Reforming Tariff-Rate Import Quotas in the
Agreement on Agriculture in the WTO.” International Agricultural Trade Research
Consortium Commissioned Paper 13, University of Minnesota, St. Paul.
Gibson, P., J. Wainio, D. Whitley, and M. Bohman. 2001. “Profiles of Tariffs in Global
Agricultural Markets.” Agricultural Economic Report 796, Economic Research Service,
U.S. Department of Agriculture, Washington DC, January.
Hranaiova, J., and H. de Gorter. 2002. “The Economics of Tariff Quotas with Imperfect
Competition.” Department of Applied Economics and Management, Cornell University,
Ithaca, NY.
Hranaiova, J., H. de Gorter, and J. Falk. 2003. “The Economics of Administering Import Quotas
with Licenses on Demand.” Paper presented at International Agricultural Trade Research
23

Consortium Summer Symposium on Agricultural Policy Reform and the WTO, Capri
Italy, June 23–26.
IATRC (International Agricultural Trade Research Consortium). 2001a. “The Current WTO
Agricultural Negotiations: Options for Progress.” IATRC Commissioned Paper 18,
University of Minnesota, St. Paul, May.
______. 2001b. “Market Access: Issues and Options in the Agricultural Negotiations.” IATRC
Commissioned Paper 14, University of Minnesota, St. Paul, May.
Ingco, M. 1996. “Tariffication in the Uruguay Round: How Much Liberalization?” World
Economy 19 (4, July): 425–47.
Jean, S., D. Laborde, and W. Martin. 2005. “Consequences of Alternative Formulas for
Agricultural Tariff Cuts.” Agricultural Trade Reform and the Doha Development Agenda,
ed. K. Anderson and W. Martin. Washington, DC: World Bank.
Kee, H. L., A. Nicita, and M. Olarreaga. 2004. “Import Demand Elasticities and Trade
Distortions.” World Bank working paper, Washington, DC, December.
http://siteresources.worldbank.org/INTRANETTRADE/Resources/239054-
1101918045494/KNO-elasticity.pdf
Kimura, T. 2004. “An Economic Analysis of Post–Uruguay Round Reforms of Rice Policies in
Japan.” MSc thesis, Cornell University, Ithaca, NY.
McCorriston, S., and I. M. Sheldon. 1994. “Selling Import Quota Licenses: The U.S. Cheese
Case.” American Journal of Agricultural Economics 76 (4, November): 818–28.
Mönnich, C. 2003. “Tariff Rate Quotas: Does Administration Matter?” Paper presented at
International Agricultural Trade Research Consortium Summer Symposium on
Agricultural Policy Reform and the WTO, Capri, Italy, June 23–26.
Moschini, G. 1991. “Economic Issues in Tariffication: An Overview.” Agricultural Economics
5: 101–20. –
OECD (Organisation for Economic Co-operation and Development). 2001. The Uruguay Round
Agreement on Agriculture: An Evaluation of Its Implementation in OECD Countries.
Paris: OECD.
24

______. 2002. “Tariff-Rate Quotas and Tariffs in OECD Agricultural Markets: A Forward
Looking Analysis.”Agriculture and Trade Liberalization: Extending the Uruguay Round
Agreement, Part 1. Paris: OECD.
______. 2003. Agricultural Policies in OECD Countries: Monitoring and Evaluation. Paris:
OECD. http://www1.oecd.org/publications/e-book/5103081E.PDF
Schmitz, A., H. de Gorter, and T. Schmitz. 1995. “Consequences of Tariffication.” In Regulation
and Protectionism under GATT, ed A. Schmitz, G. Coffin, and K. Rosaasen. Boulder CO:
Westview Publishing Co.
Skully, D. 1999. “Economics of TRQ Administration.” International Agricultural Trade
Research Consortium Working Paper 99–6, University of Minnesota, St. Paul.
______. 2001a. “Economics of Tariff Rate Quota Administration.” ERS Technical Bulletin
1893, Economic Research Service, U.S. Department of Agriculture, Washington, DC.
______. 2001b. “Liberalizing Tariff Rate Quotas, Background for Agricultural Policy Reform in
the WTO: The Road Ahead.” ERS-E01-001, Economic Research Service,
U.S.Department of Agriculture, Washington, DC.
Tyers, R., and K. Anderson. 1992. Disarray in World Food Markets : A Quantitative
Assessment. New York: Cambridge University Press.
Wainio, J. 2001. “Market Access: Tariffication and Tariff Reduction.” ERS Issues Series,
Economic Research Service, U.S. Department of Agriculture, Washington, DC.
Wainio, J., P. Gibson, and D. Whitley. 2001. “Options for Reducing Agricultural Tariffs.
Background for Agricultural Policy Reform in the WTO: The Road Ahead.” ERS-E01-
001, Economic Research Service, U.S. Department of Agriculture, Washington, DC.
World Bank. 2003. Global Economic Prospects 2004: Realizing the Development Promise of the
Doha Agenda. Washington, DC: World Bank.
WTO (World Trade Organization). 2002a. “Changes in Tariff Quota Administration and Fill
Rates.” G/AG/NG/S/20, WYO, Geneva, November 8.
______. 2002b. “Tariff Quota Administration Methods and Tariff Quota Fill.” Background paper
TN/AG/S/6, WTO, Geneva, March 22.
______. 2002c. “Tariff Quota and Other Quotas.” Background paper TN/AG/S/5, WTO,
Geneva, March 21.
25