Embed Size (px)
Citation preview

57
5. Phylogenetic analysis using COI gene
5.1. Introduction
In zoological and ecological literature, identification of unknown
specimens based on cytochrome oxidase I (COI) has become known as DNA
barcoding (Floyd et al., 2002; Hebert et al., 2003; Remigio and Hebert, 2003;
Moritz and Cicero, 2004). DNA barcoding has found a wide range of applications,
from identification of specimens in conservation biology and molecular ecology.
DNA barcoding system for animal life could be based upon sequence diversity in
5′ section of COI gene. COI exhibits a greater range of phylogenetic signal than
any other mitochondrial genes (Hebert et al., 2003). As in other protein-coding
genes, the third-position nucleotides of COI show a high incidence of base
substitution, leading to a rate of molecular evolution that is about three times
greater than that of 12S or 16S rRNA (Knowlton and Weigt, 1998). They also
argued that 12S and 16S rRNA genes are having multiple insertions and deletions
so they pose potential problems in their alignment. This problem would apply as
well to the nuclear 28S rRNA and internal transcribed spacer regions (ITS).
The classical procedure for such molecular identification has been the use
of Blast searches (Altschul et al., 1997). Blast offers no information to help
researchers choose among multiple close matches. Whereas the local alignment
problem can be circumvented using global alignments, the remaining two problems
cannot be addressed without a statistical evaluation of the phylogenetic
associations among species. This question is difficult to address as the evolutionary
relationship among genetic markers may not truly reflect the evolutionary

58
relationship among species. In cases, where reciprocal monophyly cannot safely be
assumed, an analysis quantifying between-species and between-genera genetic
variation forms a more correct basis of assignment. Such analyses, however,
require comprehensive different methods of phylogenetic coverage that is
generally not available to the biologist. This chapter address the species problem
but instead attempt to devise and display different methods of phylogenetic
analysis for the assignment of 16 species of catfishes to their family taxa. Different
phylogenetic methods lead to improved accuracy and importantly, it provides a
measure of statistical confidence associated with the barcoding assignment.
5.2. Materials and methods
5.2.1. Samples
The DNA samples used for the phylogenetic analysis using COI marker was
extracted as mentioned previously in general Materials and methods section.
5.2.2. DNA barcode region
The standard cytochrome oxidase I (COI) gene was selected as a DNA
barcode region. Polymerase chain reactions were performed to amplify the COI
gene using universal primers.
59
5.2.3. Primers
Universal COI gene primers were selected from previous studies (Ward
et al., 2005) (Table 3).
Table 3. Primer name and sequences of COI gene
Name of the primer Sequence of the primer
FishF1 5′- TCAACCAACCACAAAGACATTGGCAC - 3′
FishR1 5′ – TAGACTTCTGGGTGGCCAAAGAATCA – 3′
5.2.4. Polymerase chain reaction condition
Mastermix components
Distilled water - 18 µL
10x MgCl2 Buffer - 2.5 µL
dNTP (each 2.5mM) - 2 µL
Taq DNA polymerase (3U/ µL) - 0.5 µL
Primer mix - 1 µL
Template DNA - 1 µL
Polymerase chain reactions were performed in following temperature and
timing condition programmed in TechGeneTM, thermal cycler.
Initial denaturation at 94 ºC for 5 min.
Number of cycles – 35
Denaturation at 94 ºC for 30 sec.
60
Annealing at 54 ºC for 30 sec.
Extension at 72 ºC for 1min.
Final extension at 72 ºC for 10 min.
The amplified products were checked on 1.5% Agarose gel electrophoresis
and the molecular weight was assessed using molecular weight marker (100 bp
ladder).
5.2.5. Sequencing of the amplified products
The PCR amplified products were successfully readout bidirectionally
using an ABI 3730 capillary sequencer following manufacturer’s instructions. The
sequence with good peak clarities were selected for further analysis.
5.2.6. Sequence characterization
All the sequences showed length ranging from 588 to 655 bp and partial at
both 5′ and 3′ ends. There were no insertions, deletions or stop codons in any of
these sequences in final dataset. All the sequences were conceptually translated into
proteins using vertebrate mitochondrial genetic code translation pattern with 1st frame.
5.2.7. Species confirmation by BLAST
All the sequences showed 99% identity and null E-values of more than
90% query coverage with previously published COI sequences of their respective
species in NCBI’s nucleotide database. Subsequently, morphological identity was
taken as affirmative confirmation for those first published sequences of NCBI’s
nucleotide database inspite of their <90% identity and higher E-values. It was the
maximum identical percentage for the present sequences with Genbank sequences.

61
It suggested that the present sequences amplified by universal COI primers
confirmed that sequences belong to the COI gene of their respective individual
species.
5.2.8. Genbank submission
NCBI’s BankIt protocol was properly followed for submitting the sequences.
All the sequences were submitted with unique identification name and got accession
numbers as given in Table 4.
5.2.9. Phylogenetic analysis
The probability of rejecting the null hypothesis that sequences have evolved
with the same pattern of substitution, as judged from the extent of differences in base
composition biases between sequences (Disparity Index test, (Kumar and Gadagkar,
2001)). A Monte Carlo test (500 replicates) was used to estimate the P-values
(Kumar and Gadagkar, 2001). P-values smaller than 0.05 are considered significant
(marked with yellow highlights). The estimates of the disparity index per site are
shown for each sequence pair. The analysis involved 45 (Ariidae), 16 (Plotosidae)
and 52 (Bagridae) nucleotide sequences. Codon positions included were
1st+2nd+3rd+Noncoding. All ambiguous positions were removed for each sequence
pair. There were 598 (Ariidae), 640 (Plotosidae) and 514 (Bagridae) positions in
final dataset. Evolutionary analyses were conducted in MEGA5 (Kumar et al.,
2011).
Phylogenetic reconstructions were performed under MP, ML, and BI criteria.
For each of the three families of studied 16 catfish species, other COI nucleotide
sequences of the respective families of Ariidae (45 taxa), Bagridae (52 taxa) and
62
Plotosidae (14 taxa) were retrieved from the Genbank for the phylogenetic tree
construction. Their accession numbers are listed in Table 4. The final alignment of
the mitochondrial 5′ section of COI partial gene included 639bp (Ariidae), 589bp
(Bagridae) and 640bp (Plotosidae).
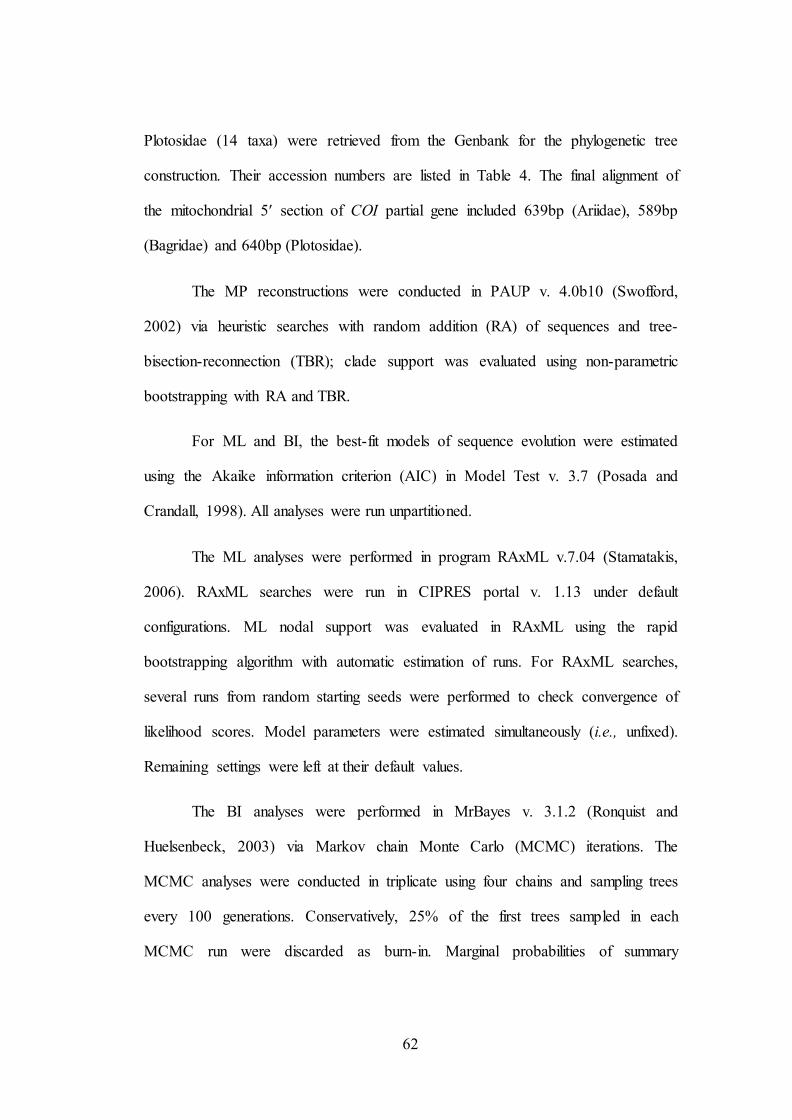
The MP reconstructions were conducted in PAUP v. 4.0b10 (Swofford,
2002) via heuristic searches with random addition (RA) of sequences and tree-
bisection-reconnection (TBR); clade support was evaluated using non-parametric
bootstrapping with RA and TBR.
For ML and BI, the best-fit models of sequence evolution were estimated
using the Akaike information criterion (AIC) in Model Test v. 3.7 (Posada and
Crandall, 1998). All analyses were run unpartitioned.
The ML analyses were performed in program RAxML v.7.04 (Stamatakis,
2006). RAxML searches were run in CIPRES portal v. 1.13 under default
configurations. ML nodal support was evaluated in RAxML using the rapid
bootstrapping algorithm with automatic estimation of runs. For RAxML searches,
several runs from random starting seeds were performed to check convergence of
likelihood scores. Model parameters were estimated simultaneously (i.e., unfixed).
Remaining settings were left at their default values.
The BI analyses were performed in MrBayes v. 3.1.2 (Ronquist and
Huelsenbeck, 2003) via Markov chain Monte Carlo (MCMC) iterations. The
MCMC analyses were conducted in triplicate using four chains and sampling trees
every 100 generations. Conservatively, 25% of the first trees sampled in each
MCMC run were discarded as burn-in. Marginal probabilities of summary
63
parameters, consensus phylograms, and posterior probabilities of nodes were
estimated from the postburn-in samples of the three independent runs.
To confirm that post-burn-in trees were sampled from the actual MCMC
posterior distribution, marginal parameters (MrBayes log file) were analyzed using
the Effective Sample Size (ESS) statistic in program Tracer (Drummond et al.,
2007); ESS greater than 200 suggests that MCMC searches were run long enough to
accurately represent the posterior distribution (Drummond et al., 2007).
5.2.10. Statistical analysis
One-way ANOVA was performed to test the significance of taxa groupings
in different subsets for taxonomic hierarchy (species, genus and family level) with
Duncan in SPSS 21 (SPSS, Chicago, IL) software package. From this package, the
basic module was employed for calculating mean and variance parameters, as well
as those for one way of parametric analysis of variance (ANOVA). Statistical output
were then made graphically to display on means plot and box plot.
64
5.3. Results
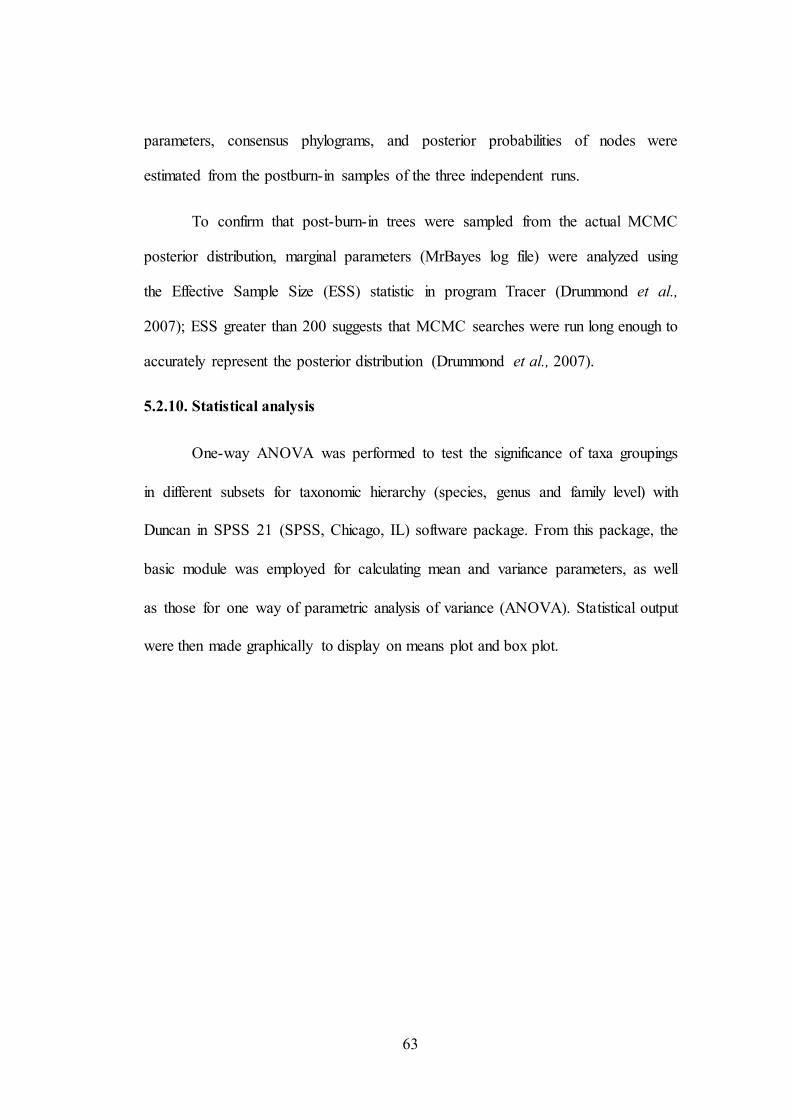
5.3.1. Isolation of genomic DNA
The genomic DNA was isolated from 16 species of catfishes by salt
extraction method that showed clear bands with mild shearing in 0.8% agarose gel
electrophoresis as shown in Figure 6.
Figure 6. Agarose gel electrophoresis of total genomic DNA.
(Lane 1 – 16: Mystus bleekeri, Mystus dibrugarensis, Mystus cavasius, Mystus armatus, Mystus gulio, Neotropius atherinoides, Arius arius, Arius jella, Arius
maculatus, Arius gagora, Arius subrostratus, Plicofollis tenuispinis, Plicofollis platystomus, Plotosus lineatus, Plotosus limbetus and Plotosus canius)
5.3.2. DNA quantification
The amount of DNA present in all the isolated samples were ranging from
1 to 2 µg/µl. Finally, the DNA was diluted to 50 ng per µL with distilled water and
used for all PCRs.

65
7 6
9 8 6 7
5.3.3. PCR amplification of DNA barcoding region
COI gene was successfully amplified using universal primers (FishF1 and
FishR1) for all 16 species. Figure 7 shows the amplified fragments of COI gene.
Figure 7. Agarose gel electrophoresis of amplified COI gene
(Upper Lane 1 – 9: Mystus bleekeri, Mystus dibrugarensis, Mystus atrifasciatus, Mystus albolineatus, Mystus gulio, Neotropius atherinoides, Plotosus lineatus,
Plotosus limbetus and Plotosus canius; Lower Lane 1 – 7: Arius arius, Arius jella, Arius maculatus, Arius gagora, Arius subrostratus, Plicofollis tenuispinis and
Plicofollis platystomus; M – 100 bp ladder)
From the gel analysis, the single highly intense band without smearing
strongly indicated the amplification of COI gene. Their base pair length was
predicted as approximately 700 bp by comparing with standard molecular marker
(100 bp ladder). All the species displayed good amplified products (Figure 7).
66
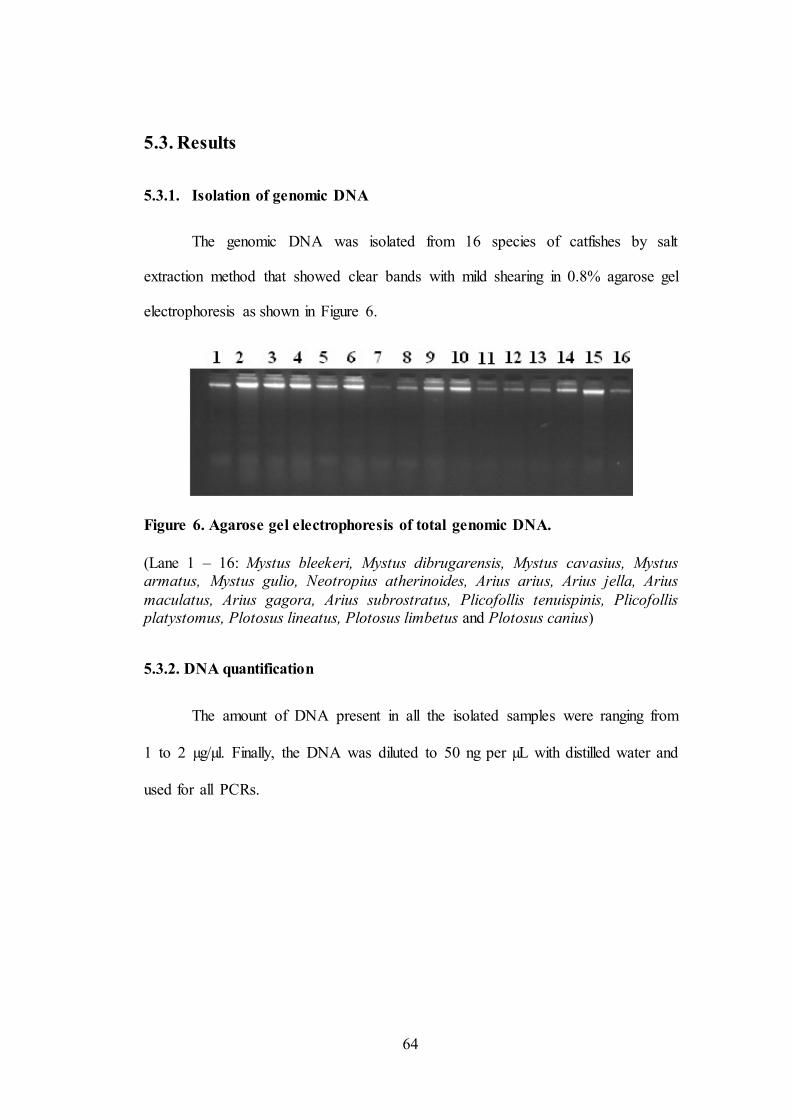
5.3.4. Sequences utilized in this study
Table 4. List of accession numbers and voucher codes given for the studied
species with COI gene
S.No NCBI Accession number Species Source Family
1. KF824816 - KF824819 Neotropius atherinoides This study Scheilbeidae
2. JX460965 Neotropius khavalchor Unpublished
3. KF824794 - KF824797 Mystus bleekeri
This study
Bagridae
4. KF824798 - KF824802 Mystus atrifasciatus
5. KF824803 - KF824807 Mystus dibrugarensis
6. KF824808 - KF824812 Mystus albolineatus
7. KF824813 - KF824815 Mystus gulio
8. JN228949 Mystus vittatus
Unpublished
9. HQ219109 Mystus malabaricus
10. JN228946 Mystus cavasius
11. HQ219128 Mystus montanus
12. FJ459517 Mystus tengara
13. HQ009492 Mystus oculatus
14. EU490863 Mystus bocourti
15. JX177677 Mystus multiradiatus
16. JX177678 Mystus rhegma
17. JQ289146 Mystus singaringan
18. FJ170791 Mystus horai
19. JQ289145 Mystus mysticetus
20. EU490857 Bagrus docmac
Unpublished
21. JQ289151 Bagrichthys macracanthus
22. EU490856 Bagrichthys macropterus
23. JX260836 Batasio tengana
24. HQ009500 Batasio travancoria
25. EU490858 Batasio tigrinus
26. HQ009503 Horabagrus nigricollaris
27. JQ289150 Pseudomystus siamensis
28. JX460967 Horabagrus brachysoma Katwate et al.,
2012
29. HM882793 Bagrus filamentosus_
Nwani et al.,
2011
30. HM882791 Bagrus bajad
31. HM882942 Schilbe mystus Scheilbeidae
32. HM882962 Schilbe intermedius
33. KF824820 - KF824822 Arius arius
This study Ariidae
34. KF824823 - KF824825 Arius jella
35. KF824826 - KF824828 Arius maculatus
36. KF824829 - KF824831 Arius gagora
37. KF824832 - KF824834 Arius subrostratus
67
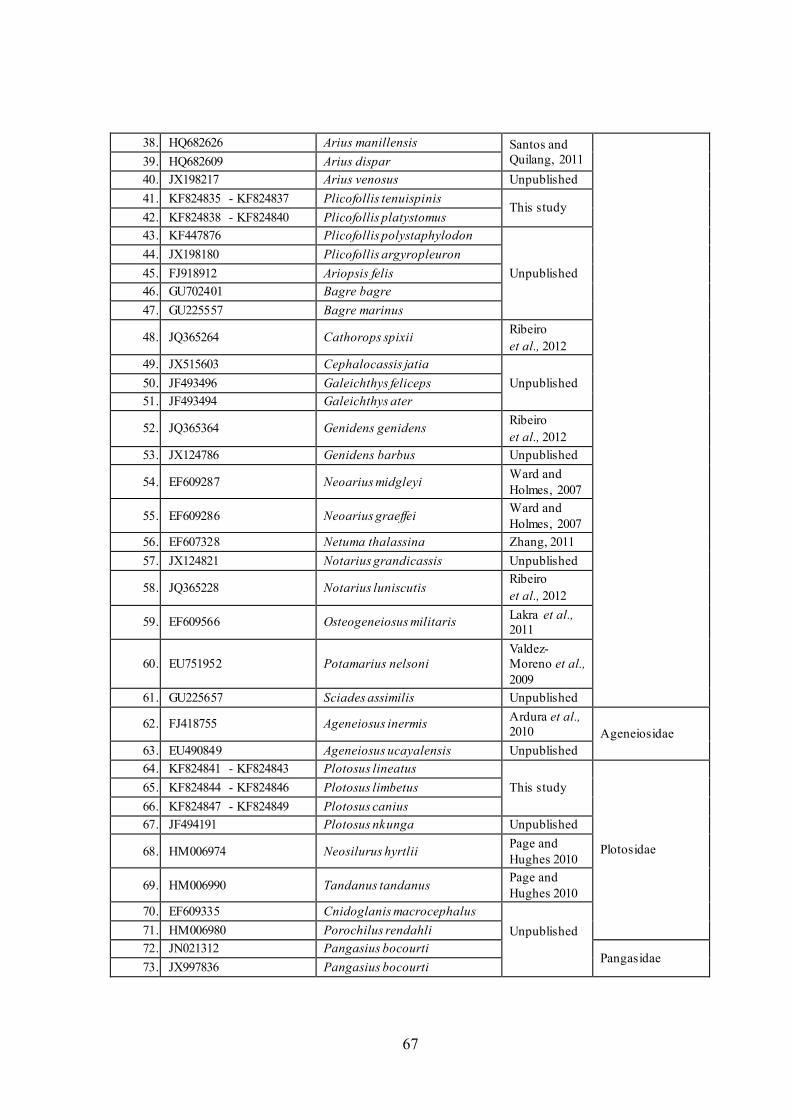
38. HQ682626 Arius manillensis Santos and
Quilang, 2011 39. HQ682609 Arius dispar
40. JX198217 Arius venosus Unpublished
41. KF824835 - KF824837 Plicofollis tenuispinis This study
42. KF824838 - KF824840 Plicofollis platystomus
43. KF447876 Plicofollis polystaphylodon
Unpublished
44. JX198180 Plicofollis argyropleuron
45. FJ918912 Ariopsis felis
46. GU702401 Bagre bagre
47. GU225557 Bagre marinus
48. JQ365264 Cathorops spixii Ribeiro
et al., 2012
49. JX515603 Cephalocassis jatia
Unpublished 50. JF493496 Galeichthys feliceps
51. JF493494 Galeichthys ater
52. JQ365364 Genidens genidens Ribeiro
et al., 2012
53. JX124786 Genidens barbus Unpublished
54. EF609287 Neoarius midgleyi Ward and
Holmes, 2007
55. EF609286 Neoarius graeffei Ward and
Holmes, 2007
56. EF607328 Netuma thalassina Zhang, 2011
57. JX124821 Notarius grandicassis Unpublished
58. JQ365228 Notarius luniscutis Ribeiro
et al., 2012
59. EF609566 Osteogeneiosus militaris Lakra et al.,
2011
60. EU751952 Potamarius nelsoni
Valdez-
Moreno et al.,
2009
61. GU225657 Sciades assimilis Unpublished
62. FJ418755 Ageneiosus inermis Ardura et al.,
2010 Ageneiosidae
63. EU490849 Ageneiosus ucayalensis Unpublished
64. KF824841 - KF824843 Plotosus lineatus
This study
Plotosidae
65. KF824844 - KF824846 Plotosus limbetus
66. KF824847 - KF824849 Plotosus canius
67. JF494191 Plotosus nkunga Unpublished
68. HM006974 Neosilurus hyrtlii Page and
Hughes 2010
69. HM006990 Tandanus tandanus Page and
Hughes 2010
70. EF609335 Cnidoglanis macrocephalus
Unpublished
71. HM006980 Porochilus rendahli
72. JN021312 Pangasius bocourti Pangasidae
73. JX997836 Pangasius bocourti
68
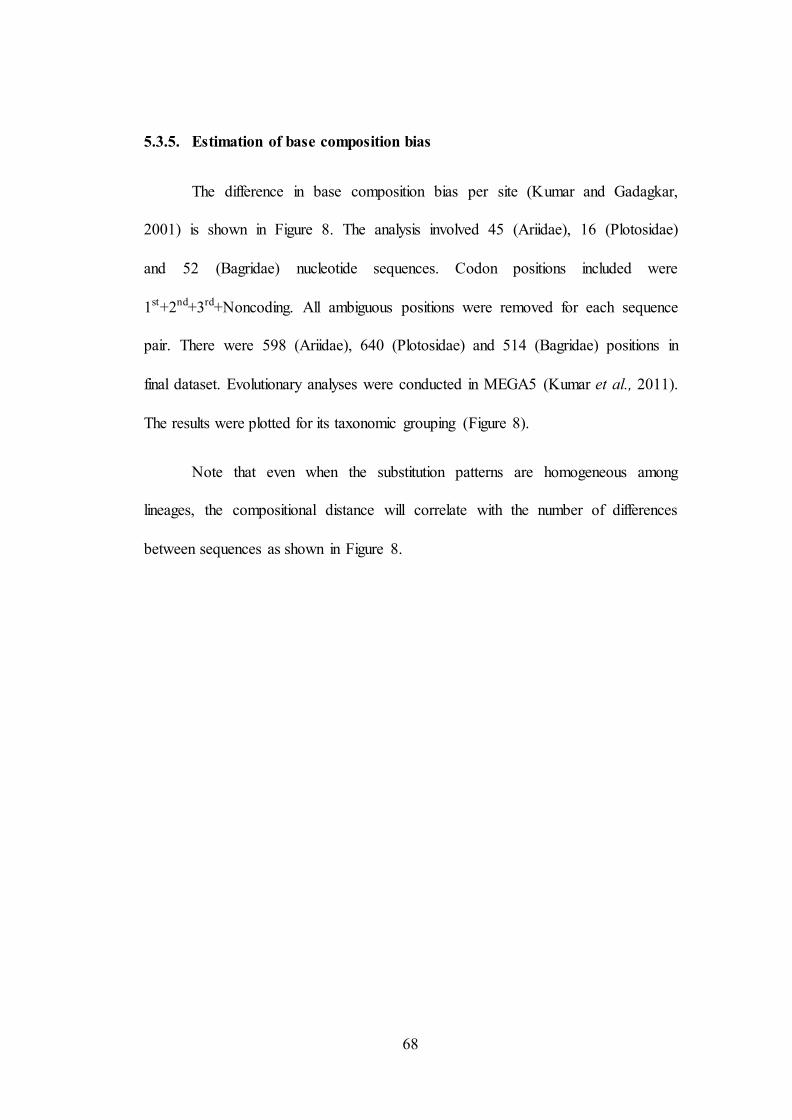
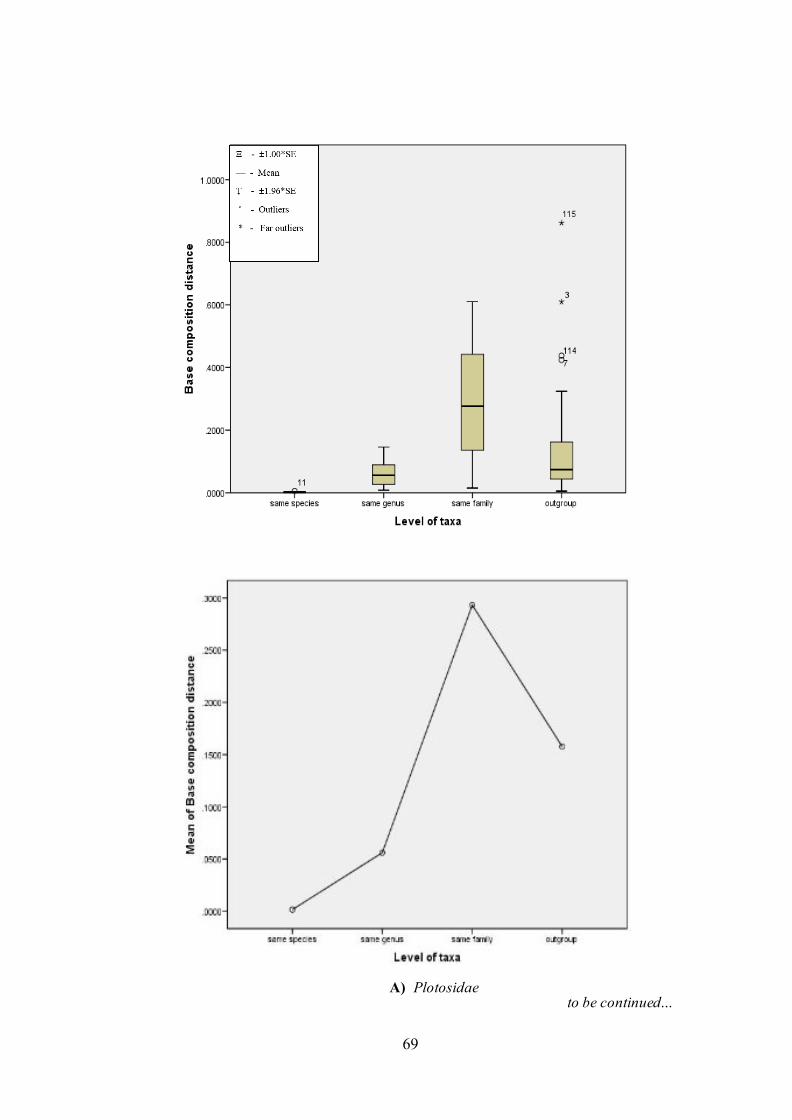
5.3.5. Estimation of base composition bias
The difference in base composition bias per site (Kumar and Gadagkar,
2001) is shown in Figure 8. The analysis involved 45 (Ariidae), 16 (Plotosidae)
and 52 (Bagridae) nucleotide sequences. Codon positions included were
1st+2nd+3rd+Noncoding. All ambiguous positions were removed for each sequence
pair. There were 598 (Ariidae), 640 (Plotosidae) and 514 (Bagridae) positions in
final dataset. Evolutionary analyses were conducted in MEGA5 (Kumar et al., 2011).
The results were plotted for its taxonomic grouping (Figure 8).
Note that even when the substitution patterns are homogeneous among
lineages, the compositional distance will correlate with the number of differences
between sequences as shown in Figure 8.
69
to be continued… A) Plotosidae
70
to be continued…
B) Ariidae

71
Figure 8. Categorized distributions and mean of base composition distance for COI
gene. (Above: Box and whisker plot; Below: line plot). Significance of variation for ANOVAs: F= 19.79, d.f.= 3; 116, P< 0.0001 (Plotosidae); F= 44.21, d.f.= 3; 986, P< 0.0001 (Ariidae) and F= 24.83, d.f.= 3; 1322, P< 0.0001 (Bagridae).
C) Bagridae

72
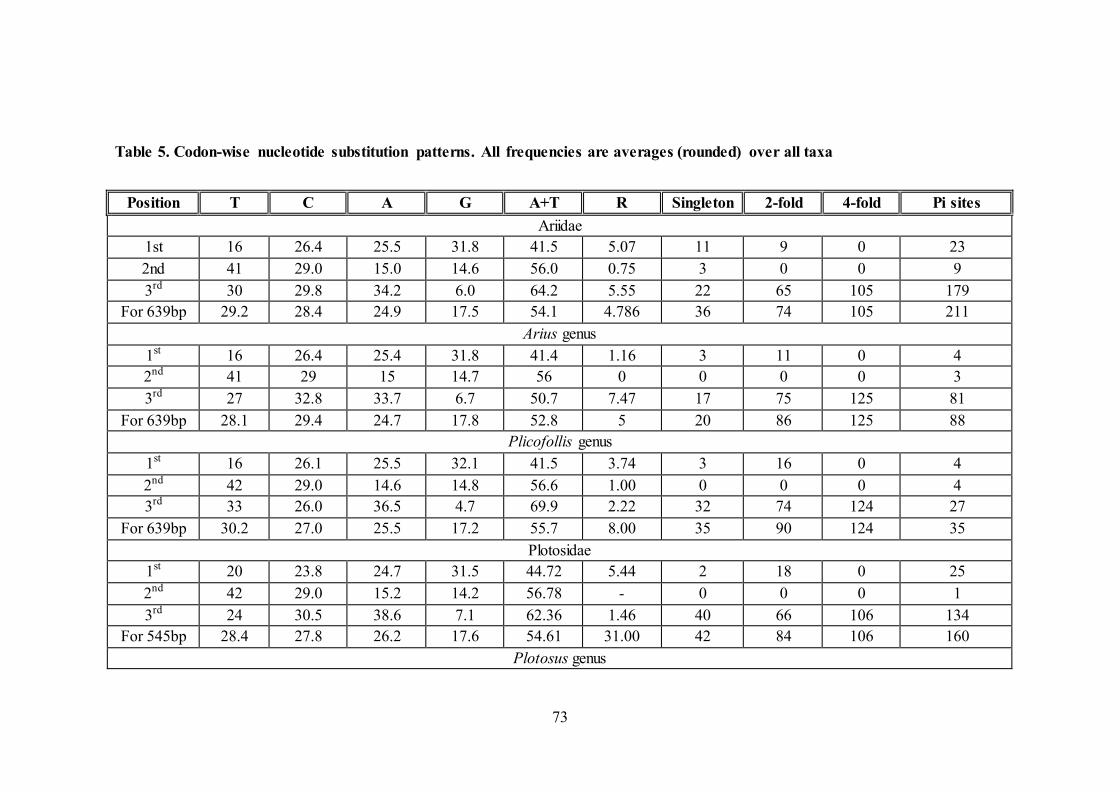
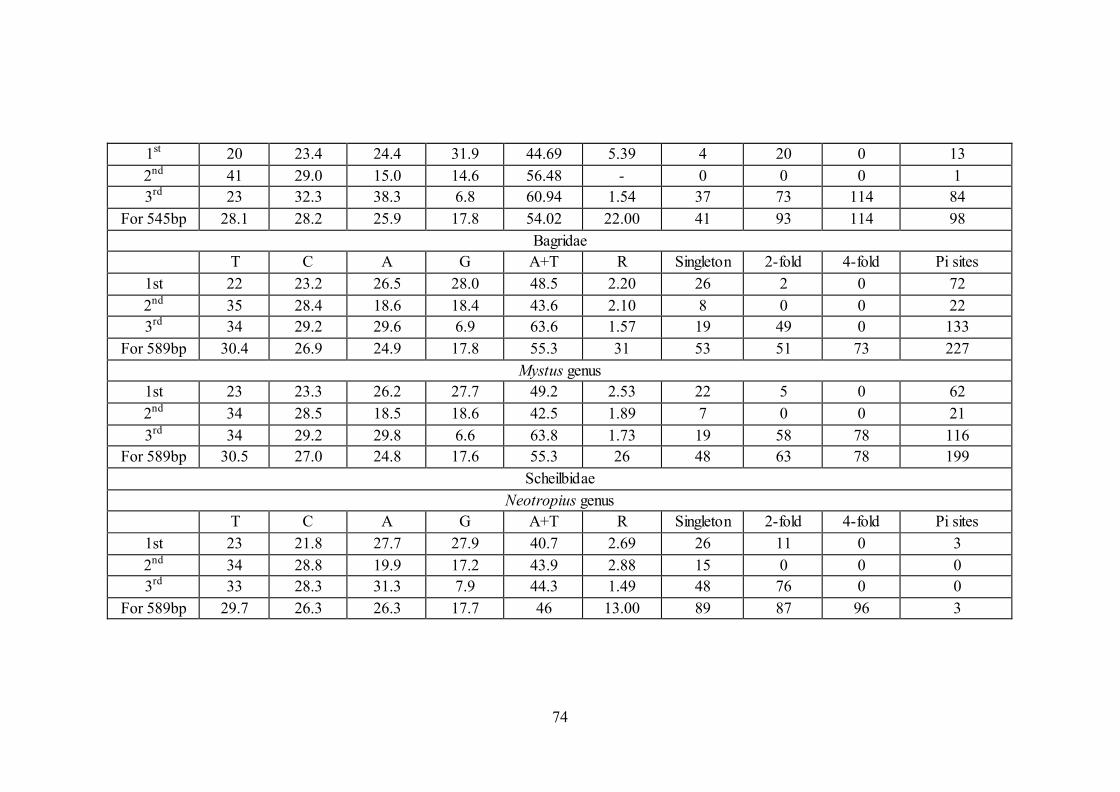
5.3.6. Evolutionary test of the homogeneity of substitution patterns
In order to obtain best estimate of the underlying pattern of substitution, this
study confined its analysis to singletons, parsimony informative sites (Pi), fourfold
degenerate sites, transition/transversion bias and interspecific to family level
comparisons at 1st+2nd+3rd codon positions as shown in Table 5.
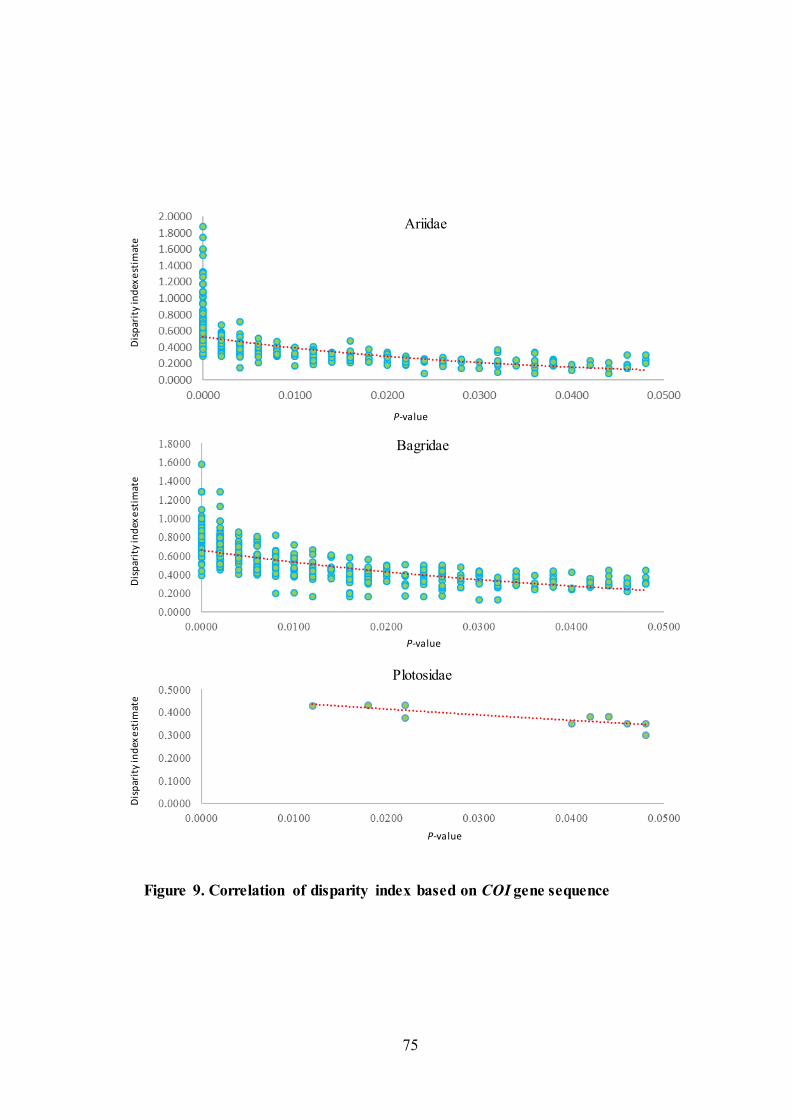
The results were dot plotted for its statistical significance (Figure 9).
Correlation of disparity index estimates between all species pairs relative to
homogeneity in substitution pattern with statistical significance (P-value) were
plotted in given Figure 9. Comparisons between groups (populations, species within
genera, genera, family) with gradual increase in P-values are indicated by dotted
circles plotted with the trendline.
73
Table 5. Codon-wise nucleotide substitution patterns. All frequencies are averages (rounded) over all taxa
Position T C A G A+T R Singleton 2-fold 4-fold Pi sites
Ariidae
1st 16 26.4 25.5 31.8 41.5 5.07 11 9 0 23
2nd 41 29.0 15.0 14.6 56.0 0.75 3 0 0 9
3rd 30 29.8 34.2 6.0 64.2 5.55 22 65 105 179
For 639bp 29.2 28.4 24.9 17.5 54.1 4.786 36 74 105 211
Arius genus
1st 16 26.4 25.4 31.8 41.4 1.16 3 11 0 4
2nd 41 29 15 14.7 56 0 0 0 0 3
3rd 27 32.8 33.7 6.7 50.7 7.47 17 75 125 81
For 639bp 28.1 29.4 24.7 17.8 52.8 5 20 86 125 88
Plicofollis genus
1st 16 26.1 25.5 32.1 41.5 3.74 3 16 0 4
2nd 42 29.0 14.6 14.8 56.6 1.00 0 0 0 4
3rd 33 26.0 36.5 4.7 69.9 2.22 32 74 124 27
For 639bp 30.2 27.0 25.5 17.2 55.7 8.00 35 90 124 35
Plotosidae
1st 20 23.8 24.7 31.5 44.72 5.44 2 18 0 25
2nd 42 29.0 15.2 14.2 56.78 - 0 0 0 1
3rd 24 30.5 38.6 7.1 62.36 1.46 40 66 106 134
For 545bp 28.4 27.8 26.2 17.6 54.61 31.00 42 84 106 160
Plotosus genus
74
1st 20 23.4 24.4 31.9 44.69 5.39 4 20 0 13
2nd 41 29.0 15.0 14.6 56.48 - 0 0 0 1
3rd 23 32.3 38.3 6.8 60.94 1.54 37 73 114 84
For 545bp 28.1 28.2 25.9 17.8 54.02 22.00 41 93 114 98
Bagridae
T C A G A+T R Singleton 2-fold 4-fold Pi sites
1st 22 23.2 26.5 28.0 48.5 2.20 26 2 0 72
2nd 35 28.4 18.6 18.4 43.6 2.10 8 0 0 22
3rd 34 29.2 29.6 6.9 63.6 1.57 19 49 0 133
For 589bp 30.4 26.9 24.9 17.8 55.3 31 53 51 73 227
Mystus genus
1st 23 23.3 26.2 27.7 49.2 2.53 22 5 0 62
2nd 34 28.5 18.5 18.6 42.5 1.89 7 0 0 21
3rd 34 29.2 29.8 6.6 63.8 1.73 19 58 78 116
For 589bp 30.5 27.0 24.8 17.6 55.3 26 48 63 78 199
Scheilbidae
Neotropius genus
T C A G A+T R Singleton 2-fold 4-fold Pi sites
1st 23 21.8 27.7 27.9 40.7 2.69 26 11 0 3
2nd 34 28.8 19.9 17.2 43.9 2.88 15 0 0 0
3rd 33 28.3 31.3 7.9 44.3 1.49 48 76 0 0
For 589bp 29.7 26.3 26.3 17.7 46 13.00 89 87 96 3
75
Figure 9. Correlation of disparity index based on COI gene sequence
Pagridae
Plotosidae
Ariidae
Bagridae
Ariidae
Plotosidae
P-value
Dis
par
ity
ind
ex e
stim
ate
P-value
Dis
par
ity
ind
ex e
stim
ate
P-value
Dis
par
ity
ind
ex e
stim
ate
76
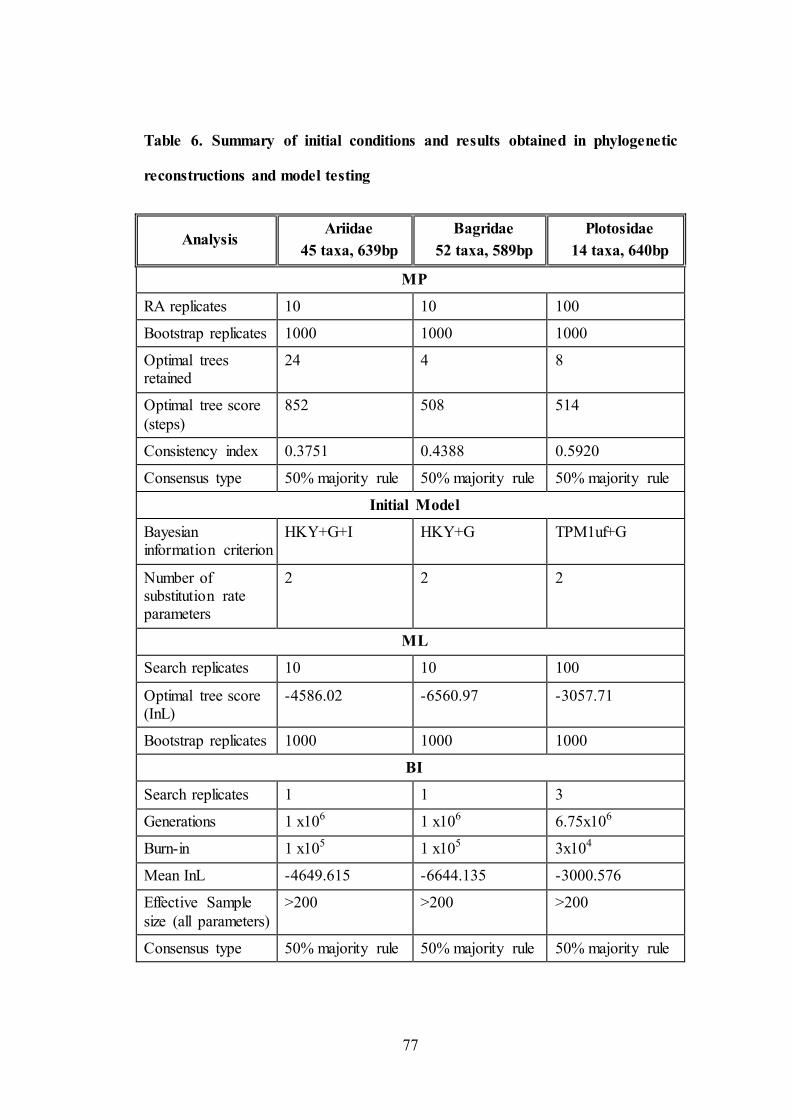
5.3.7. Phylogenetic analysis at genus and family level
No significant indels were observed in COI dataset. Start codon ATG was
present in all the COI datasets in first site. Optimality results obtained under different
analyses and model testing on the three data partitions are summarized in Table 6.
Among the three reconstruction methods conducted (MP, ML-RAxML, BI) on the
mitochondrial dataset, BI analysis resulted in least resolved tree. The consensus tree
of three methods is shown in Figure 10 – 12. Bootstrap values and posterior
probability values are labelled and indicated with gradient colour scheme for each of
the respective node in format BI/ML/MP.
77
Table 6. Summary of initial conditions and results obtained in phylogenetic
reconstructions and model testing
Analysis Ariidae
45 taxa, 639bp
Bagridae
52 taxa, 589bp
Plotosidae
14 taxa, 640bp
MP
RA replicates 10 10 100
Bootstrap replicates 1000 1000 1000
Optimal trees retained
24 4 8
Optimal tree score
(steps)
852 508 514
Consistency index 0.3751 0.4388 0.5920
Consensus type 50% majority rule 50% majority rule 50% majority rule
Initial Model
Bayesian information criterion
HKY+G+I HKY+G TPM1uf+G
Number of substitution rate parameters
2 2 2
ML
Search replicates 10 10 100
Optimal tree score (InL)
-4586.02 -6560.97 -3057.71
Bootstrap replicates 1000 1000 1000
BI
Search replicates 1 1 3
Generations 1 x10⁶ 1 x10⁶ 6.75x10⁶
Burn-in 1 x10⁵ 1 x10⁵ 3x10⁴
Mean InL -4649.615 -6644.135 -3000.576
Effective Sample
size (all parameters)
>200 >200 >200
Consensus type 50% majority rule 50% majority rule 50% majority rule
78
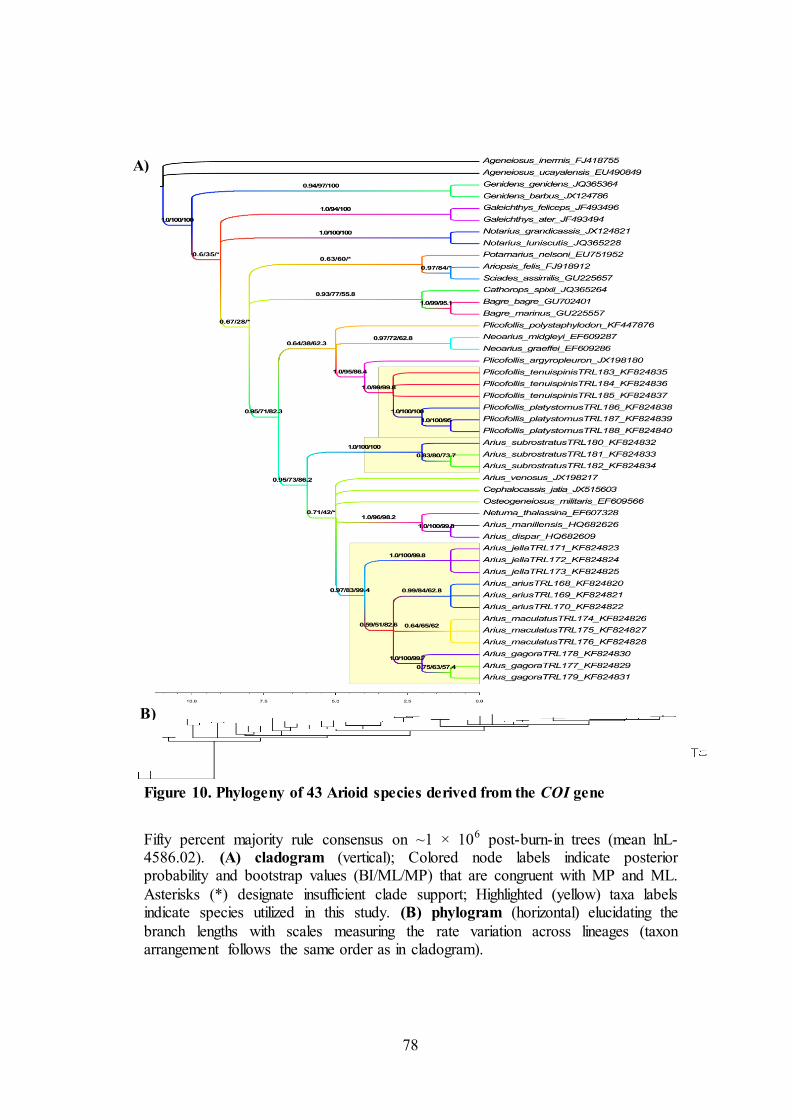
Figure 10. Phylogeny of 43 Arioid species derived from the COI gene
Fifty percent majority rule consensus on ~1 × 10⁶ post-burn-in trees (mean lnL-4586.02). (A) cladogram (vertical); Colored node labels indicate posterior probability and bootstrap values (BI/ML/MP) that are congruent with MP and ML.
Asterisks (*) designate insufficient clade support; Highlighted (yellow) taxa labels indicate species utilized in this study. (B) phylogram (horizontal) elucidating the
branch lengths with scales measuring the rate variation across lineages (taxon arrangement follows the same order as in cladogram).
A)
B)
79
A)
B)
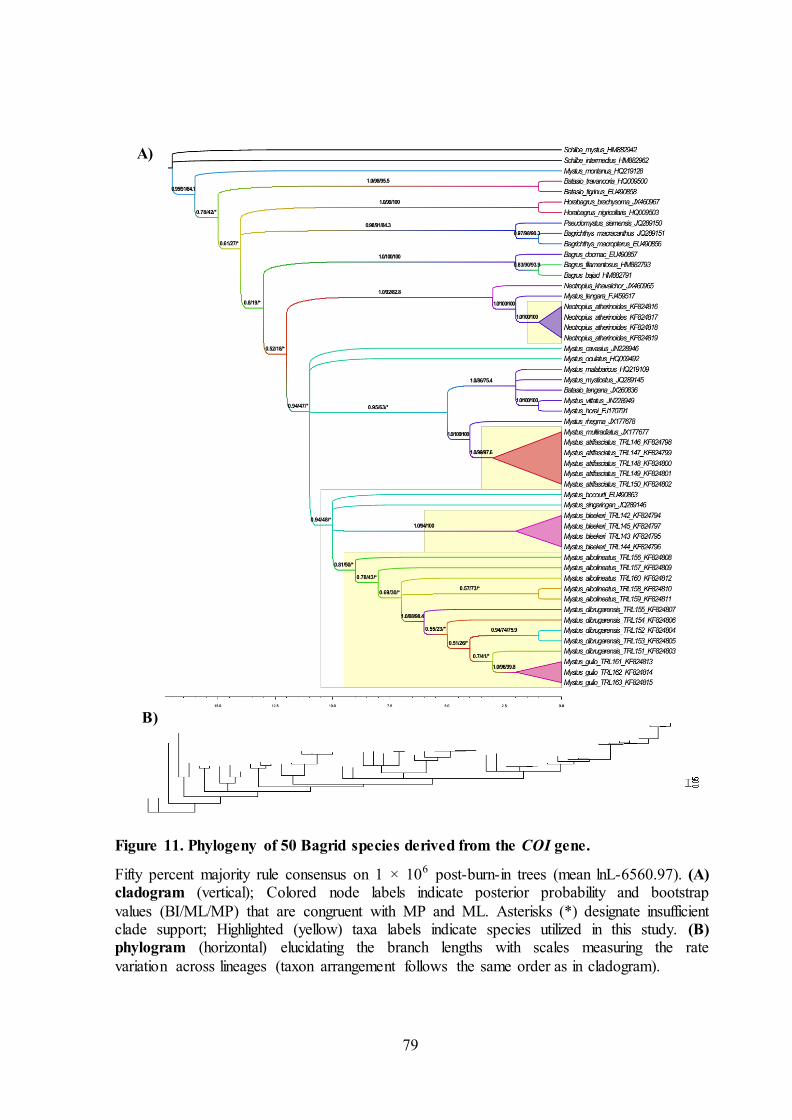
Figure 11. Phylogeny of 50 Bagrid species derived from the COI gene.
Fifty percent majority rule consensus on 1 × 10⁶ post-burn-in trees (mean lnL-6560.97). (A) cladogram (vertical); Colored node labels indicate posterior probability and bootstrap
values (BI/ML/MP) that are congruent with MP and ML. Asterisks (*) designate insufficient clade support; Highlighted (yellow) taxa labels indicate species utilized in this study. (B) phylogram (horizontal) elucidating the branch lengths with scales measuring the rate
variation across lineages (taxon arrangement follows the same order as in cladogram).
80
A)
B)
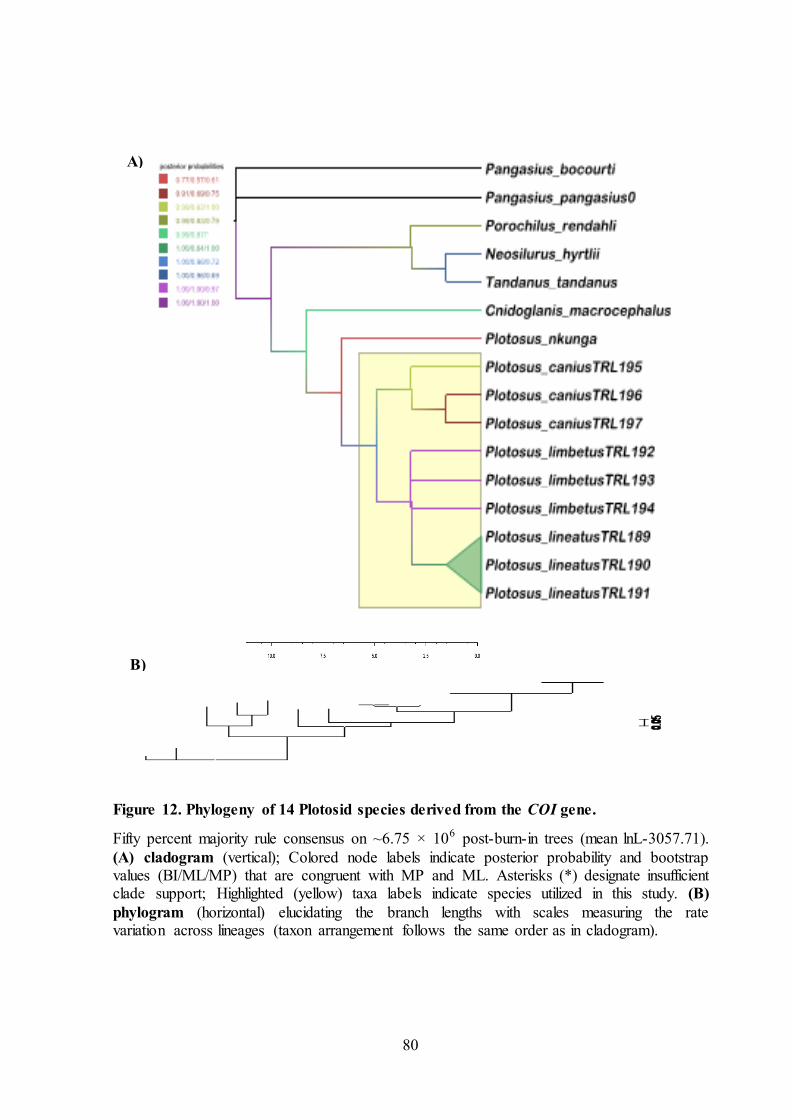
Figure 12. Phylogeny of 14 Plotosid species derived from the COI gene.
Fifty percent majority rule consensus on ~6.75 × 10⁶ post-burn-in trees (mean lnL-3057.71).
(A) cladogram (vertical); Colored node labels indicate posterior probability and bootstrap values (BI/ML/MP) that are congruent with MP and ML. Asterisks (*) designate insufficient clade support; Highlighted (yellow) taxa labels indicate species utilized in this study. (B)
phylogram (horizontal) elucidating the branch lengths with scales measuring the rate variation across lineages (taxon arrangement follows the same order as in cladogram).
81
5.4. Discussion
COI as a DNA marker has been able to discriminate between species
phylogenetic relationships appropriately. While choosing as outgroup for a family
level relationships, a phylogeneticist normally prefers a distantly related family taxa.
Hence in this case, Ageneiosidae (for Ariidae), Scheilbeidae (for Bagridae) and
Pangasidae (for Plotosidae) have been chosen as outgroups as observed from the
previous literature (Sullivan et al., 2006).
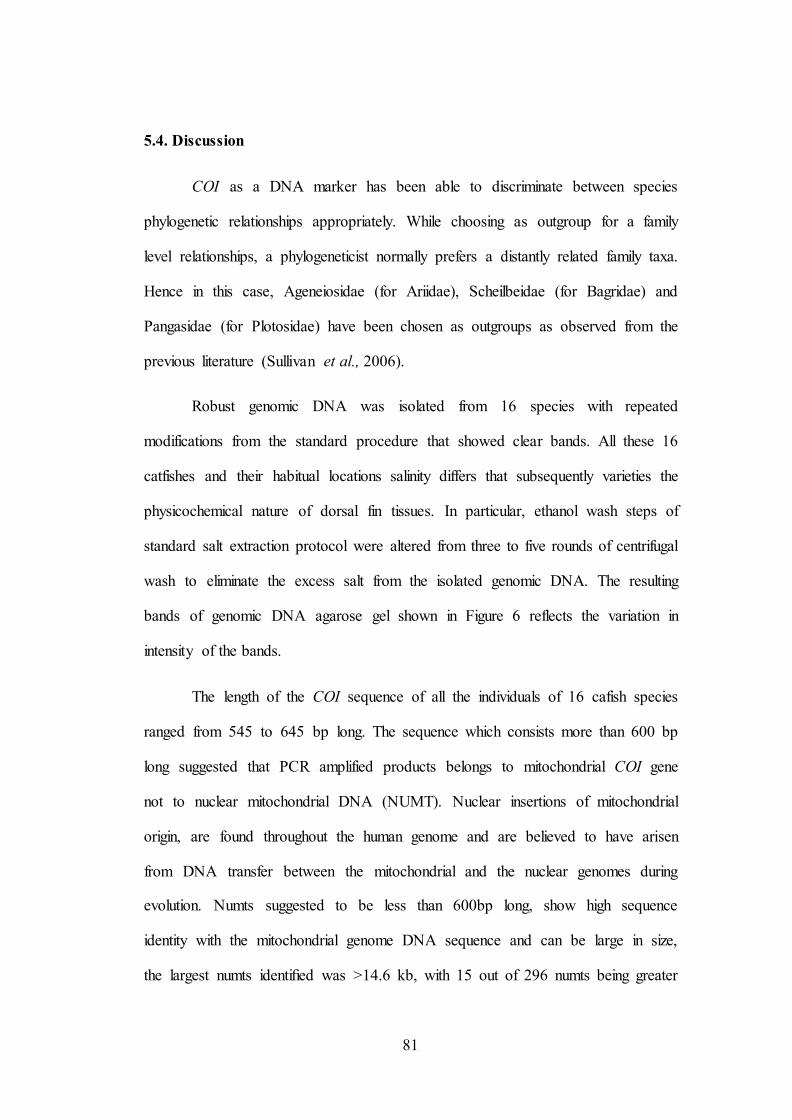
Robust genomic DNA was isolated from 16 species with repeated
modifications from the standard procedure that showed clear bands. All these 16
catfishes and their habitual locations salinity differs that subsequently varieties the
physicochemical nature of dorsal fin tissues. In particular, ethanol wash steps of
standard salt extraction protocol were altered from three to five rounds of centrifugal
wash to eliminate the excess salt from the isolated genomic DNA. The resulting
bands of genomic DNA agarose gel shown in Figure 6 reflects the variation in
intensity of the bands.
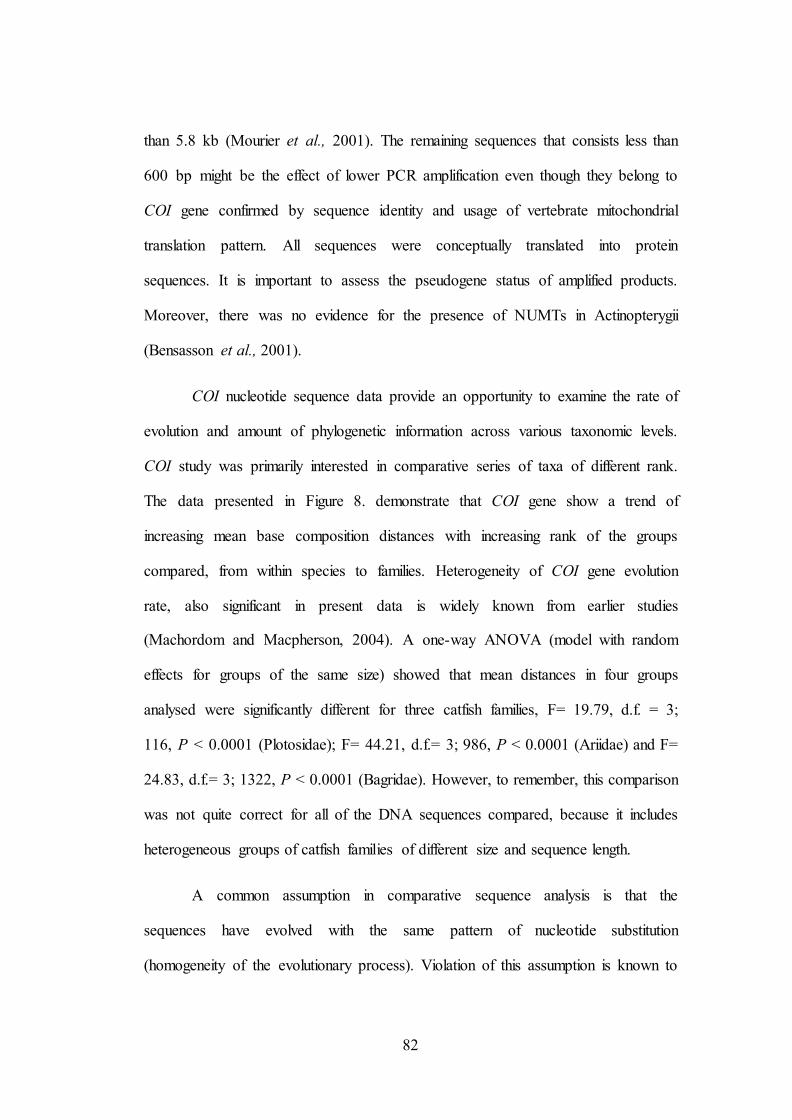
The length of the COI sequence of all the individuals of 16 cafish species
ranged from 545 to 645 bp long. The sequence which consists more than 600 bp
long suggested that PCR amplified products belongs to mitochondrial COI gene
not to nuclear mitochondrial DNA (NUMT). Nuclear insertions of mitochondrial
origin, are found throughout the human genome and are believed to have arisen
from DNA transfer between the mitochondrial and the nuclear genomes during
evolution. Numts suggested to be less than 600bp long, show high sequence
identity with the mitochondrial genome DNA sequence and can be large in size,
the largest numts identified was >14.6 kb, with 15 out of 296 numts being greater
82
than 5.8 kb (Mourier et al., 2001). The remaining sequences that consists less than
600 bp might be the effect of lower PCR amplification even though they belong to
COI gene confirmed by sequence identity and usage of vertebrate mitochondrial
translation pattern. All sequences were conceptually translated into protein
sequences. It is important to assess the pseudogene status of amplified products.
Moreover, there was no evidence for the presence of NUMTs in Actinopterygii
(Bensasson et al., 2001).
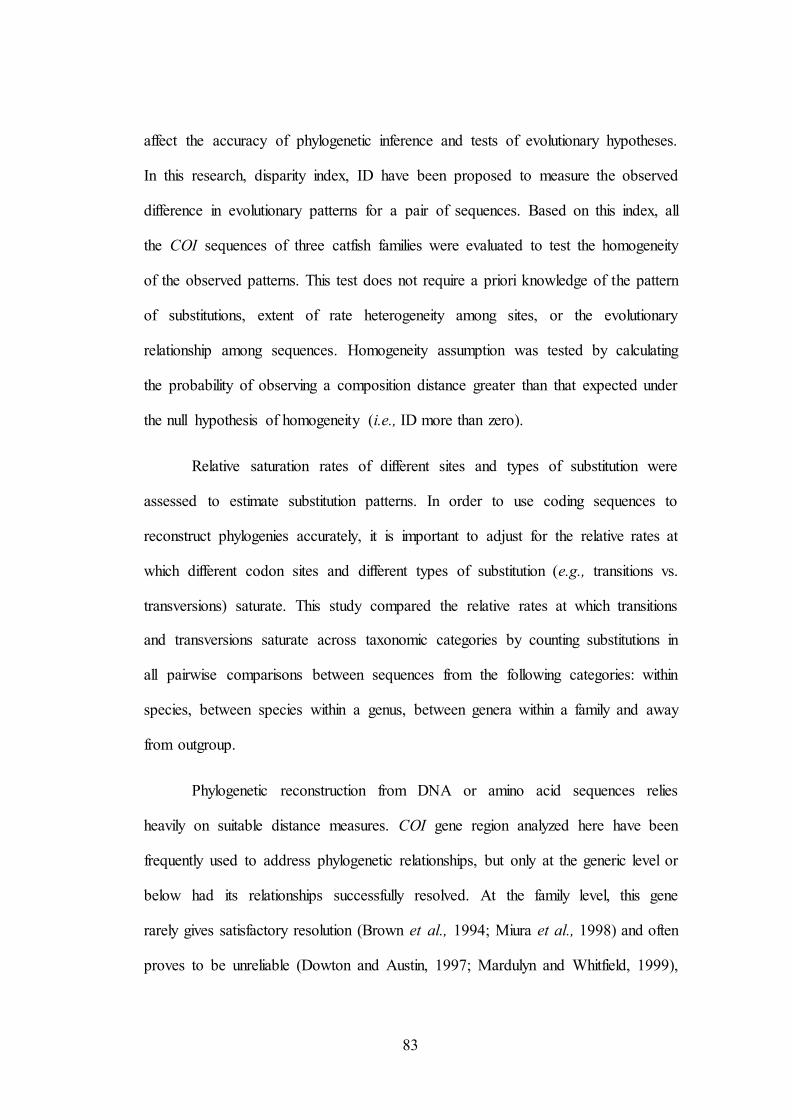
COI nucleotide sequence data provide an opportunity to examine the rate of
evolution and amount of phylogenetic information across various taxonomic levels.
COI study was primarily interested in comparative series of taxa of different rank.
The data presented in Figure 8. demonstrate that COI gene show a trend of
increasing mean base composition distances with increasing rank of the groups
compared, from within species to families. Heterogeneity of COI gene evolution
rate, also significant in present data is widely known from earlier studies
(Machordom and Macpherson, 2004). A one-way ANOVA (model with random
effects for groups of the same size) showed that mean distances in four groups
analysed were significantly different for three catfish families, F= 19.79, d.f. = 3;
116, P < 0.0001 (Plotosidae); F= 44.21, d.f.= 3; 986, P < 0.0001 (Ariidae) and F=
24.83, d.f.= 3; 1322, P < 0.0001 (Bagridae). However, to remember, this comparison
was not quite correct for all of the DNA sequences compared, because it includes
heterogeneous groups of catfish families of different size and sequence length.
A common assumption in comparative sequence analysis is that the
sequences have evolved with the same pattern of nucleotide substitution
(homogeneity of the evolutionary process). Violation of this assumption is known to
83
affect the accuracy of phylogenetic inference and tests of evolutionary hypotheses.
In this research, disparity index, ID have been proposed to measure the observed
difference in evolutionary patterns for a pair of sequences. Based on this index, all
the COI sequences of three catfish families were evaluated to test the homogeneity
of the observed patterns. This test does not require a priori knowledge of the pattern
of substitutions, extent of rate heterogeneity among sites, or the evolutionary
relationship among sequences. Homogeneity assumption was tested by calculating
the probability of observing a composition distance greater than that expected under
the null hypothesis of homogeneity (i.e., ID more than zero).
Relative saturation rates of different sites and types of substitution were
assessed to estimate substitution patterns. In order to use coding sequences to
reconstruct phylogenies accurately, it is important to adjust for the relative rates at
which different codon sites and different types of substitution (e.g., transitions vs.
transversions) saturate. This study compared the relative rates at which transitions
and transversions saturate across taxonomic categories by counting substitutions in
all pairwise comparisons between sequences from the following categories: within
species, between species within a genus, between genera within a family and away
from outgroup.
Phylogenetic reconstruction from DNA or amino acid sequences relies
heavily on suitable distance measures. COI gene region analyzed here have been
frequently used to address phylogenetic relationships, but only at the generic level or
below had its relationships successfully resolved. At the family level, this gene
rarely gives satisfactory resolution (Brown et al., 1994; Miura et al., 1998) and often
proves to be unreliable (Dowton and Austin, 1997; Mardulyn and Whitfield, 1999),
84
while at still higher levels; cytochrome oxidase sequences are not suitable for
resolving relationships (Liu and Beckenbach, 1992; Howland and Hewitt, 1995;
Frati et al., 1997). COI data set in this study in comparison to these higher-level
phylogenetic relationships is a first step towards this objective.
Ariidae
The monophyly of the Ariidae has not been seriously questioned and is
strongly supported on both molecular and morphological grounds (Sullivan et al.,
2006; Kailola et al., 2004; Acero and Betancur, 2007). The group is divided into two
subfamilies, the monogeneric Galeichthyinae (four species) which predominantly
belong to marine species and the Ariinae (remaining taxa) (Acero and Betancur,
2007), so that apart from Ariinae, Galiechthys feliceps and Galiechthys ater were the
only utilized species in this study. These contribute 106 singletons, 89 two-fold and
123 four-fold degenerative sites from the whole Ariidae family. Ti/tv bias was two-
fold higer in 1st codon position (9.00) than the 3rd codon position (4.65). In Arius
genus, this becomes inverse with ti/tv bias, which was six-fold higher in 3rd codon
position (7.47) than the 1st codon position (1.46). But in whole Ariidae family, ti/tv
bias was nearly equal in 1st (5.07) and 3rd (5.55) codon positions (Table 5). From the
phylogram of whole Ariidae, Galeichthyinae branches shows it had recently
diverged with longer branch length in G. feliceps (Figure 10). Their base
composition distance fall within thin limits of 5% level significance of Standard
Error and does not affect the different levels of taxa (Figure 8). Different patterns of
substitution have been attributed for G. feliceps against all the Ariid species (ID
between 0.25 and 0.68) except A. jella and A. subrostratus at 5% level of
significance (Figure 10). This might be the reason for the inverse relationship of ti/tv
85
bias at 1st and 3rd codon positions as explained in aforementioned statement. Even
then, G. feliceps exhibit different substitution pattern (ID = 0.1522) against the same
species G. ater, which was highly significant contributing the longer branch length
in phylogram.
The whole Arius genus comprises 8 species, out of which 5 are utilized from
this study and the remaining two (A. dispar and A. manillensis) from Santos and
Quilang, (2011). There are totally 531 conserved and 108 variant sites in Arius genus
that consist 88 pi sites in total out of which 81 are at 3rd postion of a codon.
Especially, in 40th nucleotide base, adenosine triphosphate (ATP) was present in
Arius arius, whereas all other species contain cytosine. Initially ti/tv bias for the
Ariidae family was found to be 10. But with addition of outgroups, according to the
HKY+G+I model tested through BIC, ti/tv bias found to be 7.19. The ti/tv bias, A+T
content, Pi sites at all the 1+2+3 coding sites observed for all the species of Arius
genus maintain balancing selection at the nucleotide level without any drastic change
(Table 5). The base composition distance for all the species of Arius genus fell
within limits of same species distance (<0.007) with the exception for Arius gagora
(0.022). Against family comparison, Arius genus exhibited highest base composition
distances when compared with Bagre bagre (Figure 8). Homogeneity pattern of
substitution has been maintained for all the species of Arius genus accepting the null
hypothesis with the exception between A. jella and A. gagora but with the lowest
disparity index estimate (ID = 0.0819) (Figure 9). The cladogram from Figure 10A
for Arius genus displayed monophyletic group with higher bootstrap and posterior
probability values for all the species except A. subrostratus and the other species that
are not sampled in this study. The phylogram shows that the branch lengths of the
entire Arius genus showed negligible branch lengths depicting least substitution rates
86
all throughout the Ariid family based on COI dataset. Although the basal arioid
clades are well defined, much controversy has arisen regarding the phylogeny and
classification of ariid taxa, particularly within diverse Ariinae (Betancur, 2009a).
The whole Plicofollis genus comprises 4 species, out of which 2 are utilized
from this study and the remaining two (P. tenuispinis and P. argyropleuron) from
unpublished study as reported in NCBI database. The A+T content at 3rd codon
position was nearly 70% and the Ti/tv bias was higher at 1st coding site (3.74) than
3rd coding site (2.22). Other than this, no peculiar phenomenon could be observed on
singletons, Pi sites and 2-fold and 4-fold degeneracy sites at all the 1st + 2nd + 3rd
coding sites observed for all the species that may maintain balancing selection at the
nucleotide level without any drastic change (Table 5). The base composition distance
for all the species of Plicofollis genus fell within limits of same species distance
(<0.002), but with the exception for Plicofollis platystomus (0.015) (Figure 8).
Homogeneity pattern of substitution has been maintained for all the species of
Plicofollis accepting the null hypothesis with the exception between Plicofollis
argyropleuron with Plicofollis tenuispinis (ID = 0.084 and 0.096) and Plicofollis
platystomus (ID = 0.176) (Figure 9). The cladogram constructed by Maximum
Parsimony, Maximum Likelihood and Bayesian inference from Figure 10A for
Plicofollis genus displayed monophyletic group with higher bootstrap and posterior
probability values for all the species except two species of Neoarius, which
intervened separating P. polystaphylodon. While this interruption was reported with
less bootstrap value from ML construction. The phylogram shows that the branch
lengths of all the Plicofollis genus showed <0.1 depicting moderate substitution rates
all throughout the Ariid family.
87
Plotosidae
Plotosid fishes have been called blunt-tail catfishes or eeltail catfishes which
contributes very few reports for molecular marker studies. Previous results suggest
that the family was originally marine, with an invasion into freshwaters. (Page and
Hughes, 2010). As currently defined the family has 9 genera and ~40 species. Five
of those genera are restricted to freshwaters in Australia and New Guinea, while the
remaining four genera are marine. Of the marine genera, all but one is restricted to
seas around Australia and New Guinea. The last marine genus, Plotosus is extremely
widespread, occurring from South Africa and Japan to Australia.
The whole Plotosus genus comprises 4 species, out of which 3 are utilized
from this study and the remaining one species (P. nkunga) from unpublished study
as reported in NCBI database. The A+T content at 1st and 3rd codon position was
around 60% and the Ti/tv bias was higher at 1st coding site (5.39) than 3rd coding site
(1.46) (Table 5). Other than this, abnormal extremities were not observed on
singletons, Pi sites, two-fold and four-fold degeneracy sites at all the 1st + 2nd + 3rd
coding sites observed for all the species of Plotosus genus that may maintain
balancing selection at the nucleotide level without any drastic change (Table 5).
There are 160 Pi sites in whole Plotosidae family and reduces to 98 sites when
restricted to Plotosus genus. In that case, only one Pi site was observed in 2nd codon
position at the 479 nucleotide site in this genus. The base composition distance for
all the species of Plotosus fell within limits of same species distance (<0.006).
Higher values of base composition distance (~0.25) across all the genus within
Plotosidae family beyond the values of outgroup comparisons (~0.08) were clearly
noted (Figure 8). Two outliers and two far outlier values were observed for
88
Porochilus rendahli and Cnidoglanis macrocephalus against the Plotosus genus.
Homogeneity pattern of substitution has been maintained for all the species of
Plotosus genus accepting the null hypothesis with the exception between Porochilus
rendahli with all the species of Plotosus tenuispinis (ID = 0.35 and 0.43) (Figure 9).
The cladogram constructed by Maximum Parsimony, Maximum Likelihood and
Bayesian inference shown in Figure 12A for Plotosus genus displayed monophyletic
group with higher bootstrap and posterior probability values for all the species The
phylogram shows that the branch lengths of all the Plotosus genus showed branch
lengths <0.1 depicting moderate substitution rates throughout this genus as per COI
dataset.
Bagridae
Bagrid catfishes constitute a very important group among siluriformes
having immense commercial importance from inland fisheries and aquaculture
farming in south-east countries. Bagridae family, comprising of 27 genera (six in
Indian region) is widely distributed in Asia and Africa (Talwar and Jhingran, 1991).
With the available COI sequences, six genera have been utilized in this study with
the importance given to Mystus genus. More pi characters (243) was observed on
Bagridae for Maximum Parsimony tree construction. Minimized number of optimal
trees (8) were retained as observed in Bagridae and highest (24 trees) for Ariidae.
There are other examples of bursts of fish evolution, documented by molecular
markers (Rutaisire et al., 2004; Duftner et al., 2005).
The whole Mystus genus comprises 17 species, out of which 5 are utilized
from this study and the remaining species from unpublished studies as reported in
NCBI database. The 22 out of 48 singletons were observed in 1st codon position
89
which is higher than the 3rd codon position (19). Most singletons observed in Mystus
genus were observed from the other species that were not utilized in this study.
There are totally 189 variant sites in Mystus genus that consist 199 pi sites in total
out of which 116 are at 3rd postion of a codon. Initially ti/tv bias for the Ariidae
family was found to be 10. But with addition of outgroups, according to the HKY+G
model tested through BIC, ti/tv bias found to be 1.963. The ti/tv bias was higher at
1st and 2nd coding site than 3rd coding site seeking out alternative explanations for
neutral theory of natural selection. A+T content and singletons reported higher
values in 1st codon position. Pi sites (199) was highest when compared to the other
catfish families at all the 1st + 2nd + 3rd coding sites observed for all the species of
Mystus that enable enrichment for the phylogenetic tree construction (Table 5). The
base composition distance for all the species of Mystus changes dynamically (0 –
0.07) for highest value of same species distance (0.0720) between individuals of
Mystus albolineatus and the null values arose from individuals of Mystus bleekeri
and Mystus atrifasciatus. Between species base composition distance values lies
between 0.058 – 1.523 where the highest value was noted between Mystus
atrifasciatus and Mystus monatanus and the lowest between Mystus gulio and
Mystus cavasius. Against family comparison, those values lies between 0.0136 -
1.0759 (Table 5), Mystus atrifasciatus exhibited highest base composition distances
when compared with Bagrus docmac and the lowest between Mystus albolineatus
and Bagricthys macracanthus (Figure 8). Homogeneity pattern of substitution has
not been maintained for all the species of Mystus rejecting the null hypothesis with
the highest disparity index estimate (ID = 1.5798) between Mystus montanus (Figure
9). The cladogram through MP, ML and BI phylogenetic methods from Figure 11A
for Mystus genus displayed monophyletic group with higher bootstrap and posterior

90
probability values for all the species except Mystus montanus forming a distant and
distinct clade whereas Mystus tengara collides into monophyletic clade when
Neotropius genus was removed. The phylogram shows that the branch lengths of all
the Mystus genus showed longer branch lengths compared to other catfish families
utilized in this study accumulating intense substitution rates all throughout the
Bagrid family. This may alter balancing selection under neutral theory of natural
selection. Longest branch length was denoted from Mystus montanus, which could
affect the total phylogram through long branch attraction.
This phylogenetic analysis is a first step toward this objective, although it
still needs more comparative ecological data for a comprehensive analysis of the
evolution of feeding habits. This study establish a phylogenetic hypothesis for the
three catfish families and examine the monophyly of the subfamilies and several
genera.


![Materials and Methods Virus and Cell Culture · 2003. 5. 29. · M93390], porcine hemagglutinating encephalomyelitis virus [GenBank accession no. AY078417], and rat coronavirus [GenBank](https://img.dokumen.tips/doc/110x75/60fa15f885c2ea386429c204/materials-and-methods-virus-and-cell-culture-2003-5-29-m93390-porcine-hemagglutinating.jpg)