Embed Size (px)
Citation preview

137
5 CHAPTER 5: CHARACTERIZATION OF COPOLYMERS AS
COATING MATERIALS
Coating performance tests serve a number of purposes. They are important for
quality control in production, to satisfy the requirements of users’ specifications and finally
as a tool for research and development.
Durability of coating can be defined as its ability to endure and to remain unchanged
by exposure to unfavorable conditions. Test methods are usually designed to accelerate the
derivative processes to which the coatings are exposed. The performance of coatings can be
assessed by visual inspection but more quantitative approach is required for objective
evaluation. Reproducibility is also an important issue. Thus, it is very necessary to establish
good test methods. Organizations such as American Standard Testing Method (ASTM)
have established standardized methods for testing coatings that are generally useful in
understanding the performance and failure of coating. However, there is no fully reliable
testing to evaluate the application and appearance of coated products although much
progress has been made in recent years in introducing testing instrumentations.
Many important properties of coating materials are difficult to define in scientific
units. Due to the complexity of coating materials, most of the tests utilized are empirical,
that are based, not on theoretical consideration, but on visual inspection. Most of the
properties are seldom single physical characteristics, but resultants of several factors, as for
instance in hardness measurements, adhesion and flexibility has important influence on the
measured property [138].

138
The coating system that performs well in a known environment is not always a clear
cut decision. The service environment, type of substrate, abrasive resistance and durability
are all factors that should be noted before a coating system is adopted. For instance,
resistance to indentation and scratching is very important, as poor scratch resistance is
definitely a limiting factor for service life of a coating.
This chapter reports the testings that evaluate the palm oil-based resins discussed in
the earlier chapters as coating materials on mild steel panels. Before any resin is coated on
the panel, the mild steel panels for the coatings need to be treated. Curing time or drying
time for coatings is reported in Section (5.2.1). Testings such as adhesion test, pencil
hardness test, chemical resistance and solvent rub tests were performed and reported in the
next sections. The results of coating tests are discussed in each section.
5.1 Preparation on mild steel panels and coating application
It is important that all steel test panels used should be of uniform quality, un-
deformed and uniform thickness. The surface should be cleaned by a method that is
reproducible. Metal surfaces are usually contaminated with oil and should be perfectly
cleaned and freed of any greases and oily materials because such surfaces can have very
low tension [139].
There are many methods to clean the surface of steel panels. In this research, panels
are prepared according to IS (Indian Standard Methods of Test for Readymade Paints and
Enamels 1964). Mild steel panels of 7 cm x 20 cm were used for evaluating the coating
performances. A clean cotton cloth is soaked into xylene and used for removing grease or
oil from the surface of the panel. Thereafter, the surface was abraded with sandpaper No.
139
400 to remove loose rust scale and was smoothened by sandpaper No. 600. The surface of
the test panel was wiped again with a wet cotton cloth soaked in xylene until fresh portions
of the cloth show no discoloration. The prepared test panels were stored in desiccators
before using.
To produce uniform films and reproducible thickness, a pool of coating material was
poured across the end of the Sheen coater (model S 971096) on the panel and then drawn
uniformly along the length of the panel. Films of 50 μm and 100 μm wet film thickness
were coated on the panels and left to dry at room temperature for 2 days before testing.
After the coating is completely dried, the thickness of the films was measured using a
thickness meter (Sheen- Ecotest Plus B FN2, type 121-17-00).
5.2 Tests on coatings properties
In this work, a number of test types were performed on MMC samples produced in
Chapter 4. These tests include drying time, adhesion test, pencil hardness, water immersion,
acid, alkali and salt resistances, and solvent rub test. To ensure the results for each
formulation, each test was repeated more than two times.
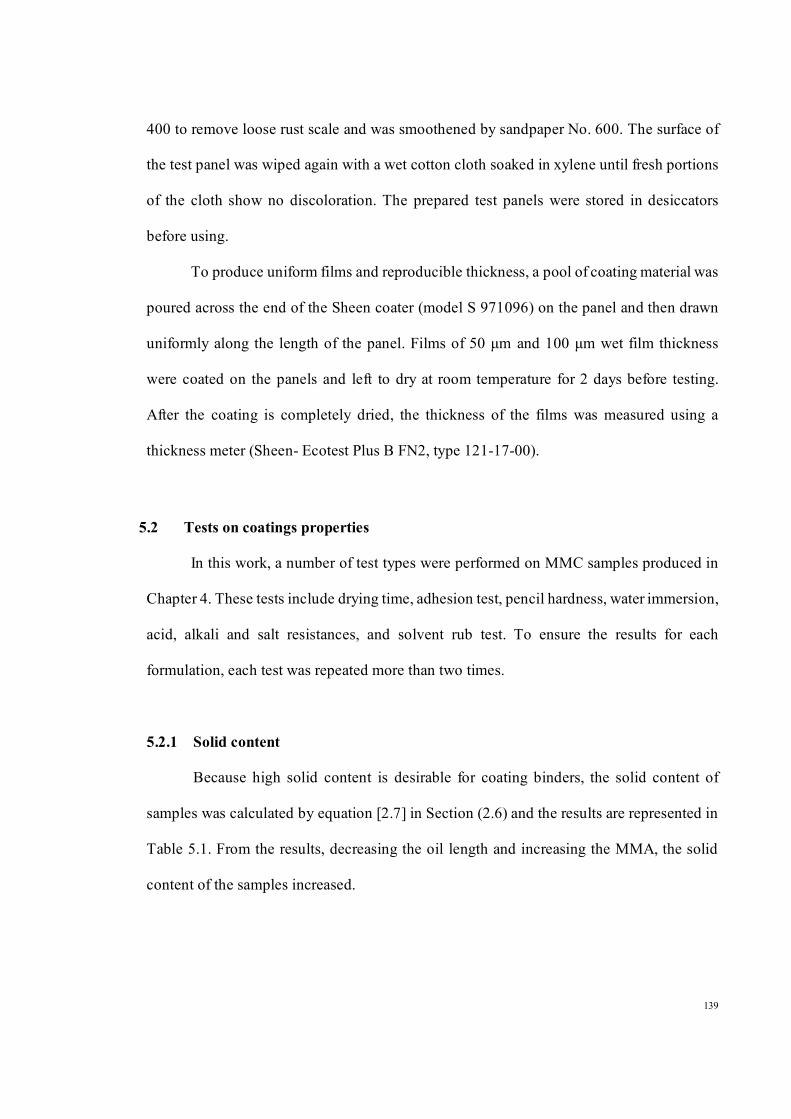
5.2.1 Solid content
Because high solid content is desirable for coating binders, the solid content of
samples was calculated by equation [2.7] in Section (2.6) and the results are represented in
Table 5.1. From the results, decreasing the oil length and increasing the MMA, the solid
content of the samples increased.
140
Table 5.1 : Solid content of copolymers (MMC) and PMMA for coating application Sample AL1 AL2 AL3 AM1 AM2 AM3 AS1 AS2 AS3 PMMA
Solid content (%) 12.0 17.1 23.8 13.0 18.5 25.3 21.0 24.5 28.3 31.7
5.2.2 Drying time test
The three stages of film formation in the drying of coatings are determined by using
the testing method stated in ASTM D1640-83. This test method describes the determination
of several stages and the rate of dry-film formation of organic coatings.
In order to determine set-to-touch time, the coated films are lightly touched with the
tip of a clean finger and immediately placed against a clean piece of clear glass. Pressure of
the fingertip against the coated part is made in such a manner that not greater than that
required to transfer a mark of the coating from 3 to 5 mm in cross section.
The film is considered dry-to-touch when film no longer sticks to finger and does
not rub up when the finger is lightly moved across the surface.
The third testing for drying is to determine the dry-hard-time. Dry-hard-time is
reached when the drying and curing, have proceeded sufficiently. With the end of thumb
resting on the test film and the forefinger supporting the test panel, a maximum downward
pressure (without twisting) of the thumb on the film is applied. The contacted area is lightly
polished with a soft cloth. The film is considered dry to hard when any spot left by the
thumb is completely removed by the polishing operation. Times were measured in seconds
by using stopwatch. After the coating is completely dried, the thickness of the film is
measured by using thickness meter. The dried coatings have an average thickness of 30±3
μm.
141
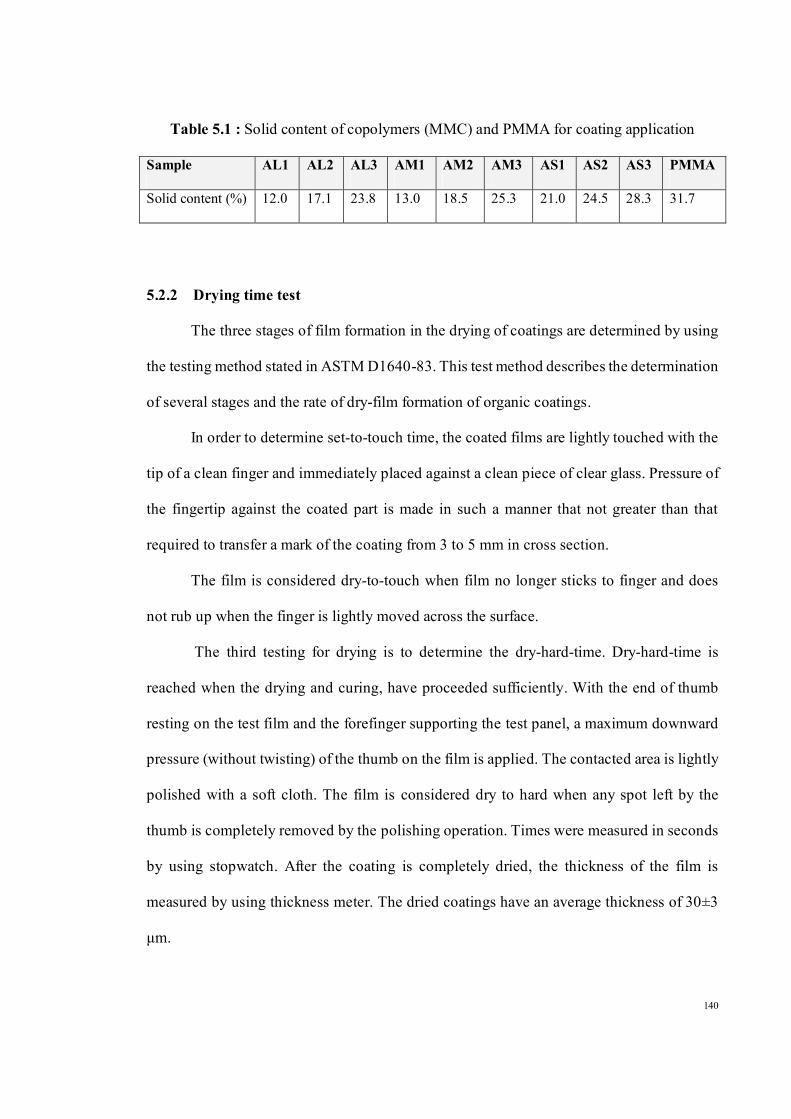
5.2.3 Adhesion measurement
Adhesion test was designed to assess the adherent strength of the film according to
ASTM D3359-93. A criss-cross lattice pattern with six cuts in each direction was made
with space of 1 mm and 20 mm long.
Table 5.2 : Classification of adhesion test results
Classification Surface of cross-cut area from
which flaking has occurred. (Example for six paralleled cuts)
Remarks
5B None The edges of the cuts are completely smooth; none of the squares of the lattice is detached. Good and acceptable
4B
Small flakes of the coating are detached at intersections; less than 5% of the area is affected. Good and acceptable.
3B
Small flakes of the coating are detached along edges and at intersection of cuts. The area affected is 5 to 15 % of the lattice. Good and acceptable
2B
The coating has flaked along the edges and on parts of the squares. The area affected is 15 to 35% of the lattice. Not acceptable.
1B
The coating has flaked along the edges of cuts in large ribbons and whole squares have detached. The area affected is 35 to 65% of the lattice. Not acceptable.
0B Greater than 65% Flaking and detachment worse than Grade 1B. Not acceptable.
After making the required cuts, the film was brushed lightly with a soft brush to remove
any detached chips of coatings. A piece, about 75 mm long, of pressure-sensitive tape was
separated and placed over the grid and smoothed into place by finger. The tape is rubbed
142
firmly with eraser to ensure sufficient contact with the film. The tape was removed after 90
s in an angle close to 180°. The grid area was inspected by visual inspection for removal of
any coating from the substrate. The adhesion is rated according to the scale displayed in
Table 5.2 adapted from ASTM D3359-93. The best adhesion performance is indicated by
5B (0% of area removed) while the worst performance is 0B (> 65% of area removed).
5.2.4 Pencil hardness test
The scratch hardness was estimated by pencil hardness test. The test procedure was
done using a Sheen Pencil Hardness Kit according to ASTM D3363-92a with a set of
calibrated wood pencils with scale of hardness 6B (softest) to 6H (hardest).
6B - 5B - 4B - 3B - 2B - B - HB - F - H - 2H - 3H - 4H - 5H - 6H
Softer Harder
The pencil was shaved to remove approximately 5-6 mm wood to expose about 3 mm
length of pencil lead. The sharpened pencil was rubbed with an abrasive paper at angle of
90° to obtain a flat, smooth and circular cross section. A new sharpened pencil lead was
used for each test. The pencil test used constant pressure and variable hardness of the test
tool as its fundamental principle. The pencil was moved over the surface using the pencil
tester at an angle of 45°. The schematic diagram of the pencil tester and test conducted is
shown in Figure 5.1.
143
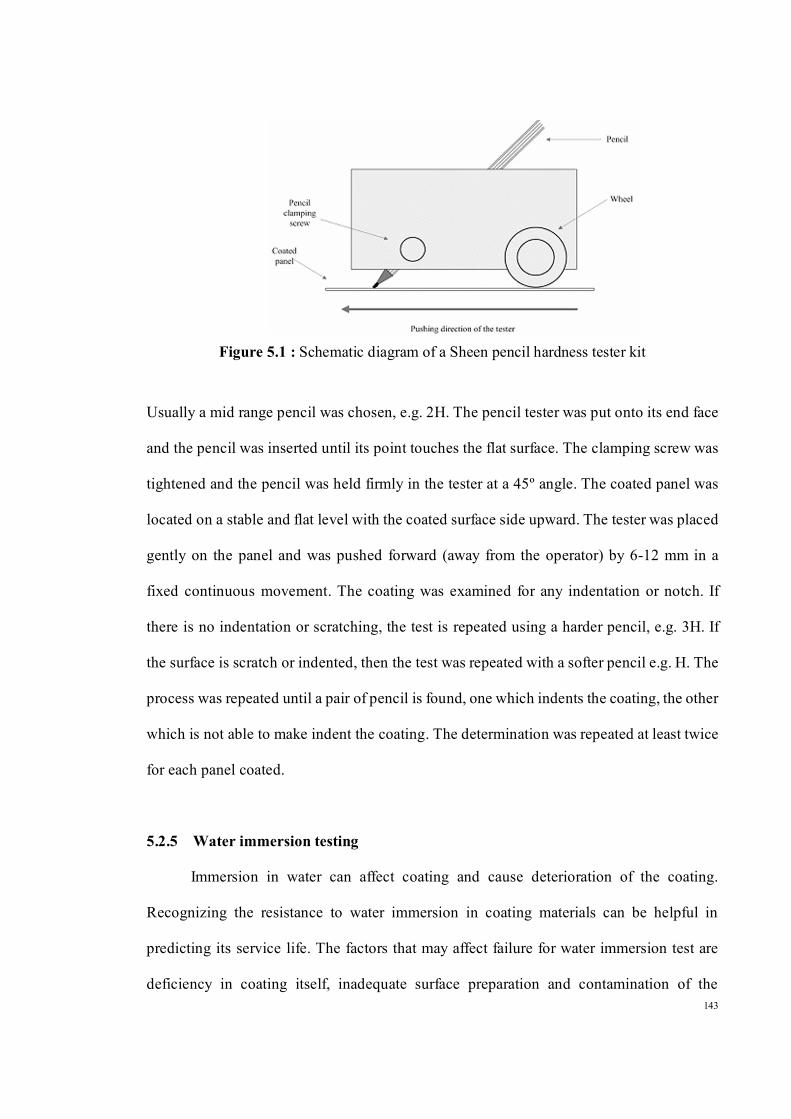
Figure 5.1 : Schematic diagram of a Sheen pencil hardness tester kit
Usually a mid range pencil was chosen, e.g. 2H. The pencil tester was put onto its end face
and the pencil was inserted until its point touches the flat surface. The clamping screw was
tightened and the pencil was held firmly in the tester at a 45º angle. The coated panel was
located on a stable and flat level with the coated surface side upward. The tester was placed
gently on the panel and was pushed forward (away from the operator) by 6-12 mm in a
fixed continuous movement. The coating was examined for any indentation or notch. If
there is no indentation or scratching, the test is repeated using a harder pencil, e.g. 3H. If
the surface is scratch or indented, then the test was repeated with a softer pencil e.g. H. The
process was repeated until a pair of pencil is found, one which indents the coating, the other
which is not able to make indent the coating. The determination was repeated at least twice
for each panel coated.
5.2.5 Water immersion testing
Immersion in water can affect coating and cause deterioration of the coating.
Recognizing the resistance to water immersion in coating materials can be helpful in
predicting its service life. The factors that may affect failure for water immersion test are
deficiency in coating itself, inadequate surface preparation and contamination of the

144
substrate [140]. The method of water immersion test is according to ASTM D1647-89. The
aim of this test is to check the resistance of the coating against prolonged exposure to
moisture. The test is carried out at room temperature according to reported procedure [141].
The dried panels were immersed in a beaker containing distilled water for 18 h. After 18 h,
the panels were taken out, air-dried and inspected for any defects, like whitening,
shrinkage, film softened, loss of gloss and lift off.
5.2.6 Acid resistance test
Acid resistance test was carried out according to reported procedure described by
K.P Somani et al. [142]. Aqueous solution of acid hydrochloric 0.1 M (HCl) was prepared
in a beaker and warmed up to 80˚C. The coated panels were placed, with the edge about 5
cm on the bottom of the beaker and the top of the panel resting by the side. Each panel was
tested in a separate beaker. The coated panels were immersed in the solution for 1h at 80˚C
during the testing period. At the end of the examination time, each panel was removed from
the solution. The panel was then dried at room temperature for 24 h before checking for any
deterioration.
5.2.7 Alkali resistance test
Alkali resistance test was performed by using sodium hydroxide 0.1 M (NaOH) and
following the same procedure as that of the acid resistance test.
5.2.8 Salt water resistance test
This test was performed to assess the coating resistance to marine conditions. In this
work the testing method for salt water immersion test was adapted from K.P. Somani et al.

145
[142]. Sodium chloride solution 5% was prepared in a beaker and heated up to 80˚C. The
rest of the procedure was done according to the Section (5.2.5) and Section (5.2.6).
5.2.9 Solvent resistance test (Solvent rub)
Rubbing with a cloth soaked in suitable solvent is one method to determine
resistance of coated panel to solvent. Solvent resistance can be influenced by film
thickness, humidity, temperature and air movement (ASTM D5402-93). The solvent
resistance testing was carried out according to ASTM D5402-93. An area of 150 mm long
and 25 mm width was marked using a pencil on the coated surface. Thickness of the dried
film of the coating in the selected area was measured before solvent test. A cotton cloth was
folded into a pad of double thickness and soaked into the specified solvent. The index
finger was placed at the center of the pad at an angle of 45° to the test surface while holding
excess cloth with the thumb and remaining fingers of the same hand. The rectangular test
area was rubbed with moderate speed in forward and backward motion.
One forward and backward motion was counted as one double rub. Each double rub
should be completed at the rate of approximately 1s. The test area was continuously rubbed
for a total of 25 double rubs in the rectangular test area. The area was immediately checked
for any visual changes in appearance, comparing to an adjacent unrubbed area. The film
thickness of the rubbed area was measured again after solvent test and two thicknesses were
compared. The cloth was visually inspected for any indication of coating removal. Solvent
rub test was performed by using acetone, ethyl acetate and methyl ethyl ketone.

146
5.3 Results and discussion
As mentioned in Chapter 4 three kinds of macromers were used in synthesizing the
copolymers. These macromers differ by the oleic acid content where AlkOA28 has lowest
oleic acid content (28%), AlkOA40 contains 40% oleic acid and finally AlkOA65 has the
highest percentage of oleic acid (65%).
The MMC samples were synthesized with varying MMA/macromer ratio and oleic acid
content in macromers compositions and the influence of these two factors on the coating
characteristics is studied. To improve some of the coating properties, BA monomer was
utilized as a comonomer and the effect of BA monomer was also evaluated. It is expected
that these factors will give significant changes in the performance of the finished coatings.
The results of the coatings performance by examined MMC and MMBC samples will be
discussed in next sections i.e. 5.3.1 to 5.3.7 and 5.4.1 to 5.4.7 respectively.
5.3.1 Coatings appearance
Overall each film shows appearance in term of clarity and shininess. With increment
of MMA/macromer ratio, shininess of the coatings seems to remain the same. However, a
slight tinge of yellowness is observed in AL samples. Of course the yellowing could be
covered using pigments in the formulation of the coatings.
The coating appearance observed above can be explained along these lines. The
macromers were synthesized by fatty acid method. Alkyds cooked from this procedure are
expected to be more viscous with lighter color than those cooked by conventional method
[143]. Phthalic anhydride, oleic acid and glycerol were used for synthesis of the
macromers. Polyesterification of just phthalic anhydride and glycerol gives a very clear
product. However as oleic acid is included, the end product, i.e. macromers show a slight
tinge yellowness due to the nature of the oleic acid itself. Percentage of the oleic acid
147
determines the properties of the macromers with oil like properties (the highest oleic acid
content) locating at one extreme and resin like properties (with the lowest oleic acid
content) locating the other end. AlkOA65 shows oil like properties and AlkOA28 shows
resin like properties. It can be expected that as the oleic acid content in the macromer
formulation increases, the color and gloss retention decrease or vice versa. Moreover, the
percentage of the MMA monomer in copolymer composition plays important role in
appearance of the films, as more MMA content would cause to be shinier.
5.3.2 Drying time test
Results of set-to-touch, dry-to-touch and dry-hard time experiments for the MMC
samples are tabulated in Table 5.3. From Table 5.3, it is very clear that coatings based on
formulation of AlkOA28 macromer achieves the shortest drying time, followed by
AlkOA40 and AlkOA65. Copolymers with lower oleic acid content could dry faster
compared to the copolymers with the highest oleic acid content which take longer time to
dry. Copolymers with more oleic acid content have more side chains in the copolymer
structure and more side chains result in more soft segments in molecular structure and
hence slowing down the rate of drying time.
From Table 5.3, the changes in drying times of the coatings are not only dependent
on oleic acid content but also on MMA/macromer ratios. The set-to-touch, dry-to-touch and
dry-hard times decrease as the MMA/macromer ratio increases for all the three series of
copolymers. With increasing MMA ratio, as the solvent evaporates from the film, the
viscosity increases and free volume decreases and consequently lead to decrease in drying
time. On the other hand, one the effective factors in drying time is increase in molecular
weight, whereby shorter time is required to form the coherent film or to reach the drying
stage [144]. In addition, with increasing the average functionality, the concentration of

148
functional groups will be high, and a dried film will be formed in a shorter time [145], as
copolymers synthesized by using AlkOA28 macromer due to having higher functionality of
macromer compared to the rest of the macromers show faster drying. It is also important to
note that in all the three groups of coating samples in this study were dried by physical
drying without any need to be cured at high temperature or usage of drying agent.
Table 5.3 : Set-to-touch, Dry-to-touch and Dry-hard time observed for MMC samples (All unit of time in seconds)
Test Set-to-touch time Dry-to-touch time Dry-hard time
Sample Thickness
MMA/macromer 50 μm 100 μm 50 μm 100 μm 50 μm 100 μm
AL series prepared with AlkOA65 AL1 50/50 37 63 135 480 654 1050 AL2 65/35 30 50 92 114 210 550 AL3 80/20 28 38 65 81 200 503
AM series prepared with AlkOA40 AM1 50/50 30 40 120 128 450 590 AM2 65/35 27 35 60 106 200 482
AM3 80/20 22 26 54 78 188 420 AS series prepared with AlkOA28
AS1 50/50 23 37 81 78 150 302 AS2 65/35 20 32 37 72 141 300 AS3 80/20 17 28 34 70 135 292
5.3.3 Adhesion measurement of methacrylate copolymers (MMC)
Overall, a value of 3B and higher would be taken as acceptable adhesion in coatings
field. The results of adhesion tests for the MMC copolymers are displayed in Table 5.4. All
the samples exhibit fairly good adhesion performance on mild steel panel. One of the
effective factors of adhesion can be attributed to the presence of pendant hydroxyl groups
149
in the samples. Adhesion of coatings to the surface is promoted by developing hydrogen
bond interactions between groups on the resin molecules and oxide and hydroxide groups
on the surface of the steel [139]. In our system, samples with lower molecular weight and
higher amount of the oleic acid as a flexible side chain have shown also better adhesion of
coat with steel. Moreover, lower viscosity due to lower molecular weight could also result
in better penetration of the liquid into pores and crevices of the substrate [139].
Table 5.4 : Results of adhesion measurement, pencil hardness and water immersion tests on MMC samples
Test Adhesion test Pencil hardness Water resistance
Samples
Thickness
MMA/macromer
50 μm 100 μm 50 μm 100 μm 50 μm 100 μm
AL series prepared with AlkOA65 AL1 50/50 5B 5B 4B 6B 4 4
AL2 65/35 5B 5B HB HB 4 4
AL3 80/20 4B 4B H F 3 4
AM series prepared with AlkOA40 AM1 50/50 5B 4B H 2H 3 4
AM2 65/35 5B 4B 2H 3H 3 3
AM3 80/20 4B 4B 4H 3H 1 1
AL series prepared with AlkOA28 AS1 50/50 5B 4B 6H 6H 1 1
AS2 65/35 5B 4B 3H 3H 1 1
AS3 80/20 4B 3B 2H 2H 1 1
Note-Water resistance behaviour: 1, unaffected; 2, slightly whitening; 3, heavily whitening; 4, slightly shrinkage; 5, film soften; 6, film lift out
5.3.4 Pencil hardness test
The scratch hardness was estimated by pencil hardness test. The hardness was
expressed in term of the designation of the hardest pencil that failed to scratch the film.
150
Table 5.4 demonstrates the results of pencil hardness tests on the samples. The results
reveal that the hardness of the film is improved as the oleic acid content of macromer
decreases. AS series shows resin like properties due to the existence of higher content of
rigid aromatic moiety (phenyl groups) in polymer chain and as expected it displays better
mechanical properties.
The variation MMA/macromer ratio also show significant contribution on the
hardness of coatings as MMA/macromer ratio increases hardness also increases. The
macromer portion comprise of the soft segment with low Tg, while MMA portion comprise
the hard segments. Hard segments give the mechanical strength whereas soft segments give
high extensibility and resiliency. However, an exception occurs for the AS series where
increasing of the MMA/macromer ratio causes to the pencil hardness to decrease. This
exception may be due to the fact that increasing in PA and MMA up to a certain limit may
lead to increase in the brittleness of the film which in turn decreases the hardness of film.
This variation in hardness and flexibility can be proved by DMA results. From Table 4.7 in
Chapter 4, it is found that the loss modulus in the AS series increases with increasing MMA
content. Overall, it can be concluded that flexibility of the AS1 is much more than AS2
followed by AS3. AS1 and AM3 exhibited the best scratch hardness compared to the rest of
samples. It is also found that increment of the thickness of the coatings has not affected
much on the hardness of the coatings.
5.3.5 Water resistance
The results of water resistance of the coated films are shown in Table 5.4. The water
resistance improves with coatings having lower content of oleic acid in macromer
composition and higher MMA percentage in copolymer composition.
151
From the results, AS series is unaffected by immersion in water for 18 h. As for AM
series and AL series, water immersion cause whitening of films and slight shrinkage.
Referring to the Chapter 3, Section (3.3), AlkOA28 comprises higher percentage of PA
whereby, this aromatic moieties should theoretically provide lower rate of molecular
permeability, resulting in better hydrolytic stability [146]. A few of the coated samples with
thickness 100 μm show lower resistance to water immersion test.
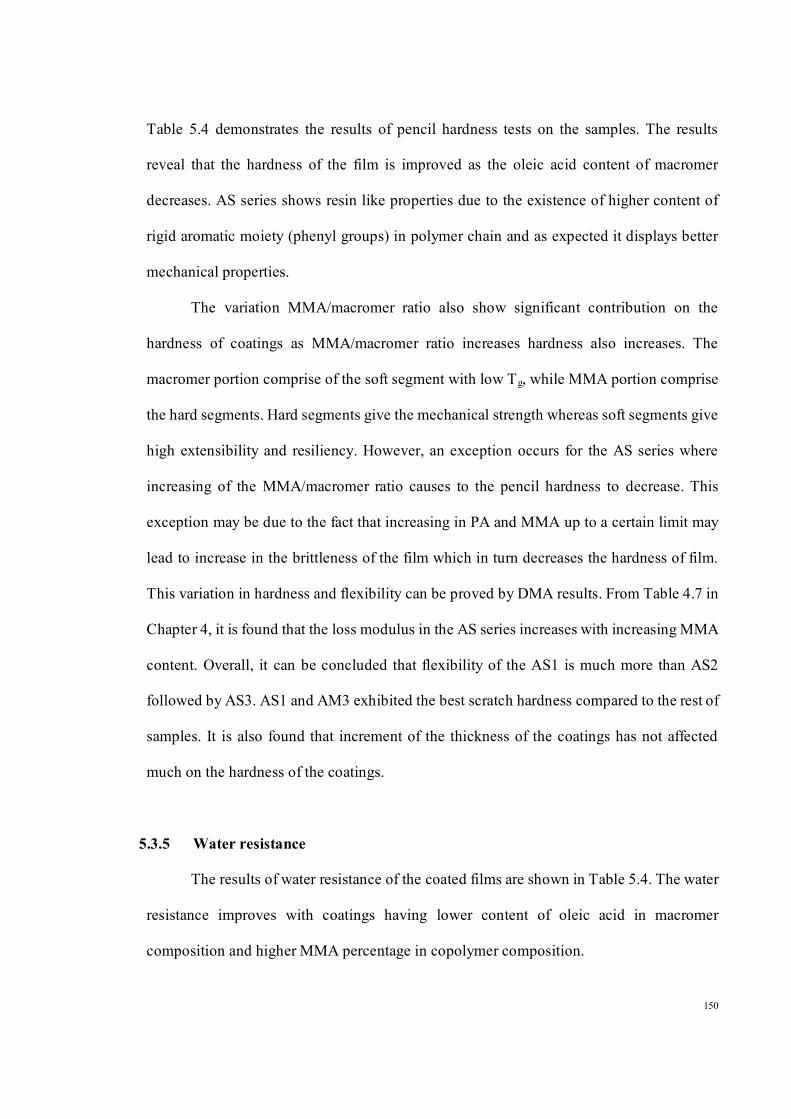
Figure 5.2 illustrates coated panels of AS1 sample after one hour and one year exposure in
the open lab. bench (under hot and humid conditions).
Figure 5.2 : Coating performance: Coated panels of AS1 sample after one hour (a), after one year exposure in the open lab. bench (under hot and humid conditions) (b)
5.3.6 Acid, alkali and salt resistances
The results shown in Table 5.5 are based on the effect of acid, alkali and salt
solutions on the coatings. The represented results indicate that the coatings have good
resistance against acid solution and amount of oleic acid and also ratios of MMA/macromer
not show any variation on the acid resistance.

152
Moreover, the results reveal that higher content of MMA monomer improves alkali
resistance and also the films deteriorate to some extent when more macromer content was
used. Films with thinner thickness show better results. Overall, AS series of copolymers
shows better results for alkali resistance.
Hydrolysis of ester bonds in polyester resins is very common under basic conditions
[146, 147]. The parameters affecting onto the hydrolysis resistance of ester bonds was
studied by Turpin [54]. He expressed that steric hindrance plays important roles in
hydrolysis reaction. According to his study as long alkyl substitution as possible at the
alpha and beta carbons on either side of the ester group improves hydrolysis resistance.
Thus copolymerization of the macromer with MMA has increased the resistance to alkaline
hydrolysis presumably the methyl groups on C=C in MMA units stabilize the ester groups
toward hydrolysis due to steric hindrance and hydrophobicity of methyl group moiety. For
this reason the methacrylate esters are more resistance to chemical attack than the acrylate
ester resin [148, 149]. Moreover the ester groups of the alkyd are along the main chains,
while those on PMMA are as side chains. Thus hydrolysis of the ester groups along the
main chain would lead to chain scissions, causing the polymer films to loss their
mechanical strength. The hydrolysis of ester groups along the side chains in PMMA would
not lead to deterioration of the polymer films. These several reasons account for the
chemical resistance of this kind of polymer.
In addition, it has been found that salt resistance of samples are excellent compared
to acid and alkali resistances. It can be therefore concluded that salt does not have effect on
the films. In fact strong adhesion may also prevents ions passing through the coating [150].
From these experiments it can be concluded that macromer composition and also
MMA/macromer ratios do not demonstrate any effect on deterioration of the films.

153
Table 5.5 : The results of acid, alkali and salt resistance for three series MMC samples
Test 0.1 M HCl 0.1 M NaOH 5% NaCl
Samples Thickness
Macromer/MMA
50 μm 100 μm 50 μm 100 μm 50 μm 100 μm
AL copolymer series prepared with AlkOA65 AL1 50/50 2 3 6 6 1 1
AL2 65/35 2 3 6 6 1 1
AL3 80/20 2 3 3 3 1 1
AM copolymer series prepared with AlkOA40 AM1 50/50 2 3 6 6 1 1
AM2 65/35 2 3 6 6 1 1
AM3 80/20 2 3 2 2 1 1
AS copolymer series prepared with AlkOA28 AS1 50/50 2 3 3 3 1 1
AS2 65/35 2 3 2 2 1 1
AS3 80/20 2 2 2 2 1 1
Note-Chemical resistance behaviour: 1, unaffected; 2, slightly whitening; 3, heavily whitening; 4, slightly shrinkage; 5, film soften; 6, film lift out
5.3.7 Solvent rub test
Table 5.6 displays the results of solvent rub tests. By increasing the oleic acid
content in the macromer compositions, films show more resistance to acetone while
decreasing the oleic acid content in macromer composition and increasing MMA in
copolymer composition causes to increment of resistance to ethyl acetate.
Generally, solvent resistance depends primarily on polarity of polymer and solvent,
and polymers containing sites for hydrogen bonding are most affected by polar solvent.
Dielectric constant (as criterion for polarity) for acetone, methyl ethyl ketone and ethyl
acetate are 20.6, 18.5 and 6.02 respectively. Non polar polymers show solvent resistance to
acetone and other polar solvents and polymers containing sites for hydrogen bonding are

154
most affected by polar solvent. The molecular weight and crosslink density of polymer
networks are also directly related to its resistance to solvent attack. Crosslinking is the
ultimate structural factor in preventing a polymer from dissolving in a solvent, although
this cannot eliminate the effects of polarity and hydrogen bonding [150]. In this respect, it
was found that the most of the copolymers have poor solvent resistance due to the abundant
polar ester groups in their structures. AL1 and AM1 showed good resistance to acetone and
only lost gloss, which may be due to the existence of higher percentage of oleic acid as a
non polar moiety in copolymer structures.
Table 5.6 : Results of solvent rub tests on MMC samples
Test Acetone Methyl ethyl Ketone Ethyl acetate Samples
Thickness
MMA/macromer
50 μm 100 μm 50 μm 100 μm 50 μm 100 μm
AL series prepared with AlkOA65 AL1 50/50 L.G L.G L.G L.G R R
AL2 65/35 S.R L.G
S.R L.G
S.R L.G
S.R L.G
S.R L.G
S.R L.G
AL3 80/20 S.R L.G
S.R L.G
S.R L.G
S.R L.G L.G L.G
AM series prepared with AlkOA40
AM1 50/50 L.G L.G S.R L.G
S.R L.G
S.R L.G
S.R L.G
AM2 65/35 S.R L.G
S.R L.G
S.R L.G
S.R L.G
S.R L.G
S.R L.G
AM3 80/20 S.R L.G
S.R L.G
S.R L.G
S.R L.G L.G L.G
AS series prepared with AlkOA28
AS1 50/50 S.R L.G
S.R L.G
S.R L.G
S.R L.G
S.R L.G
S.R L.G
AS2 65/35 S.R L.G
S.R L.G
S.R L.G
S.R L.G
S.R L.G
S.R L.G
AS3 80/20 S.R L.G
S.R L.G
S.R L.G
S.R L.G L.G L.G
Note- S.R and L.G refer to Slight Removal of the films and Loss of Gloss respectively, P refers to the Pass and R remove

155
5.4 Effect of butyl acrylate monomer on coatings properties of MMBC samples
The BA monomer (10 wt.%) was used to improve coatings properties of copolymer
samples. It should be noted that ASB series were synthesized using two different
percentages of BA i.e. 5 wt.% and 10 wt.% of BA. All coated panels were prepared 2
weeks prior to performing the coating tests on the coated panels under room temperature.
5.4.1 Coatings appearance
The appearance of films did not show much difference compared to the MMC
samples, i.e. most of the coated panels were shiny and colorless.
5.4.2 Solid content of MMBC samples
The solid content of samples is calculated using equation [2.7] in Section (2.6) and
is presented in Table 5.7. The result shows the same trend as that obtained by unmodified
the copolymer samples (MMC), but with higher solid contents. Increasing of the amount of
BA monomer, the solid content also increases.
Table 5.7 : Solid content of the copolymers containing BA, MMBC samples
5.4.3 Drying times of MMBC samples
The results of drying times, including set-to-touch, dry-to-touch and dry-hard time,
are tabulated in Table 5.8. In these series of experiments, all of the samples took longer
time for drying compared to the MMC samples.
Sample AL1B AL2B AL3B AM1B AM2B AM3B AS1B (5%)
AS2B (5%)
AS3B (5%)
AS1B (10%)
AS2B (10%)
AS3B (10%)
Solid Content(%) 13.3 21.6 30.0 15.3 22.0 29.5 21.5 30.3 31.1 22.9 31.7 32.6

156
By introducing a small percentage of the BA monomer, more side chains due to existence
of butoxy groups and consequently more soft segments will be present in copolymer
structure and hence slowing down the rate of drying time. The trends of the drying times
between the all samples are the same with the MMC samples which discussed in Section
(5.3.2).
Table 5.8 : Set-to-touch, Dry-to-touch and Dry-hard time observed for MMBC samples (All unit of time is seconds)
Test Set-to-touch time Dry-to-touch time Dry-hard time
Sample Thickness
MMA/macromer
50 μm 100 μm 50 μm 100 μm 50 μm 100 μm
ALB series prepared with AlkOA65 AL1B 50/50 After one week, samples were sticky and undried
AL2B 65/35 70 90 130 220 1600 2910
AL3B 80/20 40 48 95 110 800 2700
AMB series prepared with AlkOA40 AM1B 50/50 55 82 220 268 1240 2605
AM2B 65/35 45 69 117 210 990 2420
AM3B 80/20 37 40 90 100 520 2160
ASB(10%) series using (10 wt.%) BA monomer with AlkOA28 AS1B(10%) 50/50 47 60 175 240 1200 2450
AS2B(10%) 65/35 40 50 120 200 730 2400
AS3B(10%) 80/20 35 50 75 90 600 1100
ASB(5%) series using (5 wt.%) BA monomer with AlkOA28 AS1B(5%) 50/50 42 50 160 200 730 910
AS2B(5%) 65/35 38 45 120 185 550 750
AS3B(5%) 80/20 30 42 60 75 420 630
5.4.4 Adhesion measurement of MMBC samples
The results of adhesion properties of MMBC samples are shown in Table 5.9.
Comparing the results from this table with those of Table 5.4, it can be concluded that

157
adhesion property of MMBC samples improves with introduction of BA monomer because
the side chains of BA monomer can increase flexibility of sample and subsequently
increment of adhesive characteristic.
However, exception occurs for ALB series where using BA monomer results in
decrement of adhesion properties. This exception may be due to the fact that BA monomer
introduces soft segments from its butoxy groups. Also the oleic acid, as another kind of soft
segment in AlkOA65, is higher in this series.
Table 5.9 : Results of adhesion measurement, pencil hardness and water resistance tests for MMBC samples
Test Adhesion test Pencil hardness Water resistance
Samples Thickness MMA/macromer
50 μm 100 μm 50 μm 100 μm 50 μm 100 μm
ALB series prepared with AlkOA65 AL1B 50/50 1B 1B 6B 6B 3 3
AL2B 65/35 2B 2B 2B 2B 2 3
AL3B 80/20 2B 2B F HB 2 2
AMB series prepared with AlkOA40 AM1B 50/50 5B 5B 3H 2H 3 3
AM2B 65/35 5B 5B 3H 3H 1 1
AM3B 80/20 5B 5B 5H 4H 1 1
ASB series using (10 wt.%) BA monomer with AlkOA28 AS1B(10%) 50/50 5B 5B 6H 6H 1 2
AS2B(10%) 65/35 5B 5B 6H 4H 1 1
AS3B(10%) 80/20 5B 5B 6H 4H 1 1
ASB series using (5 wt.%) BA monomer with AlkOA28 AS1B(5%) 50/50 5B 5B 6H 6H 1 2
AS2B(5%) 65/35 5B 5B 6H 5H 1 1
AS3B(5%) 80/20 5B 5B 5H 5H 1 1
Note-Water resistance behaviour: 1, unaffected; 2, slightly whitening; 3, heavily whitening; 4, slightly shrinkage; 5, film soften; 6, film lift out
158
Therefore, a much higher percentage of soft segments are presented, which in turn
decreases the adhesion of film as a result of formation of very soft films. It is also noted
that with increasing the MMA content in ALB series, adhesion increases due to decrement
of soft segments of oleic acid in copolymer composition.
5.4.5 Pencil hardness test for MMBC samples
The scratch hardness of MMBC samples are shown in Table 5.9. The ASB and
AMB series of samples exhibited better results in pencil hardness. As has been discussed in
Chapter 4, Section (4.5.1), the MMA content in the copolymers formulation plays an
important role in the brittleness of copolymer synthesized due to the existence of the methyl
group in the MMA moiety. Thus more MMA used in the copolymer formulation results in
less flexibility. As mentioned before by introducing BA monomer, flexible side groups and
subsequently extensibility and resiliency increase. Understanding of this proposition will be
much clearer by comparing the results obtained in the ASB(10%) series and ASB(5%)
series with AS series and also in the AMB series with AM series. For the ALB series, the
BA monomer causes decrement in pencil hardness, as noted in section (5.4.4). This
exception may be due to the existence of soft segments of the butyl groups and oleate
branches in AlkOA65 structure.
5.4.6 Water resistance for MMBC samples
The MMBC samples were tested for water resistance and the results are shown in
Table 5.9. From the results, the water resistances of some of the samples improve to some
extent. These results may be due to the presence of the butyl group as non polar group,
which decreases the permeability of water molecules into the copolymer structure.
159
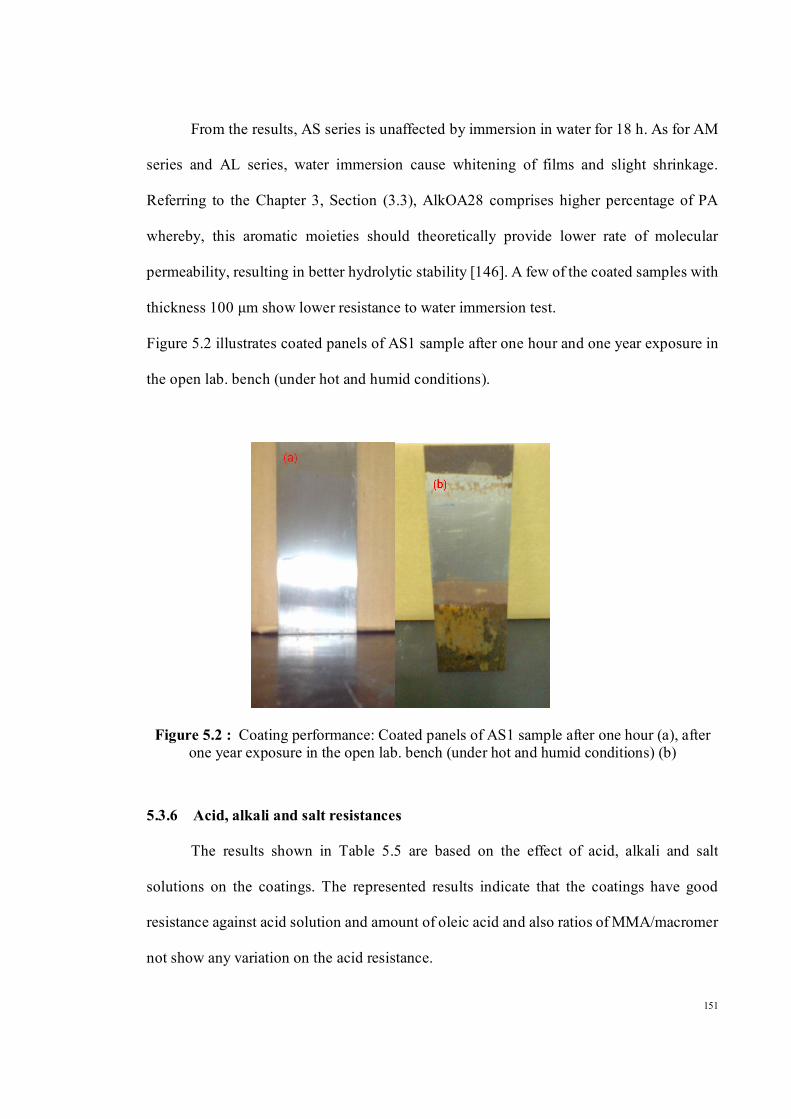
Figure 5.3 shows coated panel of AS3B(5%) sample after 8 months under hot and humid
conditions.
Figure 5.3 : Coated panel of AS3B(5%) sample after 8 months exposure in the open lab. bench (under hot and humid conditions)
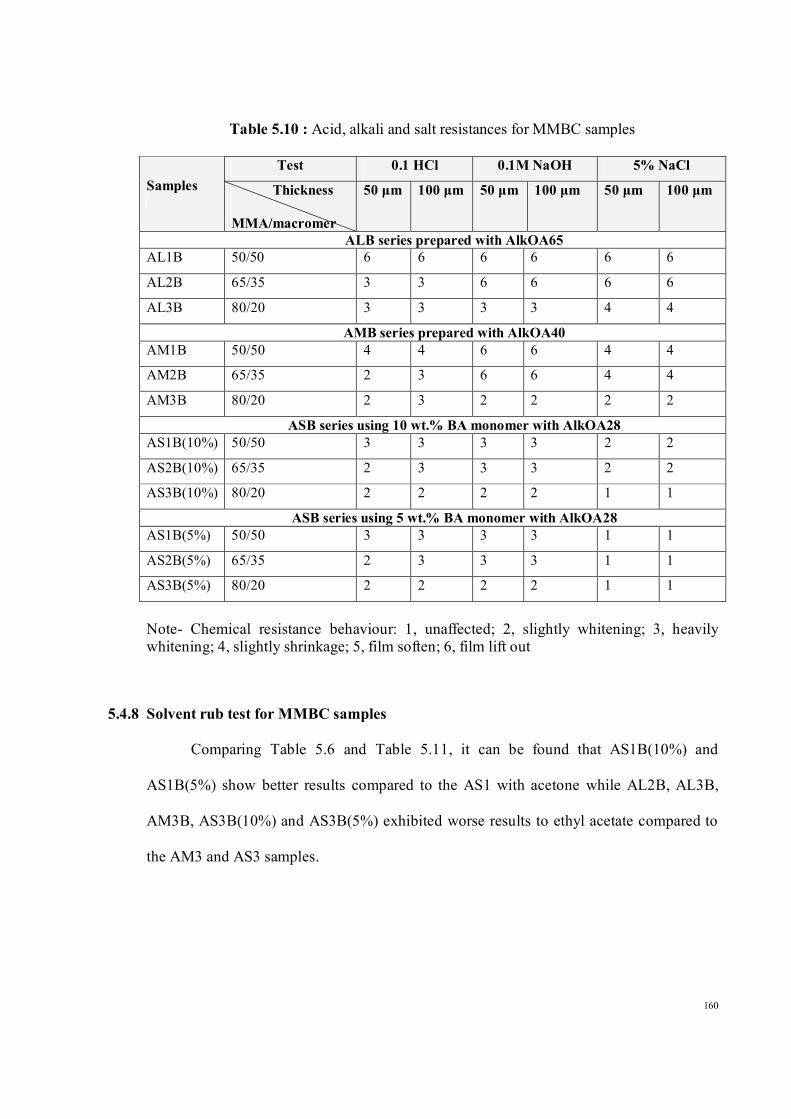
5.4.7 Acid, alkali and salt resistances for MMBC samples
The results of the acid, alkali and salt resistance tests carried out on MMBC samples
are presented in Table 5.10. The results show that introducing BA monomer has negative
effect on the samples and this effect worsens when the copolymers contain the higher
amount of macromer. The presence of flexible side chains in both macromer and BA
monomer structures results in more side chains, and more softness, thus less resistance to
acid.
It is also observed that, using BA monomer show not much effect on alkali
resistance and seems to cause the samples to deteriorate in salt solution. This deterioration
becomes worst when the film composition of the coatings has higher percentage of
macromer. The butoxy chains, as soft segments, allow ions to pass through the coating.
However, with incorporation of 5% BA in AS3B(5%) sample, salt resistance and alkali
resistance remained unchanged compared to the AS3 sample.
160
Table 5.10 : Acid, alkali and salt resistances for MMBC samples
Test 0.1 HCl 0.1M NaOH 5% NaCl Samples
Thickness MMA/macromer
50 μm 100 μm 50 μm 100 μm 50 μm 100 μm
ALB series prepared with AlkOA65 AL1B 50/50 6 6 6 6 6 6
AL2B 65/35 3 3 6 6 6 6
AL3B 80/20 3 3 3 3 4 4
AMB series prepared with AlkOA40 AM1B 50/50 4 4 6 6 4 4
AM2B 65/35 2 3 6 6 4 4
AM3B 80/20 2 3 2 2 2 2
ASB series using 10 wt.% BA monomer with AlkOA28 AS1B(10%) 50/50 3 3 3 3 2 2
AS2B(10%) 65/35 2 3 3 3 2 2
AS3B(10%) 80/20 2 2 2 2 1 1
ASB series using 5 wt.% BA monomer with AlkOA28 AS1B(5%) 50/50 3 3 3 3 1 1
AS2B(5%) 65/35 2 3 3 3 1 1
AS3B(5%) 80/20 2 2 2 2 1 1
Note- Chemical resistance behaviour: 1, unaffected; 2, slightly whitening; 3, heavily whitening; 4, slightly shrinkage; 5, film soften; 6, film lift out
5.4.8 Solvent rub test for MMBC samples
Comparing Table 5.6 and Table 5.11, it can be found that AS1B(10%) and
AS1B(5%) show better results compared to the AS1 with acetone while AL2B, AL3B,
AM3B, AS3B(10%) and AS3B(5%) exhibited worse results to ethyl acetate compared to
the AM3 and AS3 samples.

161
Table 5.11 : Results of solvent resistance test on copolymers coatings (MMBC)
Test Acetone Methyl ethyl Ketone Ethyl acetate Samples
Thickness
MMA/macromer
50 μm 100 μm 50 μm 100 μm 50 μm 100 μm
ALB series prepared with AlkOA65 AL1B 50/50 L.G L.G L.G L.G R R
AL2B 65/35 S.R L.G
S.R L.G
S.R L.G
S.R L.G R R
AL3B 80/20 S.R L.G
S.R L.G
S.R L.G
S.R L.G
S.R L.G
S.R L.G
AMB series prepared with AlkOA40
AM1B 50/50 L.G L.G S.R L.G
S.R L.G
S.R L.G
S.R L.G
AM2B 65/35 S.R L.G
S.R L.G
S.R L.G
S.R L.G
S.R L.G
S.R L.G
AM3B 80/20 S.R L.G
S.R L.G
S.R L.G
S.R L.G
S.R L.G
S.R L.G
ASB (10 wt.%) series prepared with AlkOA28
AS1B(10%) 50/50 L.G L.G S.R L.G
S.R L.G
S.R L.G
S.R L.G
AS2B(10%) 65/35 S.R L.G
S.R L.G
S.R L.G
S.R L.G
S.R L.G
S.R L.G
AS3B(10%) 80/20 S.R L.G
S.R L.G
S.R L.G
S.R L.G
S.R L.G
S.R L.G
ASB(5 wt.%) series prepared with AlkOA28
AS1B(5%) 50/50 L.G L.G S.R L.G
S.R L.G
S.R L.G
S.R L.G
AS2B(5%) 65/35 S.R L.G
S.R L.G
S.R L.G
S.R L.G
S.R L.G
S.R L.G
AS3B(5%) 80/20 S.R L.G
S.R L.G
S.R L.G
S.R L.G
S.R L.G
S.R L.G
Note- S.R and L.G refer to Slight Removal of the films and Loss of Gloss respectively, P refers to the Pass and R remove
This is probably due to the presence of oleic acid in macromer structure and
existence of butoxy chain in BA monomer as non polar moieties and consequently low
intermolecular instructions with polar solvents and higher intermolecular instructions with
non polar solvents.
162
5.5 Summary
The study on physico-mechanical properties and chemical resistance of palm oleic
acid-based coatings materials demonstrated many interesting properties of the films.
Overall, the physico-mechanical and chemical resistance of the coatings were improved
with increment of the MMA content. The AS samples exhibited far superior coating
properties followed by AM and finally the AL series. Another factor that can contribute to
the superior coating properties is use lower percentage of oleic acid in macromer
formulation.
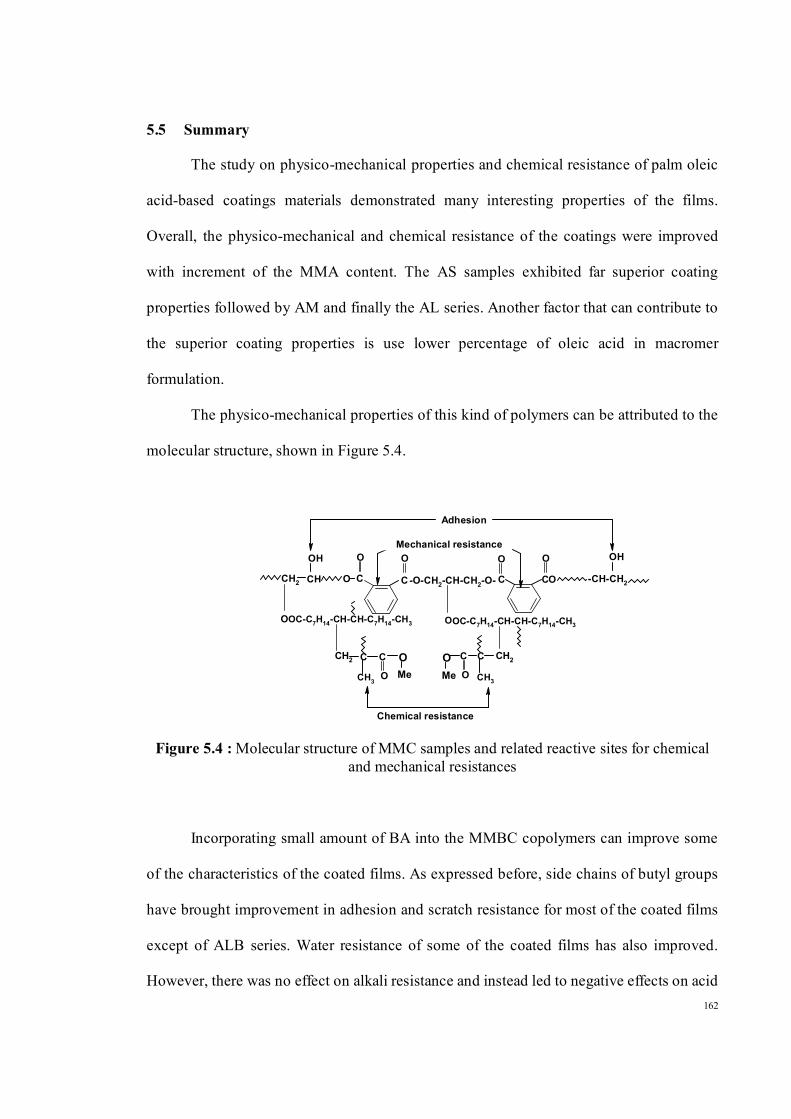
The physico-mechanical properties of this kind of polymers can be attributed to the
molecular structure, shown in Figure 5.4.
OC-C7H14-CH-CH-C7H14-CH3
-CH-CH2
O
-O-CH2-CH-CH2-O- C
O
C
O
C
O
O
OH
CHCH2
OC-C7H14-CH-CH-C7H14-CH3O
CH2
OH
C
O
O
O OO
C C CH2
O
CC
CH3 CH3Me
Mechanical resistance
Adhesion
Chemical resistance
Me
Figure 5.4 : Molecular structure of MMC samples and related reactive sites for chemical and mechanical resistances
Incorporating small amount of BA into the MMBC copolymers can improve some
of the characteristics of the coated films. As expressed before, side chains of butyl groups
have brought improvement in adhesion and scratch resistance for most of the coated films
except of ALB series. Water resistance of some of the coated films has also improved.
However, there was no effect on alkali resistance and instead led to negative effects on acid

163
and salt resistances, and longer drying times. It was found that the incorporation of 5% w/w
of BA into AS2 and AS3 copolymers led to significant improvement as coatings materials.


![Static and Dynamic Density Functional Theory and ...called copolymers. Here we consider the class of copolymers called \block copolymers" [7] while there are many kinds of copolymers](https://img.dokumen.tips/doc/110x75/5eccfbf97d791301bb64d299/static-and-dynamic-density-functional-theory-and-called-copolymers-here-we.jpg)