Embed Size (px)
Citation preview
210
5. Aquatic Ecology of the Little Swanport Catchment
5.1 Fish
Seven native fish species and three introduced species have been either recorded or sighted
from various locations in the Little Swanport catchment. Six of the seven native fish species
are migratory and require free passage between rivers and the sea in order to complete their
life cycles. The distribution patterns for native and introduced fish species caught during the
electrofishing surveys are presented in Figures 129 and 130 respectively. The raw data is
presented in Table 32.
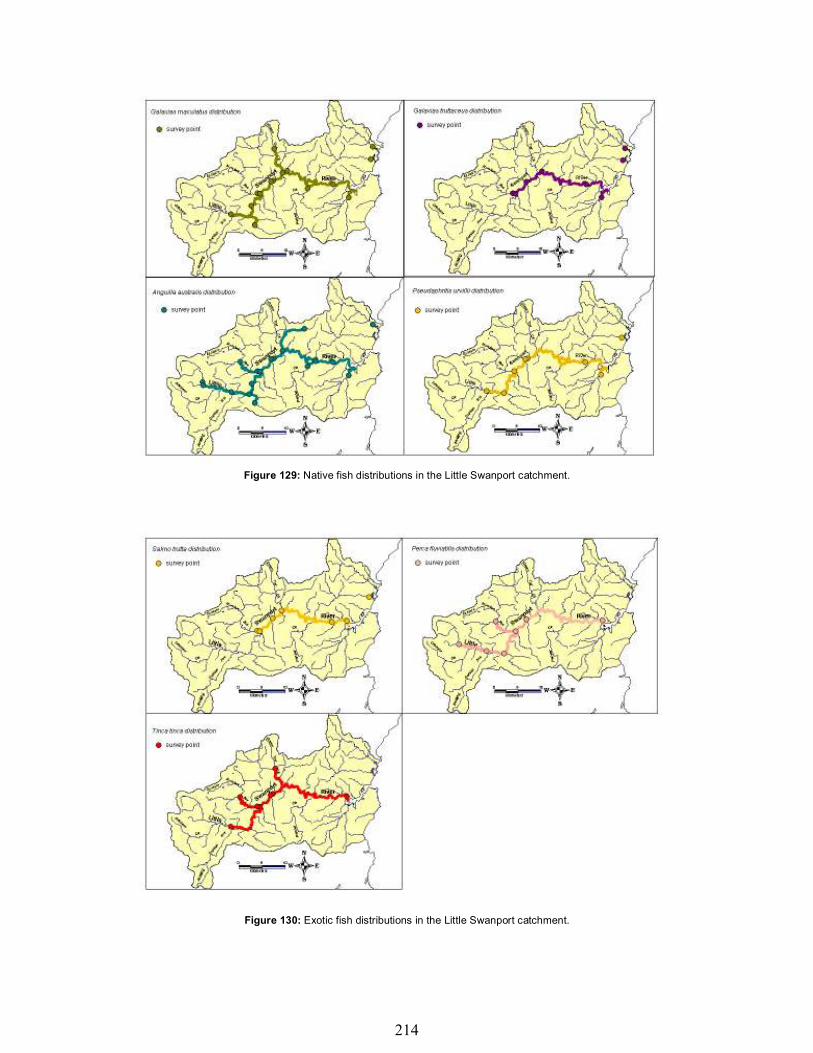
The distribution maps show the known locations of each species, marked by the circle, and
potential range based on these records. Population densities and range within any given range
are likely to reflect a combination of the individual species habitat requirements and
availability of preferred habitat, stage in migratory travel and a known decrease in native fish
species diversity in an upstream direction (Davies, 1989). It is important to remember that this
distribution reflects sites sampled by DPIW, and there are many areas (eg. tributaries in the
lower catchment) that haven’t been sampled but are likely to have fish in them. Distribution
maps have not been produced for species with only one record.
5.1.1 Native fish species
Short finned eel (Anguilla australis)
The short finned eel Anguilla australis is widespread in coastal and lowland rivers in
Tasmania (McDowall, 1996). DPIW electrofishing surveys indicate that A. australis is
widespread throughout the Little Swanport catchment. A. australis populations are common
throughout the Little Swanport mainstream and a number of major tributaries. This is likely
to reflect the occurrence of this species in a wide variety of lowland habitats. Specifically, A.
australis prefer to inhabit still waters in areas of slow silty habitat and this may account for
it’s extent in the upper reaches of the Little Swanport mainstream where this habitat type is
common.

211
Long finned eel (Anguilla reinhardtii)
The Long finned eel Anguilla reinhardtii is commonly distributed in coastal lowland rivers
along the northern and eastern coasts of Tasmania. It occurs less frequently in lakes and like
A. australis generally prefers still water habitats. This species was not sampled during the
DPIW surveys although a single record for this species exists at the old weir in the lower
catchment (Inland Fisheries Service survey – February 2002). This record in the lower
catchment and the lack of records for this particular species upstream in more comprehensive
catchment surveys by DPIW is consistent with general observations within the scientific
literature of decreasing abundance with increased distance away from the sea for this species
(Koehn and O’Connor, 1990). This is thought to relate to a general avoidance of lower
riverine temperatures and the availability of more suitable forage fish in estuarine and extreme
lower freshwater reaches (Koehn and O’Connor, 1990).
Common Jollytail (Galaxias maculatus)
The Common Jollytail Galaxias maculatus is widespread and common in Tasmanian
catchments and generally occurs in low elevation streams in Tasmania (McDowall, 1996).
The species can tolerate a wide range of habitat conditions and commonly occurs in still or
gently flowing streams and rivers, lakes and lagoon margins usually in small shoals (schools).
The species can also tolerate extremely high salinities. To date, electrofishing surveys in the
Little Swanport catchment suggests that G. maculatus populations are common within the
mainstream with the exception of the uppermost reaches and are also found in a number of
major tributaries (Green Tier Creek, Pages Rivulet and Eastern Marshes Rivulet). The
widespread distribution of this species throughout most of the catchment reflects wide
tolerances of this species and preference for a wide variety of in-stream habitats.
Spotted Galaxias (Galaxias truttaceus)
The spotted Galaxias Galaxias truttaceus is similar to the common jollytail in that both
species have a marine juvenile stage and a diadromous life cycle (McDowall & Fulton, 1996).
Spotted galaxiids have more defined and specific habitat preferences than G. maculatus and
prefer to inhabit quieter stream areas with riverine populations preferring lower elevation,
slower flowing streams where they are found in pools with abundant cover from log debris,
overhanging banks and boulders. The preliminary fish surveys support this distributional
pattern with all G. truttaceus found in the lower reaches of the catchment in habitats that
contain good in-stream cover and riparian vegetation.
212
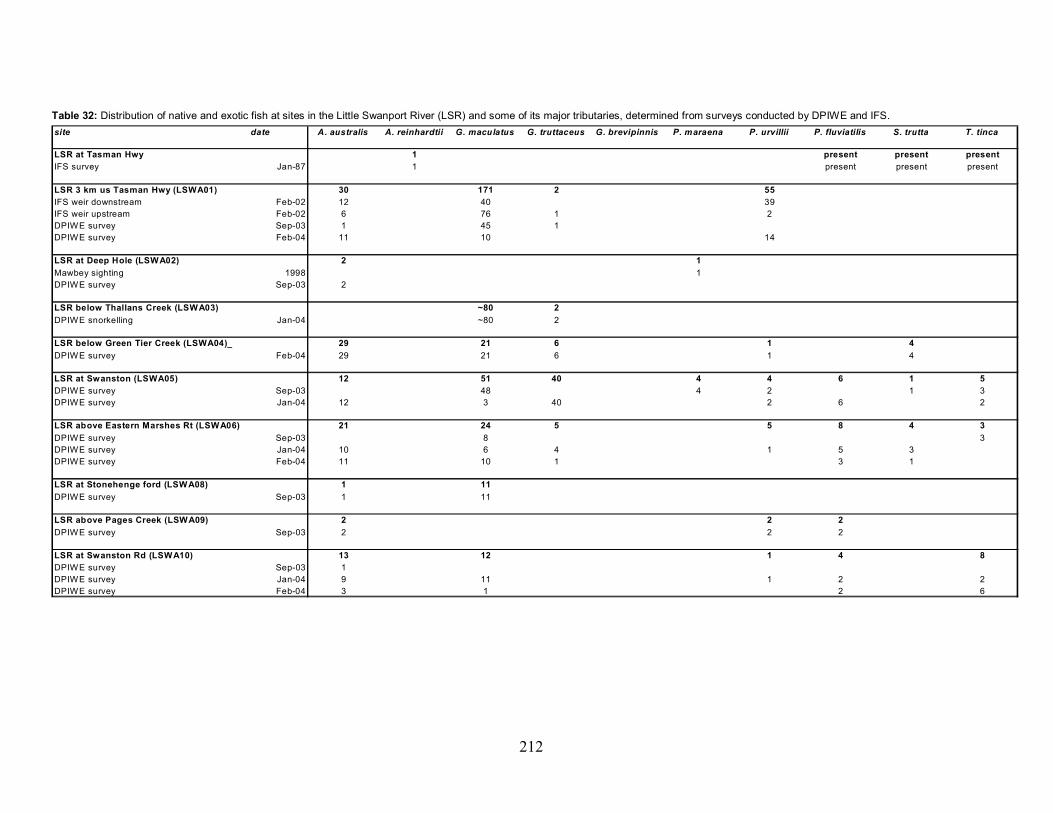
Table 32: Distribution of native and exotic fish at sites in the Little Swanport River (LSR) and some of its major tributaries, determined from surveys conducted by DPIWE and IFS.
site date A. australis A. reinhardtii G. maculatus G. truttaceus G. brevipinnis P. maraena P. urvillii P. fluviatilis S. trutta T. tinca
LSR at Tasman Hwy 1 present present present
IFS survey Jan-87 1 present present present
LSR 3 km us Tasman Hwy (LSWA01) 30 171 2 55
IFS weir downstream Feb-02 12 40 39
IFS weir upstream Feb-02 6 76 1 2
DPIWE survey Sep-03 1 45 1
DPIWE survey Feb-04 11 10 14
LSR at Deep Hole (LSWA02) 2 1
Mawbey sighting 1998 1
DPIWE survey Sep-03 2
LSR below Thallans Creek (LSWA03) ~80 2
DPIWE snorkelling Jan-04 ~80 2
LSR below Green Tier Creek (LSWA04)_ 29 21 6 1 4
DPIWE survey Feb-04 29 21 6 1 4
LSR at Swanston (LSWA05) 12 51 40 4 4 6 1 5
DPIWE survey Sep-03 48 4 2 1 3
DPIWE survey Jan-04 12 3 40 2 6 2
LSR above Eastern Marshes Rt (LSWA06) 21 24 5 5 8 4 3
DPIWE survey Sep-03 8 3
DPIWE survey Jan-04 10 6 4 1 5 3
DPIWE survey Feb-04 11 10 1 3 1
LSR at Stonehenge ford (LSWA08) 1 11
DPIWE survey Sep-03 1 11
LSR above Pages Creek (LSWA09) 2 2 2
DPIWE survey Sep-03 2 2 2
LSR at Swanston Rd (LSWA10) 13 12 1 4 8
DPIWE survey Sep-03 1
DPIWE survey Jan-04 9 11 1 2 2
DPIWE survey Feb-04 3 1 2 6

213
Freshwater Flathead (Pseudaphritis urvillii)
Freshwater flathead are abundant in coastal streams around the state and although they are
primarily a marine species, they can be found in both fresh and salt waters and can move
considerable distances upstream as was evident from DPIW surveys. Their preferred
freshwater habitat is usually slow flowing water around log snags, under overhanging banks
or among leaf litter. Juveniles are generally more abundant in the lower reaches of rivers
while larger individuals are more common upstream. Electrofishing surveys in the Little
Swanport catchment suggest that this species is restricted to the mainstream.
Swan Galaxias (Galaxias fontanus)
Swan galaxias are endemic to Tasmania and naturally occur only at a few localities in eastern
Tasmania (the headwaters of the Swan River upstream of Hardings Falls and tributaries of the
upper Macquarie River). In these localities, Swan galaxias live exclusively in freshwater with
no marine migratory stage in their lifecycle (Jackson, 2002). Their preferred habitat is in slow
to moderately fast-flowing rocky streams containing abundant shelter from within the stream
and from stream side vegetation. The Swan galaxias does not naturally occur within the Little
Swanport catchment however populations have been translocated into the upper reaches of
Rocka Rivulet and Green Tier Creek as part of a wider Inland Fisheries Service Recovery
Program for the species (Jackson, 2002).
Australian Grayling (Prototroctes maraena)
Australian grayling are native to Tasmania and southeast mainland Australia where in recent
years abundant but localised populations have been found (McDowall, 1996). In Tasmania
they are found in the middle and lower reaches of rivers and streams that open to the sea.
Much of their basic biology, including distribution and migratory behaviour, is unknown.
Spawning takes place in moderately flowing fresh water in late spring to early summer with a
large number of eggs laid on gravelly streambeds. The larvae are probably swept to sea and
return as whitebait after four to six months. This species has been sighted at one location in
the lower Little Swanport catchment (Deep Hole) and recorded at one location in Lisdillon
Rivulet (Table 32).
214
Figure 129: Native fish distributions in the Little Swanport catchment.
Figure 130: Exotic fish distributions in the Little Swanport catchment.
215
Pouched Lamprey (Geotria australis)
Pouched lamprey are native to Tasmania and south-east Australia. They require
waters with sand, gravel or pebble substrates for spawning. The larvae prefer slower
flowing water where they can burrow into mud, sand or silt. Adults are found in
faster flowing water on the sides of rivers with suitable burrowing habitat and shelter
that they tend to burrow into at night. This species has been identified from the old
weir in the lower catchment (Inland Fisheries Service survey – February 2002).
5.1.2 Introduced fish species
Tench (Tinca tinca)
Tench are tolerant to degraded conditions were they can establish large populations.
They are usually found in slow flowing or still freshwater habitats, often in weed and
deep sheltered holes. DPIW surveys have found tench from a number of sampling
spots in the mid to upper reaches of the Little Swanport mainstream and in Green Tier
Creek and Eastern Marshes Rivulet.
Redfin Perch (Perca fluviatilis)
Electrofishing surveys found redfin perch in the upper reaches of the Little Swanport
River. They occur predominantly in still and slow flowing waters, especially were
there is an abundance of aquatic vegetation. Redfin perch have the ability to out-
compete native fish, and in some cases seriously reduce or even eradicate populations.
As such they are recognised as a major threat to native fish populations.
Brown trout (Salmo trutta)
Brown trout commonly occur in cool, well-oxygenated waters, usually in streams
with moderate to swift flow. They frequently migrate upstream into small tributaries
or feeder streams with gravel beds. The upper tributaries and upper reaches of the
mainstream in the Little Swanport catchment generally have silty substrate types and
do not provide the preferred habitat type for this species. DPIW surveys reflect these
habitat preferences as brown trout populations were recorded in the middle and lower

216
reaches of the catchment where coarser substrates are more common. No trout were
caught in the upper catchment.
5.1.3 Summary
Surveys of fish species distributions in the Little Swanport catchment to date are
largely consistent with the current understanding of their general habitat requirements
in the scientific literature and known distributions in Tasmanian rivers. Within the
Little Swanport catchment, there is a general pattern of decreasing diversity in an
upstream direction consistent with Davies (1989) observations for Tasmanian
populations, and populations of individual species are largely found in their preferred
habitats. Populations of native fish are more common in the lower reaches and this
may relate to the availability of good in-stream cover and riparian vegetation, a
greater diversity of coarse substrate and meso-habitat (pools, riffles, runs) and the
proximity to the coast. In contrast the upper reaches are generally in a more degraded
state with little riparian vegetation, low habitat diversity and cover and silty
substrates. Exotic species (with the exception of brown trout) and native species with
wide habitat preferences and a tolerance for life in degraded habitat (e.g. eels) are
more common in these reaches.
5.2 Macroinvertebrates
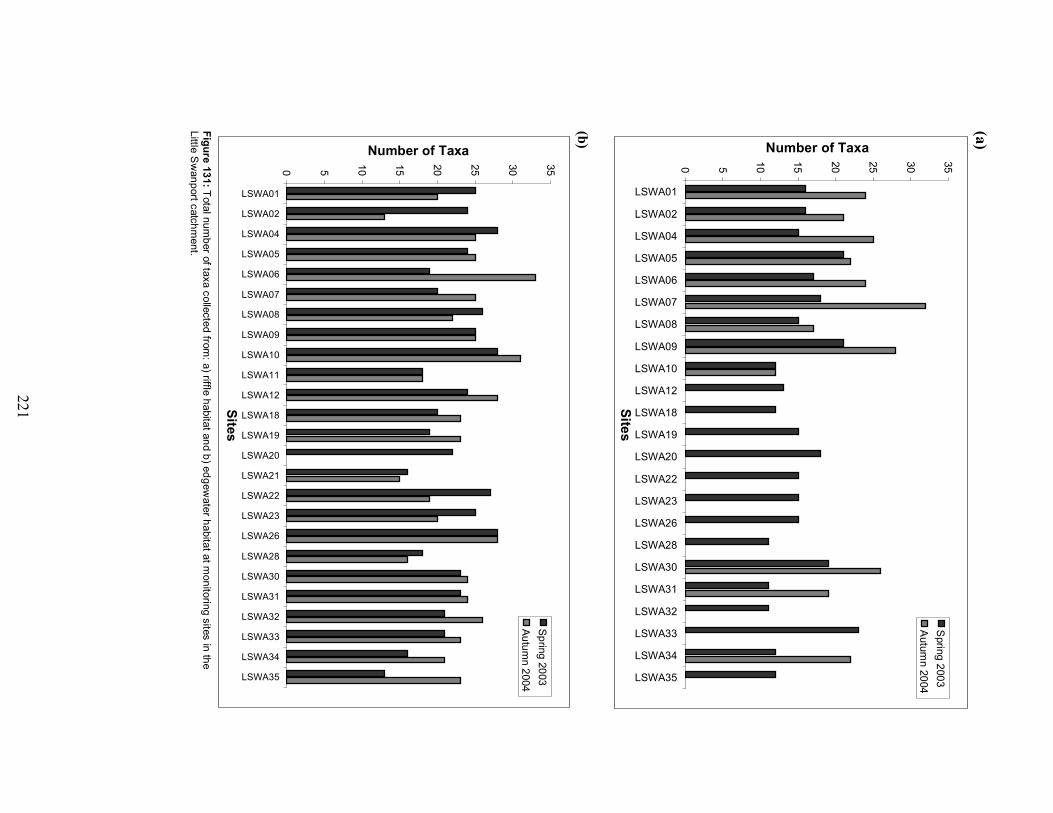
The complete faunal list is presented in Appendix 3. A total of 63 taxa were identified
from the riffle habitat and 78 taxa from the edgewater habitat. These taxa represent all
the major taxonomic groups typical of freshwater streams in Tasmania. Insects were
the most dominant group, representing around 70% of the total number of taxa
collected and the total number of individuals collected. The total taxon diversity for
each site for the riffle and edgewater habitats is presented in figures 131a & 131b
respectively. The distribution of macroinvertebrates reveals broad ecological patterns
that reflect changes in physical and chemical characteristics throughout the Little
Swanport catchment.
217
5.2.1 Riffle habitat
For the riffle habitat, in terms of overall taxon richness, the most diverse sites were
those located in the middle reaches of the Little Swanport River. Sites on Nutting
Garden Rivulet (LSWA30) and Ravensdale Rivulet also had rich macroinvertebrate
faunas with an average of 22.5 and 23 taxa collected at each site respectively although
Ravensdale Rivulet was only sampled in spring 2004 due to insufficient riffle habitat
in autumn 2004.
A sharp decline in macroinvertebrate diversity was observed at sites upstream of the
Pages Creek confluence with the Little Swanport River mainstream and in most of the
tributaries. Reduced taxon richness at these sites is consistent with intermittent flow at
these sites at the time of sampling and the associated loss of riffle habitat during drier
periods. The most depauperate sites were Crichton Creek (LSWA32) and the upper
reaches of Pages Creek (LSWA32) with only 11 taxa.
Many taxa are cosmopolitan, having been found at all or most sites. Such taxa include
Ceinidae (amphipods), Hydrobiidae (snails), Oligochaeta (worms), Simuliidae
(blackfly larvae), Orthocladiinae and Chironominae (midges) and Gripopterygidae
(stoneflies). Due to their wide distribution, prevalence and general tolerance to a
range of habitat and water quality conditions these taxa are not as useful as indicators
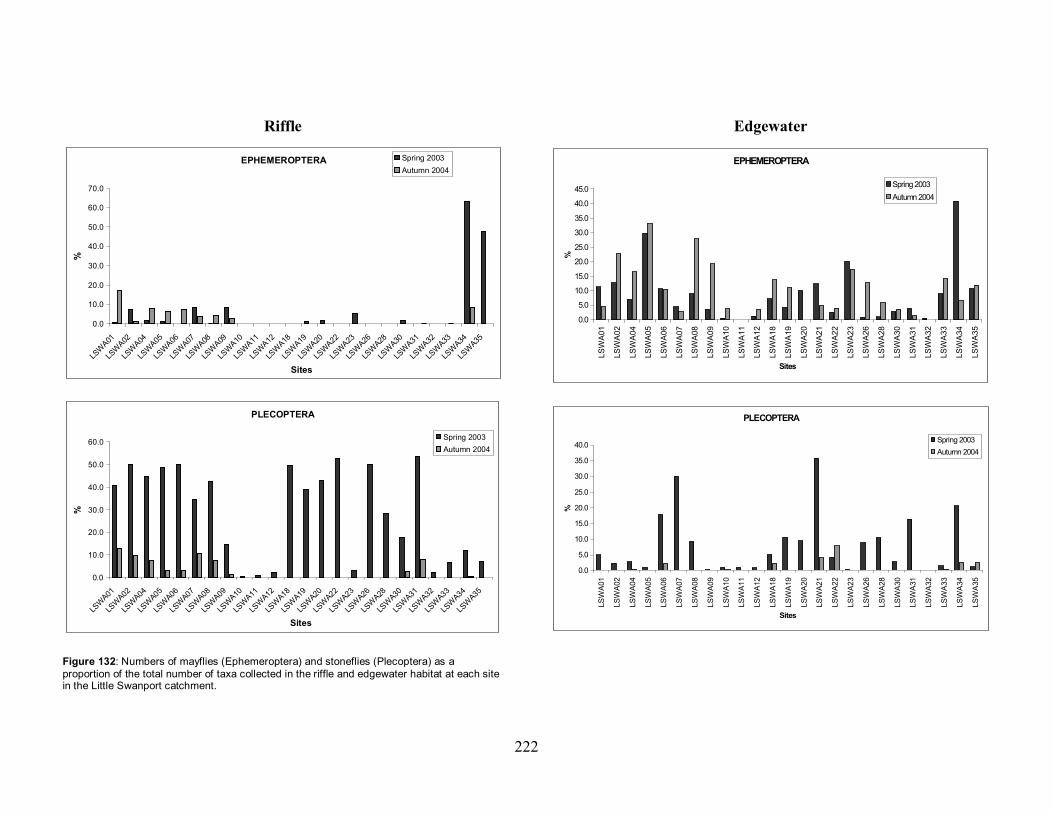
of river health as some of the less widespread and more sensitive taxa. Figures 132 to
135 present the percentage contribution of the major taxa to the total number of
individuals at each site. EPT (Ephemeroptera-mayflies, Plecoptera- stoneflies and
Trichoptera – caddisflies) taxa are generally considered to be intolerant to pollution
and habitat degradation and streams with high numbers of EPT taxa tend to have
greater biological integrity and health compared to streams with low EPT taxa
richness.
Taxon richness is an important measurement of stream biodiversity. Typically, as taxa
richness increases so does stream quality. EPT taxa are generally considered to be
intolerant to pollution and habitat degradation while bloodworms and aquatic worms
are highly tolerant of pollution and habitat degradation. Therefore, streams with high
numbers of EPT taxa and low numbers of bloodworms and aquatic worms tend to
218
have greater biological integrity and by inference, health compared to streams with
low EPT taxa richness and a high incidence of pollution tolerant taxa.
In spring 2003, EPT taxa dominated the lower and middle reaches of the Little
Swanport main channel as well as sites on Pepper Creek, Green Tier Creek Rocka
Rivulet, Eastern Marshes Rivulet, Pages Creek, Nutting Garden Rivulet, Lisdillon
Rivulet and the Buxton River accounting for 40-60% of the total number of
individuals at each site. However the high proportion of EPT taxa at many sites was
due to the high abundance of stoneflies (represented almost exclusively by the
stonefly family Gripopterygidae). Caddisflies were represented by only 1-2 families
and generally contributed to less than 5% of the total number of individuals (Figure
133). Similarly, mayflies were found in low numbers, accounting for less than 10%
of individuals except for sites sampled on Lisdillon Rivulet and Buxton River where
they comprised 64% and 47% respectively (Figure 132).
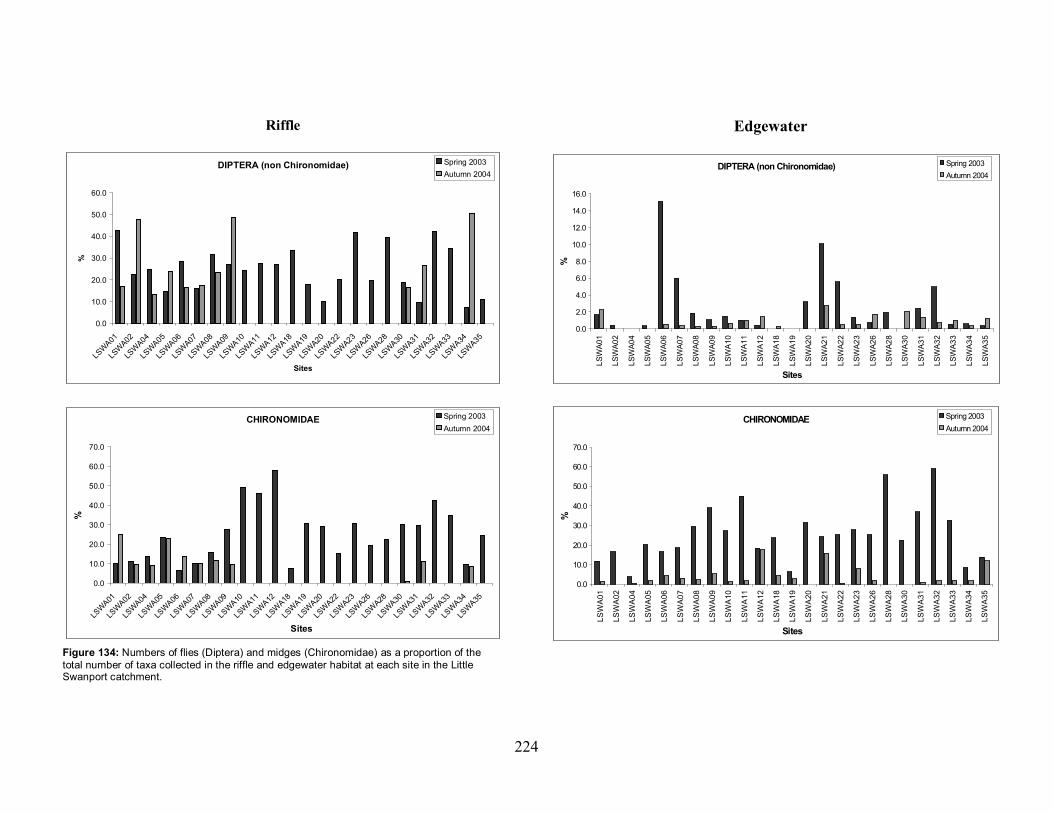
There was a sharp decline in the abundance of EPT taxa in the upper reaches of the
Little Swanport mainstream from 25% at the Little Swanport River upstream of the
Pages Creek confluence to 0.5-2% at sites between Swanston Road (LSWA10) and
the Inglewood Road Bridge (LSWA12). Other sites where low numbers of EPT taxa
were sampled included LSWA23, LSWA32 and LSWA33 (Figure 133). These sites
tended to be dominated by flies and chironomids which collectively accounted for 68
– 84% of the total number of individuals collected at these sites.
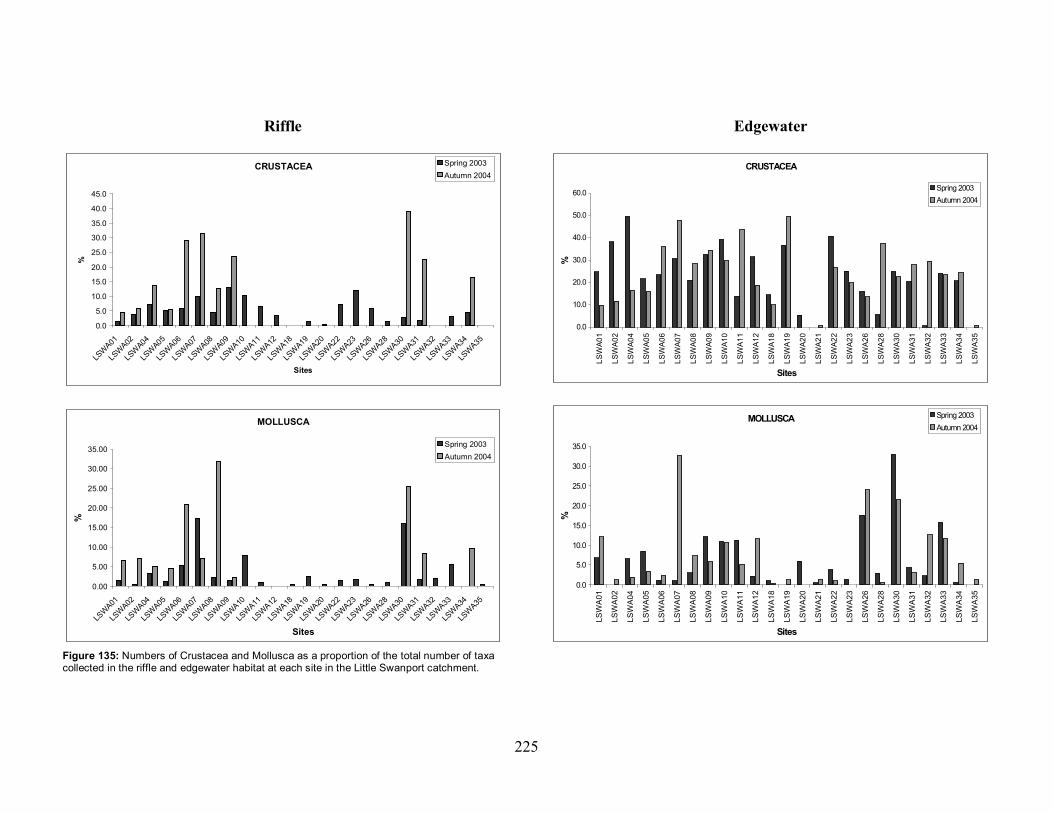
Crustaceans were present throughout Little Swanport River, reaching a peak
abundance of 13% at LSWA09. Significant numbers crustaceans were also collected
from Eastern Marshes Rivulet (LSWA22 and LSWA23) (Figure 135). Molluscs were
most abundant at sites LSWA07 (17%) and LSWA30 (16%) (Figure 135). The
principal members of this group were snails of the family Hydrobiidae.
Subsequent sampling of the Little Swanport catchment in autumn 2004 revealed a
significant change in macroinvertebrate community composition. Sites which were
sampled in both seasons had a significantly richer fauna in autumn 2004 than in
spring 2003 (Figure 131a). In many cases this was due to a significant increase in the
diversity and abundance of caddisflies collected from each site. The number of

219
caddisflies was found to be highest at LSWA05 where they represented over 20% of
the macroinvertebrates collected compared to 0.7% in the spring 2003 sample.
Conversely the abundance of stoneflies display a marked decrease from 40-60% in
spring 2003 to typically less than 10% in autumn 2004. Mayflies were found in
similar numbers as in spring 2003 except at LSWA34 and LSWA37 where their
abundance was reduced to 8% and 0% of total numbers. Collectively numbers of EPT
taxa fell to approximately half of those observed in spring 2003. At most sites there
was a corresponding in the proportion of crustaceans and molluscs.
5.2.2 Edgewater habitat
As with the riffle habitat, caddisflies were more abundant in the autumn than the
spring with the exception of Buxton River in which caddisflies accounted for more
than 70% of all macroinvertebrates collected in spring 2003. However this was almost
exclusively due to the high number of caddisflies of the family Leptoceridae. In the
Little Swanport River mainstream, caddisflies were most abundant in the lower
reaches (LSWA01 to LSWA04) contributing to approximately 50% of individuals
collected. Mayflies were found to comprise a much higher proportion of the
macroinvertebrate community in the edgewater habitat than in the riffle habitat,
particularly in some of the tributaries, where their numbers exceeded 20% of the total
sample. However with the exception of a few sites, this study found little difference in
the proportion of mayflies between the spring and autumn sampling seasons.
Stoneflies were dominant in far fewer sites than in the riffle habitat with only the
Little Swanport River at Pine Hill (LSWA07) and Rocka Rivulet (LSWA21) having
abundances exceeding 30%. As with the riffle habitat, stoneflies generally contributed
to less than 5% of individuals collected.
Collectively, EPT taxa dominated the lower reaches of the Little Swanport River,
particularly in autumn, accounting for almost 70% of all taxa. The proportion of EPT
taxa displayed a decreasing trend towards the upper part of the catchment, falling to
as little as 1% at McGills Marsh (LSWA11) in Spring 2003. Chironomids generally
displayed the opposite pattern, increasing from over 10% at LSWA01 to over 40% at
LSWA11. At all sites chironomids were more abundant in spring than in autumn.
220
With the exception of Green Tier Creek (LSWA20) and Rocka Rivulet (LSWA21),
crustaceans were collected in significant numbers in both spring and autumn. The
majority of crustaceans were of the families Ceinidae and Eusiridae (both
amphipods). Molluscs were most abundant at the Little Swanport River at Pine Hill
(LSWA07), Pages Creek (LSWA26) and Nutting Garden Rivulet (LSWA30) with
abundances raging from 20-30%. At other sites their abundance was generally less
than 10%.
221
(a)
0 5
10
15
20
25
30
35
LSWA01
LSWA02
LSWA04
LSWA05
LSWA06
LSWA07
LSWA08
LSWA09
LSWA10
LSWA12
LSWA18
LSWA19
LSWA20
LSWA22
LSWA23
LSWA26
LSWA28
LSWA30
LSWA31
LSWA32
LSWA33
LSWA34
LSWA35
Sites
Number of Taxa
Sprin
g 2
00
3
Autu
mn 2
004
(b)
0 5
10
15
20
25
30
35
LSWA01
LSWA02
LSWA04
LSWA05
LSWA06
LSWA07
LSWA08
LSWA09
LSWA10
LSWA11
LSWA12
LSWA18
LSWA19
LSWA20
LSWA21
LSWA22
LSWA23
LSWA26
LSWA28
LSWA30
LSWA31
LSWA32
LSWA33
LSWA34
LSWA35
Sites
Number of Taxa
Sp
ring
20
03
Au
tum
n 2
004
Figure 131: T
ota
l nu
mb
er o
f taxa c
olle
cte
d fro
m: a
) riffle h
abita
t an
d b
) ed
gew
ate
r habita
t at m
on
itorin
g s
ites in
the
Little
Sw
an
port c
atc
hm
ent.
222
Riffle
EPHEMEROPTERA
0.0
10.0
20.0
30.0
40.0
50.0
60.0
70.0
LSW
A01
LSW
A02
LSW
A04
LSW
A05
LSW
A06
LSW
A07
LSW
A08
LSW
A09
LSW
A10
LSW
A11
LSW
A12
LSW
A18
LSW
A19
LSW
A20
LSW
A22
LSW
A23
LSW
A26
LSW
A28
LSW
A30
LSW
A31
LSW
A32
LSW
A33
LSW
A34
LSW
A35
Sites
%
Spring 2003
Autumn 2004
PLECOPTERA
0.0
10.0
20.0
30.0
40.0
50.0
60.0
LSW
A01LS
WA02
LSW
A04LS
WA05
LSW
A06LS
WA07
LSW
A08LS
WA09
LSW
A10LS
WA11
LSW
A12LS
WA18
LSW
A19LS
WA20
LSW
A22LS
WA23
LSW
A26LS
WA28
LSW
A30LS
WA31
LSW
A32LS
WA33
LSW
A34LS
WA35
Sites
%
Spring 2003
Autumn 2004
Figure 132: Numbers of mayflies (Ephemeroptera) and stoneflies (Plecoptera) as a
proportion of the total number of taxa collected in the riffle and edgewater habitat at each sitein the Little Swanport catchment.
Edgewater
EPHEMEROPTERA
0.0
5.0
10.0
15.0
20.0
25.0
30.0
35.0
40.0
45.0
LS
WA
01
LS
WA
02
LS
WA
04
LS
WA
05
LS
WA
06
LS
WA
07
LS
WA
08
LS
WA
09
LS
WA
10
LS
WA
11
LS
WA
12
LS
WA
18
LS
WA
19
LS
WA
20
LS
WA
21
LS
WA
22
LS
WA
23
LS
WA
26
LS
WA
28
LS
WA
30
LS
WA
31
LS
WA
32
LS
WA
33
LS
WA
34
LS
WA
35
Sites
%
Spring 2003
Autumn 2004
PLECOPTERA
0.0
5.0
10.0
15.0
20.0
25.0
30.0
35.0
40.0
LS
WA
01
LS
WA
02
LS
WA
04
LS
WA
05
LS
WA
06
LS
WA
07
LS
WA
08
LS
WA
09
LS
WA
10
LS
WA
11
LS
WA
12
LS
WA
18
LS
WA
19
LS
WA
20
LS
WA
21
LS
WA
22
LS
WA
23
LS
WA
26
LS
WA
28
LS
WA
30
LS
WA
31
LS
WA
32
LS
WA
33
LS
WA
34
LS
WA
35
Sites
%
Spring 2003
Autumn 2004

223
Riffle
TRICHOPTERA
0.0
5.0
10.0
15.0
20.0
25.0
LSW
A01LS
WA02
LSW
A04LS
WA05
LSW
A06LS
WA07
LSW
A08LS
WA09
LSW
A10LS
WA11
LSW
A12LS
WA18
LSW
A19LS
WA20
LSW
A22LS
WA23
LSW
A26LS
WA28
LSW
A30LS
WA31
LSW
A32LS
WA33
LSW
A34LS
WA35
Sites
%
Spring 2003
Autumn 2004
EPT TAXA
0.0
10.0
20.0
30.0
40.0
50.0
60.0
70.0
80.0
90.0
LS
WA
01
LS
WA
02
LS
WA
04
LS
WA
05
LS
WA
06
LS
WA
07
LS
WA
08
LS
WA
09
LS
WA
10
LS
WA
11
LS
WA
12
LS
WA
18
LS
WA
19
LS
WA
20
LS
WA
22
LS
WA
23
LS
WA
26
LS
WA
28
LS
WA
30
LS
WA
31
LS
WA
32
LS
WA
33
LS
WA
34
LS
WA
35
Sites
%
Spring 2003
Autumn 2004
Figure 133: Numbers of caddis flies (Trichoptera) and EPT (Ephemeroptera, Plecoptera and
Trichoptera) taxa as a proportion of the total number of taxa collected in the riffle andedgewater habitat at each site in the Little Swanport catchment.
Edgewater
TRICHOPTERA
0.0
10.0
20.0
30.0
40.0
50.0
60.0
70.0
80.0
LS
WA
01
LS
WA
02
LS
WA
04
LS
WA
05
LS
WA
06
LS
WA
07
LS
WA
08
LS
WA
09
LS
WA
10
LS
WA
11
LS
WA
12
LS
WA
18
LS
WA
19
LS
WA
20
LS
WA
21
LS
WA
22
LS
WA
23
LS
WA
26
LS
WA
28
LS
WA
30
LS
WA
31
LS
WA
32
LS
WA
33
LS
WA
34
LS
WA
35
Sites
%
Spring 2003
Autumn 2004
EPT TAXA
0.0
10.0
20.0
30.0
40.0
50.0
60.0
70.0
80.0
90.0
LS
WA
01
LS
WA
02
LS
WA
04
LS
WA
05
LS
WA
06
LS
WA
07
LS
WA
08
LS
WA
09
LS
WA
10
LS
WA
11
LS
WA
12
LS
WA
18
LS
WA
19
LS
WA
20
LS
WA
21
LS
WA
22
LS
WA
23
LS
WA
26
LS
WA
28
LS
WA
30
LS
WA
31
LS
WA
32
LS
WA
33
LS
WA
34
LS
WA
35
Sites
%
Spring 2003
Autumn 2004
224
Riffle
DIPTERA (non Chironomidae)
0.0
10.0
20.0
30.0
40.0
50.0
60.0
LSW
A01
LSW
A02
LSW
A04
LSW
A05
LSW
A06
LSW
A07
LSW
A08
LSW
A09
LSW
A10
LSW
A11
LSW
A12
LSW
A18
LSW
A19
LSW
A20
LSW
A22
LSW
A23
LSW
A26
LSW
A28
LSW
A30
LSW
A31
LSW
A32
LSW
A33
LSW
A34
LSW
A35
Sites
%
Spring 2003
Autumn 2004
CHIRONOMIDAE
0.0
10.0
20.0
30.0
40.0
50.0
60.0
70.0
LSW
A01
LSW
A02
LSW
A04
LSW
A05
LSW
A06
LSW
A07
LSW
A08
LSW
A09
LSW
A10
LSW
A11
LSW
A12
LSW
A18
LSW
A19
LSW
A20
LSW
A22
LSW
A23
LSW
A26
LSW
A28
LSW
A30
LSW
A31
LSW
A32
LSW
A33
LSW
A34
LSW
A35
Sites
%
Spring 2003
Autumn 2004
Figure 134: Numbers of flies (Diptera) and midges (Chironomidae) as a proportion of the
total number of taxa collected in the riffle and edgewater habitat at each site in the LittleSwanport catchment.
Edgewater
DIPTERA (non Chironomidae)
0.0
2.0
4.0
6.0
8.0
10.0
12.0
14.0
16.0
LS
WA
01
LS
WA
02
LS
WA
04
LS
WA
05
LS
WA
06
LS
WA
07
LS
WA
08
LS
WA
09
LS
WA
10
LS
WA
11
LS
WA
12
LS
WA
18
LS
WA
19
LS
WA
20
LS
WA
21
LS
WA
22
LS
WA
23
LS
WA
26
LS
WA
28
LS
WA
30
LS
WA
31
LS
WA
32
LS
WA
33
LS
WA
34
LS
WA
35
Sites
%
Spring 2003
Autumn 2004
CHIRONOMIDAE
0.0
10.0
20.0
30.0
40.0
50.0
60.0
70.0
LS
WA
01
LS
WA
02
LS
WA
04
LS
WA
05
LS
WA
06
LS
WA
07
LS
WA
08
LS
WA
09
LS
WA
10
LS
WA
11
LS
WA
12
LS
WA
18
LS
WA
19
LS
WA
20
LS
WA
21
LS
WA
22
LS
WA
23
LS
WA
26
LS
WA
28
LS
WA
30
LS
WA
31
LS
WA
32
LS
WA
33
LS
WA
34
LS
WA
35
Sites
%
Spring 2003
Autumn 2004
225
Riffle
CRUSTACEA
0.0
5.0
10.0
15.0
20.0
25.0
30.0
35.0
40.0
45.0
LSW
A01LS
WA02
LSW
A04LS
WA05
LSW
A06LS
WA07
LSW
A08LS
WA09
LSW
A10LS
WA11
LSW
A12LS
WA18
LSW
A19LS
WA20
LSW
A22LS
WA23
LSW
A26LS
WA28
LSW
A30LS
WA31
LSW
A32LS
WA33
LSW
A34LS
WA35
Sites
%
Spring 2003
Autumn 2004
MOLLUSCA
0.00
5.00
10.00
15.00
20.00
25.00
30.00
35.00
LSW
A01
LSW
A02
LSW
A04
LSW
A05
LSW
A06
LSW
A07
LSW
A08
LSW
A09
LSW
A10
LSW
A11
LSW
A12
LSW
A18
LSW
A19
LSW
A20
LSW
A22
LSW
A23
LSW
A26
LSW
A28
LSW
A30
LSW
A31
LSW
A32
LSW
A33
LSW
A34
LSW
A35
Sites
%
Spring 2003
Autumn 2004
Figure 135: Numbers of Crustacea and Mollusca as a proportion of the total number of taxacollected in the riffle and edgewater habitat at each site in the Little Swanport catchment.
Edgewater
CRUSTACEA
0.0
10.0
20.0
30.0
40.0
50.0
60.0
LS
WA
01
LS
WA
02
LS
WA
04
LS
WA
05
LS
WA
06
LS
WA
07
LS
WA
08
LS
WA
09
LS
WA
10
LS
WA
11
LS
WA
12
LS
WA
18
LS
WA
19
LS
WA
20
LS
WA
21
LS
WA
22
LS
WA
23
LS
WA
26
LS
WA
28
LS
WA
30
LS
WA
31
LS
WA
32
LS
WA
33
LS
WA
34
LS
WA
35
Sites
%
Spring 2003
Autumn 2004
MOLLUSCA
0.0
5.0
10.0
15.0
20.0
25.0
30.0
35.0
LS
WA
01
LS
WA
02
LS
WA
04
LS
WA
05
LS
WA
06
LS
WA
07
LS
WA
08
LS
WA
09
LS
WA
10
LS
WA
11
LS
WA
12
LS
WA
18
LS
WA
19
LS
WA
20
LS
WA
21
LS
WA
22
LS
WA
23
LS
WA
26
LS
WA
28
LS
WA
30
LS
WA
31
LS
WA
32
LS
WA
33
LS
WA
34
LS
WA
35
Sites
%
Spring 2003
Autumn 2004
226
5.2.3 Multivariate analysis
Combined season data
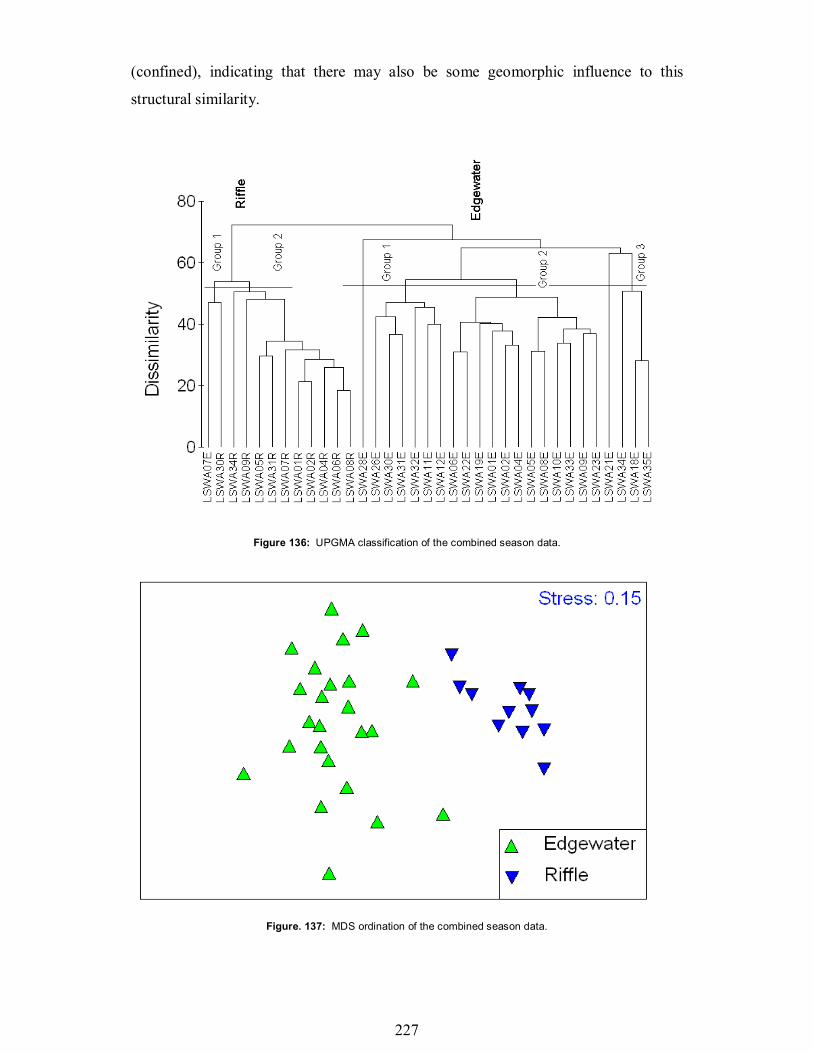
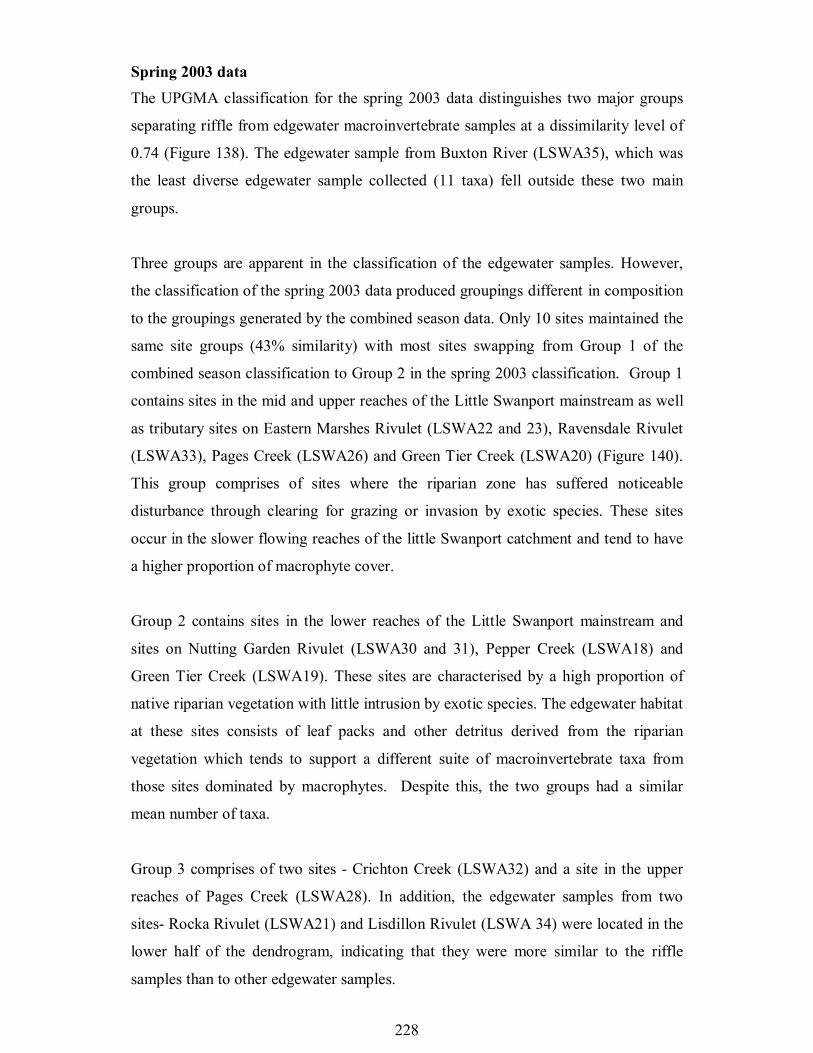
At the dissimilarity level of 0.72, the UPGMA classification clearly distinguishes
riffle samples from edgewater samples. (Figure 136). These groups are also separate
in the ordination plot (Figure 137). Three groups can be distinguished in the
edgewater samples. In the cluster analysis, Pages Creek east of Big Lagoon
(LSWA28) and Rocka Rivulet (LSWA21) are separate from other sites and site
groups, whilst the edge sample from the Little Swanport River at Pine Hill (LSWA07)
was more closely related to riffle samples than to other edgewater samples. Group 1
consists of two sites in the uppermost reaches of the Little Swanport River
mainstream (LSWA11 and 12) as well as tributary sites on Crichton Creek (LSWA32)
Nutting Garden Rivulet (LSWA30 and 31) and Pages Creek (LSWA26). Sites in the
lower to mid reaches of the Little Swanport River, together with sites on Eastern
Marshes Rivulet (LSWA 22 and 23), Green Tier Creek (LSWA19) and Ravensdale
Rivulet form a large group (Group 2) with smaller internal groupings. Group 3 is a
small group consisting of sites on Pepper Creek (LSWA18), Buxton River (LSWA35)
and Lisdillon Rivulet (LSWA34).
Fewer sites are included in the classification of the riffle data, as only sites for which
riffle samples were collected in both seasons were considered for this analysis. The
UPGMA classification for the riffle data distinguishes two groups of sites. The
smaller of the two groups is composed of a site on Nutting Garden Rivulet (LSWA
30) and the edgewater sample from the Little Swanport River at Pine Hill (LSWA07).
The remainder of the sites form the second group, with sites in the lower to middle
reaches of the Little Swanport River (LSWA01 to 08) forming a tight internal cluster
reflecting the homogeneous nature of the macroinvertebrate community at these sites.
These sites are hydrologically similar to each other in that they have flow, and
therefore sufficient riffle habitat throughout most of the year. As a consequence,
samples from these sites are characterised by having a higher proportion of flow
dependant taxa or ‘flow obligates’ such as mayflies, stoneflies, water pennies and
some caddisflies than other tributary sites at which flow is more intermittent. These
sites are also located within the geomorphic zones 3 (partly confined) and 4
227
(confined), indicating that there may also be some geomorphic influence to this
structural similarity.
Figure 136: UPGMA classification of the combined season data.
Figure. 137: MDS ordination of the combined season data.
228
Spring 2003 data
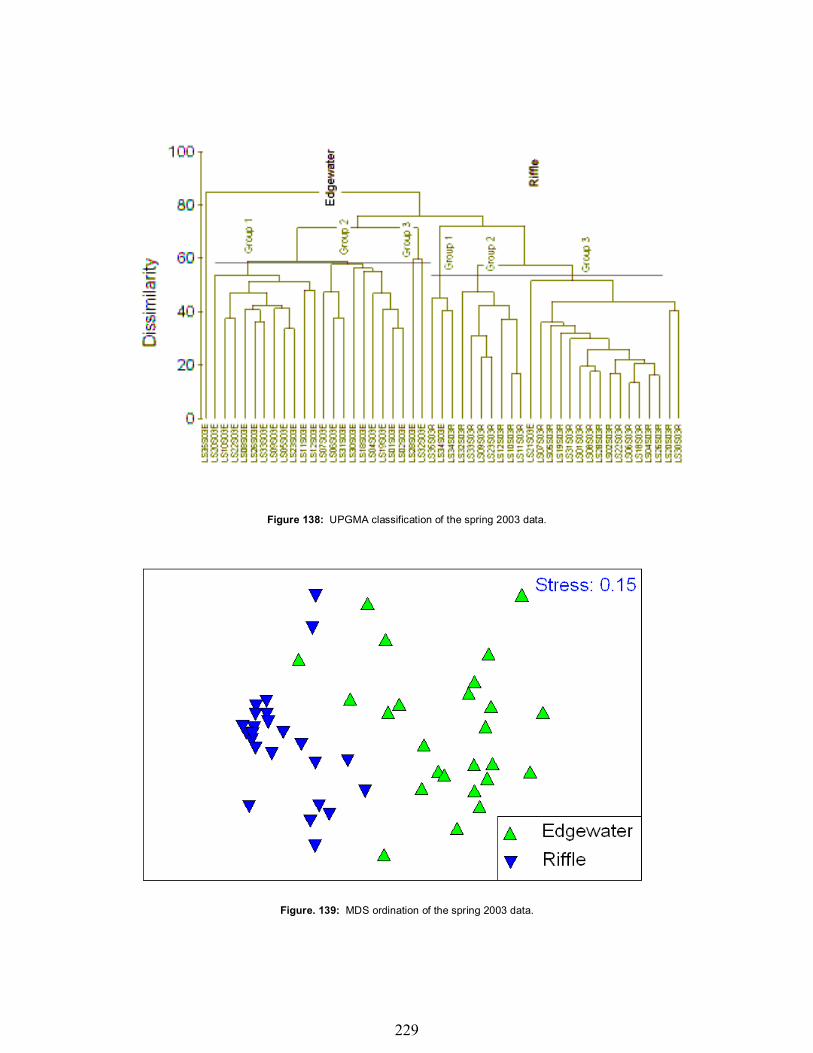
The UPGMA classification for the spring 2003 data distinguishes two major groups
separating riffle from edgewater macroinvertebrate samples at a dissimilarity level of
0.74 (Figure 138). The edgewater sample from Buxton River (LSWA35), which was
the least diverse edgewater sample collected (11 taxa) fell outside these two main
groups.
Three groups are apparent in the classification of the edgewater samples. However,
the classification of the spring 2003 data produced groupings different in composition
to the groupings generated by the combined season data. Only 10 sites maintained the
same site groups (43% similarity) with most sites swapping from Group 1 of the
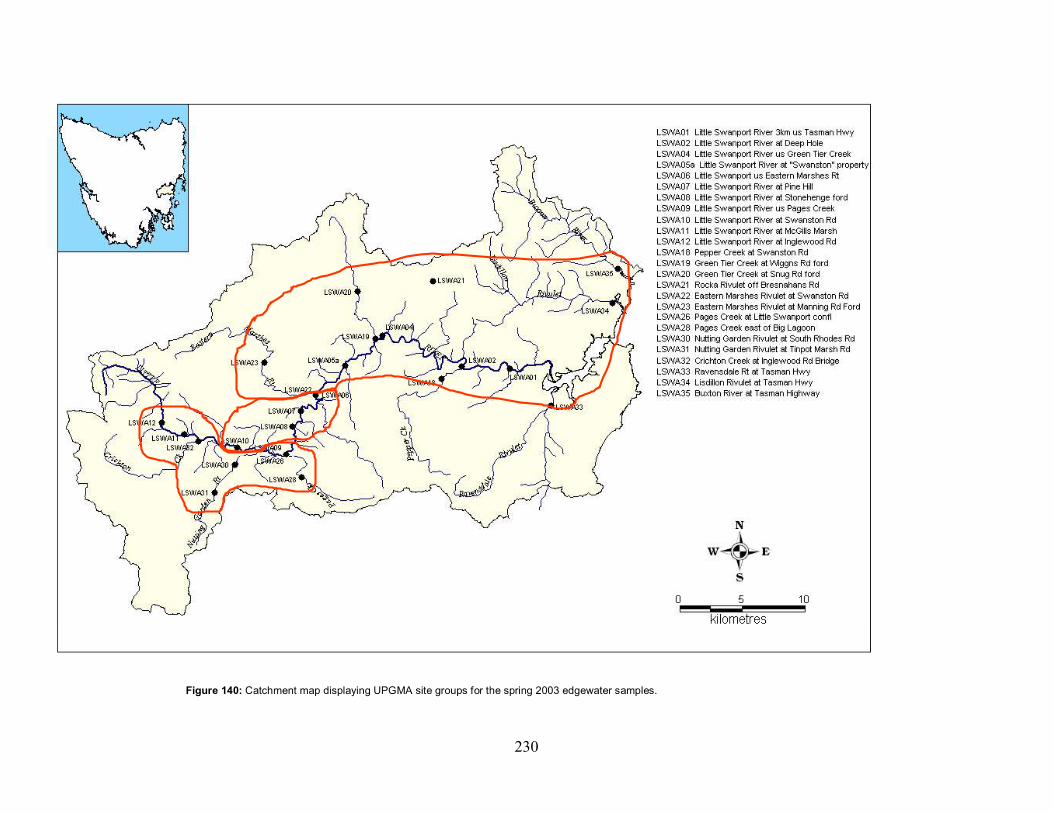
combined season classification to Group 2 in the spring 2003 classification. Group 1
contains sites in the mid and upper reaches of the Little Swanport mainstream as well
as tributary sites on Eastern Marshes Rivulet (LSWA22 and 23), Ravensdale Rivulet
(LSWA33), Pages Creek (LSWA26) and Green Tier Creek (LSWA20) (Figure 140).
This group comprises of sites where the riparian zone has suffered noticeable
disturbance through clearing for grazing or invasion by exotic species. These sites
occur in the slower flowing reaches of the little Swanport catchment and tend to have
a higher proportion of macrophyte cover.
Group 2 contains sites in the lower reaches of the Little Swanport mainstream and
sites on Nutting Garden Rivulet (LSWA30 and 31), Pepper Creek (LSWA18) and
Green Tier Creek (LSWA19). These sites are characterised by a high proportion of
native riparian vegetation with little intrusion by exotic species. The edgewater habitat
at these sites consists of leaf packs and other detritus derived from the riparian
vegetation which tends to support a different suite of macroinvertebrate taxa from
those sites dominated by macrophytes. Despite this, the two groups had a similar
mean number of taxa.
Group 3 comprises of two sites - Crichton Creek (LSWA32) and a site in the upper
reaches of Pages Creek (LSWA28). In addition, the edgewater samples from two
sites- Rocka Rivulet (LSWA21) and Lisdillon Rivulet (LSWA 34) were located in the
lower half of the dendrogram, indicating that they were more similar to the riffle
samples than to other edgewater samples.
229
Figure 138: UPGMA classification of the spring 2003 data.
Figure. 139: MDS ordination of the spring 2003 data.
230
Figure 140: Catchment map displaying UPGMA site groups for the spring 2003 edgewater samples.

231
For the riffle habitat, three groups are apparent. Buxton River (LSWA35) and
Lisdillon Rivulet form a small group (Group 1) which is clearly separated from the
other groups at a dissimilarity level of 0.72. Group 2 contains sites in the upper
reaches of the Little Swanport River (LSWA09-12), Ravensdale Rivulet (LSWA33)
Crichton Creek (LSWA32) and Eastern Marshes Rivulet (LSWA23). This group is
similar to Group 1 of the edgewater classification with 7 of the 8 sites retaining the
same group membership (87.5% similarity). Whilst the groupings generated by the
edgewater data are correlated with land use, riparian vegetation and the type of
edgewater habitat, the classification of the riffles appears to be more related to
hydrological factors, particularly the intermittency of flow (see below).
With the exception of the Little Swanport River upstream of Pages Creek (LSWA09),
flow in Group 2 sites is intermittent, resulting in isolated pool formation following
cessation of flow. A direct consequence of this is the loss of suitable riffle habitat,
particularly for flow dependant taxa or “flow obligates”, deterioration of water quality
and alteration of food resources. Other taxa that are less flow-dependant (“flow
facultatives”) are able to use the pools as refugia to survive this periodic dewatering.
Following the resumption of flow, recolonisation of the riffle habitat is relatively
rapid with a distinct and predictable sequence of biota. Recolonisation by fauna from
refugia is an important mechanism in this recovery. In many of the Group 2 sites, the
macroinvertebrate fauna is dominated by early colonisers such as bloodworms
(Chironomidae) and blackfly larvae (Simuliidae) whilst flow dependant and/or
pollution sensitive taxa such as mayflies, stoneflies and caddisflies are found in very
low numbers or are conspicuously absent. As a consequence, sites in this group have
lower taxon richness than other sites (average 15.2).
Autumn 2004 data
The UPGMA classification for the autumn 2004 data clearly distinguishes edgewater
samples from riffle samples at a dissimilarity level of 0.8. Three groups can be
distinguished in the edgewater samples (Figure 141). In the cluster analysis, Pages
Creek, east of Big Lagoon (LSWA28) and Rocka Rivulet (LSWA21) are clearly
separated from all other sites and site groups. Tributary sites on Crichton Creek
(LSWA32), Nutting Garden Rivulet (LSWA30 and 31) and Pages Creek (LSWA26)
232
form a group (Group1) with the two most upstream sites on the Little Swanport
mainstream (LSWA11 and 12). Group 2 is formed by the sites in the middle to upper
reaches of the Little Swanport River mainstream (LSWA06 –10) plus the upper site
on Eastern Marshes Rivulet (LSWA23). Group 3 consists of sites on the Little
Swanport River mainstream and tributaries in the lower part of the catchment as well
as non-tributary sites on Ravensdale Rivulet (LSWA34) and Buxton River
(LSWA35).
Classification of the autumn data produced groupings different in composition to the
groupings generated by the spring 2003 data, with nearly half of the sites changing
group membership. However the site groupings are more geographically distinct than
the spring 2003 data, clearly separating the upper, middle and lower catchment
(Figure 141) which broadly reflect, riparian vegetation and land use patterns within
the catchment.
Fewer sites are included in the classification of the riffle data, since riffles were not
present at many of the tributary sites and sites in the upper reaches of the Little
Swanport River (LSWA10, 11 and 12). The autumn 2004 dataset distinguishes three
groups at a dissimilarity level of 0.5. Group 1 consists of two sites on Nutting Garden
Rivulet (LSWA30 and 31). These sites are moderately diverse having 26 and 19 taxa
respectively and are characterised by high numbers of hydrobiid snails, ceinid
amphipods and blackfly larvae (Simuliidae). Group 2 consists of Lisdillon Rivulet
(LSWA34) and the Little Swanport River upstream of Pages Creek (LSWA09). In
autumn 2004, the riffle habitat at these sites was marginal due to low flow. The
macroinvertebrate samples contained many taxa which are commonly found in the
edgewater habitat such as planorbid snails, freshwater shrimps, predatory diving
beetles (Dytiscidae) caenid mayflies, hydroptilid caddisflies and midges of the
subfamily Tanypodinae.

233
Figure 141: UPGMA classification of the autumn 2004 season data.
Figure. 142: MDS ordination of the autumn 2004 data.
The remaining group (Group 3) contains sites on the Little Swanport mainstream
(LSWA01 to 08). The mainstream sites cluster tightly within this group reflecting
their homogeneous nature relative to the overall range of sites. This group has a
higher mean number of taxa than the other groups and the macroinvertebrate samples
234
contain taxa more typical of the riffle habitat such as water pennies (Psephenidae)
riffle beetle adults and larvae (Elmidae), dragonfly larvae (Telephlebidae) and midges
of the subfamily Orthocladiinae. As with the spring riffle data, flow appears to be the
primary driver for the site groupings.
5.2.4 AUSRIVAS analysis
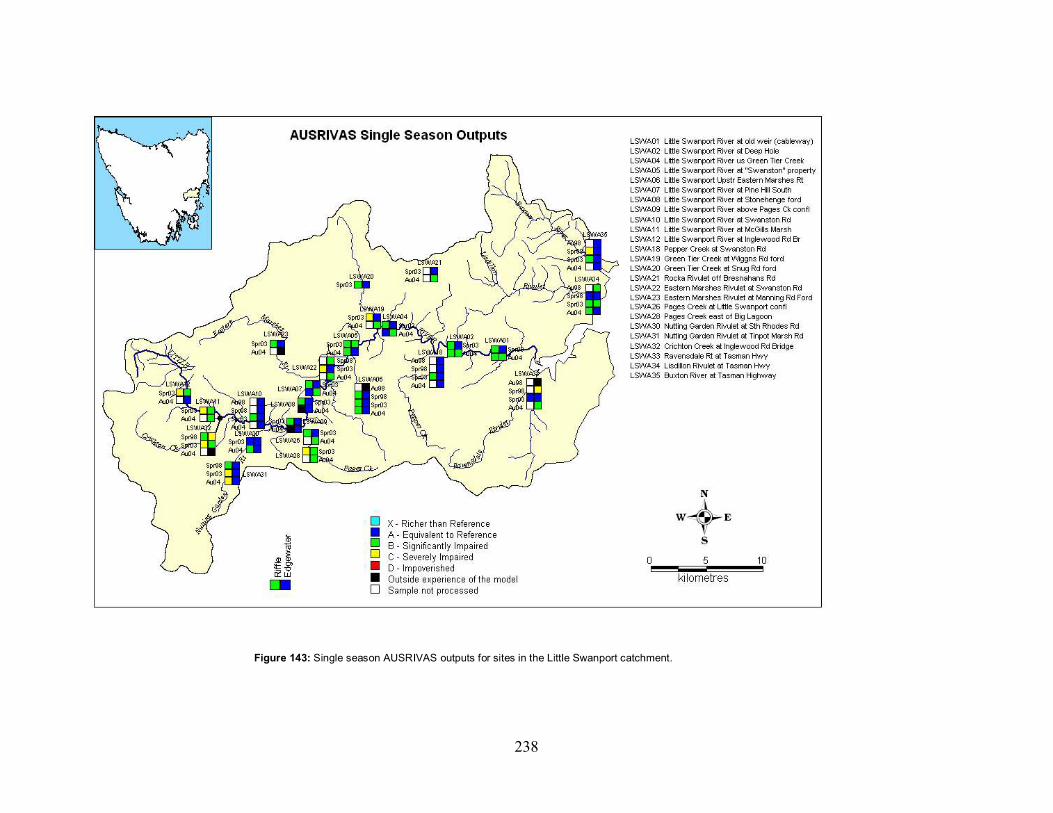
Spring 2003
AUSRIVAS outputs for the edgewater habitat classed 19 of 25 sites (76%) as
equivalent to reference (Band A). Six sites (LSWA05, 11, 12, 28, 32,and 34) were
classed as significantly impaired (Band B) with OE scores ranging from 0.66 to 0.81
indicating a substantial loss of taxa (19-34%) relative to reference sites (Table 33 and
Figure 143). Inspection of the diagnostic data shows that taxa expected to occur but
not collected at these sites included pea shells (Spaeriidae), marsh beetles (Scirtidae),
biting midges (Ceratopogonidae), gripopterygid and notonemourid stoneflies and
caddisflies of the family Philorheithridae and Leptoceridae. Despite many of the sites
having high conductivity levels, the AUSRIVAS outputs indicate that the lower river
health ratings are due to factors other than water quality. At many of these sites, the
riparian zone is extremely modified, having either been cleared for grazing or
dominated by exotic species such as gorse which limits the amount and character of
instream woody material (a food source or habitat refuge for many of the
aforementioned taxa). The lower AUSRIVAS scores therefore are more likely due to
limited habitat availability.
In contrast to the edgewater habitat, AUSRIVAS outputs for the riffle habitat classed
only 2 sites- Nutting Garden Rivulet at South Rhodes Rd (LSWA30) and Ravensdale
Rivulet (LSWA33) as equivalent to reference (Band A). Fifteen of the 24 sampled
sites (63%) were assessed as significantly impaired (Band B) and 7 sites (29%) were
assessed as severely impaired (Band C) (Table 33). Sites assessed as severely
impaired had OE scores ranging from 0.39 to 0.54 and were located predominantly in
the upper part of the catchment (Figure 143). Taxa predicted to occur but not
collected at these sites included marsh beetles (Scirtidae), riffle beetle larvae
(Elmidae), craneflies (Tipulidae), baetid and leptophlebiid mayflies and caddisflies of

235
the families Calocidae, Conoesucidae and Leptoceridae. Four of the seven sites
(LSWA11, 12, 28 and 32) were also determined by the edgewater model to be
significantly impaired. However degradation of the riffle habitat is related more to
hydrological factors particularly flow variability. With the exception of the site at
Nutting Garden Rivulet at Tinpot Marsh Rd (LSWA31), flow at the other sites is
intermittent, resulting in the loss of suitable riffle habitat for mayflies, stoneflies, riffle
beetles and other flow dependent taxa for long periods throughout the year.

236
Table 33: AUSRIVAS outputs for sites in the Little Swanport catchment.
Riffle CombinedSeason
Edgewater CombinedSeason
Code Name Season OE50 Band OE50 Band OE50 Band OE50 Band
Spring 2003 0.67 B 1.07 ALSWA01 Little Swanport River3km u/s of Tasman Hwy Autumn 2004 0.85 B
0.7 B0.73 B
0.99 A
Spring 2003 0.68 B 0.85 ALSWA02 Little Swanport River atDeep Hole Autumn 2004 0.76 B
0.65 B0.57 B
0.95 A
Spring 2003 0.72 B 1.02 ALSWA04 Little Swanport River usGreen Tier Creek Autumn 2004 0.86 A
0.88 A0.74 B
1.01 A
Spring 2003 0.67 B 0.79 BLSWA05 Little Swanport River at"Swanston" property Autumn 2004 0.75 B
0.68 B0.96 A
1.01 A
Autumn 1998 NS Out Exp
Spring 1998 0.8 BNS
0.85 AOut Exp
Spring 2003 0.57 B 0.91 A
LSWA06 Little Swanport River usEastern Marshes Rivulet
Autumn 2004 0.81 B0.83 B
1.06 A1.07 A
Spring 2003 0.65 B 0.91 ALSWA07 Little Swanport River atPine Hill South Autumn 2004 1 A
0.82 B0.64 B
0.95 A
Spring 2003 0.58 B 1.07 ALSWA08 Little Swanport River atStonehenge ford Autumn 2004 Out Exp
0.6 C1.06 A
1.07 A
Spring 2003 0.82 B 0.86 ALSWA09 Little Swanport Riverus Pages Ck confluence Autumn 2004 Out Exp
0.7 B0.85 A
0.89 A
Autumn 1998 NS 0.95 A
Spring 1998 NS
NS
0.92 AOut Exp
Little Swanport River atSwanston Rd
Spring 2003 0.67 B 0.86 A
LSWA10
Autumn 2004 NS
NS
0.95 A1.13 A
Autumn 2004 NS 0.53 BLSWA11 Little Swanport River atMcGills Marsh Spring 2003 0.44 C
NS0.7 B
0.77 B
Spring 2003 0.54 C 0.81 BLSWA12 Little Swanport River at2nd Inglewood Rd Bridge Autumn 2004 NS
NS0.95 A
Out Exp
Autumn 1998 NS 0.92 A
Spring 1998 NSNS
0.97 A1.14 A
Spring 2003 0.69 B 0.91 A
LSWA18 Pepper Creek atSwanston Rd
Autumn 2004 NSNS
1.02 A1 A
Spring 2003 0.53 C 0.92 ALSWA19 Green Tier Creek atWiggins Rd. ford Autumn 2004 NS
NS0.78 B
1.05 A
LSWA20 Green Tier Creek at SnugRd Ford
Spring 2003 0.82 BNS 0.96 A NS
Spring 2003 NS 1.01 ALSWA21 Rocka Rivulet offBresnahans Rd Autumn 2004 NS
NS0.56 B
0.73 B
Spring 1998 NS NS 0.71 B NS
Spring 2003 0.45 C 0.96 A
LSWA22 Eastern Marshes Rivuletat Swanston Rd.
Autumn 2004 NSNS
0.68 B0.99 A
Spring 2003 0.58 B 0.82 ALSWA23 Eastern Marshes Rivuletat Manning Rd. Ford Autumn 2004 NS
NS 0.83 B
Spring 2003 0.67 B 1.02 ALSWA26 Pages Creek at LittleSwanport confluence Autumn 2004 NS
NS0.81 B
0.98 A
Spring 2003 0.54 C 0.66 BLSWA28 Pages Creek east of BigLagoon Autumn 2004 NS
NS0.53 B
0.9 A
Spring 2003 0.96 A 1.01 ALSWA30 Nutting Garden Rivulet atSouth Rhodes Rd. Autumn 2004 0.62 B
0.65 B0.85 A
0.96 A
Spring 1998 0.71 B NS 0.97 A NS
Spring 2003 0.46 C 0.91 A
LSWA31 Nutting Garden Rivulet atTinpot Marsh Rd
Autumn 2004 0.55 C0.45 C
0.93 A0.9 A
Spring 1998 0.59 B NS 0.3 C NS
Spring 2003 0.39 C 0.81 B
LSWA32 Crichton Creek atInglewood Rd Bridge
Autumn 2004 NSNS
Out ExpOut Exp
Autumn 1998 NS Out Exp
Spring 1998 NSNS
0.43 COut Exp
Spring 2003 0.92 A 0.91 A
LSWA33 Ravensdale Rivulet atTasman H'way
Autumn 2004 NSNS
0.72 B0.94 A
Autumn 1998 NS 0.69 B
Spring 1998 0.96 ANS
1.18 A1.18 X
Spring 2003 0.57 B 0.81 B
LSWA34 Lisdillon Rivulet atTasman Hwy
Autumn 2004 0.81 B0.74 B
1.04 A0.84 B
LSWA35 Buxton River at TasmanTasman Hwy
Autumn 1998 NSNS 0.97 A 0.91 A
NS – Not sampled
Out Exp – Outside the experience of the model
237
Autumn 2004
Twenty four sites were assessed in autumn 2004 as Green Tier Creek at Snug Road
ford (LSWA20) was dry. Of these, 11 or 46% were equivalent to reference site
condition (Band A) and 11 sites were assessed as significantly impaired (Band B).
Sites at Eastern Marshes Rivulet at Mannings Road ford (LSWA23) and Crichton
Creek at Inglewood Road Bridge (LSWA32) had conductivity levels which were
under-represented in the reference dataset for the autumn edgewater AUSRIVAS
model and were found to be “outside the experience of the model”. In general, river
health was poorer in autumn 2004 with 14 sites experiencing a decrease in OE scores
compared to spring 2003. At 9 of these sites the magnitude of the decrease was
sufficient to shift the sites from Band A to Band B. Expected taxa which were
collected in spring 2003 and not autumn 2004 included predatory diving beetles
(Dytiscidae), water boatmen (Corixidae), leptophlebiid and notonemourid mayflies
and midges of the subfamily Tanypodinae and Chironominae.
Due to low flows in the Little Swanport catchment, sufficient riffle habitat for
sampling was available at only the lower to mid reaches of the Little Swanport River
(LSWA01 – 09), Nutting Garden Rivulet (LSWA30 and 31) and Lisdillon Rivulet
(LSWA34). Of these, the Little Swanport River upstream of Green Tier Creek and at
Pine Hill (LSWA04 and 07) were assessed as equivalent to reference. Four sites on
the Little Swanport mainstream (LSWA01, LSWA02, LSWA05 and LSWA06) as
well as Nutting Garden Rivulet at South Rhodes Road (LSWA30) and Lisdillon
Rivulet were significantly impaired, and 2 sites (LSWA08 and 09) were outside the
experience of the model due to high conductivity levels. Interestingly, despite the
lower flows and poorer water quality, there was an increase in the number of taxa
collected and a corresponding increase in OE scores in all but one site, compared to
the spring 2003 season. Expected taxa collected in autumn 2004 but not present in
spring 2003 included riffle beetle adults and larvae (Elmidae), mayflies and
caddisflies of the families Hydropsychidae and Leptoceridae.
238
Figure 143: Single season AUSRIVAS outputs for sites in the Little Swanport catchment.
239
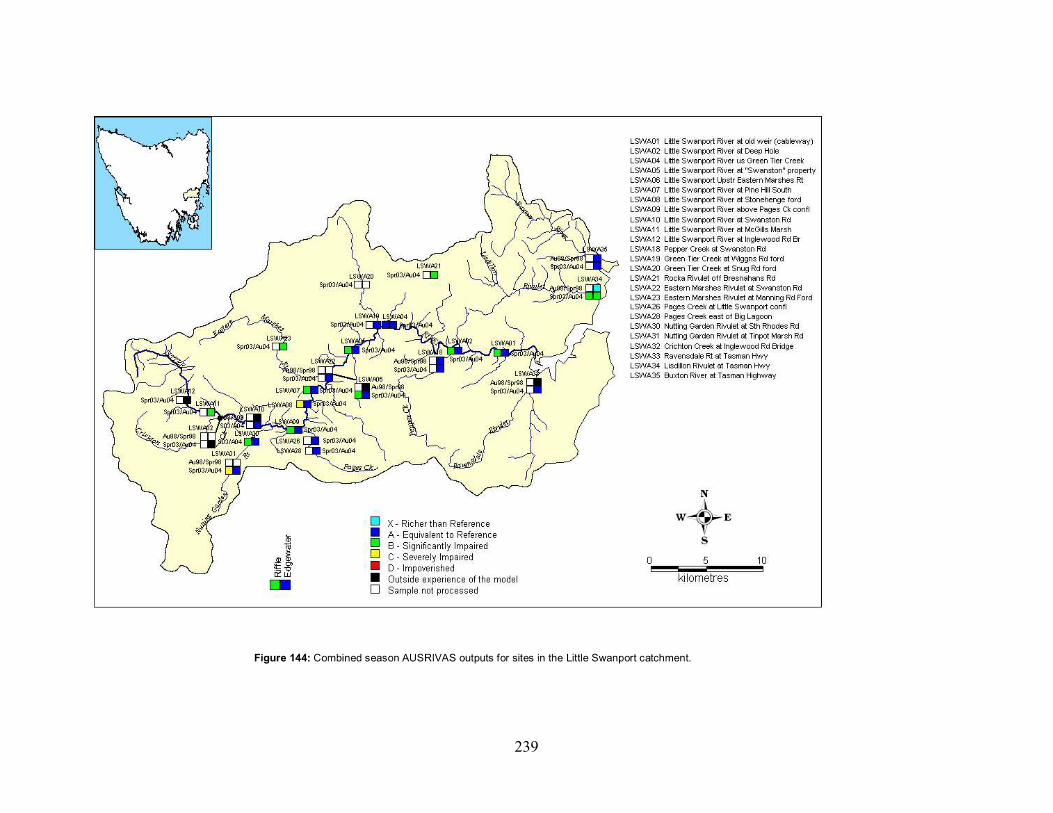
Figure 144: Combined season AUSRIVAS outputs for sites in the Little Swanport catchment.
240
Combined season
It is generally believed that macroinvertebrate assemblages are best characterised by
combining data collected from two seasons. Combining seasonal data increases the
taxa observed at a site in two ways. Firstly, as with any increased sampling effort,
more habitat is sampled and therefore more taxa are collected; secondly, because of
the variability in life cycles and turnover in different macroinvertebrate groups, some
taxa are collected in one season but not in another. Larger taxa lists provide more taxa
for predictions, making the combined season models more robust to small sampling
variations in collected taxa. A larger list of taxa also increases the chance of detecting
an impact because a larger range of taxa will provide a wider range of responses to
more types of pollutants (Barmuta et al., 1998). The drawback of this approach is that
two seasons worth of data need to be collected before an assessment can be made.
This is particularly relevant in catchments such as the Little Swanport River where
some of streams may be intermittent. Because of this, 13 sites could not be sampled in
autumn 2004 due to insufficient riffle habitat.
For the sites where riffle habitat could be sampled during autumn 2004, combined
season AUSRIVAS outputs classed only a single site – the Little Swanport River
upstream of Green Tier Creek – as equivalent to reference. Eight sites were classified
as significantly impaired (Band B) and 1 site – Nutting Garden Rivulet at Tinpot
Marsh Road –as severely impaired (Band C).
The combined season AUSRIVAS model for edgewaters classed 18 sites (72%) as
equivalent to reference and 3 sites as significantly impaired (Figure 144). The Little
Swanport River at lower Inglewood Rd (LSWA12) and Crichton Creek at Inglewood
Road bridge (LSWA32) were found to be outside the experience of the model due to
high conductivity levels. An assessment could not be made for Green Tier Rivulet at
Snug Road (LSWA20), as this site only has one season of data. Generally the pattern
of river health assessed by the combined season edgewater model is similar to that
generated by the spring edgewater model.

241
5.3 Discussion
Measurement and characterisation of the fish and macroinvertebrate community
structure provides a biological approach for understanding the natural patterns of
change and the degree of anthropogenic impacts on rivers in the Little Swanport
catchment. The condition of the river environment varies considerably throughout the
catchment from near pristine to highly degraded areas where agricultural activities
appear to have a negative impact on the health of riverine communities. Sections of
the Little Swanport River and associated tributaries have been extensively modified
since European settlement. Natural habitat and water quality have been altered by
land use, particularly from agricultural activities in the upper reaches of the Little
Swanport River and on many of the tributaries. This is reflected in the lower diversity
and abundances of fish and macroinvertebrate faunas and poorer AUSRIVAS scores
in these areas. Interpretation of the AUSRIVAS outputs indicates that habitat
modification, water quality degradation, or both negatively affect macroinvertebrate
communities at many sites. Impacts from the physical degradation of instream and
streamside habitat are often compounded by poor water quality, particularly in the
upper catchment (see Chapter 4.1). Generally, water quality degradation tends to
accumulate along a rivers length so that damage suffered at one part is compounded
further downstream by additional impacts. However, because the physical nature of
the landscape in the middle and lower catchment has prevented significant land use
and riverine disturbance, this is not the case in the Little Swanport catchment. This
has ensured that there is no general trend of decreasing taxon richness from the upper
to the lower reaches of the catchment.
A number of water quality issues have been highlighted in the Little Swanport
catchment (see Chapter 4), and these are strongly linked to the ephemeral nature of
the hydrology and the intensity of land use. This has produced large variations in
dissolved oxygen and turbidity, high conductivity and elevated nutrient
concentrations.
Aquatic organisms become stressed when concentrations of dissolved oxygen fall
below 6 mg/L (ANZECC, 1992) and are likely to become stressed by large daily
changes that were typical of disturbed sites in the upper catchment. While this is at
242
least partly due to the ephemeral nature of the streams in the upper catchment, which
at times are reduced to isolated pools that are susceptible to stagnation, organic
enrichment may also be a factor, particularly where stock access is unrestricted. In
these situations, excess nutrients can promote vigorous algal growth which can have a
profound effect on macroinvertebrate community structure. Because blooms are often
of a few or a single species of algae, the food resource for algal grazers and scrapers
(snails, gripopterygid stonefly larvae, and some beetles and mayflies) can become
very restricted, and the prolific growth of these can also reduce available habitat for
other species.
Electrical conductivity in streams is closely related to catchment geology and the
influence of groundwater, although their effects can be exacerbated by land clearing
and irrigation practices (Davies, 2002). In the Little Swanport River electrical
conductivity is highest in streams of the upper catchment, where levels above
2000 µS/cm were recorded. Such levels may cause stress to instream fauna
(Metzling, 1993), most particularly salt-sensitive taxa such as mayflies and gastropods
(Allan, 2006).
Whilst these measures of water quality give some indication of the environmental
condition of a particular site, they do not give insight into the long-term biological
health of a stream. The results from macroinvertebrate sampling show that land use,
and impacts on the condition and extent of the riparian zone and instream habitat also
have a strong influence on river health. Habitat degradation was evident at many sites
throughout the upper and middle catchment of the Little Swanport River, in many
cases took the form of eroded bank, instream sedimentation, channelisation, and the
presence of exotic weed species in the riparian zone.
The quality of aquatic habitat is closely linked to riparian vegetation (Cummins,
1993). The type of vegetation along river banks can strongly influence stream
morphology, including width and cross-sectional shape, by binding bank material and
preventing bank slumping (Bessell-Browne, 2000). Vegetation type also affects the
extent of trailing bank vegetation, the interception of sediment from runoff, water
temperature and primary production through shading, and the deposition of
243
allochthonous organic material. Native riparian vegetation contributes large woody
debris (branches or whole trees) to the stream, and this forms a major structural
component of the stream morphology, and serves as an important link between
terrestrial and aquatic systems (Hilderbrand et al. 1997). Degradation of the riparian
zone often leads to edgewater habitat destruction and loss of the natural buffer against
contamination. This is a common feature of streams draining the upper catchment of
the Little Swanport River. Sediment from bank erosion, often exacerbated by
unrestricted stock access, and runoff from cleared land and from gravel roads has in
many places blanketed the stream and degraded habitat at many sites. This is often
compounded the prolific growth of Cumbungi (Typha latifolia) and other aquatic
weeds which have responded to increased light levels and nutrient input to streams.
However, a significant factor in structuring fish and macroinvertebrate communities
within the Little Swanport catchment is flow. Hydrological characterisation of the
Little Swanport catchment (see Chapter 2) has shown that flows are naturally variable
in this catchment, and that cease-to-flow periods are a natural part of the flow regime,
although in the upper reaches of the Little Swanport River cease-to-flow periods have
been modified. Flow generated disturbances such as floods and droughts periodically
disrupt aquatic macroinvertebrate communities. (Lake, 2000). The contrasting states
of flood and drought in many parts of the Little Swanport catchment means that
streams fluctuate between being highly connected (during floods), to being highly
disconnected (during droughts). The degree of connection between waterbodies on
both a spatial and temporal scale strongly influences community composition
(Sheldon, 2006).
During floods, rapidly moving water exerts high shear forces that suspend sediments,
move and redistribute substrate materials, scour and abrade the streambed, move
detritus and kill and displace biota. Floods have a significant influence on temporarily
reducing species richness and total numbers of individuals but recovery to pre-flood
conditions is generally rapid (Boulton and Lake, 1992). The availability of suitable
refugia in streams may be a critical measure of the levels of resilience and resistance
to high flow disturbance. (Brooks and Boulton, 1991). However recolonisation may
also occur by drift, movement from the hyporheic zone and by adult (aerial) dispersal.
Some species, notably simuliids and chironomids colonise bare patches rapidly
244
whereas grazers and predators are slow and steady colonisers. This is illustrated by
observations in the Little Swanport catchment where the abundance of these two taxa
was much higher in the spring 2003 sample (which followed high winter flows) than
in the autumn 2004 sample.
The Little Swanport catchment is also subject to seasonal droughts in which water
flow and availability fall to low levels for prolonged periods of time. This is
particularly the case in the tributaries to the main river. There are both direct and
indirect effects of drought on stream ecosystems. Direct impacts are those caused by
loss of water and flow and a reduction in available habitat. Indirect effects include the
deterioration of water quality, alteration of food resources and a change in the
intensity of specific interactions (Lake 2003). As water flow declines, water
temperature, conductivity and nutrient concentrations may start to rise.
Simultaneously, especially in pools, deoxygenation may occur. Once flow stops,
shallow sections such as riffles and runs disappear and streams become a series of
disconnected pools. With a lack of flowing water, filterer and grazer densities are
often greatly reduced and there is an increase in predator densities. At many sites at
which the riffle habitat disappeared in the autumn 2004 season, odonatan nymphs
comprised more than 15% of the total number of taxa collected in the edgewater
samples. As flow decreased in riffles, there was an observed increase in taxa that are
more tolerant of physicochemical extremes. These taxa generally prefer slower
flowing water and include tanypod chironomids. Caenidae, Hydrophilidae, freshwater
shrimps (Atyidae) and eusirid amphipods whilst numbers of flow dependant taxa such
as baetid and leptophlebiid mayflies, and some families of stoneflies and caddisflies
were markedly reduced or conspicuously absent.
Faunal recovery to pre-drought conditions may occur by 5 mechanisms: movement
from subsurface refugia, hatching or reactivation of drought resistant life stages,
upstream movement, downstream migration by drift and aerial recolonisation (Lake,
2000). However, recovery after drought may take considerable time and the faunal
composition and dynamics are more unpredictable than recovery after floods because
the effects of drought are thought to be more species-specific.

245
Due to the hydrologically variable nature of the Little Swanport River, cyclical
changes in macroinvertebrate community composition are observed at many sites.
The constant adaptation of the macroinvertebrate fauna to flow induced disturbances
may be a reason for the lack of consistency in site groupings between seasons in the
multivariate analyses and also has implications for AUSRIVAS outputs. It has been
suggested (Schofield and Davies, 1996) that the AUSRIVAS approach to assessing
the health of ephemeral streams should be undertaken with caution, as the predictive
models have been based largely on perennially flowing streams. Thus while the model
results for the Little Swanport catchment are showing broad patterns of ‘riverine
health’ throughout the catchment, they may not effectively discriminate between
naturally occurring flow disturbances and anthropogenic impacts. This is particularly
relevant for the riffle habitat which is generally more dynamic. A recommendation
from this study is that the resolution of the models be improved through the
incorporation of additional ephemeral river sites into the reference dataset, and an
examination of the potential for use of hydrological descriptors as predictor variables
for the AUSRIVAS models.
Despite natural flow variability being a significant factor in structuring
macroinvertebrate communities, the AUSRIVAS outputs have identified parts of the
Little Swanport catchment that are in poor ecological condition due to physical
degradation of instream habitat and deterioration of water quality. Erosion is a
problem in the upper part of the catchment. Runoff from cleared surrounding land
carries sediment and nutrient and has led to the loss of habitat within the stream. Most
of the riparian vegetation in the upper reaches of the Little Swanport River and
associated tributaries has been cleared. The lack of a riparian zone, coupled with the
practice of allowing cattle direct access to streams have led to poor habitat and
degraded water quality. Better management of the surrounding land and rehabilitation
and protection of the riparian zone are necessary to improve overall stream health in
the Little Swanport catchment.