Embed Size (px)
Citation preview
(a) Mixing ratios of snowNHM dx=2km 200406081700Z
(c) Mean diameters of snowNHM dx=2km CTL 200406081700Z
(b) Number concentrations of snowNHM dx=2km CTL 200406081700Z
(b) Number concentrationsNHM dx=2km CTL 200406081700Z
(a) Mixing ratiosNHM dx=2km CTL 200406081700Z
(a) (b)
(b)(a)
(a) (b)
(b)(b)(a)
(b)(a)
(a) (b)
0.1 1.0 10.0 20.0 30.0 40.0 50.0
Prec mm/h (z*= 20m) (Valid:09.0200JST) 8hour 0min
0 200km
Initial : 2004.06.08.09UTC
25N
30N125E 130E
0 200 km
0.1 1.010.020.030.040.050.0 (mm/h)
R/A 1700 UTC 8 JUN 2004
25N
30N125E 130E
Cloud resolving models (CRMs) serve as a valuable tool for satellite remote sensing by inferring information about precipitating clouds that cannot be directly observed. However, it is indispensable for the use of CRMs in precipitation remote sensing that their output is verified with observational data to confirm that the information derived from them is reliable.
In this study, a CRM, the Japan Meteorological Agency (JMA) nonhydrostatic mesoscale model (JMA-NHM) is used to simulate a real rainfall system associated with the Baiu front around the Okinawa
Verification of hydrometeor properties simulated by a cloud resolving model using passive microwave satellite and ground-based radar observations
for a rainfall system associated with the Baiu frontHisaki Eito and Kazumasa Aonashi
Meteorological Research Institute, Japan Meteorological Agency, Tsukuba, Ibaraki, 305-0052, Japan. E-mail: [email protected]
1. Introduction
4th Workshop of the International Precipitation Working Group (IPWG), October 13-17, 2008, Beijing, China
Fig. 1. Horizontal distribution of hourly-accumulated precipitation at 1700 UTC on 8 June 2004 as analyzed by JMA based on operational radar observations.
2. Baiu frontal rainbands on 8 June 2004Three distinct rainbands extending in a northeast-southwest direction are found in the rainfall system
associated with the Baiu front around the Okinawa Islands. The National Institute of Information and Communications Technology (NICT) Okinawa Bistatic Polarimetric Radar (called COBRA) captures two rainbands on the southeastern side of the rainfall system. The Advanced Microwave Scanning Radiometer for EOS (AMSR-E) also captured these rainbands. Areas with small values of P18 are found in the rainbands, indicating the presence of large amounts of liquid water. Areas with large PCT89 depressions are also found in the rainbands, denoting that a large amount of frozen hydrometeors also exists in those clouds.
4. Results
Fig. 2. A radar CAPPI of reflectivity (dBZ) at a height of 2 km at 1700 UTC on 8 June 2004 observed by COBRA.
3. Numerical model and experimental designJMA-NHM is a nonhydrostatic mesoscale model developed by JMA. The model has been used for
mesoscale numerical weather prediction around Japan by JMA since 1 September 2004 (Saito et al., 2006). Its general characteristics, as well as the specific options chosen for this study, are summarized in Table 1. An explicit three-ice bulk microphysics scheme (Ikawa and Saito 1991) based on Lin et al. (1983) is incorporated. The scheme predicts the mixing ratios of six hydrometeors. Number concentrations of solid hydrometeors are optionally treated as the prognostic values in addition to their mixing ratios. Spherical particles are assumed. Density is constant in each category. Simple power laws are taken for the mass-size and velocity size relationships. Table 2 provides the characteristics of each hydrometeor class.
Table 1. General Characteristics for the JMA-NHM simulations.Initial time 0900 UTC, 8 June, 2004Nesting geometry 2 modelsNested horizontal grid size 5, 2 km
Levels 50 terrain-following stretched levels from 20 m to 904 m
Model top 22.24 km
Moist physics bulk scheme, 6 water categories, two-moment 3 ice (Ikawa and Saito 1991)
Convection (not used in the inner model)
Kain-Fritcsh scheme (Kain and Fritsch 1993)
Turbulence Mellor Yamada Level 3 (MY3; Nakanishi and Niino 2004, 2006; Hara 2007)
Radiation Detailed long wave radiation scheme for clear sky partial condensation by PDF in the MY3 closure model for cloudiness (Hara et al. 2007)
Variable Rain
rQ (kg kg-1)
Snow sQ (kg kg-1)
sN (m-3)
Graupel gQ (kg kg-1)
gN (m-3)
Cloud water cQ (kg kg-1)
Cloud ice ciQ (kg kg-1)
ciN (m-3)
Size
distribution
(m-4)
)exp()(
0 rrr
rr
DNDN
λ−=
60 100.8 ×=rN
)exp()(
0 sss
ss
DNDN
λ−=
)exp(
)(
0 ggg
gg
DN
DN
λ−
=
⎥⎦
⎤⎢⎣
⎡=
cc
cc N
qDρπρ6
38100.1 −×= mNc
⎥⎦
⎤⎢⎣
⎡=
cici
cici N
qDρπρ6
ux
uxxuxxx DDU
γβ
ρρα ⎥⎦
⎤⎢⎣
⎡= 0)(
Fall velocity
(ms-1)
5.08.0
842
==
=
ur
ur
ur
γβα
5.05.0
17
==
=
us
us
us
γβα
5.064.0
124
=
=
=
ug
ug
ug
γ
β
α
0.10.2
1098.2 7
==
×=
uc
uc
uc
γβα
33.00.1
700
===
uci
uci
uci
γβα
Density
(kgm-3) 3100.1 ×=rρ 1104.8 ×=sρ 2100.3 ×=gρ 3100.1 ×=cρ 2100.5 ×=ciρ
Table 2. Assumed hydrometeor parameters and characteristics.
4.1 Comparisons with radar observationsJMA-NHM well captures the location, shape and
intensity of the observed rainbands. The JMA-NHM and COBRA data are compared using CFADs (Yuter and Houze 1995) that computes the probability density (%) of a field as a function of height. Overall, there is good agreement between the observations and the simulation. Below the melting level, peak probabilities for the simulated reflectivities agree with those from the observed. However, peak probabilities from the simulation appear to be shifted slightly higher above the melting level. These results indicate that the model accurately captures the observed reflectivities in the liquid phase but slightly overestimates them in the ice phase.
4.2 Comparisons with satellite radiometer observationsThe radiative transfer model (RTM) developed by Liu (1998), which uses plane-parallel and spherical
particle approximations, is used to simulate TBs in this study. The values of simulated P18 are almost in agreement with the AMSR-E observations; however, the simulated PCT89 depressions are larger. This result suggests that JMA-NHM accurately simulates the amount of the liquid hydrometeors but overestimates the amount of frozen hydrometeors, which is consistent with the results obtained from radar reflectivity comparison.
4.3 Hydrometeor profilesThe dominant form of frozen hydrometeors in the simulation
is snow with much smaller amounts of graupel and cloud ice. The microphysical budget in JMA-NHM indicates that deposition is the primary process responsible for snow growth. Collection of cloud water by snow is the second-most important process responsible for snow growth. The number concentration of snow particles is larger than that of cloud iceparticles due to conversion of cloud ice to snow through depositional growth of cloud ice and accretion of cloud ice by snow. The large number of snow particles leads to the large amount of depositional growth of snow. The excessive amount of snow results in overestimate of radar reflectivities and PCT89 depressions.
Fig. 4. Horizontal distribution of hourly-accumulated precipitation at 1700 UTC on 8 June 2004 obtained from JMA-NHM (8 hour forecast).
Fig. 5. Simulated radar reflectivity for 1700 UTC on 8 June 2004 at a height of 2 km obtained from JMA-NHM (8 hour forecast).
Fig. 6. Reflectivity CFADs for the region 127-129E and 25.5-27.5N at 1700 UTC on 8 June 2004 derived from (a) the observed CORBA radar reflectivity data and (b) the JMA-NHM simulation.
Fig. 7. Probability densities of reflectivity for the region 127-129E and 25.5-27.5N at 1700 UTC on 8 June 2004 at a height of (a) 2 km and (b)7 km.
Fig. 8. (a) P18 and (b) PCT89 retrieved from TBs simulated by JMA-NHM at 17 UTC on 8 June 2004.
Fig. 9. Probability densities of (a) P18 and (b) PCT89 for the region 127-129E and 25.5-27.5N at 17 UTC on 8 June 2004. Probability densities derived from the observed AMSR-E data and the JMA-NHM simulation are shown by the solid and dashed lines, respectively.
Fig. 3. (a) The polarization difference (vertically polarized TB minus horizontally polarized TB) at 18.7 GHz (hereafter referred as “P18”) and (b) the polarization corrected temperature (PCT, Spencer et al. 1989) retrieved from the 89.0 GHz TB (hereafter referred as “PCT89”) retrieved from TBs observed by AMSR-E at 17 UTC on 8 June 2004.
Fig. 10. Domain-average vertical profiles of (a) simulated mixing ratios and (b) number concentrations of hydorometeors at 1700 UTC on 8 June 2004. The values are horizontally averaged over 127 – 129E and 25.5 – 27.5 N at each level.
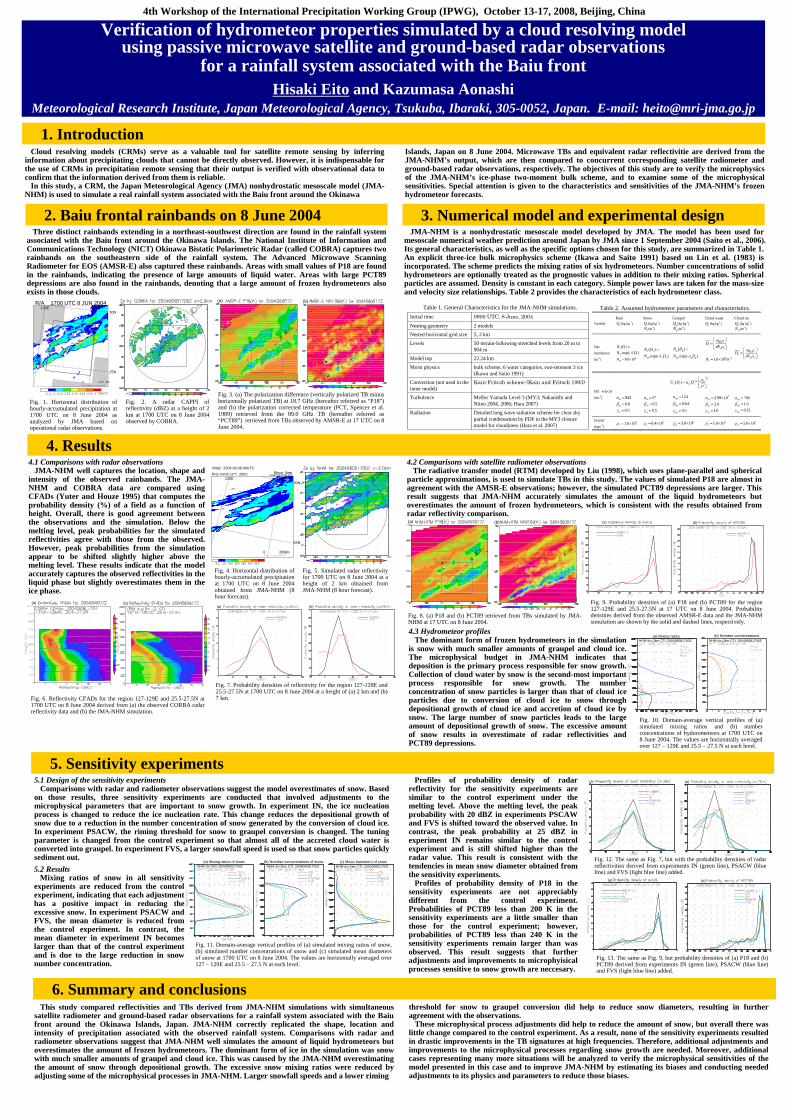
5. Sensitivity experiments5.1 Design of the sensitivity experiments
Comparisons with radar and radiometer observations suggest the model overestimates of snow. Based on those results, three sensitivity experiments are conducted that involved adjustments to the microphysical parameters that are important to snow growth. In experiment IN, the ice nucleation process is changed to reduce the ice nucleation rate. This change reduces the depositional growth of snow due to a reduction in the number concentration of snow generated by the conversion of cloud ice. In experiment PSACW, the riming threshold for snow to graupel conversion is changed. The tuning parameter is changed from the control experiment so that almost all of the accreted cloud water is converted into graupel. In experiment FVS, a larger snowfall speed is used so that snow particles quickly sediment out.
Profiles of probability density of radar reflectivity for the sensitivity experiments are similar to the control experiment under the melting level. Above the melting level, the peak probability with 20 dBZ in experiments PSCAW and FVS is shifted toward the observed value. In contrast, the peak probability at 25 dBZ in experiment IN remains similar to the control experiment and is still shifted higher than the radar value. This result is consistent with the tendencies in mean snow diameter obtained from the sensitivity experiments.
Profiles of probability density of P18 in the sensitivity experiments are not appreciably different from the control experiment. Probabilities of PCT89 less than 200 K in the sensitivity experiments are a little smaller than those for the control experiment; however, probabilities of PCT89 less than 240 K in the sensitivity experiments remain larger than was observed. This result suggests that further adjustments and improvements to microphyisicalprocesses sensitive to snow growth are neccesary.
Fig. 11. Domain-average vertical profiles of (a) simulated mixing ratios of snow, (b) simulated number concentrations of snow and (c) simulated mean diameters of snow at 1700 UTC on 8 June 2004. The values are horizontally averaged over 127 – 129E and 25.5 – 27.5 N at each level.
Fig. 13. The same as Fig. 9, but probability densities of (a) P18 and (b) PCT89 derived from experiments IN (green line), PSACW (blue line) and FVS (light blue line) added.
Fig. 12. The same as Fig. 7, but with the probability densities of radar reflectivities derived from experiments IN (green line), PSACW (blue line) and FVS (light blue line) added.5.2 Results
Mixing ratios of snow in all sensitivity experiments are reduced from the control experiment, indicating that each adjustment has a positive impact in reducing the excessive snow. In experiment PSACW and FVS, the mean diameter is reduced from the control experiment. In contrast, the mean diameter in experiment IN becomes larger than that of the control experiment and is due to the large reduction in snow number concentration.
6. Summary and conclusionsThis study compared reflectivities and TBs derived from JMA-NHM simulations with simultaneous
satellite radiometer and ground-based radar observations for a rainfall system associated with the Baiufront around the Okinawa Islands, Japan. JMA-NHM correctly replicated the shape, location and intensity of precipitation associated with the observed rainfall system. Comparisons with radar and radiometer observations suggest that JMA-NHM well simulates the amount of liquid hydrometeors but overestimates the amount of frozen hydrometeors. The dominant form of ice in the simulation was snow with much smaller amounts of graupel and cloud ice. This was caused by the JMA-NHM overestimating the amount of snow through depositional growth. The excessive snow mixing ratios were reduced by adjusting some of the microphysical processes in JMA-NHM. Larger snowfall speeds and a lower riming
(a)
Islands, Japan on 8 June 2004. Microwave TBs and equivalent radar reflectivitie are derived from the JMA-NHM’s output, which are then compared to concurrent corresponding satellite radiometer and ground-based radar observations, respectively. The objectives of this study are to verify the microphysics of the JMA-NHM’s ice-phase two-moment bulk scheme, and to examine some of the microphysical sensitivities. Special attention is given to the characteristics and sensitivities of the JMA-NHM’s frozen hydrometeor forecasts.
threshold for snow to graupel conversion did help to reduce snow diameters, resulting in further agreement with the observations.
These microphysical process adjustments did help to reduce the amount of snow, but overall there was little change compared to the control experiment. As a result, none of the sensitivity experiments resulted in drastic improvements in the TB signatures at high frequencies. Therefore, additional adjustments and improvements to the microphysical processes regarding snow growth are needed. Moreover, additional cases representing many more situations will be analyzed to verify the microphysical sensitivities of the model presented in this case and to improve JMA-NHM by estimating its biases and conducting needed adjustments to its physics and parameters to reduce those biases.

![WA-08-01D Precipitation [And Water and Energy Cycle Integration] led by the International Precipitation Working Group (IPWG) 2009-2010 IPWG Co-Chairs:](https://img.dokumen.tips/doc/110x75/56649f525503460f94c758ab/wa-08-01d-precipitation-and-water-and-energy-cycle-integration-led-by-the.jpg)