Embed Size (px)
Citation preview

4th Quarter 2013 ResultsFebruary 20th , 2014

Disclaimer
Forward-Looking Statements
This presentation contains forward-looking statements within the meaning of applicablefederal securities laws. Such statements are based upon current expectations thatinvolve risks and uncertainties. Any statements contained herein that are not statementsof historical fact may be deemed to be forward-looking statements. For example, wordssuch as “may,” “will,” “should,” “estimates,” “intends,” and similar expressions areintended to identify forward-looking statements. Actual results and the timing of certainevents may differ significantly from the results discussed or implied in the forward-lookingstatements. Among the factors that might cause or contribute to such a discrepancyinclude, but are not limited to the risk factors described in the Company’s RegistrationStatement filed with the Securities and Exchange Commission, particularly thosedescribing variations on charter rates and their effect on the Company’s revenues, netincome and prof i tabi l i ty as wel l as the value of the Company’s f leet .

Stealthgas Top Handy LPG Owner
Top LPG Owners Ranked by Number of Vessels
Leading owner of Handysize LPG vessels
Maintain a modern fleet. Average age of current LPG fleet 12 years and will come down to 10.2
after the new buildings will be delivered in 2015.
Maintain moderate leverage with net debt to cap around 55-60%.
Maintain a visible revenue stream: 74% voyage days fixed for 2014, 41% for 2015
Maintain cost efficient operations with the lowest breakeven operating cost in the industry
* Including 4 tankers

Fleet Development
Current fleet of 38 LPG vessels, 3 product tankers and 1 aframax tanker
Contracted 17 eco-type LPG vessels
Investments in modern vessels and newbuilding LPG carriers
3
6
3
50
55
60
3
37 37 3740 42 42 42 43 44 46 47
50
56591 1
21
3
25
30
35
40
45
FY
2011
FY
2012
Q1
2013
Q2
2013
Q3
2013
Q4
2013
Q1
2014
Q2
2014
Q3
2014
Q4
2014
Q1
2015
Q2
2015
Q3
2015
Q4
2015

2013 Q4 Income Statement
In US$ 000, except per share amounts
Q4 2012 Q4 2013 12M 2012 12M 2013
Net Revenues $30,586 $32,033 $119,213 $121,482
Voyage Costs 3,855 3,319 12,703 14,302
Running Costs 7,734 10,009 30,592 36,523
Drydocking Costs 22 704 2,067 3,160
Operating Income 9,845 7,681 39,291 29,110
4
Net Income 7,759 5,532 28,958 21,217
Net Income, adjusted
6,740 5,205 24,209 18,668
EBITDA 18,190 16,166 71,516 62,618
EPS 0.38 0.17 1.41 0.75
EPS, adjusted 0.33 0.16 1.18 0.66
Number of Shares, diluted
20,552,568 32,052,568 20,552,568 28,271,746

Balance Sheet
December 31, December 31,
2012 2013
Cash and Cash Equivalents incl. restricted 42,273,000 86,218,517
Current Assets excl. cash 6,649,752 8,040,162
Advances for vessels under construction 19,321,045 70,577,435
Vessels, net 634,634,671 677,022,902
Other assets 1,519,908 3,199,349
Total Assets 713,039,031 850,984,743
5
Total Assets 713,039,031 850,984,743
Current portion of long term debt 35,787,544 72,874,472
Current Liabilities 20,021,170 21,702,603
Long Term Debt 309,564,768 279,994,150
Other Liabilities 5,632,107 3,714,599
Stockholders' Equity 342,033,442 472,594,443
Total Liabilities and Stockholders Equity 713,039,031 850,984,743

2013 Q4 Operating Highlights
Fleet Data Q4 2012 Q4 2013 12M 2012 12M 2013
Average number of vessels in fleet 37 42 36.9 39.4
Period end number of vessels in fleet 37 42 37 42
Total calendar days for fleet 3,404 3,864 13,494 14,399
Total voyage days for fleet 3,401 3,820 13,342 14,196
Fleet utilization 99.90% 98.90% 98.90% 98.60%
Total charter days for fleet 2,817 3,365 11,531 11,896
Total spot market days for fleet 584 455 1,811 2,300
* Assuming no vessels on Bareboat Charter
6
Fleet operational utilization 95.50% 94.90% 95.40% 92.30%
Average Daily Results (in $) Q4 2012 Q4 2013 12M 2012 12M 2013
Time Charter Equivalent – TCE 9,532 9,193 9,699 9,083
Vessel Operating Expenses 3,889 4097 4056 4255
Management Fees 325 338 320 334
General & Administrative Expenses 202 239 210 196
Total Vessel Operating Expenses 4091 4336 4266 4451
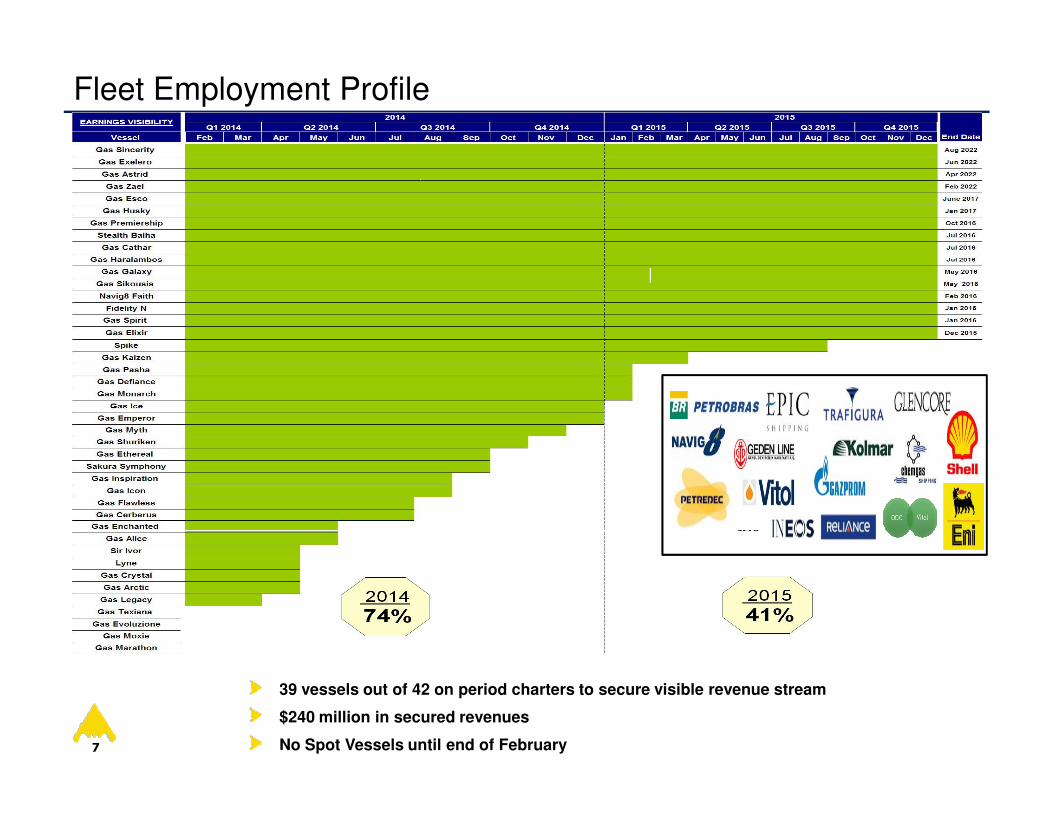
Fleet Employment Profile
7
39 vessels out of 42 on period charters to secure visible revenue stream
$240 million in secured revenues
No Spot Vessels until end of February
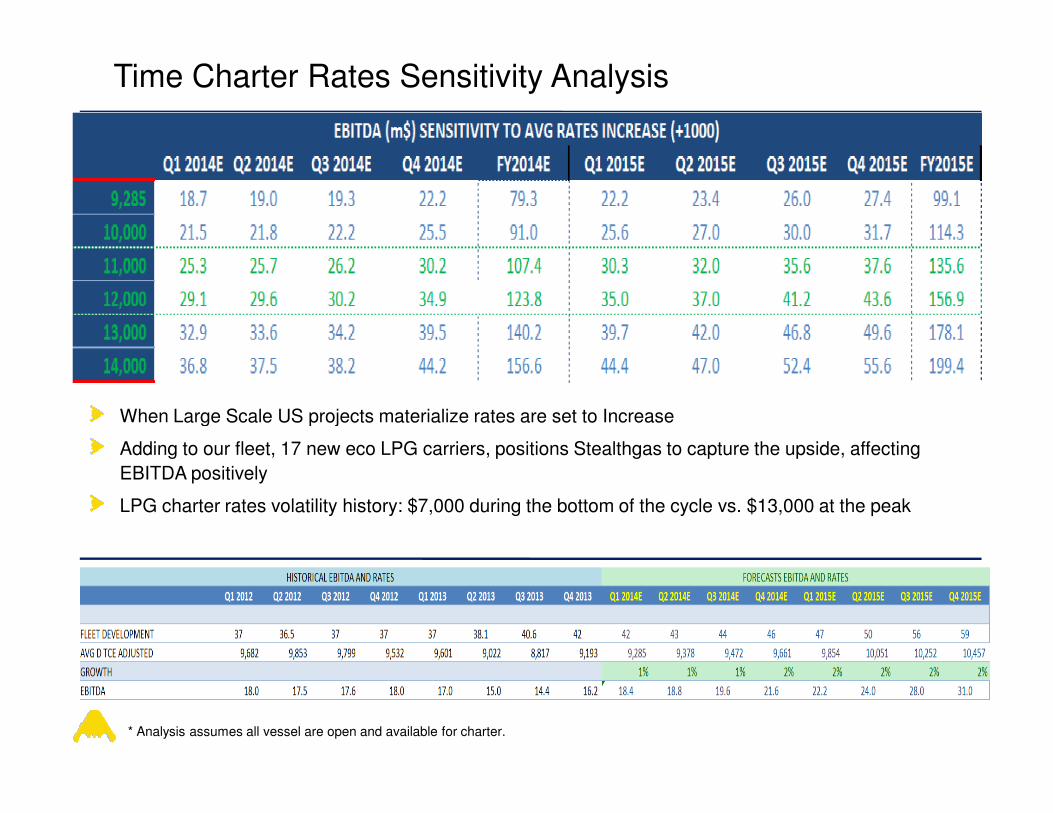
Time Charter Rates Sensitivity Analysis
When Large Scale US projects materialize rates are set to IncreaseWhen Large Scale US projects materialize rates are set to Increase
Adding to our fleet, 17 new eco LPG carriers, positions Stealthgas to capture the upside, affecting
EBITDA positively
LPG charter rates volatility history: $7,000 during the bottom of the cycle vs. $13,000 at the peak
* Analysis assumes all vessel are open and available for charter.

What is LPG? StealthGas Seaborne Trade Model
Natural Gas (LNG) Production (~60%)10% is LPG
Commercial/Residential (52%)
Industrial (9%)
StealthGas hub and spoke model
LPG is the World’s Most Multi-Purpose Energy: accessible, environmentally friendly, available supply, less expensive than other fuel sources
9
Crude Oil Refining (~40%)3% is LPG
Engine Fuel (8%)
Refinery (6%)
Other(2%)
VLGCs transport LPG on longhaul trade vs StealthGas does regional trade and transports LPG/Petchem
Currently ~60% of our ships trade in the Far East, ~30% in Europe and ~10% in the Gulf of Mexico / Caribbean

U.S. Shale Gas - The Game Changer
U.S. Net Exports of LPG 2013 -2017E
• EIA projects that the U.S. will continue to be a net exporter of LPG through 2017, mainly because of continued increases in natural gas and oil production.
10
Incremental demand for LPGs should largely originate in Asia, tied to the buildout of new PDH plants and ethylene plant expansions in China, and overall economic growth in the region
The United States will likely compete with the Middle East for market share to meet the growing LPG import requirements of the Far East.
Global LPG Trade
Large Scale U.S. Export Projects Increase Average Sailing Distances
Source: Clarkson, GHS

Limited LPG Fleet Growth
2
% Undersupplied Market Estimates (cb.m)
11
Our niche LPG shipping segments remains undersupplied
Future deliveries will be absorbed by the LPG Seaborne demand in the market
2
Source: Clarkson Research Services Limited, IHS Global insight, Danish Ship Finance, Jefferies Estimates

Limited Handy LPG Fleet Growth
Orderbook as % of Fleet
2
Age Profile
12
Our niche LPG shipping segments remains smaller than other sector
More than 26% of the 1,000 – 12,999 cbm fleet is 26+ years old
Small orderbook and strong demand dynamics support stable charter rates
2
Source: Banchero Costa, Clarksons Research Services amd Barlcays Research estimates

$0
$500
$1,000
$1,500
$2,000
$2,500
'00 '01 '02 '03 '04 '05 '06 '07 '08 '09 '10 '11 '12 '13
5k CBM Pressurized (Trading East) Tanker Earnings Dry Bulk Earnings
LPG Timecharter Rates Historically Less Volatile
($ Thousands / Month)
2
Limited LPG Fleet Growth Has Led to Greater Charter Rate Stability
'00 '01 '02 '03 '04 '05 '06 '07 '08 '09 '10 '11 '12 '13
13
LPG time charter rates have remained far more stable than those of peer sectors
LPG time charter rates have remained far more stable than those of peer sectors
The small orderbook and strong demand dynamics support stable charter rates and high utilization
LPG charter rates volatility history: $7,000 during the bottom of the cycle vs $13,000 at the peak
Average all inclusive Breakeven is at ~$6,000
Source: Clarksons Research Services

Q & AQ & A

Appendix – Listed Companies Comparables

Contacts
Weekly LPG Market Report updated every Monday
Comprehensive Investor Relations Information
Visit our Website at: www.stealthgas.com
Company Contact:Stavros PapantonopoulosFinance ManagerStealthGas Inc.011-30-210-6250-001E-mail: [email protected]