Embed Size (px)
Citation preview

Institutional Presentation
TIM PARTICIPAÇÕES
4th QTR 2014

• Global Telecom Landscape 4
• Brazilian Telecom Landscape 6
• TIM Brasil 10
• TIM’s Strategy 16
• Operational Data 20
Network Evolution 25
Fixed Business 29
• Regulatory Update 33
• Financial Data 36
• Perspectives 39
AGENDA
*Click on the page number to access the section

Global Telecom Landscape

240%
182%
173%
161%
158%
141%
Hong-Kong
Finlândia
Rússia
Portugal
Singapura
Brasil
189
138
71
29
26
EUA
China
Japão
Brasil
Reino Unido
1,278
927
349
283
257
China
Índia
EUA
Brasil
Indonésia
68%
65%
63%
59%
50%
32%
Japão
Hong Kong
Coréia
Austrália
Nova Zelândia
Brasil
73%
70%
69%
69%
64%
34%
Hong Kong
Noruega
Singapura
Coréia
Dinamarca
Brasil
57
49
47
46
41
9
Canadá
EUA
Noruega
Suíça
Japão
Brasil
GLOBAL LANDSCAPE
O Brazilian market is reaching maturity but there is still room for user profitability and the main opportunity is in data
Customer Base Ranking (Mln)
Service Revenues Ranking (U$ Bln)
4th 4th
Data / ARPU Ranking (%)
25th
Mobile Penetration Ranking (%)
14th
ARPU Ranking (U$)
38th
Smartphone Penetration Ranking (%)
28th
4
India
USA
Brazil
Indonesia
USA
China
Japan
Brazil
United Kingdom
Japan
Hong Kong
Korea
Australia
New Zeland
Brazil
Hong Kong
Finland
Russia
Portugal
Singapore
Brazil
Source: Merrill Lynch – Global Wireless Matrix 4Q14 (3Q14 data) | Top 5 + Brazil
Canada
USA
Norway
Switzerland
Japan
Brazil
Hong Kong
Norway
Singapore
Korea
Denmark
Brazil

Brazilian Telecom Landscape

51.9 51.6 53.5 55.6
64.8 69.9 72.4 71.9
2011 2012 2013 2014
43.0 44.3 44.9 45.0
242.2 261.8 271.1 280.7
16.5 19.0 21.7 23.4 12.7 16.2 18.0 19.6
314.4 341.3 355.7 368.7
2012
BRAZILIAN LANDSCAPE| TELECOM OVERVIEW Customer Base (R$ Mln)
Total Net Revenues (R$ Bln)
2014 / 2013
Fixed, data and TV
Mobile
Total
2011 2012 2013 2014
Mobile 77.0% 76.7% 76.2% 76.1%
Fixed 13.7% 13.0% 12.6% 12.2%
Fixed broadband 5.2% 5.6% 6.1% 6.3%
Pay TV 4.1% 4.7% 5.1% 5.3%
2014 / 2013
Fixed
Mobile
Fixed broadband
Total (fixed + mobile)
Pay TV
2014 2011 2013
2011 2012 2013 2014
Mobile 55.1% 57.5% 57.5% 56.4%
Fixed, data and TV 44.1% 42.5% 42.5% 43.6%
6
117.6 121.5 125.9 127.5
In 2014, the mobile market generated R$ 71.9 billion in revenues (56.4% of total). Fixed broadband and pay TV access gained share in the total market
Source: Anatel, Operator’s balance and Teleco website Notes: Total market base | Main operators revenues | Oi’s and Claro’s adjusted revenues

TIM represents 26% of the industry mobile revenue2 while has 28% of the market share
BRAZILIAN LANDSCAPE|MAIN GROUPS
7
TIM
Source: Anatel and Players balance sheet
Vivo
Claro Oi
Mobile Fixed1 Fixed BB Pay-TV Group
Customers 4Q14 (000´s) 74,721 657 153 n.a. 76,531
Market share 4Q14 27.0% 1.4% 0.5% n.a. ---
Net Adds 12M (000´s) 2,289 25 64 n.a. 2,378
Net Revs FY14 (R$ Mln) 18,919 579 19,498
ARPU 4Q14 18.0 n.a. n.a. n.a. ---
Mobile Fixed1 Fixed BB Pay-TV Group
Customers 4Q14 (000´s) 79,938 10,939 4,102 770 95,749
Market share 4Q14 28.5% 23.9% 17.1% 3.9% ---
Net Adds 12M (000´s) 2,693 502 -205 176 2,665
Net Revs FY14 (R$ Mln) 23,740 11,260 35,000
ARPU 4Q14 24.6 n.a. n.a. n.a. ---
Mobile Fixed1 Fixed BB Pay-TV Group
Customers 4Q14 (000´s) 71,107 11,519 7,523 10,182 100,331
Market share 4Q14 25.3% 25.2% 31.4% 52.0% ---
Net Adds 12M (000´s) 2,403 1,463 941 525 3,868
Net Revs FY14 (R$ Mln) 13,078 22,525 35,603
ARPU 4Q14 15.3 n.a. n.a. n.a. ---
Mobile Fixed1 Fixed BB Pay-TV Group
Customers 4Q14 (000´s) 50,918 16,692 6,554 1,303 75,467
Market share 4Q14 18.1% 36.5% 27.3% 6.7% ---
Net Adds 12M (000´s) 702 -1,742 20 474 1,196
Net Revs FY14 (R$ Mln) 9,290 19,132 28,422
ARPU 4Q14 17.4 n.a. n.a. n.a. ---
The mobile segment represents 78% of the industry access growth
1 - Fixed Access numbers refers to 3Q14
Fixed / Mobile Fixed BB Fixed voice & BB / TV Mobile
Fixed BB/ TV Fixed Mobile Fixed / Mobile
/ 2 - Mobile revenue considers only the 4 major players

MOBILE MARKET | OVERVIEW
Source: Anatel, IBGE
Regional Overview (Dec/14)
Penetration per Estate
(Dec/14)
8
68.1 26.8 24.8 18.7 16.6 15.4 13.0 11.7 9.3 8.9 9.1 6.9 6.7 5.2 4.4 4.7 4.7 4.2 3.8 4.2 4.2 2.7 2.4 2.0 0.9 0.9 0.5
154%
129% 150%
123%
147% 138% 140% 131%
115% 136% 134%
241%
97%
131% 113%
146% 137%
107%
145% 131% 125% 120%
139% 134% 114% 123%
102%
SP MG RJ BA RS PR PE CE PA GO SC DF MA PB ES MT RN AM MS PI AL SE RO TO AC AP RR
Base Móvel (MM) Penetração (base/pop)
TIM vice líder em Market Share
TIM líder em Market Share
A1 e A2: SP
* Population 44.2 Mln
* Mobile Base 68.1 Mln
* Penetration 154.1 %
* TIM Market Share 27.8 %
A3: RJ/ES
* Population 20.4 Mln
* Mobile Base 29.2 Mln
* Penetration 142.9 %
* TIM Market Share 15.1 %
A4: MG
* Population 20.8 Mln
* Mobile Base 26.8 Mln
* Penetration 129.0 %
* TIM Market Share 26.7 %
A5: PR/SC
* Population 17.9 Mln
* Mobile Base 24.4 Mln
* Penetration 136.7 %
* TIM Market Share 51.5 %
A6: RS
* Population 11.2 Mln
* Mobile Base 16.6 Mln
* Penetration 147.4 %
* TIM Market Share 13.5 %
A7: CO
* Population 19.4 Mln
* Mobile Base 29.7 Mln
* Penetration 153.6 %
* TIM Market Share 15.8 %
A8: NO
* Population 20.1 Mln
* Mobile Base 21.6 Mln
* Penetration 107.3 %
* TIM Market Share 31.8 %
A9: BA/SE
* Population 17.4 Mln
* Mobile Base 21.4 Mln
* Penetration 123.1 %
* TIM Market Share 21.4 %
A10: NE
* Population 32.1 Mln
* Mobile Base 42.9 Mln
* Penetration 133.7 %
* TIM Market Share 33.1 %
Mobile Base (Mln) Penetration (base/pop)
TIM: Market share leader
TIM: 2nd position in market share

TIM Brasil
A SOLID HISTORY OF GROWTH TIM’s Position
1998 2003 2009 2014
CAGR+9%
CAGR+7% CAGR
+10%
20
25 28
30 29
2010 2011 2012 2013 2014
51
64 70 73 76
2010 2011 2012 2013 2014
4.2 4.7
5.0 5.2 5.5
2010 2011 2012 2013 2014
10
Gross Revenues (R$ bln)
Customer Base EoP (mln customers)
EBITDA (R$ bln)
Long Distance
Leader
2nd in Market Share Overall
Smartphone
Sales Leader
Prepaid
Leader
1 2 1 1

KNOWING TIM BETTER TIM: A Huge Brazilian Company
74.7 million customers (27% Share)
The 2nd Player - Market and rev. share
More than 465,000 points of sales
More than 170 own stores
15 Customer Care Centers (16k attendants)
~14,000 antennas
3,433 cities covered
95% of urban population covered
54,000 km of optical fiber network
~13,000 employees
23,000 indirect jobs
R$3.9 billion invested in 2014 (excluding licenses)
Sales
Network
Social & Economic
TIM Celular S.A. Intelig
100%
TIM Brasil Serv. e Part. S.A. Free Float
Telecom Italia International N.V.
Telecom Italia
100%
TIM Participações S.A.
ON: 33% (809,062,533) ON: 67% (1,611,969,946)
100% 100%
Purpose
Care about the costumer
Transparency
15,000 km of optical fiber
5,500 km of optical fiber
Recent Acquisions
Commitment
Innovation Agility
Values
11
Shareholders’ Structure
Presence in Brazil since 1998
16th largest Private Company in Brazil (source: Exame Magazine – 2013)
Approximately R$25 billion of Market Capitalization
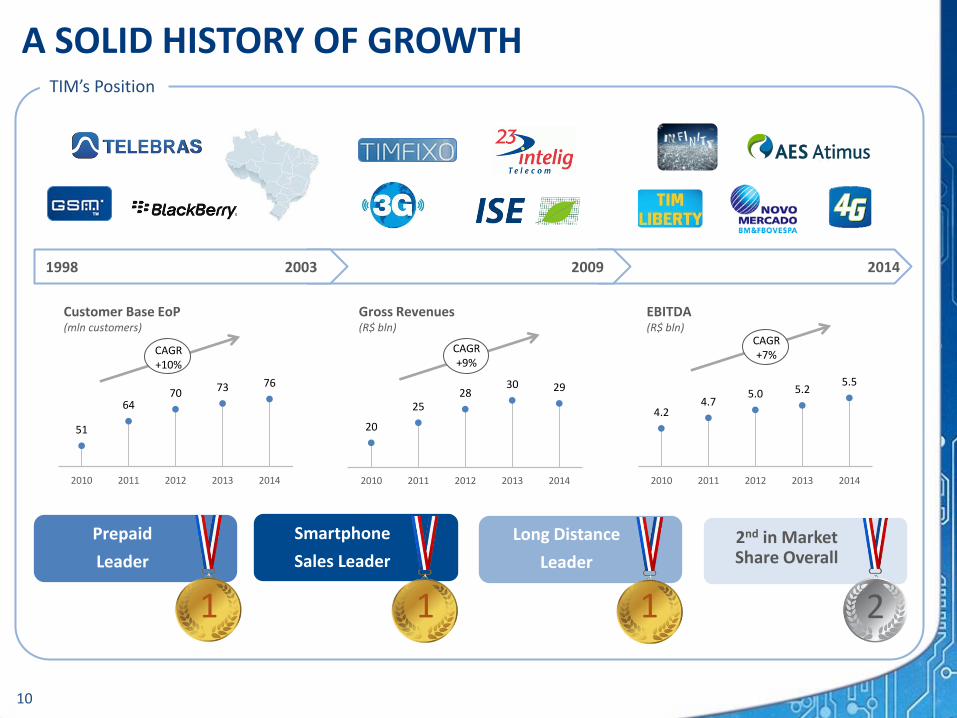
CORPORATE GOVERNANCE
12
Novo Mercado:
1) Equal rights:
o Vote
o Dividends
o Tag along
2) Higher liquidity
o Single class of share
3) Greater independence of BoD (at least 30%)
4) Strick disclosure policy
Statutory Audit Commitee:
o Report to BoD
o Oversight financial reporting
o Analyze anonymous complaints
o More independent supervision on company activities
Brazilian Laws
“Lei das S.A”
Legal Requirements
Demand for transparency and
disclosures
Highest level of Corporate
Governance Requirement of protection for
minority shareholders
Level 1 Level 2
Novo Mercado and Statutory Audit Committee
Unique Telco company listed on the Novo Mercado
TIM stands out in Latam telco space
Single class of share (Ordinary)
BoD independent members
100% Tag Along
Public offer in case of de-listing

In public schools
84,000 children and 2,700 professors
In museums and science and technology centers
More than 70,000 people
In public administration
Participatory Urban Caretaker
o 4 municipalities
Cultural maps
o 7 municipalities and RS & CE government
In the federal institutions of professional and technological education
TIM Tec
o MOOC platform
Partnership with 5 federal institutes
CORPORATE SOCIAL RESPONSABILITY
Founded in July, 2013
We are committed to creating and strengthening resources and
strategies for the democratization of science and innovation that
promote human development in Brazil, with mobile technology as
one of the main facilitators.
MISSION:
Commitment with the 2014-16 Social Investment Plan: R$45 million
President: Manoel Horacio F. da Silva
Director: Mario Girasole
13
Joined UN Global Compact in 2008
Member of ISE (Sustainability Index)
for 7 consecutive years
Member of ICO2 (Efficient Carbon Index) for 5 consecutive years
ISO 14001 certified since 2010, 1st Brazilian
telco Sustainability
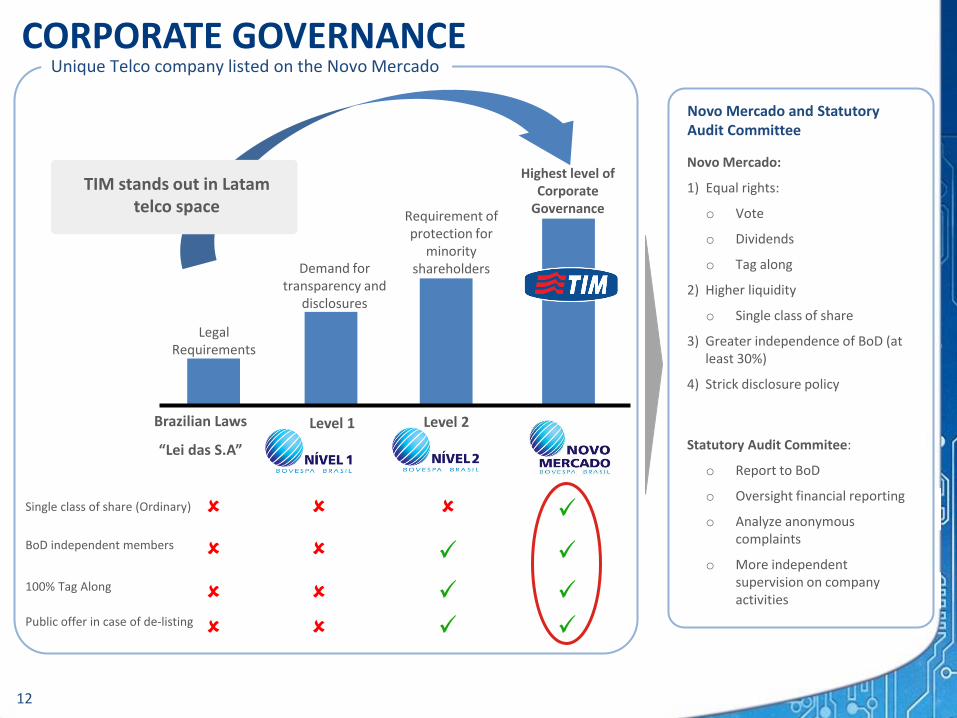
TRANSPARENCY | PORTAS ABERTAS INICIATIVE
14
Portas Abertas Website www.tim.com.br/portasabertas
Portas Abertas Mobile app
App for mobile devices available at Apple Store and Google Play
Disclosure of Anatel’s Plan
Monitoring: o Network improvements
o Quality KPI’s
o Network incident and alerts
Real coverage footprint
New and Planed Antennas/Towers
Wi-Fi hotspots

TIM’s Strategy

Strategic Planning
TIM as a protagonist
Customer base appreciation
Quality mobile broadband (MBB)
infractructure
Strategic Options
STRATEGIC GUIDELINES
Differentiation in offerings, channels,
content and data applications
Take care of the customer experience
OneTIM project (best place to work)
16

MARKET: MOVING TOWARDS MOBILE DATA USAGE
17
Revenue Mix
Revenue Mix
27%
Mobile Market Revenues Evolution (Mobile Service Net Revenues; %)
• Most households without internet access • Mobile better suited to break price barrier
9.5
2.6
Jan-13 Nov-14
0.34 0.30 0.23
0.16 0.10 0.06 0.03 0.02
2012 2013 2014 2015 2016 2017 2018 2019
57%
4%
12%
1%
37%
2%
MTR Cut (R$)
Voice Incoming
Voice Outgoing
SMS
Internet 60%
• Maturing market: Customer base growth slowdown
• Consumption migrating from voice to data
2010 2020
SMS Traffic Sharp Decrease (billions of SMS sent)
Mobile Internet is the growth driver and will be the largest mobile market, although Voice remains important
Voice Decline
Internet Opportunities
Internet Market Evolution
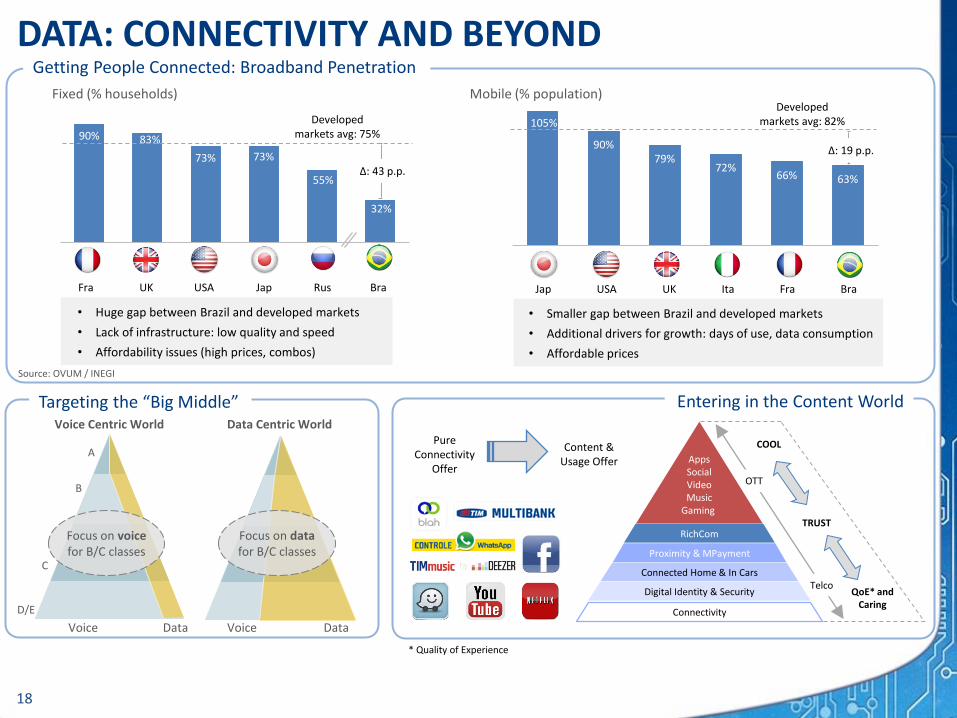
DATA: CONNECTIVITY AND BEYOND
18
105%
90% 79%
72% 66% 63%
• Huge gap between Brazil and developed markets
• Lack of infrastructure: low quality and speed
• Affordability issues (high prices, combos)
• Smaller gap between Brazil and developed markets
• Additional drivers for growth: days of use, data consumption
• Affordable prices
90% 83%
73% 73%
55%
32%
Fixed (% households) Mobile (% population)
Content & Usage Offer
Pure Connectivity
Offer
Developed markets avg: 75%
Developed markets avg: 82%
Connectivity
Proximity & MPayment
Connected Home & In Cars
RichCom
OTT
Telco
COOL
TRUST
QoE* and Caring
Fra UK USA Jap Rus Bra Jap USA UK Ita Fra Bra
Δ: 43 p.p.
Δ: 19 p.p.
* Quality of Experience
Getting People Connected: Broadband Penetration
Entering in the Content World
Apps Social Video Music
Gaming
Digital Identity & Security
A
B
C
D/E
Voice Centric World Data Centric World
Data Data Voice Voice
Focus on voice for B/C classes
Focus on data for B/C classes
Targeting the “Big Middle”
Source: OVUM / INEGI

Operational Data

MAIN OFFERS Postpaid
TIM Pay Express: pay for purchases and receive payments
through mobile phone
Fast and safe platform
v
Hibrid Plan Other Services
20
Prepaid
o Unlimited local and long distance calls (using 41 code) to TIM customers
o Unlimited calls to radios for R$12.90/month used
o Package of minutes to other operators and fixed numbers (in accordance with the chosen plan: from 50 to 800 minutes)
o Internet package (in accordance with the chosen plan: from 300MB to 50GB)
o Unlimited SMS to all operators for R$13.90/month used
o Pay per day concept: • R$0.75 to local and long distance (using 41 code) TIM customers • R$0.99 data + SMS • R$0.50 unlimited music through TIMmusic app
+ • R$0.70 per unlimited call to local fixed numbers
o Infinity Web + Torpedo for R$0.75/day used • 10MB of Internet/day with max. speed of 1mbps on 3G network
and 5mbps on 4G network • Unlimited SMS to all operators
o With an unique concept in the market, the plan provides unlimited access to WhatsApp without consuming data from the packed hired
o Additionally to the unlimited WhatsApp access, the plan includes 300Mb of internet, unlimited SMS and R$10 on credits for the total cost of R$29.90/month
o First postpaid plan on the market that does not require a voice package
o A plan that combines postpaid freedom and prepaid control
Brazil’s largest digital music provider
>32 mln downloaded songs
TIM Chip for soccer fans: free content of soccer teams
International long distance plans in the 5 continents
Voice and data usage for a single value per 24 hours of usage

RECENT INNOVATIONS SHOWING RESULTS
Customer Base (mln users)
PREPAID MOBILE ACCOUNT/ MONEY
o Partnership: TIM, Mastercard and Caixa Econômica Federal
o Focus on unbanked population ( >50% of prepaid base)
NEW MUSIC PLATFORM
o Partnership TIM and Deezer (top global streaming platform)
o More than 35 million music available for download
o Maintaining leadership position in the mobile music industry in Brazil
Source: ANATEL
3G Market Share (%; mln users)
4G Market Share (%; thd users)
Source: ANATEL Source: ANATEL
INTERNET SHARING PLANS
o Up to 4 devices
o No additional charges
WEEKLY SERVICE PACKAGE o Voice + Data + SMS o R$ 7 per week
R$ 0.75 DAILY OFFER
o Expansion to new regions: PR, SC, MA, RJ
o Covering most of the country
Adding Value Through Innovation
NEW APP FOR LANGUAGE COURSES o Games and quizzes help
students developing English skills
blah COMMUNICATION APP
o Integrated communication (VOIP, IM, SMS) App
o First ad campaign
21
CONTROLE WHATSAPP PLAN o Unlimited app use for chat,
phoos, videos and audio
41%
39%
31% 30%
17%
20%
11%
8%
23% 25%
24% 26%
37% 34%
12% 13%
76.1 77.2 79.9
70.4 73.5 75.7
65.2
69.0 71.1
49.2 50.5 51.2
4Q12 4Q13
TIM
4Q14
P1
P3
P4
Dec/13 Dec/14
36.2
37.5
49.6
19.3
145 mln
Dec/13 Dec/14
TIM
2.6
2.0
1.3
0.5
6.8 mln
TIM
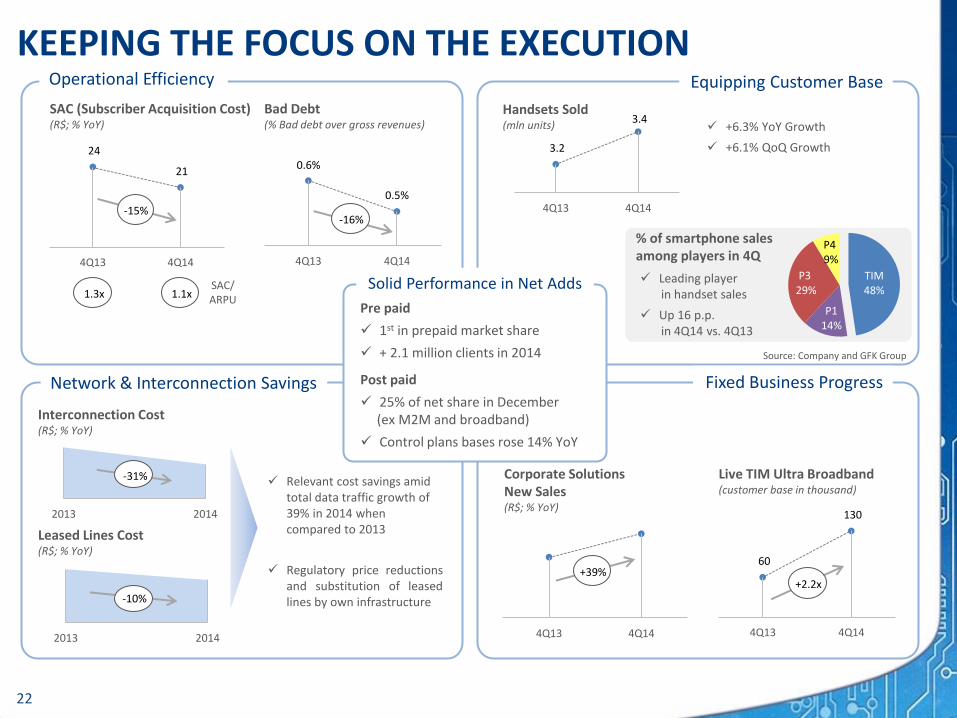
KEEPING THE FOCUS ON THE EXECUTION
22
2013 2014
2013 2014
-31%
Network & Interconnection Savings
Interconnection Cost (R$; % YoY)
Leased Lines Cost (R$; % YoY)
Relevant cost savings amid total data traffic growth of 39% in 2014 when compared to 2013
Regulatory price reductions and substitution of leased lines by own infrastructure -10%
3.2
3.4
4Q13 4Q14
Equipping Customer Base
Handsets Sold (mln units)
% of smartphone sales among players in 4Q
+6.3% YoY Growth
+6.1% QoQ Growth
Source: Company and GFK Group
TIM 48%
P1 14%
P3 29%
P4 9%
Leading player in handset sales
Up 16 p.p. in 4Q14 vs. 4Q13
0.6%
0.5%
4Q13 4Q14
Operational Efficiency
Fixed Business Progress
SAC (Subscriber Acquisition Cost) (R$; % YoY)
Bad Debt (% Bad debt over gross revenues)
SAC/ ARPU
24
21
4Q13 4Q14
-15%
1.3x 1.1x
-16%
Corporate Solutions New Sales (R$; % YoY)
Live TIM Ultra Broadband (customer base in thousand)
4Q13 4Q14
+39% 60
130
4Q13 4Q14
+2.2x
Solid Performance in Net Adds
Pre paid
1st in prepaid market share
+ 2.1 million clients in 2014
Post paid
25% of net share in December (ex M2M and broadband)
Control plans bases rose 14% YoY

MAINTAINING STRONG PACE IN DATA
...Remodeling the Business Profile
% over revenues
Strong Progress on Data...
+22% +20% +23% +28%
40 mln to come! 34 mln data users
Customer base: 75.7 mln
20 mln of untapped market
Usage Growth
Penetration Increase
13 mln w/ enabled devices
Data Opportunities on Data in the Customer Base
23
Data Customer Base (as % of total base)
Smartphone Penetration (% of smartphones over customer base)
14.9%
29.4%
49.5%
2012 2013 2014
Smartphone sales over 80% in 4Q14
+35 p.p.
30.3%
36.4%
44.6%
2012 2013 2014
1Q14 2Q14 3Q14 4Q14
Mix of Gross Data Revenues (% YoY)
SMS
Web
Content & Others
+29% +39%
+45% +80%
+33%
+72%
+47%
+82%
1,500 1,578 1,677 1,862
+1.2% -19% -8.2% -24%
Data ARPU (% YoY Growth)
18%
20% 21%
25%
1Q14 2Q14 3Q14 4Q14
+7.2 p.p
Data Revenues Penetration (% Gross VAS Revs / Gross Mobile Service Revs )
25.2%
27.2%
28.7%
30.9%
1Q14
2Q14
3Q14
4Q14

Network Evolution

...UNDERSCORING QUALITY IMPROVEMENT
25
3,093
3,013
2,930
2,845
TIM P4 P3 P1
Source: Anatel
Source: Company’s survey of national satisfaction
TIM
P1 P3 P4
Customers Satisfaction
¹ Voice Network (repair and call completion) ² Data Network: Estimated by TIM and composed by a subset group of Additional Services complaint
Total Demands at Consumer’s Protection Agency (Procon) (Per economic group, in thousands)
Source: SENACON/MJ
10.6 14.0
23.6 27.2
42.2 46.3
21.4
28.0
4Q13 1Q14 2Q14 3Q14 4Q14
TIM
P1
P3
P4
Data Evolution
Data Accessibility Ranking (3G) in SP
4G Sites in State Capital Cities
Anatel
Average Satisfaction with Coverage and Quality of Calls (score assigned by the customer)
Least claimed company at
Procon
7.80 7.80
Nov-12 May-13 Nov-13 May-14 Nov-14
Network Complaints (number of complaints)
Voice network¹
Data network²
1Q13 2Q13 3Q13 4Q13 1Q14 2Q14 3Q14 4Q14
Voice network 2014 vs. 2013
-27%
Data network 2014 vs. 2013
-11%
Anatel Metrics
Customers Demands
Source: Anatel
Access
Anatel
Access
Access
Access
Access
99.24%
98.93%
99.20%
99.57%
98.88%

INFRASTRUCTURE EVOLUTION…
26
2.5 GHz 2.1 GHz
1.8 GHz 850 MHz 700 MHz
radius (km)
0.458 0.61
Innovative Coverage
Investment Profile
Site Densification
Cell coverage characteristics (Urban coverage simulation)
Capital allocation on innovative services:
Fiber (metropolitan + LD): expansion to ~55k Km in 2014
2G (voice)
3G+4G (data)
Number of 4G Sites Number of 3G Sites
4Q13 4Q14
1.9k
3.7k
4Q13 4Q14
9.1k
10.4k
Indoor coverage deployment
DAS (Distributed Antenna Systems) Solution
Femto Cells (corporate)
Wifi (consumers)
+92% +14%
R$3.9 bln Organic Capex +
R$2.9 bln (4G License & Clean up)
=
R$6.85 billion in 2014
Deployment in:
0.363 1.413 1.685
Rio de Janeiro Curitiba Brasília Manaus Natal São Luís
51%
87%
49%
13%
2013 2014
Band 850 MHz 900 MHz 1800 MHz
2100 MHz
2500 MHz
700 MHz
Possible Technologies
2G/3G 2G/3G 2G/4G 3G 4G 4G
Efficient Use of Spectrum Portfolio
Wifi and Small Cells
> 100% YoY
Fistel exemption
approved in Jan/15
Mobile Broadband Evolution (cities)
The 125 cities of the MBB project
represent 50% of the total network
traffic 39
53
66
83
125
4Q13
1Q14
2Q14
3Q14
4Q14
STATE OF THE ART CAPEX ALLOCATION: QUALITY TO INCREASE RETURNS
27
2014 Actual 2015 Bdg 2016 Plan 2017 Plan
MBB Project Geographic Area
Small Cells
New Macro Sites
WiFi / Femto / DAS • 3,000 WiFi in 2015 • >150 DAS in 2015
1,137 cities prioritized due to business relevance, based on IRR and Payback
HetNet
% of Urban Covered Population
2G
3G
4G
2014a 2015e 2016e 2017e
MBB program is addressing >70% of TIM's business, and is the key investment program in 2015-2017
High business concentration in few cities allows for a focused infrastructure enhancement program
1.9k 3.7k
>15k
2013a 2014a 2015e 2016e 2017e
Number of 4G Sites
9.1k 10.4k >14k
2013a 2014a 2015e 2016e 2017e
Number of 3G Sites
0.7k 1.5k
5k
2013a 2014a 2015e 2016e 2017e
Number of Wifi & Small Cells
2G
3G
4G
95% 95%
78% 79%
27%
86%
2013a 2014a 2015e 2016e 2017e
Network Rollout New Coverage Strategy
Technology Capex Allocation TIM LD Backbone
1.4k
3.9k
2015e 2017e
New Small Cells
0.8k
3.5k
2015 2017
+2.8x
+4.3x

Fixed Business

TRANSFORMING THE FIXED INFRASTRUCTURE
29
SP
Rio
National fiber Backbone: 10 POPs and 14,500 km
National Voice Backbone: 9 switching voice centrals and 150 interconnection points
International Interconnection: two nodes in RJ and SP managing international traffic
Satelite networks links in 9 cities
AES Atimus acquisition in 2011, later called TIM Fiber
Extensive optical fiber network with 5.5 thd km
Coverage in metropolitan areas of RJ and SP
Potential market of 8.5 million households and 550 thd
companies in 21 cities
Central Switch Fiber Network Satelite Station Central ATM and IP network Submarine cable MAN – Metropolitan Network Presence
Intelig Atimus

ACCELERATING FIXED BUSINESS PERFORMANCE
30
2013 2014
3.4
3.3
2.9
Live TIM
GVT
NET
4Q13 4Q14
2014 business remodeling recap:
Customer base management
Multiservice network launch
Sales team reorganization
Brand repositioning
Re-designed service portfolio
Fixed + mobile integration for corporate clients
2013 2014
+3.5x
EBITDA Net Revenues (with intercompany)
Revenues from New Sales (YoY)
Outstanding product performance… (ISP speed ranking - Mbps)
…with solid operational and financial results
60
130
4Q13 4Q14
Customer Base (000 users)
+2.2x
ARPU (R$; YoY%)
+24%
New Line Payback (months)
21
14
4Q13 4Q14
1
15.9
8.9
8.8
Live TIM
NET
GVT
37
21
Download
Upload
1
1,490
2,194
1,069
1,503
4Q13 4Q14
Coverage (000 Households)
+41%
Addressable Households
Homes passed
+1.0%
2013 2014
+2.7x
-33%

FIXED CORPORATE SOLUTIONS & LIVE TIM POSITIVE TRENDS
31
60k
130k
>500k
2013a 2014a 2015e 2016e 2017e
2013a 2014a 2015e 2016e 2017e
Customer Base (thousands customers)
EBITDA Revenues from New Sales (R$; YoY)
2013a 2014a 2015e 2016e 2017e
FIXED
MOBILE
CONVERGED SOLUTIONS
2015-2017 Drivers:
• Revenue and EBITDA rebound
• Sales team resizing and training
• Customer care unification (F+M)
• Improvement on service level
• Fine tuning mobile portfolio
• Launch of new convergent solutions
+9x
Investments (R$; YoY)
2013a 2014a 2015e 2016e 2017e
+3x +9x
From option value to reality:
• Accelerate growth through incremental investment
• Focus on keeping customer experience leadership
• Introduction of new services (Voice and Bluebox)
• Support the discussion on “Banda Larga Para Todos” program
Corporate Solutions as a Sustainable Business
Live TIM Plan: Accelerating Growth

Regulatory Update

MAIN REGULATORY TOPICS FOR 2015
33
Internet “Marco Civil da Internet” (Brazilian Civil Rights Framework for the Internet): Law nº. 12,965 provides Decrees/Regulations on topics such as net neutrality and privacy. Public Consultations will be launched involving the Comitê Gestor da Internet (CGI), MinCom and ANATEL
Broadband “Programa Banda Larga para Todos” (Broadband for All) and review of PGMU (Universal Service goals): The President Dilma intends to launch a universal broadband program, with 90% of households connected at 25Mbps.
Licensing “PL das Antenas” (SCD 293): Approved by the House of Representatives. Still needs to be voted in the Senate. Main points: simplification of licensing in environmental bodies and municipal governments; 60 days “positive silence”; right of passage in public lands.
Exemptions
Fistel (Law nº. 13.097/2014): Enacted on 20.01, by President Dilma Rousseff. FISTEL full exemption for Small Cells with power <5W and reduction to 10% with power <10W. REPNBL: Regulates tax exemption for Telecommunications Network Deployment. Update approved by Minicom on 01.14.2015, reducing the % of national technology.
Regulatory evolution
“Revisão do modelo de Concessão de STFC”: Asset reversibility and duration, Universal Service (Presidential Decree nº. 7.512/2011): possibly relieving voice universal service goals, changes in Law nº. 9.472/1997 (General Telecommunication Law), extending the concession beyond 2025.
Spectrum 1,800 MHz Renewal: Anatel approved the renewal process for the 1,800 MHz band for an additional period of 15 years.

LTE AUCTION DETAILS
34
1st Round (10+10) MHz cap
Block 4 (10+10) MHz
Block 5 (10+10) MHz
Block 6 (10+10) MHz
Block 2 (10+10) MHz
Block 3 (10+10) MHz
Block 1 (10+10) MHz Total
R$ mln Regional National
Minimum Price 1,893 30 5 1,928 1,928 1,928 7,712
Winning Bid Unsold 30 Unsold 1,947 1,928 1,947 5,852
Premium - 0.02% - 0.99% 0.00% 1.00% 38
Final Public Price (Anatel) - 26 - 1,739 1,720 1,739 5,224
EAD 887.59 13.86 2.48 903.93 903.93 903.93 3,616
EAD w/ unsold blocks obligations
- 18.9 - 1,119 1,119 1,119 3,616
Clean-up Cost Road Map*
700MHz Auction Results
Auction totaled R$5.85 billion, 24% lower then the R$7.7 billion expected for minimum prices for all blocks
EAD Contribution of R$890.1 million related to unsold blocks will be distributed proportionately among the participants and will be discounted of the Public Price
0.52 0.78 0.83 1.07 1.13 1.18 1.22 1.28 1.29 1.29 1.48
2.58
DEN NZL Spain Brazil GER PORT EUA Taiwan Italy France AUS Canada
Average = 1.22
Oi and Sercomtel did not participate in the auction
Spectrum acquisition at fair price (Price in USD/MHz/Pop. adjusted for GDP)
UPLINK Central Band
TV Channels Guard Band Private Limited Service
4 2 3 1
Central Band 5
6
30% in April 2015
30% in January 2016
30% in January 2017
10% in January 2018
R$1,199 million
~R$360 million
~R$360 million
~R$360 million
~R$120 million
Total Amount:
* Values will be adjusted by the IGP-DI index.

Financial Data
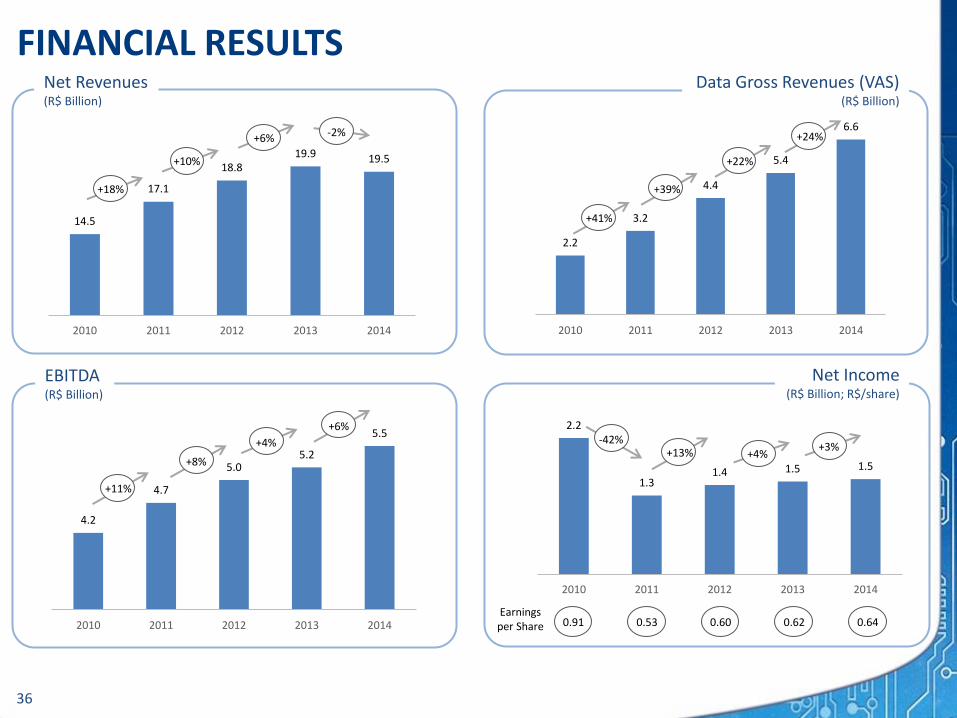
2.2
1.3 1.4 1.5 1.5
2010 2011 2012 2013 2014
4.2
4.7
5.0 5.2
5.5
2010 2011 2012 2013 2014
2.2
3.2
4.4
5.4
6.6
2010 2011 2012 2013 2014
14.5
17.1
18.8 19.9 19.5
2010 2011 2012 2013 2014
Net Income (R$ Billion; R$/share)
EBITDA (R$ Billion)
Data Gross Revenues (VAS) (R$ Billion)
Net Revenues (R$ Billion)
FINANCIAL RESULTS
Earnings per Share
+18%
+10%
+6%
+41%
+39%
+22%
+11%
+8%
+4% -42% +13% +4%
0.91 0.53 0.60 0.62 0.64
36
-2% +24%
+6%
+3%

NET FINANCIAL POSITION DETAILS
37
BNDES 58%
BB 6%
BEI 19%
BofA ML 5%
KFW 4%
Cisco 4%
Others 5%
Higher cash yield and debt cost due to CDI increase in the period Bigger gap between cash yield and debt cost due to smaller cost of new loans
Δ: 62 bps
4,279 4,867
6,507
2,000
2012 2013 2014
Cash & Debt Evolution
Cash Yield vs. Debt Cost (% per year)
Net Financial Position (R$ mln)
BNDES new disbursements
Short term debt
Better Profile: Less Short Term Debt
Debt by Lender in 2014 end (% of total loans)
Debt Position (R$ mln; % of total debt in short term)
Cash Position (R$ mln)
4,431
5,288 1,742
2012 2013 2014
4G payment
5,233
Improved group liquidity margin
9.58% 7.69%
8.58%
9.78%
10.20%
7.09%
9.50%
11.25%
1Q12 2Q12 3Q12 4Q12 1Q13 2Q13 3Q13 4Q13 1Q14 2Q14 3Q14 4Q14
Δ: 147 bps
Cash yield
Debt cost
Excluding 4G payment -151
-421
1,274
-468
Net debt/
EBITDA 12M 0.23x -0.08x -0.03x
2012 2013 2014
20% 21% 21%

Perspectives

32.0%
34.9%
2012 2013 2014 2015e
Delivering important operational and financial results
Strong market positioning for growth
Renewed culture of innovation, quality and caring
Staying power and commitment with long term, with recognized
institutional leadership
Best governance in the industry: Novo Mercado
MBB (cities)
Changing Business Profile Focus on Execution Improving Profitability
Infrastructure Leveraging Growth
Revenue profile changing
Pre-paid data as key source of growth
TIM strategically well positioned with data focus on “big middle”
Business Generated Net Revenues Keeping costs under control, amid macroeconomic pressure
Keeping innovative offers:
• Infinity Day, Data Shared Plans, Controle Whatsapp plan, TIMmusic by Deezer, TIM Multibank (2015), Blue Box (2015)
Fixed turnaround completed: back to growth in 2015
Live TIM: from optionality to reality
TIM: A Solid Player
Building the Future
Tower sale
Big data analysis for Capex allocation
Investing Efficiently
4G LTE in 700MHz and 1,800MHz
EBITDA growth in 2014: +6.4% YoY
Margins expansion through opex savings and new revenues sources
(Voice & Other)
(Data & SMS)
Service EBITDA Margin (%; YoY)
+3.0 p.p.
2013 2014
39
125
Mobile broadband project
+86
2013 2014
74% 69% 64%
26% 31% 36%
2014 CONCLUSION
39

2014a 2017e
Leased Lines Cost (R$)
SAC (Subscriber Acquisition Cost) (R$)
Bad Debt (R$)
EBITDA Evolution (R$ without intercompany)
EBITDA - Capex
2013a 2014a 2015e 2016e 2017e
Data Traffic Expectation
3G Data Traffic
LTE Data Traffic
(in petabytes)
Mobile Customer Base (mln customers)
73.4
75.7
2013a 2014a 2015e 2016e 2017e
2014a 2017e 2014a 2017e
2014a 2015e 2016e 2017e
Business Growth
2014a 2017e
Operational Efficiency
Fixed Business Progress
MTR Path (R$)
0.34
0.02
2012 2014 2016 2018
SMS Market Revenues (R$)
2014a 2017e
Network & Interconnection Savings COST EFFICIENCY
40
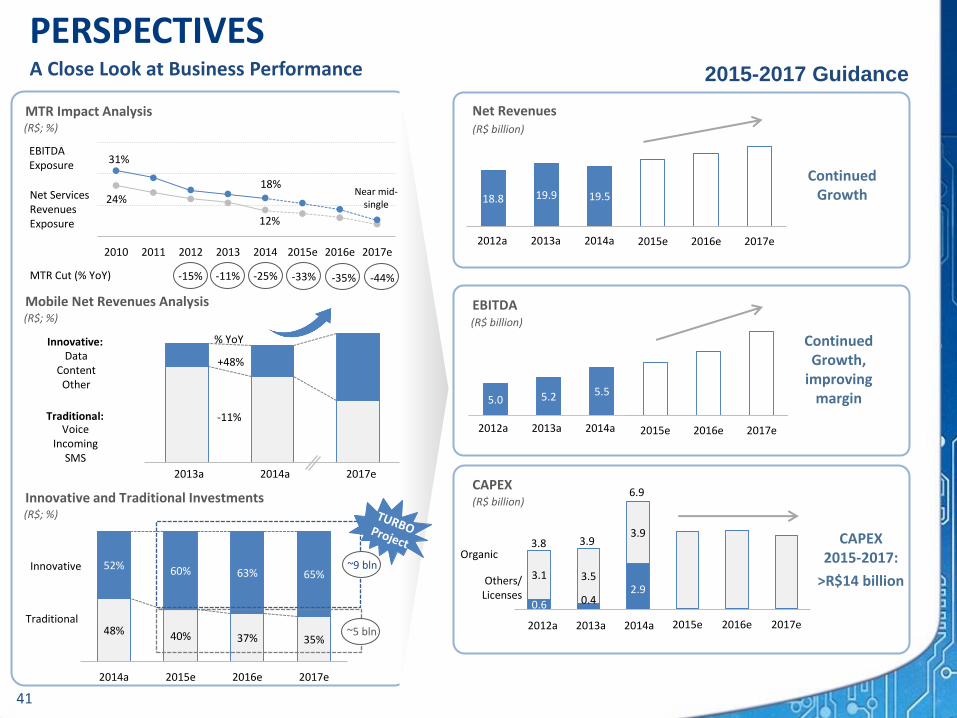
18.8 19.9 19.5
2012A 2013A 2014A 2015e 2016e 2017e
5.0 5.2 5.5
2012A 2013A 2014A 2015e 2016e 2017e
0.6 0.4 2.9
3.1 3.5
3.9
2012A 2013A 2014A 2015e 2016e 2017e
Organic
Others/ Licenses
3.8 3.9
6.9
Continued Growth
Continued Growth,
improving margin
CAPEX 2015-2017:
>R$14 billion
Net Revenues
EBITDA
CAPEX
48% 40% 37% 35%
52% 60% 63% 65%
2014a 2015e 2016e 2017e
Innovative
Traditional
Innovative and Traditional Investments (R$; %)
(R$ billion)
(R$ billion)
(R$ billion)
2015-2017 Guidance
MTR Impact Analysis (R$; %)
Mobile Net Revenues Analysis (R$; %)
A Close Look at Business Performance
24%
12%
31%
18%
2010 2011 2012 2013 2014 2015e 2016e 2017e
-15% -11% -25%
Net Services Revenues Exposure
EBITDA Exposure
-33% MTR Cut (% YoY)
2013a 2014a 2017e
Innovative:
Traditional:
Data Content
Other
Voice Incoming
SMS
+48%
-11%
% YoY
Near mid-single
-35% -44%
~5 bln
~9 bln
2012a 2013a 2014a
2012a 2013a 2014a
2012a 2013a 2014a
PERSPECTIVES
41

Safe Harbor Statements
TIM on the Web
Statements in this presentation, as well as oral statements made by the management of TIM Participações
S.A. (the “Company”, or “TIM”), that are not historical fact constitute “forward looking statements” that
involve factors that could cause the actual results of the Company to differ materially from historical results
or from any results expressed or implied by such forward looking statements. The Company cautions users
of this presentation not to place undue reliance on forward looking statements, which may be based on
assumptions and anticipated events that do not materialize.
TIM website: www.tim.com.br
Investor Relations website: www.tim.com.br/ir
TIM on Twitter: @TIMBrasil
Investor Relations Twitter: @TIM_RI
TIM on Facebook: www.facebook.com/timbrasil
TIM on YouTube: www.youtube.com/timbrasil

43