Embed Size (px)
Citation preview

4finance Investor Presentation
December 2017

2
Disclaimer
While all reasonable care has been taken to ensure that the facts stated herein are accurate and that the forecasts, opinions and expectations contained herein, are fair and reasonable, no representation
or warranty, express or implied, is made as to, and no reliance should be placed on, the fairness, accuracy, completeness or correctness of the information, or opinions contained herein. Neither 4finance
nor any of 4finance`s advisors or representatives shall have any responsibility or liability whatsoever (for negligence or otherwise) for any loss howsoever arising from any use of this document or its
contents or otherwise arising in connection with this document. The information set out herein may be subject to updating, completion, revision, verification and amendment and such information may
change materially.
This presentation is based on the economic, regulatory, market and other conditions as in effect on the date hereof. It should be understood that subsequent developments may affect the information
contained in this document, which neither 4finance nor its advisors are under an obligation to update, revise or affirm.
The distribution of this presentation in certain jurisdictions may be restricted by law. Persons into whose possession this presentation comes are required to inform themselves about and to observe any
such restrictions.
The following information contains, or may be deemed to contain, “forward-looking statements”. These statements relate to future events or our future financial performance, including, but not limited to,
strategic plans, potential growth, planned operational changes, expected capital expenditures, future cash sources and requirements, liquidity and cost savings that involve known and unknown risks,
uncertainties and other factors that may cause 4finance’s or its businesses’ actual results, levels of activity, performance or achievements to be materially different from those expressed or implied by any
forward-looking statements. In some cases, such forward-looking statements can be identified by terminology such as “may,” “will,” “could,” “would,” “should,” “expect,” “plan,” “anticipate,” “intend,”
“believe,” “estimate,” “predict,” “potential,” or “continue,” or the negative of those terms or other comparable terminology. By their nature, forward-looking statements involve risks and uncertainties because
they relate to events and depend on circumstances that may or may not occur in the future. Future results may vary from the results expressed in, or implied by, the following forward-looking statements,
possibly to a material degree. All forward-looking statements made in this presentation are based on information presently available to management and 4finance assumes no obligation to update any
forward-looking statements.

3
Topics
• The Market Opportunity
• The Business Today
• Our Areas of Focus• Driving near term performance
• Rapidly laying a foundation for the future
• Financial Summary
• Conclusion

4
The opportunity for 4finance is significant
• There are c.2.6 billion financially underserved across the world, including a large ‘aspirational near-prime’ segment of c.500 million
that remains hard to credit score/serve, but represents a promising opportunity for 4finance, in line with our core skill-sets
• This aspirational near-prime group is made up of to two main communities:
• Millennial generation, still possessing limited credit histories, that is changing fundamental expectations around how financial
products are designed and served, breaking old conventions
• Fast growing, aspirational and increasingly affluent middle class in emerging markets, exhibiting strong demand for financial
products and services they have historically not been able to access
• Breakthroughs in data science, analytics, low cost cloud computing and artificial intelligence are unlocking the ability to credit score
and serve these historically underserved
• Ubiquitous/inexpensive mobile internet access allows the delivery of sophisticated mobile financial products anytime and anywhere
• With our size, scope, expertise and financial strength, 4finance is uniquely poised to take advantage of this opportunity

5
Why 4finance is uniquely positioned
• Unique scale and expertise
• Well capitalised, disciplined and profitable
• Convenient, simple & transparent products with a mobile-first
focus, and a growing expertise in serving millennials
• Deep expertise in scoring customers with limited or no credit
history
• Increasingly diverse product suite capable of helping customers
mitigate short term cash flow needs, fund longer term and more
aspirational purchases and save for the future
• Automation and self service capabilities that allow us to offer
small ticket sizes efficiently and economically
• Access to a network of strategic partnerships and/or acquisitions
that can enable us to offer new products, new capabilities, new
channels
Automation and self
service capabilities
Deep scoring
expertise
Mobile
friendly
Multi-product multi-
region experience
Unique scale
and expertise
Simple,
transparent
products
Increasingly
diversified
product suite
Well capitalized,
profitable,
financially
disciplined
Access to
strategic
partnerships

6
5360
7481
63
49
2013 2014 2015 2016 9M'2016 9M'2017
Profit before tax
Track record of profitable growth
Interest income
149
220
318
393
287327
2013 2014 2015 2016 9M'2016 9M'2017
See appendix for definitions of key metrics and ratios
€m €m
8,800,000+Registered customers(1)
33,000,000+Online applications reviewed
€5,000,000,000+Loans issued
16Countries
of operation
>3,5009M 2017
full time
employees
Notes:
(1) Includes 1.4 million registered TBI Bank customers
(2) Issuance volumes to customers who have returned, ie taken out and repaid at least one prior loan
84%9M 2017 returning
customer business (2)
5Main lending
products, with
EU licensed bank

7
The Business Today

8
Note: (1) Net receivables as of 30/9/2017. Remaining 8% of net loan portfolio is SME lending within TBI Bank
Clear and simple product range
Consumer lending products
Single
Payment loan
Line of Credit
/ Credit Card
Instalment
loanPoint of Sale
% of net
receivables (1)
41% 2% 39% 10%
Typical amount €350 €1,200 €850 €500
Term Up to 30 - 65 days
depending on market
Open-ended revolving
credit line
Typically 3 – 36 months
depending on market
Up to 1 – 5 years
depending on market
Payment type Single payment
encompassing the principal
repayment and loan fee
Minimum monthly
repayment & flexible
additional repayment
Repayment in fixed monthly
instalments with amortising
principal
Repayment in fixed
monthly instalments
Pricing Monthly interest rates:
5% - 33% in Europe
30% - 40% in LatAm
Monthly interest rates:
c.3% (credit cards)
8.5% - 10% (online LOC)
Annual interest rates:
35% - 60% in LT, BG, RO
60% - 100% in others
Annual interest rates:
c.30% in Spain
30% – 50% in BG, RO
Extension Option to extend up to 30
days (payable up front)
Minimum-to-pay format in
some markets
Flexible payment options
as long as minimum
monthly payment is met
Option to delay the monthly
instalment by one monthn/a
Markets All 16 markets Bulgaria, Romania,
Finland, Latvia
10 markets Bulgaria, Romania, Spain
Deposit products
Bank Non-bank
94% 6%
€100k guarantee limit €5,250 limit
Current accounts and term
deposits (6 months av. term)
Current and term deposits
(up to 3 years)
Annual or at maturity Annual or at maturity
Annual rate: 0.5% - 2.6% Annual rate: 6.5% - 10%
n/a n/a
Bulgaria, Romania Sweden

9
Diversification by product and geography
Latvia8% Lithuania
2%Finland
5%
Sweden5%
Poland25%
Georgia4%
Denmark9%
Spain18%
Czech Republic5%
Bulgaria8%
Romania7%
Argentina2%
Other2%
9M17 interest income: €327m9M17 Net receivables: €556m
62% online / 38% banking
Single Payment Loans41%
Line of Credit / Cards2%
Instalment loans39%
Point of Sale10%
Bank (SME)8%

10
• Has at least one bank account
• Expenditure matches monthly income
• Little or no savings
• Limited credit history
• Employed, self employed or retired
• Underserved by traditional banks
• Uses financing for lifestyle choices or necessities
• Seeking transparency, speed and efficiency.
• Loyal - 84% of loans are issued to returning customers (9M’2017)
Client split by age (9M’2017)
1 loan
2 loans3 loans
4 and more
loans
Online customer profile
Applications by source
0.7%
12.4%
22.8%
31.4%
17.1%
9.8%
5.9%
0%
5%
10%
15%
20%
25%
30%
35%
18-20 21-24 25-29 30-39 40-49 50-59 60+ 2015 9M’2017
Most common customer characteristics:
71.8%
23.4%
4.8%
42.7%
50.3%
7.0%
Desktop
Mobile
Other
Trust Pilot and eKomi(1) score by countries
9.79.2 9.1 8.8
9.69.2 9.4
vivus.pl vivus.dk vivus.fi vivus.se zaplo.pl zaplo.dk vivus.es
Note: (1) Trust Pilot score in Poland, Denmark, Finland, Sweden; eKomi score in Spain (scores out of 10)

11
Responsible lending and regulatory compliance
• Putting customers first
• Focusing on good customer outcomes
• Delivering sustainable customer relationships
• Regulatory relationships are strategic to our business
• Appointment of Chief Compliance Officer
• Introducing a Customer Charter and Code of Conduct
• Ensuring best practice throughout the business
• What does responsible lending mean to 4finance?
• Marketing: clear, simple and transparent products and terms
• Pricing: typically position rates at lower end of market to ‘self select’ responsible borrowers who ‘shop around’
• Underwriting: credit check and underwriting for ALL loans, including returning, with 30% average new customer acceptance
• Customer care: local language, well staffed and responsive teams
• Extensions: no ballooning interest (interest paid for prior month) or ‘cycle of debt’
• Repayments: “push” payments from customer to 4finance, no automatic withdrawal from bank accounts

12
Our Areas of Focus

13
Driving near term
performance
Rapidly laying a
foundation for the
future
Executing a twin track strategy

14
Driving near term performance

15
Operational progress: renewed momentum
• Executive team transformation is nearing completion
• New regional leadership structure with our most experienced business
leaders providing more responsive oversight and driving best practices
across countries
• Restructured ExCo clarifies functional accountability and includes
representation from regional leaders plus TBI. Speeds up decision
making and improves collaboration across group
• Enhanced growth in our existing markets
• Best organic Quarter-on-Quarter loan issuance growth in two years
• Solid instalment loan issuance growth (up 35% QoQ)
• Solid Latin American growth (up 47% QoQ)
• Launch of instalment loans in Georgia following regulatory changes
• Promising start to near prime market tests
• Launched near prime offering in Lithuania, which is driving net loan book
growth in the region for the first time in many quarters
• Enhancing NPL management and completing preparation for IFRS 9
Gross receivables from recent IL launches(1)
83.0
0.0
20.0
40.0
60.0
80.0
Q4'15 Q1'16 Q2'16 Q3'16 Q4'16 Q1'17 Q2'17 Q3'17
Quarterly Issuance (Latin America)
7.6
0.0
2.0
4.0
6.0
8.0
Q4'15 Q1'16 Q2'16 Q3'16 Q4'16 Q1'17 Q2'17 Q3'17
€m
€m
Note: (1) Includes instalment loans in Poland, Denmark, Spain, Romania and the Czech Republic
16
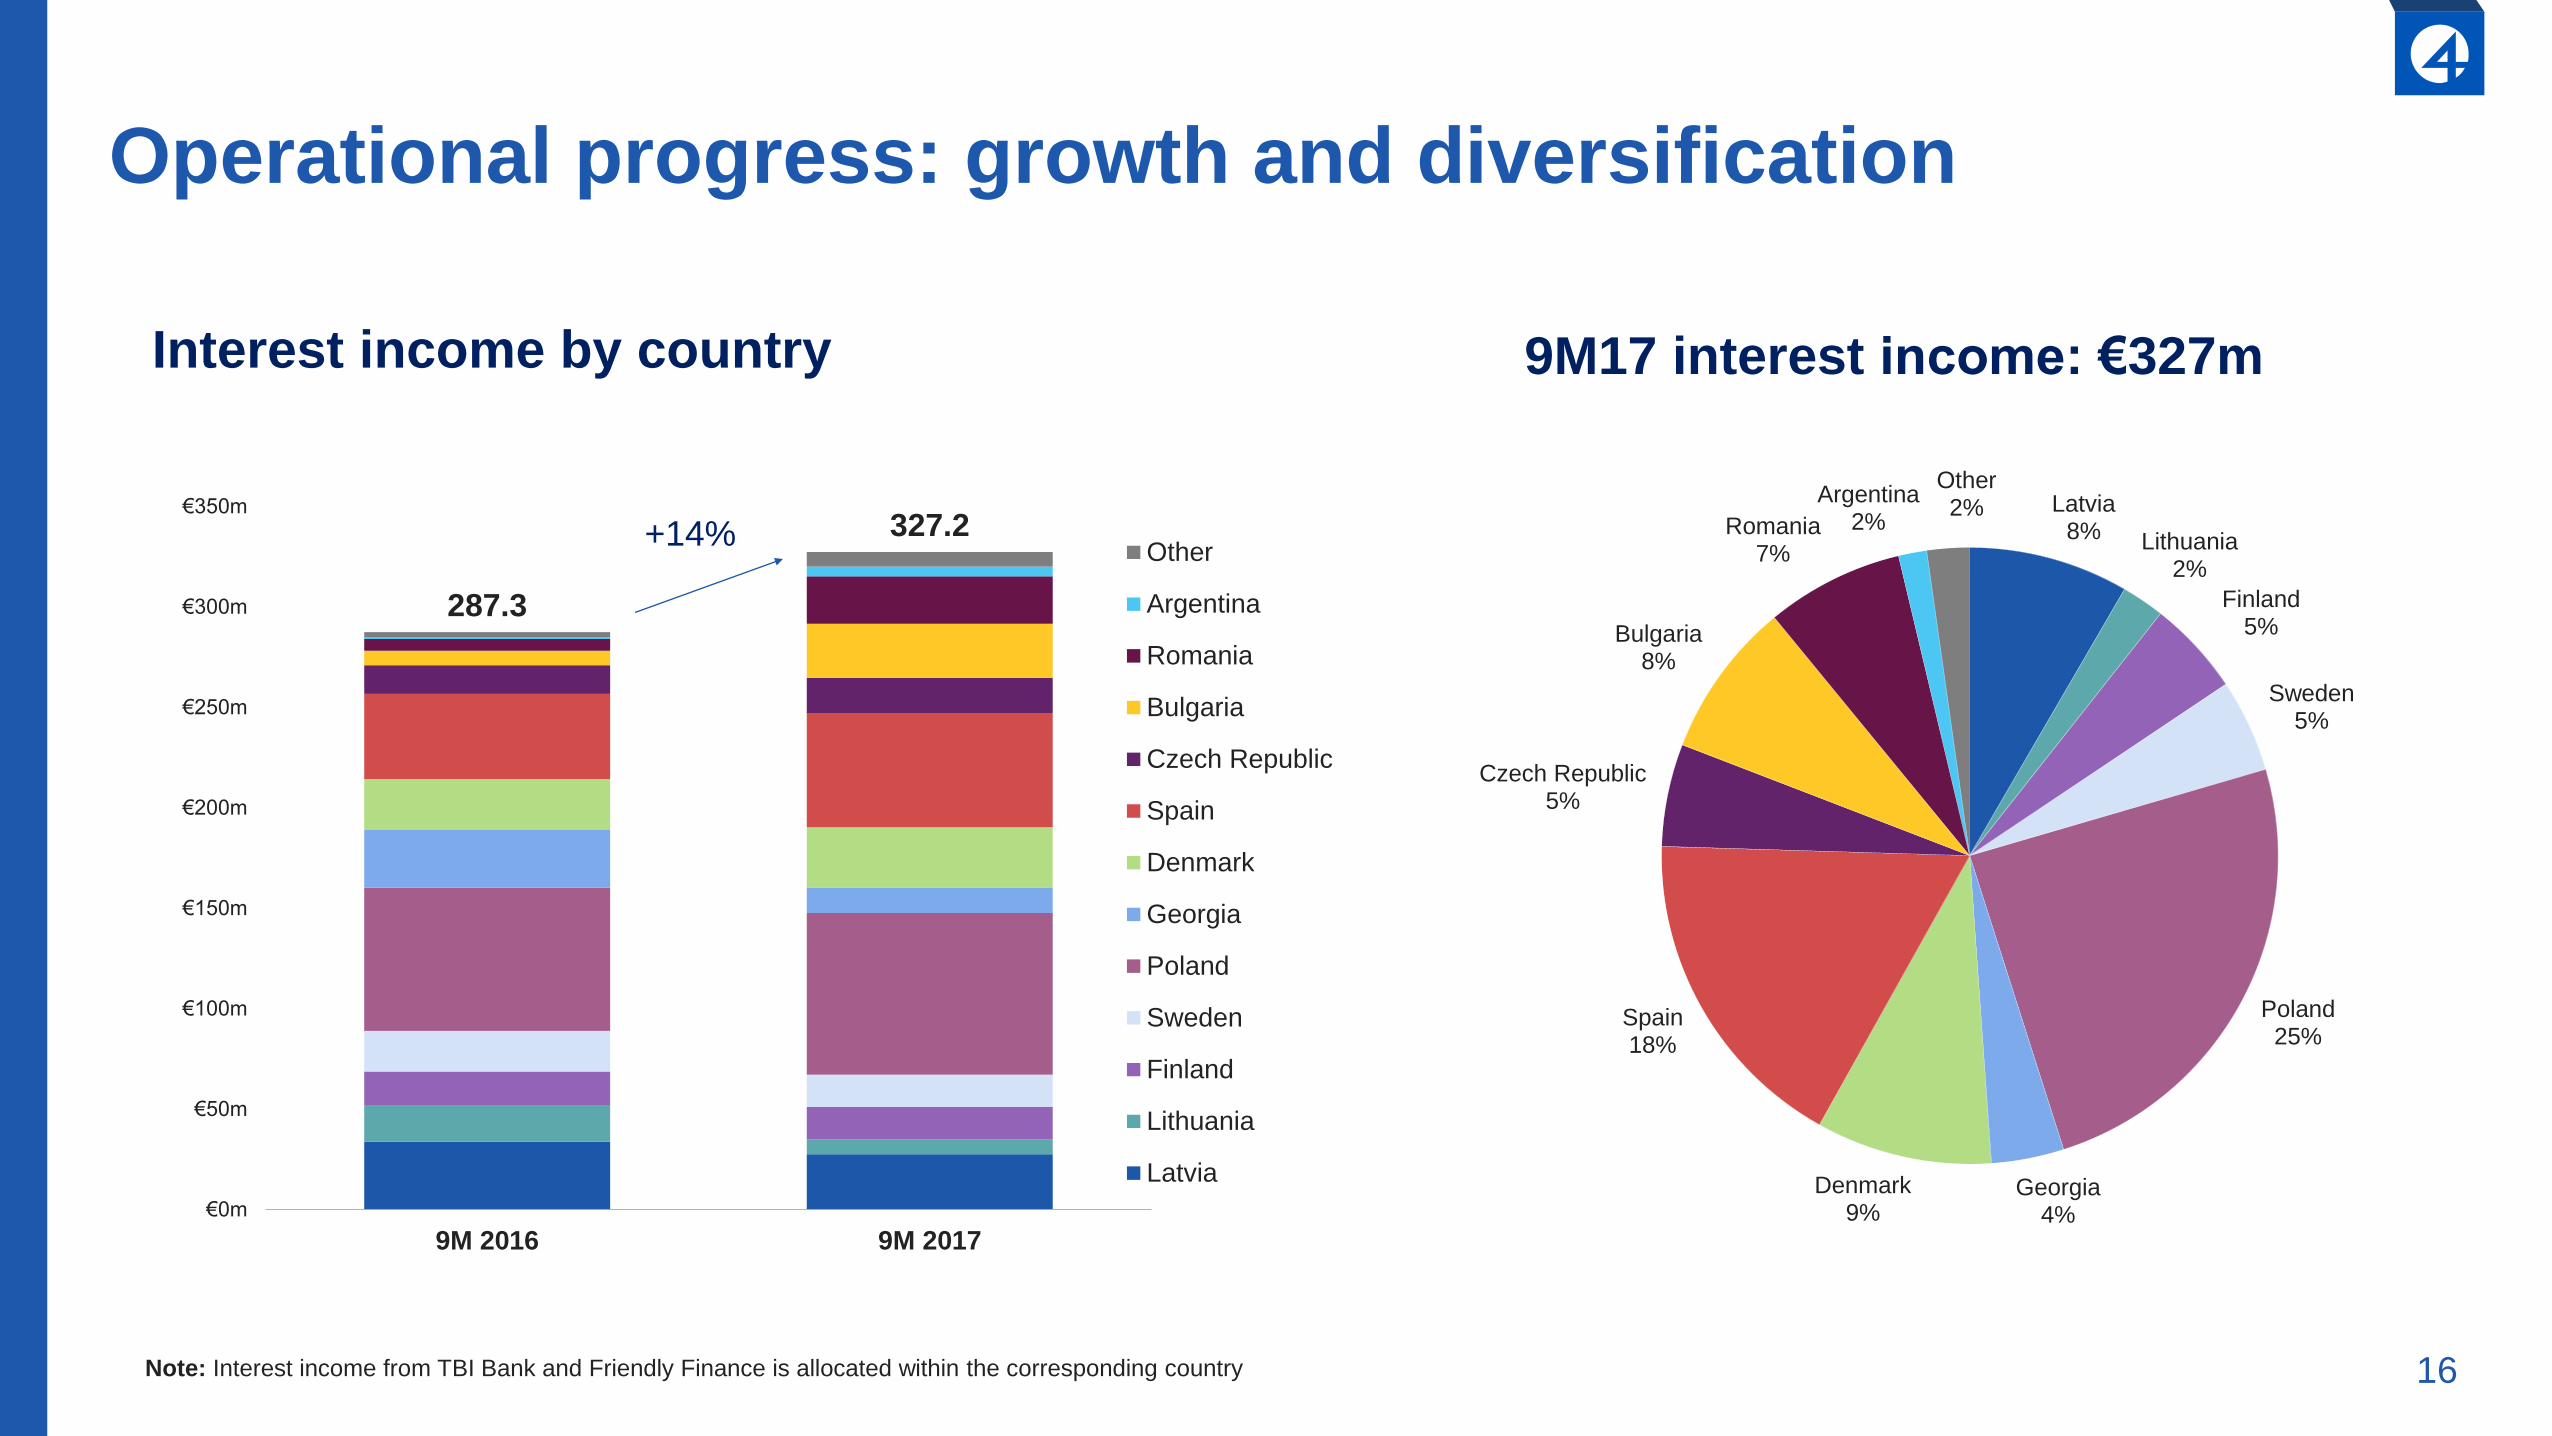
Operational progress: growth and diversification
Interest income by country
287.3
327.2
€0m
€50m
€100m
€150m
€200m
€250m
€300m
€350m
9M 2016 9M 2017
Other
Argentina
Romania
Bulgaria
Czech Republic
Spain
Denmark
Georgia
Poland
Sweden
Finland
Lithuania
Latvia
Latvia8% Lithuania
2%
Finland5%
Sweden5%
Poland25%
Georgia4%
Denmark9%
Spain18%
Czech Republic5%
Bulgaria8%
Romania7%
Argentina2%
Other2%
9M17 interest income: €327m
Note: Interest income from TBI Bank and Friendly Finance is allocated within the corresponding country
+14%

17
42.0 42.1 42.2 43.345.8 45.2
41.1
5.2
10.18.6 10.5
11.3
3.2
2.33.2
3.4
3.9
50%49%
53%
57%
60% 60%
55%
0%
10%
20%
30%
40%
50%
60%
70%
0.0
10.0
20.0
30.0
40.0
50.0
60.0
70.0
Q1 Q2 Q3 Q4 Q1 Q2 Q3
4finance TBI Friendly Finance Quarterly cost/income ratio, %
Operational progress: increasing efficiencies
2016
• Continuing to execute cost optimisation project
• Overall cost to income ratio a focus: operating income increase
from growth in non-mature products plus cost efficiency
improvements
• Targeting annualised savings of up to 10% of costs, excluding
marketing and D&A
• Q3’2017 reduction in cost represents benefits of initial cost
saving initiatives
• Executing deeper integration of Friendly Finance and deploying a
multi-brand/multi-segment strategy that will use differentiated
underwriting rules and pricing to grow the addressable customer
base, while driving increased economies of scale
• Prioritizing and driving quick wins that will deliver near term top line
and bottom line returns
• Revamped the LOC product and will re-launch it in Latvia and
Finland
• Reduced cycle time of scorecards, allowing us to continuously
improve underwriting
2017
Note: Q1-3 figures reflect reported unaudited results and Q4 figures reflect balance to full year audited results
Total operating costs
€m
18
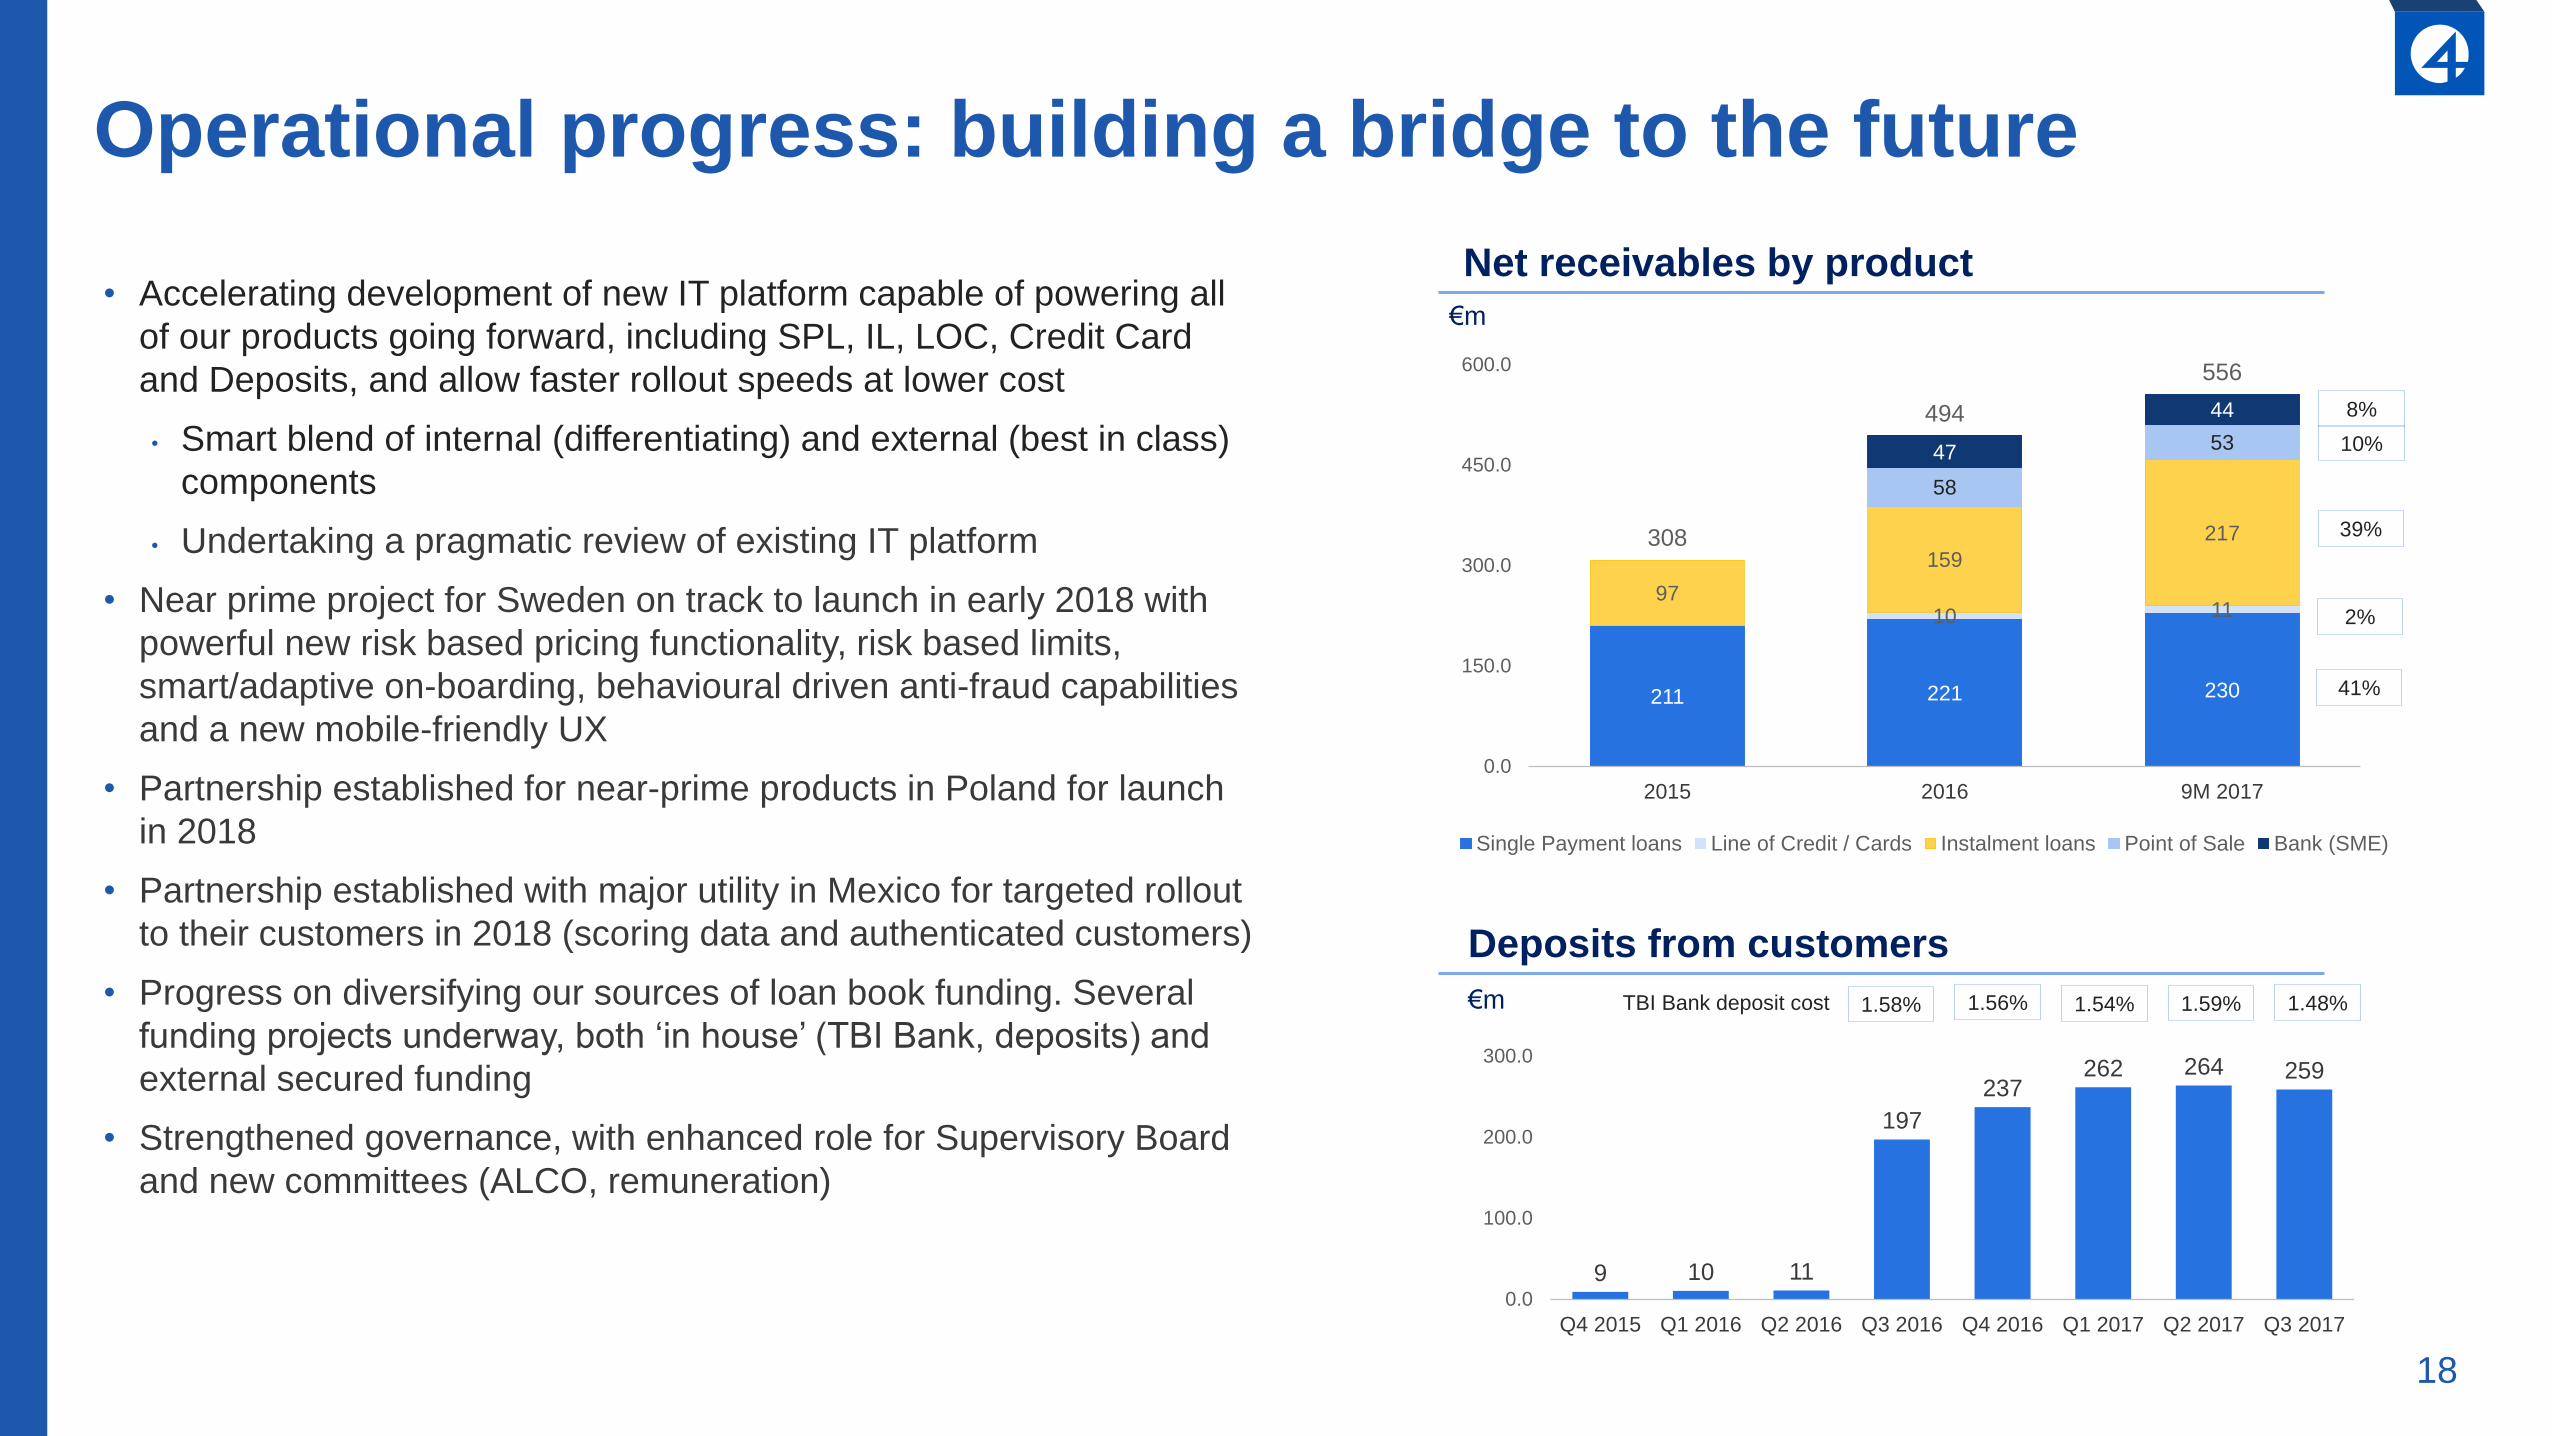
Operational progress: building a bridge to the future
• Accelerating development of new IT platform capable of powering all
of our products going forward, including SPL, IL, LOC, Credit Card
and Deposits, and allow faster rollout speeds at lower cost
• Smart blend of internal (differentiating) and external (best in class)
components
• Undertaking a pragmatic review of existing IT platform
• Near prime project for Sweden on track to launch in early 2018 with
powerful new risk based pricing functionality, risk based limits,
smart/adaptive on-boarding, behavioural driven anti-fraud capabilities
and a new mobile-friendly UX
• Partnership established for near-prime products in Poland for launch
in 2018
• Partnership established with major utility in Mexico for targeted rollout
to their customers in 2018 (scoring data and authenticated customers)
• Progress on diversifying our sources of loan book funding. Several
funding projects underway, both ‘in house’ (TBI Bank, deposits) and
external secured funding
• Strengthened governance, with enhanced role for Supervisory Board
and new committees (ALCO, remuneration)
Net receivables by product
Deposits from customers
9 10 11
197
237262 264 259
0.0
100.0
200.0
300.0
Q4 2015 Q1 2016 Q2 2016 Q3 2016 Q4 2016 Q1 2017 Q2 2017 Q3 2017
€m
211 221 230
10 1197
159
217
58
5347
44
308
494
556
0.0
150.0
300.0
450.0
600.0
2015 2016 9M 2017
Single Payment loans Line of Credit / Cards Instalment loans Point of Sale Bank (SME)
€m
1.58% 1.56% 1.54% 1.59% 1.48%TBI Bank deposit cost
8%
10%
39%
2%
41%

19
Rapidly laying a foundation for the future

20
Longer term opportunity:
Grow addressable market and customer lifetime value
• Additional products (e.g. leveraging TBI Bank for greater share of wallet)
• Additional demographics (e.g. moving up the credit curve)
• Additional geographies (e.g. entering tested markets such as APAC)
• Additional markets (e.g. adjacencies like small business, and the gig economy)
• Leveraging a third party ecosystem (e.g. Credit as a Service)
21
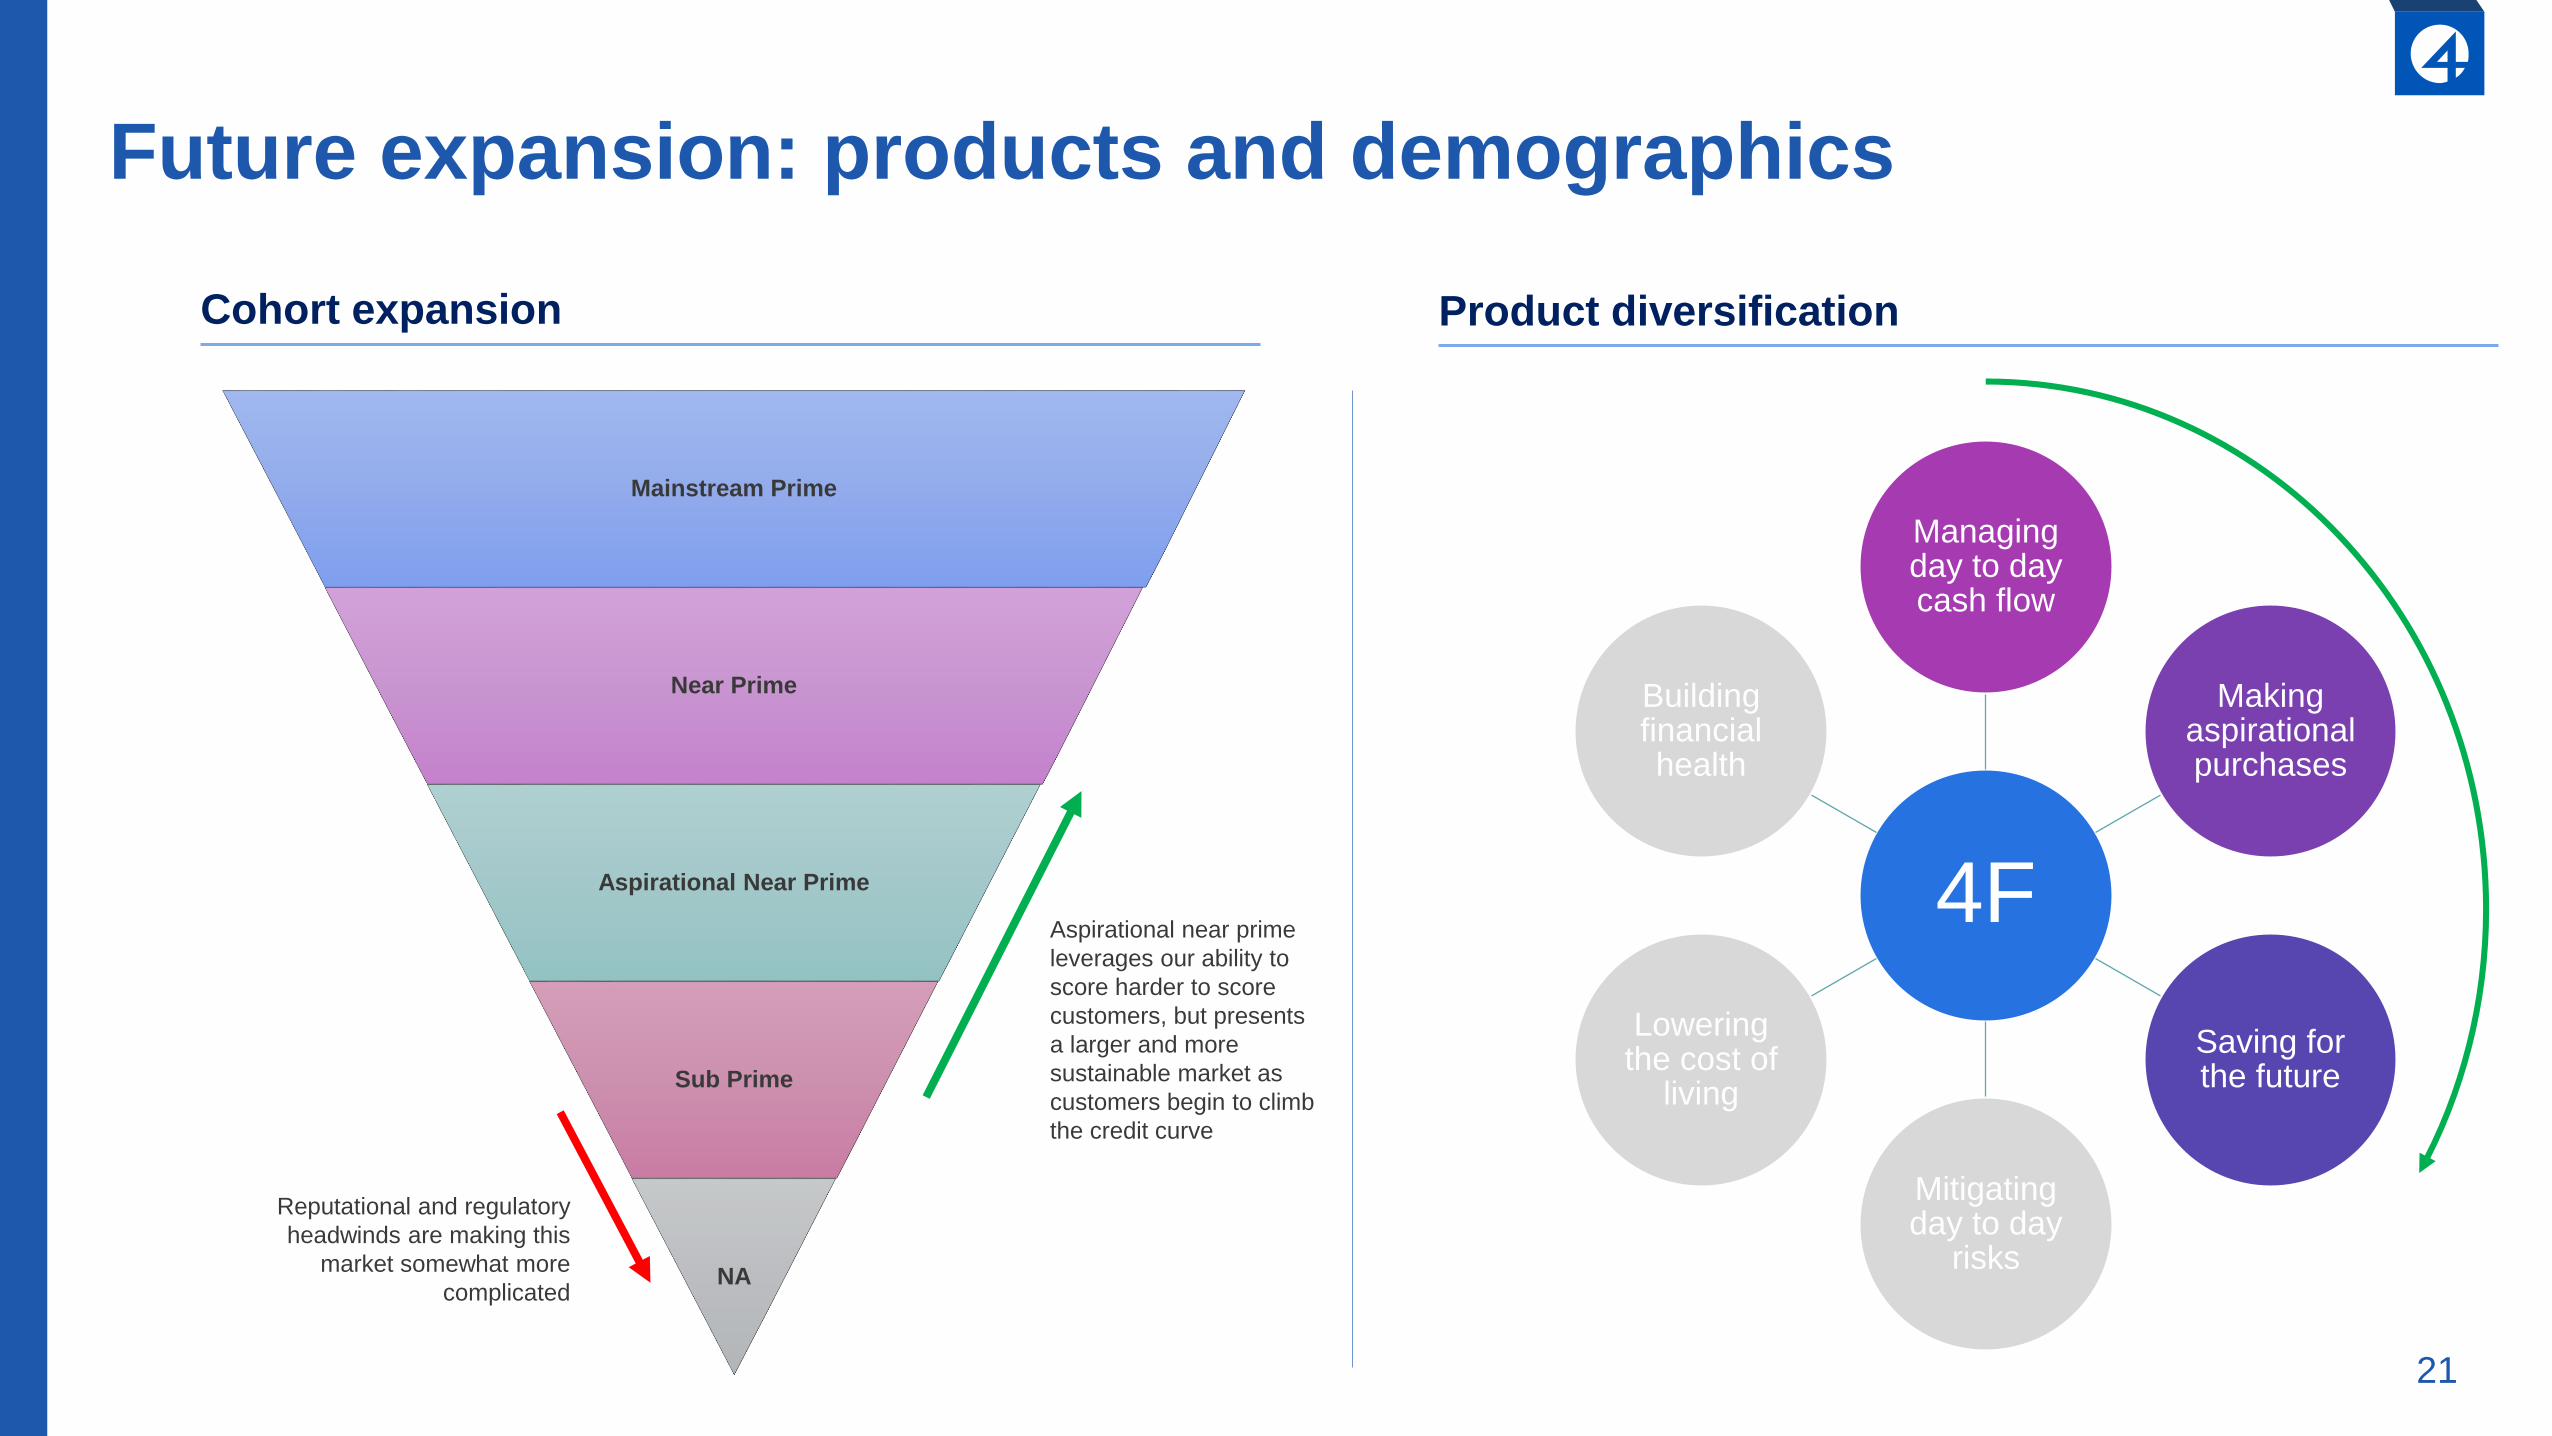
Future expansion: products and demographics
Mainstream Prime
Near Prime
Aspirational Near Prime
Sub Prime
NA
Reputational and regulatory
headwinds are making this
market somewhat more
complicated
Aspirational near prime
leverages our ability to
score harder to score
customers, but presents
a larger and more
sustainable market as
customers begin to climb
the credit curve
Cohort expansion Product diversification
4F
Managing day to day cash flow
Making aspirational purchases
Saving for the future
Mitigating day to day
risks
Lowering the cost of
living
Building financial health

22
Financial summary

23
Baltics12%
Scandinavia13%
Poland19%
Spain7%
Czech/Slovakia
4%
Georgia/Armenia
5%
LatAm0.9%
BG/RO (online)1%
Bulgaria (TBI)17%
Romania (TBI)13%
SME (TBI)8%
538
805
1,0621,157
841935
2013 2014 2015 2016 9M'2016 9M'2017
€m
178
241
308 316346
178
210494
556
2013 2014 2015 2016 9M'2017
Growing and diversified loan portfolioNet receivables(1)
Net receivables, 30/9/2017
Note: (1) Bank receivables in 9M17 include c. €1m from pilot transfer of Swedish instalment loans
• 11% year-on-year growth in online loan issuance to €935m in 9M17
• Overall net receivables totals €556m
• 13% year to date growth
• 92% consumer loans
• 62% online loans / 38% banking
Online loans issued
BankOnlineTBI Bank: 38%
(funded @ c.2%)Online: 62%
(funded @ c.12%)
+11%
€m
See appendix for definitions of key metrics and ratios

24
Overall gross NPL ratio and cost of risk
Asset quality and cost of risk
Asset quality trends by market
See appendix for definitions of key metrics and ratios
%
37.0%
33.1%
28.5%
20.7%
17.3%
14.8%
2015 2016 9M'2017
Gross NPL ratio Cost of risk
0%
5%
10%
15%
20%
25%
2013 2014 2015 2016 9M 2017
Spain
Bulgaria
Georgia
CzechRepublicDenmark
Poland
Latvia
Lithuania
Finland
Sweden
Non-performing online loans / 2 year online loan
issuance, for single payment loans

25
Profit before tax
29%35%
40%
25% 26%
38% (ex TBI)
40% (ex TBI)
24%
2013 2014 2015 2016 9M'2016 9M'2017
Financial highlights – profitable growth
5360
7481
63
49
2013 2014 2015 2016 9M'2016 9M'2017
Interest income
149
220
318
393
287327
2013 2014 2015 2016 9M'2016 9M'2017
71
88
119
137
102 107
2013 2014 2015 2016 9M'2016 9M'2017
€m
Adjusted EBITDA Equity to assets ratio, % (1)
4.6x
3.7x4.1x
3.6x3.9x
2.4x
2013 2014 2015 2016 9M'2016 9M'2017
Adjusted interest coverage ratio
37%
47%
56%
47%44%
47%
2013 2014 2015 2016 9M'2016 9M'2017
Equity/net receivables, %
Note: (1) Total assets figure for 2014 adjusted for the effect of bonds defeasance
2.0x
min.
20%
min.
35%
(ex TBI)
See appendix for definitions of key metrics and ratios
€m
€m

26
Conclusion
27
• The opportunity for 4finance is significant
• Clear mission and vision
• 4finance is uniquely positioned given existing scale and experience
• Twin track strategy: near term performance and foundation for the future
• Solid 9M17 results show operational progress
• Renewed momentum: return to loan issuance and portfolio growth
• Increasing efficiencies: executing cost optimisation project, cost/income ratio reduced
• Bridge to the future: developing near-prime product offering and associated new IT platform
• Partnership initiatives and funding projects to support future business growth
• Management and supervisory board team and structure in place to deliver
Conclusion

28
Thank you and Questions

29
Appendix
30
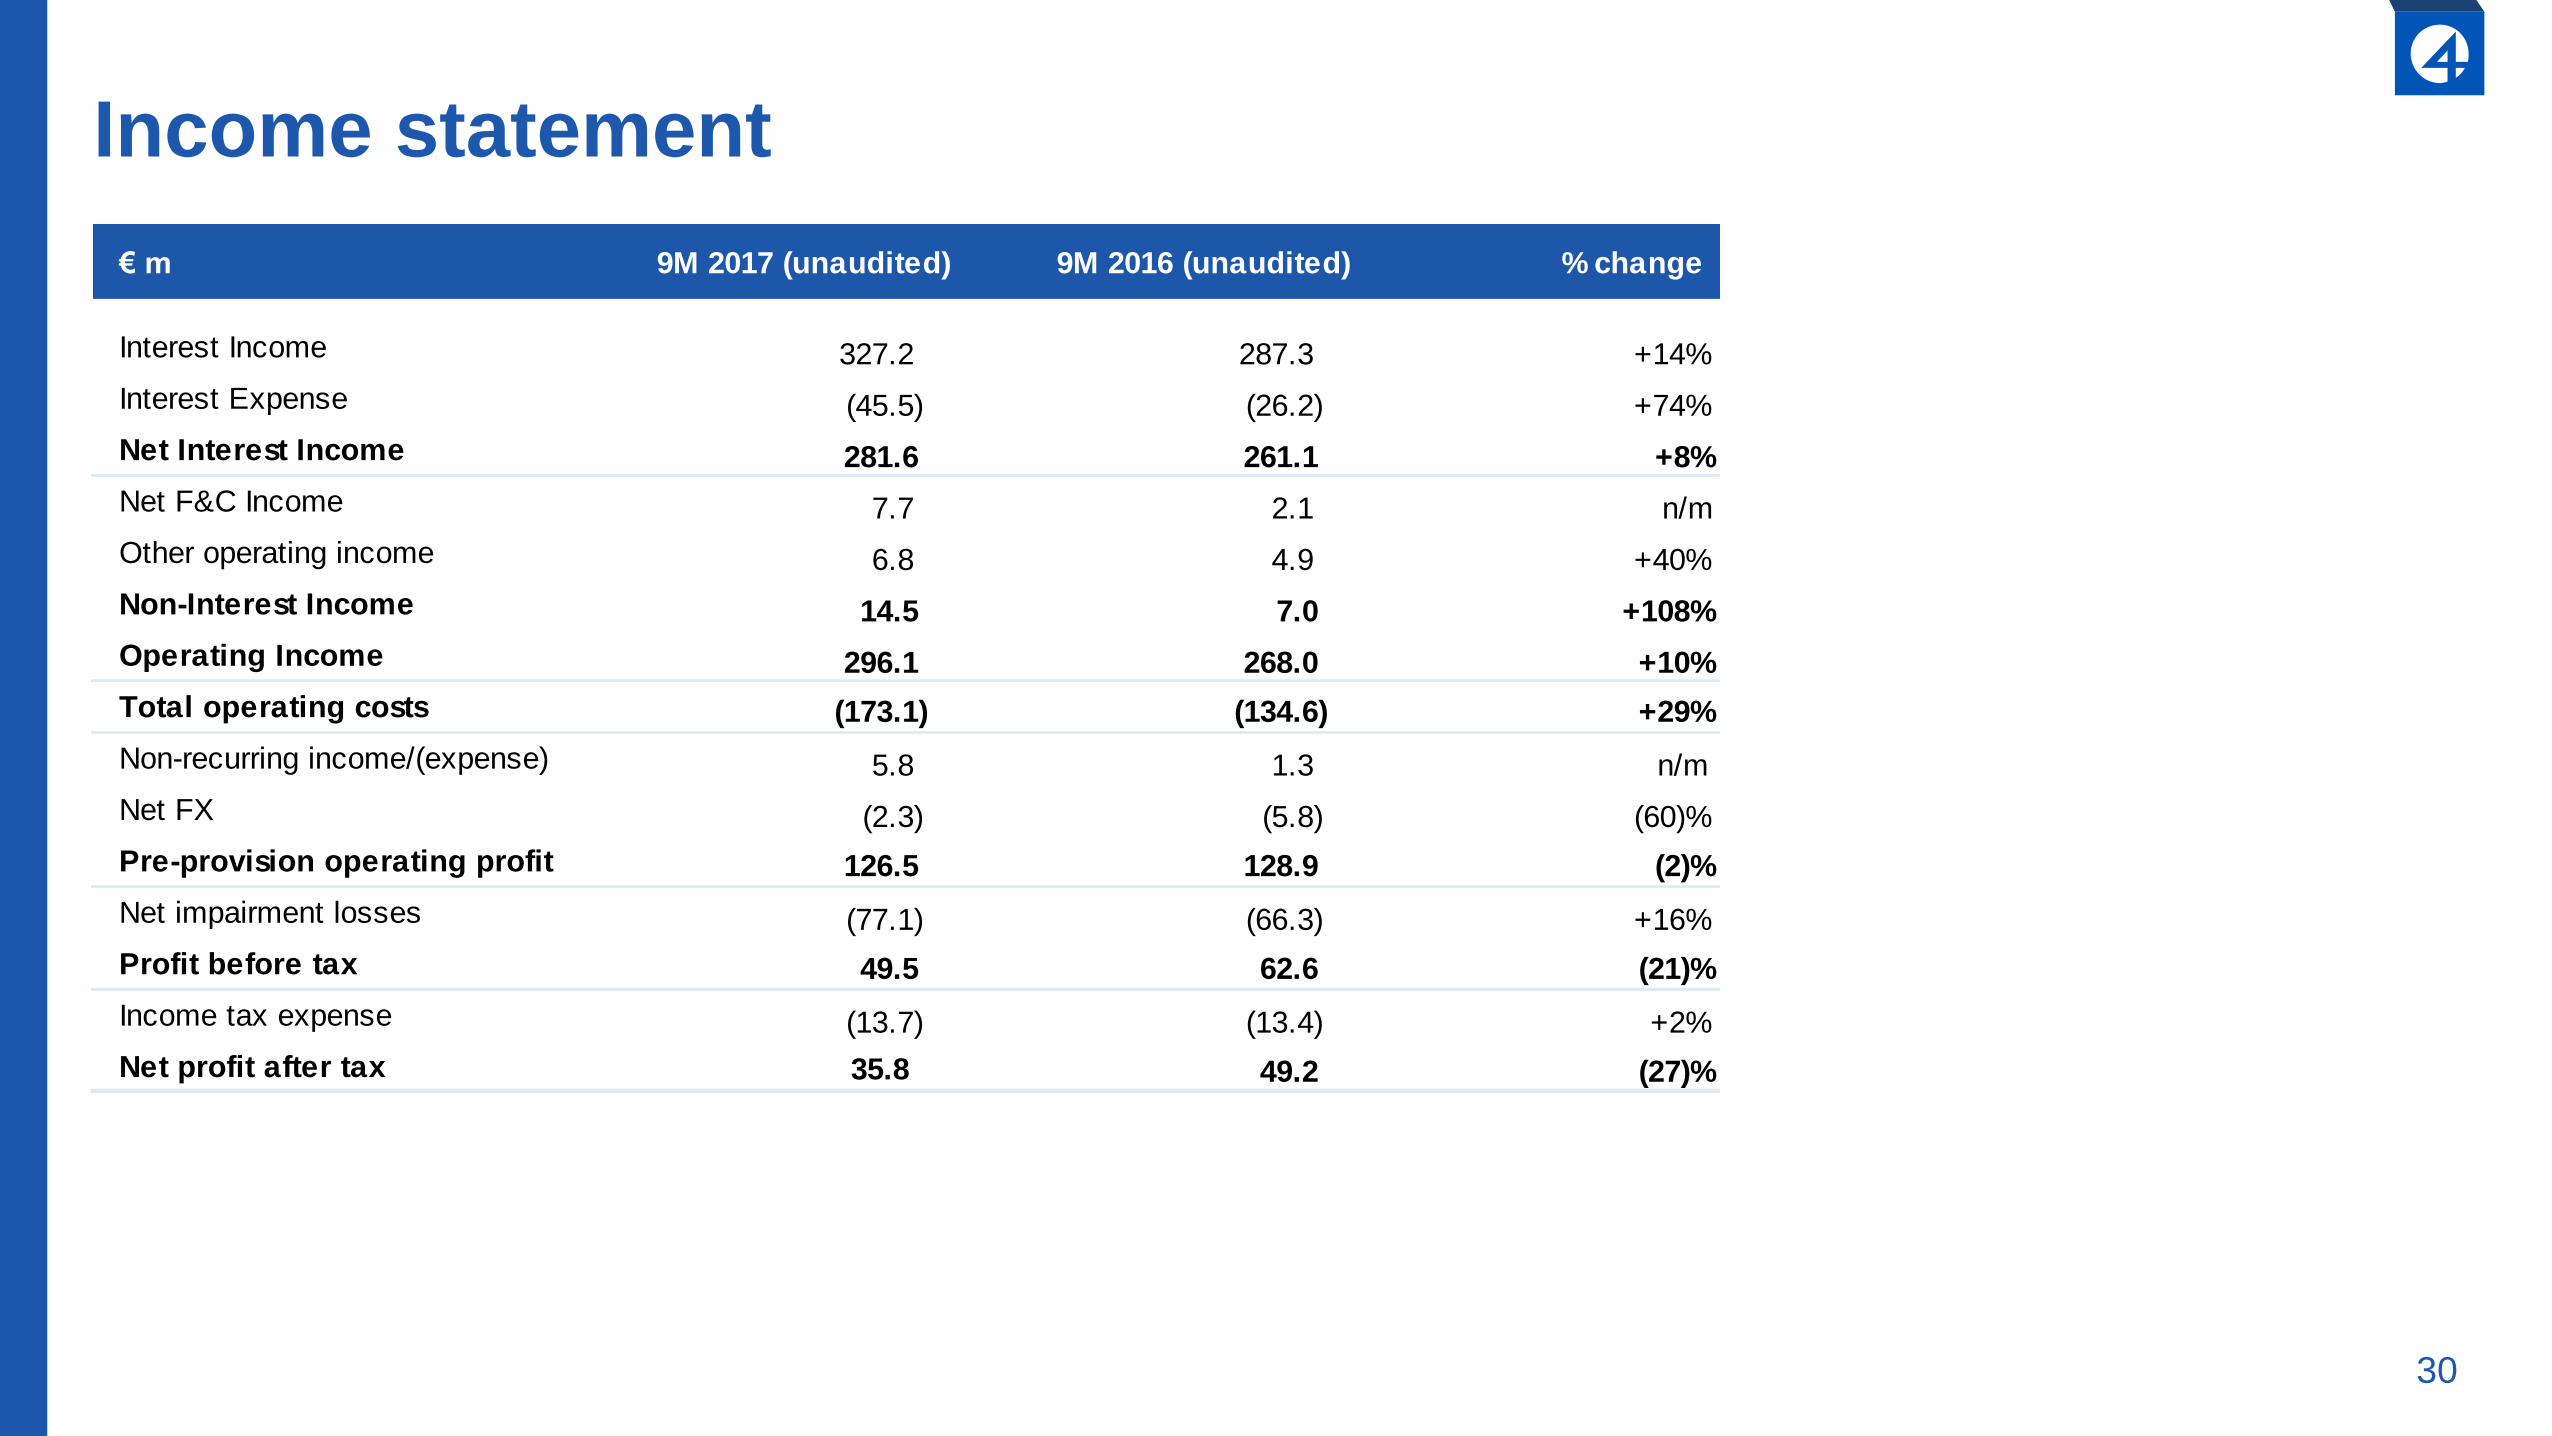
Income statement
€ m 9M 2017 (unaudited) 9M 2016 (unaudited) % change
Interest Income 327.2 287.3 +14%
Interest Expense (45.5) (26.2) +74%
Net Interest Income 281.6 261.1 +8%
Net F&C Income 7.7 2.1 n/m
Other operating income 6.8 4.9 +40%
Non-Interest Income 14.5 7.0 +108%
Operating Income 296.1 268.0 +10%
Total operating costs (173.1) (134.6) +29%
Non-recurring income/(expense) 5.8 1.3 n/m
Net FX (2.3) (5.8) (60)%
Pre-provision operating profit 126.5 128.9 (2)%
Net impairment losses (77.1) (66.3) +16%
Profit before tax 49.5 62.6 (21)%
Income tax expense (13.7) (13.4) +2%
Net profit after tax 35.8 49.2 (27)%

31
Balance sheet€ m 9M 2017 (unaudited) FY 2016 (audited)
Cash and cash equivalents 227.1 157.6
Placement with other banks 2.2 4.8
Gross receivables due from customers 720.7 665.1
Allowance for impairment (165.0) (171.2)
Net receivables due from customers 555.8 493.9
Net investments in finance leases 10.8 13.1
Loans to related parties 70.0 67.2
Property and equipment 10.6 12.3
Financial assets 8.6 10.6
Prepaid expenses 8.1 5.6
Tax assets 52.8 39.7
Intangible assets 44.0 39.8
Goodwill 43.4 43.4
Other assets 53.2 43.4
Total assets 1,086.5 931.4
Calculation for Presentation - other assets (not loans or cash) 692.2 597.8
Loans and borrowings 481.7 397.2
Deposits from customers 258.9 237.1
Deposits from banks 5.1 —
Corporate income tax payable 18.5 14.6
Other liabilities 63.6 47.5
Liabilities held for sale — 4.8
Total liabilities 827.9 701.2
Share capital 35.8 35.8
Retained earnings 263.0 233.9
Reserves (39.1) (40.2)
Total attributable equity 259.6 229.4
Non-controlling interests (1.0) 0.7
Total equity 258.6 230.1
Total shareholders' equity and liabilities 1,086.5 931.4

32
Key ratios – capitalisation and profitability
See appendix for definitions of key ratios
Key ratios9M 2017
(unaudited)
9M 2016
(unaudited)
FY 2016
(audited)
FY 2015
(audited)
Capitalisation
Net receivables (€m) 555.8 510.4 493.9 308.3
Total assets (€m) 1,086.5 846.5 931.4 438.2
Total equity (€m) 258.6 222.4 230.1 173.3
Equity / assets ratio 23.8% 26.0% 24.7% 39.5%
Equity / net receivables 46.5% 43.6% 46.6% 56.2%
Adjusted interest coverage 2.4x 3.9x 3.6x 4.1x
TBI Bank capital adequacy ratio 24.9% 24.8% 22.3% 19.5%
Profitability
Net interest margin:
- Online 66.2% 74.7% 74.7% 78.0%
- TBI Bank 26.3% n/m 23.6% —
- Overall group 54.2% n/m 65.0% 78.0%
Cost / income ratio 58.5% 50.2% 52.2% 45.9%
Profit before tax margin 15.1% 21.8% 20.6% 23.2%
Return on average equity 19.5% 33.1% 31.3% 44.8%
Return on average assets 4.7% 10.2% 9.2% 14.4%

33
Key ratios – asset quality
Key ratios9M 2017
(unaudited)
9M 2016
(unaudited)
FY 2016
(audited)
FY 2015
(audited)
Asset quality
Cost of risk
- Online 18.9% 19.3% 19.6% 20.7%
- TBI Bank 5.3% n/m 3.1% —
- Overall group 14.8% n/m 17.3% 20.7%
Gross NPL ratio
- Online 36.9% 43.8% 42.0% 37.0%
- TBI Bank 10.3% 10.4% 10.9% —
- Overall group 28.5% 34.5% 33.1% 37.0%
Net impairment / interest income 23.6% 23.1% 22.8% 24.2%
Online NPLs to loan issuance ratio 7.8% 9.6% 9.3% 9.0%
See appendix for definitions of key ratios
Note: (1) The TBI Bank cost of risk figure for FY 2016 refers to Q4 2016 annualised
(1)

34
Summary of nine month 2017 results
• 9M17 interest income up 14% and Adjusted EBITDA up 5% year on year
• Record €114m quarterly interest income, up 4% from Q2
• Adjusted EBITDA of €107m, up 5%, maintaining interest cover from Q2
• Pre-provision operating profit of €127m, down 2% on last year
• Profit before tax of €49m, down 21% on last year
• Interest income highlights by market and product
• Strong growth in Poland, Spain & Denmark vs impact of Georgia and Lithuania regulatory
changes (reduction of €29m in 9M17 vs 9M16)
• Latin American growth starting to show in overall results: up 18% QoQ and 9M17 total
over 3x that of 9M16
• Instalment loan interest income up 10% QoQ (growth and visibility)
• TBI Bank strong performance driven by retail lending growth
• Cost efficiency initiatives in evidence
• Quarterly reduction in absolute costs and cost/income ratio
• Strategic approach to costs with longer term view / investment where appropriate
• Continued improvement in NPL ratios, increase in Q3 net impairments
• Gross NPL ratio and NPL/sales ratio improvement
• Net impairment/interest income at 24% compared to 23% for 9M16
• Net impairment increase in Q3 (higher gross impairments, lower debt sales)
• Enhancements to financial reporting and disclosure
62.6
49.5
9M'2016 9M'2017
101.8107.1
9M'2016 9M'2017
287.3
327.2
9M2016 9M'2017
Interest Income€m
+14%
Profit before tax€m
Adjusted EBITDA€m
-21%
+5%
See appendix for definitions of key metrics and ratios
128.9 126.5
9M'2016 9M'2017
Pre-provisionoperating profit
€m-2%
35
Analysis of net impairments and cost of risk
-2.8-6.2
-3.2
-2.2
-2.8
-2.5
28.832.3
35.9
23.7 23.3
30.1
-10.0
0.0
10.0
20.0
30.0
40.0
Q1 2017 Q2 2017 Q3 2017
Grossimpairments
Recoveries fromwritten off loans
Overprovisioning ondebt sales (netgain/loss)
Net impairmentlosses
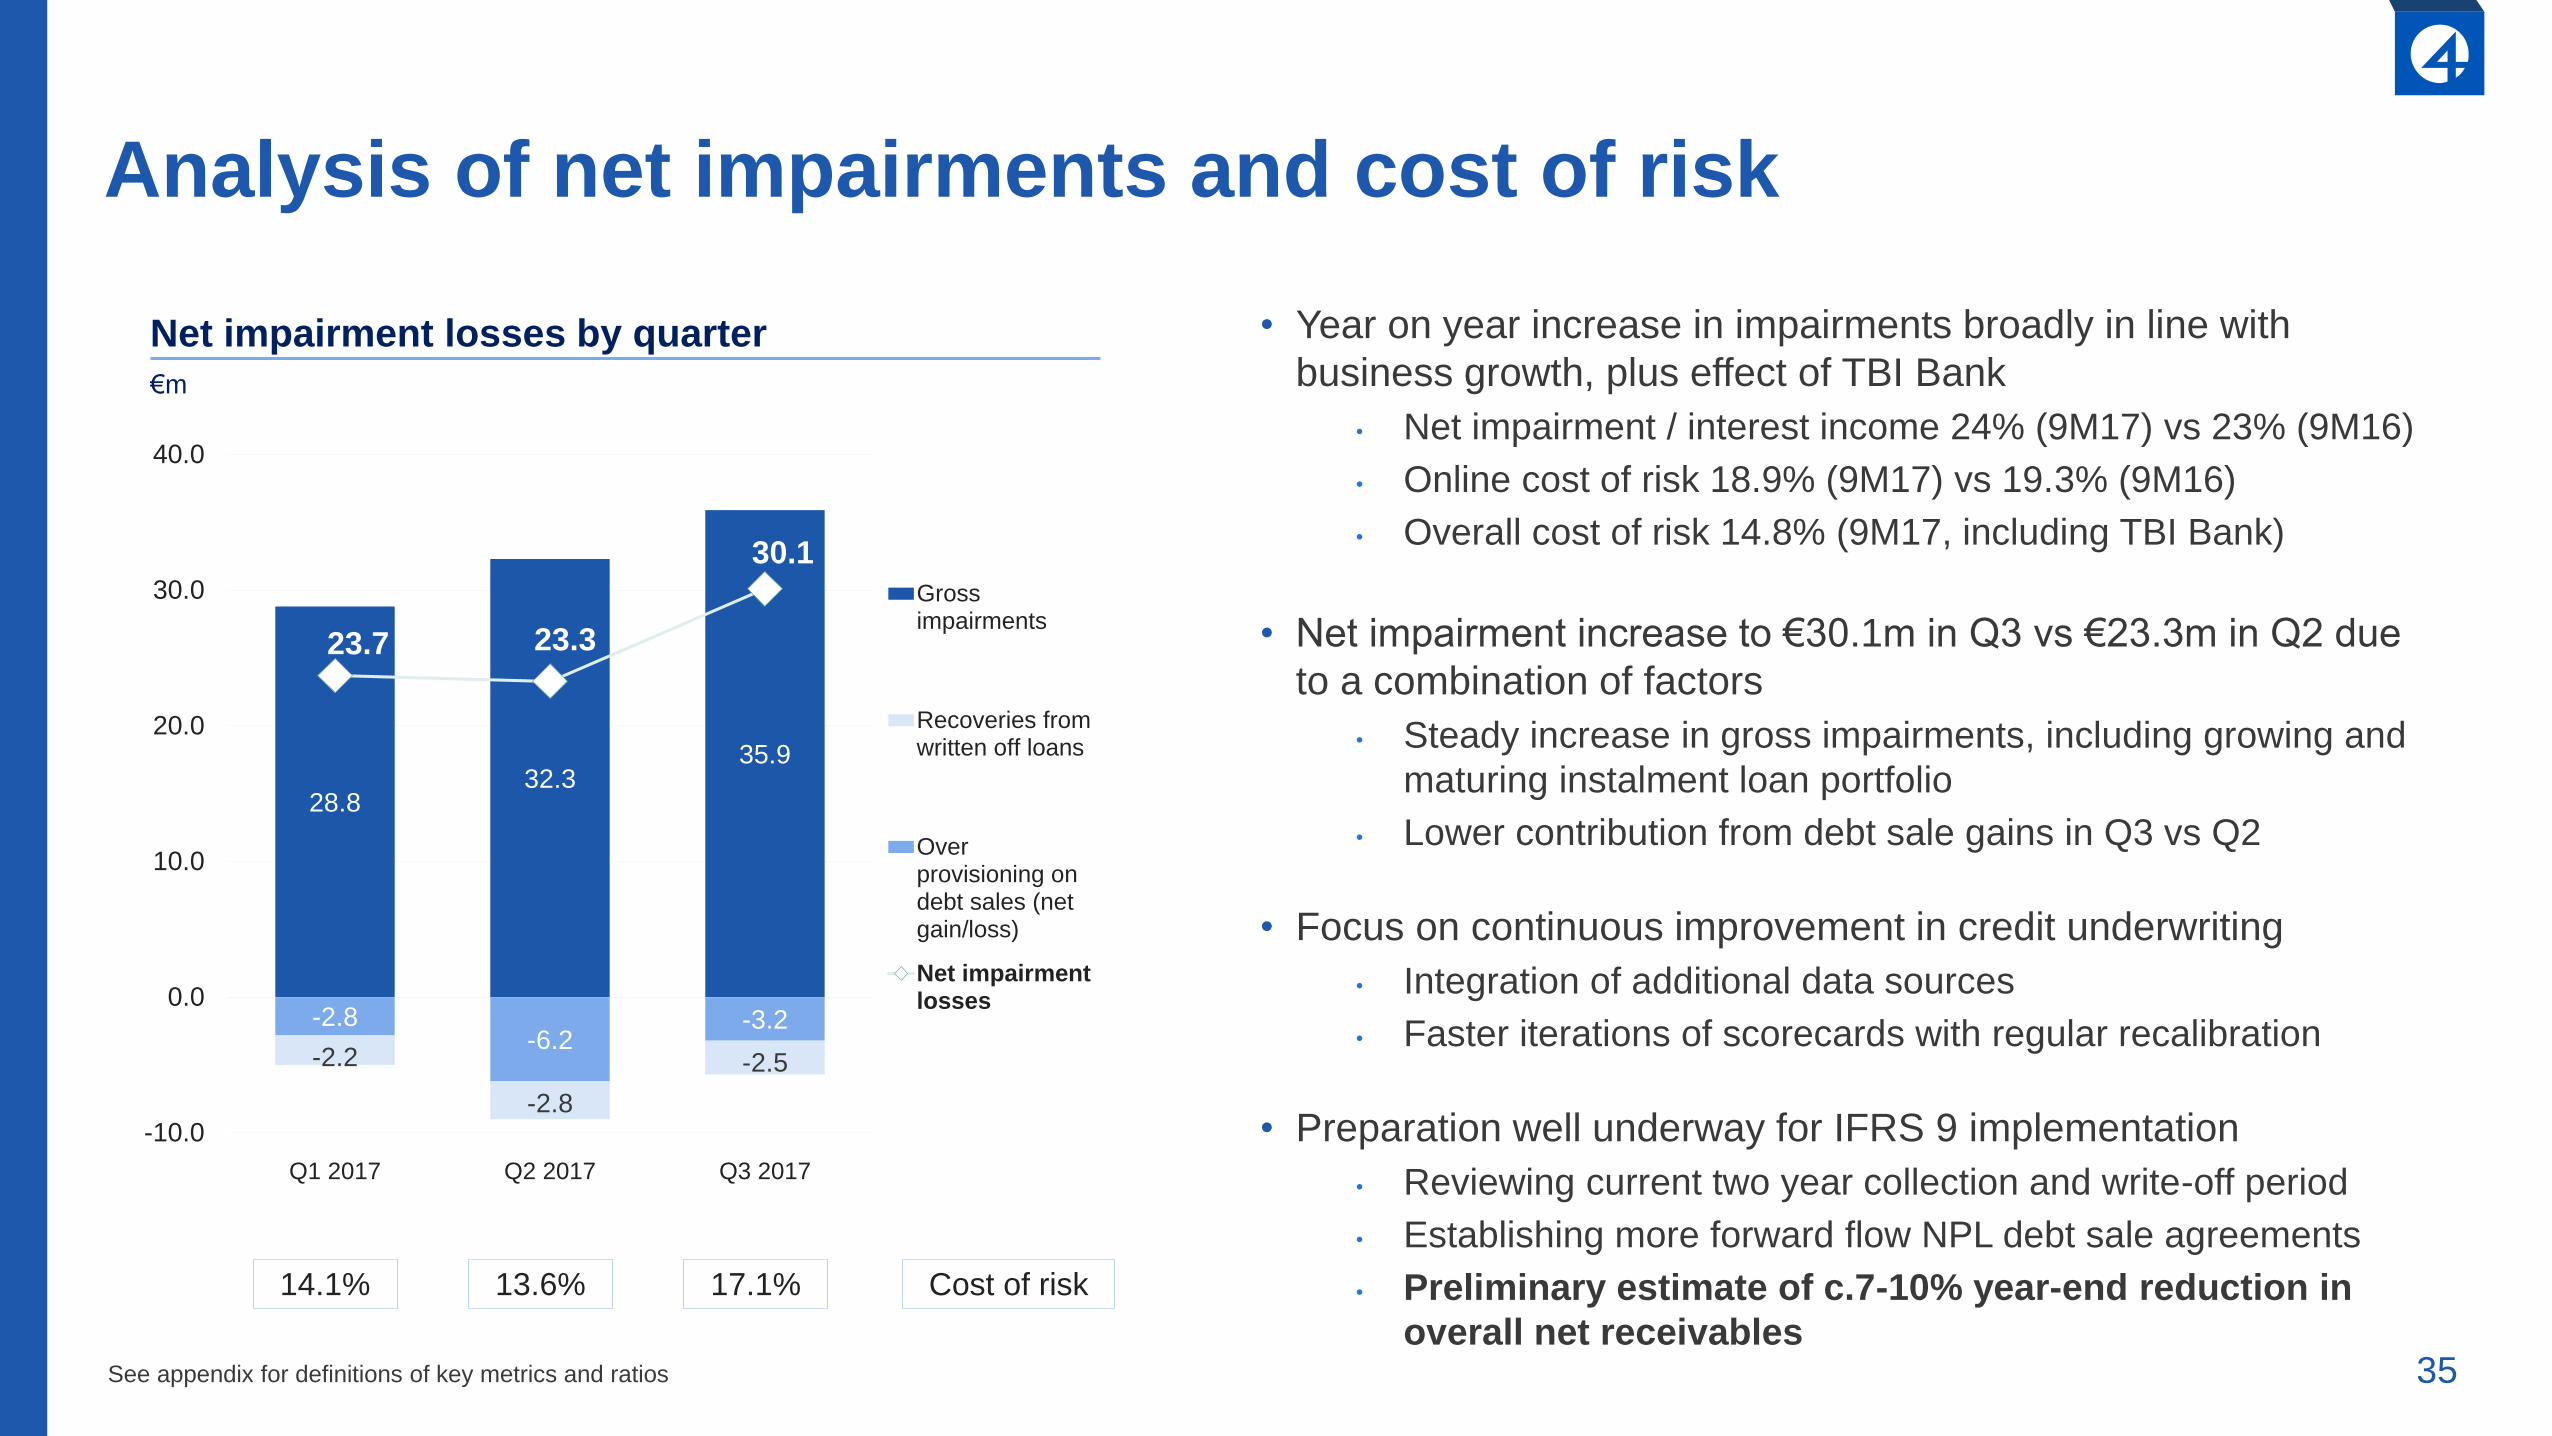
• Year on year increase in impairments broadly in line with
business growth, plus effect of TBI Bank
• Net impairment / interest income 24% (9M17) vs 23% (9M16)
• Online cost of risk 18.9% (9M17) vs 19.3% (9M16)
• Overall cost of risk 14.8% (9M17, including TBI Bank)
• Net impairment increase to €30.1m in Q3 vs €23.3m in Q2 due
to a combination of factors
• Steady increase in gross impairments, including growing and
maturing instalment loan portfolio
• Lower contribution from debt sale gains in Q3 vs Q2
• Focus on continuous improvement in credit underwriting
• Integration of additional data sources
• Faster iterations of scorecards with regular recalibration
• Preparation well underway for IFRS 9 implementation
• Reviewing current two year collection and write-off period
• Establishing more forward flow NPL debt sale agreements
• Preliminary estimate of c.7-10% year-end reduction in
overall net receivables
Net impairment losses by quarter
€m
14.1% 13.6% 17.1% Cost of risk
See appendix for definitions of key metrics and ratios

36
Gross
amount % of gross
Impairment
allowance
Net
amount
Impairment /
gross
Gross
amount % of gross
Impairment
allowance
Net
amount
Impairment /
gross
Online receivables
DPD 0 251.6 51.0% 7.3 244.3 2.9% 216.7 45.7% 6.3 210.4 2.9%
DPD 1-30 25.6 5.2% 6.8 18.8 26.5% 25.6 5.4% 6.2 19.3 24.4%
DPD 31-60 18.5 3.7% 8.0 10.5 43.3% 17.8 3.7% 7.8 10.0 43.8%
DPD 61-90 15.5 3.1% 7.4 8.0 48.0% 14.6 3.1% 7.3 7.3 50.1%
Performing 311.1 63.1% 29.5 281.6 9.5% 274.7 58.0% 27.7 247.0 10.1%
DPD 91-360 102.8 20.8% 59.1 43.7 57.5% 102.8 21.7% 57.0 45.8 55.5%
DPD 361-730 79.5 16.1% 58.8 20.7 73.9% 96.5 20.4% 72.9 23.6 75.6%
Non-performing 182.3 36.9% 117.9 64.4 64.7% 199.3 42.0% 129.9 69.4 65.2%
Online total 493.4 100.0% 147.4 346.0 29.9% 474.0 100.0% 157.6 316.4 33.3%
TBI Bank receivables
Performing 204.0 89.7% 3.9 200.1 1.9% 170.3 89.1% 1.4 168.9 0.8%
Non-performing 23.3 10.3% 13.7 9.6 58.8% 20.8 10.9% 12.2 8.6 58.5%
TBI Bank total 227.3 100.0% 17.6 209.7 7.7% 191.1 100.0% 13.6 177.5 7.1%
Overall group receivables
Performing 515.2 71.5% 33.4 481.8 6.5% 445.0 66.9% 29.1 415.9 6.5%
Non-performing 205.6 28.5% 131.6 74.0 64.0% 220.1 33.1% 142.1 78.0 64.6%
Overall total 720.7 100.0% 165.0 555.8 22.9% 665.1 100.0% 171.2 493.9 25.7%
(in millions of €, except percentages) (in millions of €, except percentages)
30 September 2017 31 December 2016
Asset quality and provisioning
• Improvement in asset quality visible during 9M 2017
• Online gross NPL ratio declined by 5.1% from 42.0% as of Dec 2016 to 36.9% as of Sep 2017 (positive impact from NPL debt sales)
• Overall gross NPL ratio now below 30%
Performing receivables 0-90 DPD; non-performing receivables 91+ DPD

37
€2,324m€2,142m
€182m
Loans issued 07/2015-06/2017(730 days)
NPLs as of 30/09/2017 Repaid and performing loans30/09/2017
NPL / sales ratio improving, but less relevant going forward
Conservative online loan provision coverageNon-performing loans (NPLs) as % of total loans issued(1)
7.8% of total
loans issued
Improving NPLs to issued loans ratio(1)
9.2% 8.8% 9.0% 9.3%
7.8%
2013 2014 2015 2016 9M'2017
• Loans that are overdue more than 90 days are considered as non-performing
(NPLs)
• As of 30/09/2017, online NPLs represented 7.8% of total online issued loans
over the last 730 days (ie the period most NPLs remain on balance sheet)
• Actual loss experienced on NPLs is approximately 50%-60% (55% as of
30/09/2017). Provisions for default are typically 5-10 p.p. higher
• NPL/issued loans metric becomes less relevant as proportion of longer term
instalment loans increases and debt sales volumes increase
Note: (1) Total issued loans include the amount of online loans issued, excluding TBI Bank, during 730 days ending 90 days prior to the end of period. See appendix for further definitions
55%
65%
81%
10%
Loss given default Provisionfor default portfolio
Provision coveragebuffer
Overall provisioncoverage

38
Online: asset quality trends for single payment loans
• Non-performing loans to loan issuance ratio
tends to improve over time in each market
• More data: better scorecards
• More experience: better debt collection
• More returning customers
• Different characteristics for each market
• Portfolio mix shift drives overall Group
NPL/sales ratio (eg growth in Spain)
• Impact of debt sales in certain markets (eg
Poland, Spain, Sweden, Finland)
• Higher NPL ratio countries also have higher
interest rates
• Impairment / interest income ratio stable0%
5%
10%
15%
20%
25%
2013 2014 2015 2016 9M 2017
Spain
Bulgaria
Georgia
Czech Republic
Denmark
Poland
Latvia
Lithuania
Finland
Sweden
Non-performing online loans / 2 year online loan issuance

39
Banking: TBI portfolio overview
97 105132
165
5565
62
60
153169
194
225
0
40
80
120
160
200
240
2014 2015 2016 9M'2017
SME (includingfinancial leases)
Retail
Net loan portfolio(1), m EUR
Consumer gross portfolio by type, 30/9/2017
Note (1) Gross loan portfolio less provisions for bad debts, based on management reporting, book value
58%
36%
5% 1%Cash instalment loans (€873 av. size, 124k active, 52% av. Rate)
POS (€282 av. size, 217k active, 38% av. Rate)
Cards (€298 av. size, 29k active, 27% av. Rate)
Other
• Clear customer segments
• Consumer loans in Bulgaria and Romania, including cash instalment loans (offline and online), point of sale loans and credit cards. 370k active loans with average sizes of c.€900 for cash instalment loans and c.€300 for POS/cards
• SME loans, usually collateralised (785 active loans with average sizes of €63k)
• SME finance leases (405 active loans with average sizes of €32k)
• Steady growth in loan portfolio
• Consumer loan growth of €33m in net portfolio during 9M 2017, particularly cash instalment loans
• SME portfolio deliberately kept at stable overall total, with some sector rotation
• Increasing consumer portfolio, with higher yields, results in higher blended asset yield
• Stable asset quality and robust capital ratios
• 11.3% gross NPL ratio (vs 10.7% at FY16) with low cost of risk (5% for 9M 2017)
• Capital Adequacy Ratio of 24.9% (vs 22.3% at FY16) remains robust with substantial headroom
TBI portfolio overview
+15%+16%

40
Glossary/Definitions• Adjusted EBITDA – a non-IFRS measure that represents EBITDA (profit for the period plus tax, plus interest expense, plus depreciation and amortization) as adjusted by income/loss from discontinued operations, non-cash gains and losses
attributable to movement in the mark-to-market valuation of hedging obligations under IFRS, goodwill write-offs and certain other one-off or non-cash items. Adjusted EBITDA, as presented here, may not be comparable to similarly-titled measures that are reported by other companies due to differences in the way these measures are calculated. Further details of covenant adjustments can be found in the relevant bond prospectuses, available on our website
• Adjusted interest coverage – Adjusted EBITDA / interest expense
• Cost of risk – Annualised net impairment loss / average gross receivables (total gross receivables as of the start and end of each period divided by two)
• Cost / income ratio – Operating costs / operating income
• Equity / assets ratio – Total equity / total assets
• Equity / net receivables – Total equity / net customer receivables (including accrued interest)
• Gross NPL ratio – Non-performing receivables (including accrued interest) with a delay of over 90 days / gross receivables (including accrued interest)
• Gross receivables – Total amount receivable from customers, including principal and accrued interest, after deduction of deferred income
• Interest income – Interest and similar income generated from our customer loan portfolio
• Loss given default – Loss on non-performing receivables (i.e. 1 - recovery rate) based on recoveries on 21/36 month window for single payment/instalment loans, reduced by costs of collection, discounted at weighted average cost of capital
• Net impairment to interest income ratio – Net impairment losses on loans and receivables / interest income
• Net interest margin – Annualised net interest income / average gross receivables (total gross receivables as of the start and end of each period divided by two)
• Net receivables – Gross receivables (including accrued interest) less impairment provisions
• Non-performing receivables (NPLs) – Receivables that are over 90 days past due
• Non-performing receivables to loan issuance ratio – Non-performing online receivables / value of online loans issued. The value of loans issued represents online loans issued for the two-year period before commencement of the 90 day past-due period, eg for 30 September 2017: 1 July 2015 to 30 June 2017
• Overall provision coverage – Allowance account for provisions / non-performing receivables
• Profit before tax margin – Profit before tax / interest income
• Return on average assets – Annualised profit from continuing operations / average assets (total assets as of the start and end of each period divided by two)
• Return on average equity – Annualised profit from continuing operations / average equity (total equity as of the start and end of each period divided by two)
• TBI Bank Capital adequacy ratio – (Tier One Capital + Tier Two Capital) / Risk weighted assets (calculated according to the prevailing regulations of the Bulgarian National Bank)

41
Contacts
Investor [email protected]
James EtheringtonHead of Investor RelationsPhone: +44 7766 697 950E-mail: [email protected]
Paul GoldfinchChief Financial OfficerPhone: +371 2572 6422E-mail: [email protected]
Headquarters17a-8 Lielirbes street, Riga, LV-1046, Latvia