Embed Size (px)
Citation preview

Morphology and Roughness of Silver Deposit Formed by Cementation atVarious Temperatures in Pure Sulfuric Acid
by Grzegorz D. Sulka*, and Marian Jaskuła
Department of Physical Chemistry, Faculty of Chemistry, Jagiellonian University, Ingardena 3,30-060 Krakow, Poland
(phone: +48-12-6632266; fax: +48-12-6340515; e-mail: [email protected])
The morphology and surface roughness of silver (Ag) deposit formed on metallic copper (Cu) bycementation conducted in a 0.5M H2SO4 solution was investigated at various temperatures above 258.The influence of the presence or absence of oxygen (O2) on Ag morphology was studied at an initialAg+ concentration of 20 mg/dm3. An analysis of distribution diagrams of the surface height calculatedfrom scanning-electron-microscope (SEM) top-view images was performed. The cementation reactionresults in a non-homogeneous Ag deposit formed on the surface independently of the presence orabsence of O2 in solution. The Ag deposit covers Cu mainly with a uniform and compact layer with sep-arated germs of predendrites, but also a huge :fern-leaf-shaped; and :lycopodium-twigs-shaped; dendritesappear occasionally on the surface. The presence of O2 in the system and temperature do not affect sig-nificantly the morphology of Ag dendrite as well as a deposit formed on the smooth part of the surface.The roughness of surface with Ag cement varies with temperature only under aerobic conditions wherethe enhanced Cu corrosion increases the size of anodic sites. The results obtained from the surface-height-distribution diagrams constructed for anaerobic conditions showed that the reaction betweenCu+ and Ag+ does not start in the bulk of the solution even at the highest studied temperature.
Introduction. – Cementation is an electrochemical process in which a more-noblemetal ion is reduced to the solid state while a less noble metal is oxidized. The processconsists of two short-circuited half-cell reactions: cathodic and anodic [1] [2]. There-fore, cathodic and anodic sites are generated simultaneously on the surface of theless-noble metal when the cementation process takes place. The progress of cementa-tion involves a constant evolution of the morphology and roughness of the reaction sur-face [1] [2]. This is mainly responsible for difficulties connected with the mechanismdetermination for certain cementation processes as well as with the establishment ofthe correct relation between kinetics of the process and roughness of the deposit [3].
From an industrial point of view, cementation has undeniable advantages such as apure metallic form of recovered metals, simplicity of reaction control, and low energyconsumption [4]. Therefore, cementation techniques have been widely used in industry,not only for recovery or removal of various metals in hydrometallurgy [5–8], but alsofor purification of wastewaters bearing hazardous or poorly degradable metals [9–16].The recovery of precious metals from dilute solutions and wastes by cementation hasbeen used successfully for decades [17–20]. Moreover, cementation is still irreplacea-ble for the purification of process streams in the production of ultra-pure metals such asZn or Cd [21–25]. Cementation of Ag+ on Cu0 can be described by Eqn. 1:
D 2006 Verlag Helvetica Chimica Acta AG, ZGrich
Helvetica Chimica Acta – Vol. 89 (2006)2764

2 Ag++Cu ! 2 Ag+Cu2+ (1)
In our recent papers [26–28], we reported that Ag+ cementation on Cu in acidicsulfate solutions as well as in a pure H2SO4 follows first-order kinetics. The overallkinetics of the process conducted in 0.5M H2SO4 is controlled by mass transfer ofAg+ to the reaction surface [27]. The rate enhancement of the reaction observedafter the initial period of cementation (less than 10 min) carried out in the presenceof 20 mg/dm3 Ag+ was attributed to ca. 20% increase in effective surface area, inde-pendently of the presence of O2 in the system [27]. The mechanism of the processwas fully established for both anaerobic an aerobic solutions containing 0.5M H2SO4/0.5M CuSO4 [29]. It was found that the cementation mechanism consists of two stages.The presence of O2 in the system modifies strongly the second stage. In the first stage ofthe reaction, Cu+ ions appear in solution as a result of the reaction of Ag+ with Cu. Thesecond stage of the reaction conducted under O2-saturated conditions involves the Cu+
oxidation and Ag+ ion reduction. In O2-free solutions, Cu+ ions generated in the firststage can be transferred partially into the bulk of the solution to react as follows:
Ag++Cu+ ! Cu2++Ag0 (colloid) (2)
It should be pointed out that the progress of this side reaction (Eqn. 2) is directlyconnected with a certain value of the Cu+/Ag+ concentration ratio to be reached duringthe cementation process [29]. When cementation is conducted in a 0.5M H2SO4/0.5M
CuSO4 solution under anaerobic conditions, the concentration of Cu+ increasesstrongly due to the interaction between Cu2+ and metallic Cu [29]. This additional con-centration of Cu+ initiates the progress of the reaction (Eqn. 2) in 0.5M H2SO4/0.5M
CuSO4 [29]. In a neat H2SO4, the cementation does not produce enough Cu+ to startthe progress of the reaction in bulk solution [29]. The dependence of the cementationmechanism on the composition of the solution can result in a different morphology ofAg cement formed in the presence or absence of Cu2+ under anaerobic conditions.
The morphology of Ag deposit was investigated before for a 0.5M H2SO4/0.5M
CuSO4 solution at 258 [29]. It was found that the presence or absence of oxygen doesnot affect significantly the silver morphology. Recently, the temperature effect on themorphology and surface roughness of silver deposit formed by cementation in a 0.5M
H2SO4/0.5M CuSO4 solution has been studied [30]. The evolution of surface roughnessduring cementation of Ag+ conducted in the O2-free or O2-saturated electrolyte con-taining 0.5M H2SO4 and 0.5M CuSO4 was also investigated at two different initial con-centrations of Ag+ [31].
The present paper is focused on the temperature influence on the morphology ofAg deposit formed by cementation in a 0.5M H2SO4 solution. The special emphasis isput on the analysis of the surface roughness and its relation to the mechanism of theprocess. Surface-height-distribution diagrams are used to obtain information on themechanism of the process carried out in a solution containing a relatively low concen-tration of Ag+ in comparison to the reaction surface area. The nature of the cementa-tion and electrodeposition processes are very similar due to the redox reactions takingplace in both cases. Therefore, the method can be transferred to the surface-roughnessanalysis of various metallic deposits obtained by electrodeposition.
Helvetica Chimica Acta – Vol. 89 (2006) 2765

Experimental. – All chemical reagents were of anal. grade. Four times distilled H2O was used to pre-pare all solns. Experiments were conducted in a rotating cylinder system described previously [26]. Therotating steel cylinder had a working surface area of 27.5 cm2. Before each run, the rotating cylinder wascarefully pretreated by immersion in HNO3/H2O 1 :1 (v/v), followed by rinsing with H2O and degreasingwith MeOH. Then, the steel cylinder was covered with a fresh 24-mm-thick layer of Cu by electrolysis at aconst. current of 36.4 mA/cm2 for 30 min at 208 in an electrolyte containing 0.5M H2SO4 and 0.5M CuSO4.The deposited Cu layer was electropolished at const. current (72.7 mA/cm2) for 40 s at 208 in H3PO4/H2O3 :1 (v/v) and finally chemically polished for 1 min in 0.5M H2SO4 solution at 208. After polishing, the cyl-inder was rinsed with H2O, dried in air at r.t., and used for the cementation test.
The electrolyte used for cementation was 0.5M H2SO4 containing 20 mg/dm3 of Ag+ (Ag2SO4). Theinitial concentration of Ag+ was determined before the experiment by atomic-absorption spectroscopy(AAS). The electrolyte used in each experiment had a volume of 0.2 dm3, and was stirred at 500 r.p.m.The cementation tests were carried out between 258 and 558. Before each run, the electrolyte in thecell was purged by bubbling with high-purity Ar gas or high-purity O2 for 20 min. The O2-free or O2-satu-rated atmosphere was maintained throughout the whole process by passing Ar or O2. Experiments con-ducted in the presence or absence of O2 are referred to as aerobic and anaerobic, resp. The duration ofeach experiment was 60 min. After each run, the Cu layer with cemented Ag was rinsed carefully anddried at r.t., then cut and separated from the cylinder. Two samples of the Cu sheet with cemented Agwere taken, dissolved in hot HNO3/H2O 1 :1, and analyzed for the Ag content by AAS. The surfacearea of each sample taken for AAS analysis was about 3.5 cm2. For each cementation test, the surfaceof two samples of the Cu sheet with cemented Ag was observed with a Hitachi S-4700 scanning electronmicroscope (SEM). SEM Images were analyzed with the scanning-probe image processor WSxM 3.0Beta [32].
Results and Discussion. – The morphology and roughness of Ag deposit formed bythe cementation was investigated under both O2-free and O2-saturated solutions con-taining 20 mg/dm3 Ag+ at 258 to 558. A typical low-magnification SEM top-viewimage of the Cu surface with cemented Ag (Fig. 1) showed a highly non-homogeneousAg deposit. Most of the surface looked rather smooth and flat. Germs of pre-dendritesas well as a huge single dendrite were occasionally visible on the surface. Similar SEMimages with a single dendrite were observed for other temperatures, independently ofthe presence or absence of O2 in the system. These results suggest a similar Ag coverageof the Cu surface for all temperatures. Indeed, the percentage of cemented silver foundon the copper surface after the cementation process was almost the same for all temper-atures, both under aerobic and anaerobic conditions.
The Table shows the average percentage of cemented Ag in comparison to the ini-tial Ag content (determined by AAS) for O2-free and O2-saturated solutions. The per-centage of cemented Ag was found to oscillate between 78 and 82% in all cases. Thesedata are fully consistent with the previously presented kinetics curves [27], where bothmethods used for the determination of the Ag+ concentration in solution led to thesame result and, consequently, do not reflect the progress of the reaction (Eqn. 2) inO2-free solution, even at the highest studied temperature [27] [29]. It was found thatthe reaction starts in bulk solution only after achieving a certain threshold of theCu+/Ag+ concentration ratio [29]. Therefore, the rate enhancement observed in the lat-ter stage of the process taking place in solution, at an initial Ag+ concentration of 20mg/dm3, is closely related to the increase of the effective surface area of the cathodicsites and formation of dendrites on the surface [27].
To better examine the surface roughness of smooth parts of the Ag cement formedon Cu, higher-magnification SEM top-view images were taken and analyzed. The ana-
Helvetica Chimica Acta – Vol. 89 (2006)2766

lyzed surface area of samples was ca. 500 mm2. Fig. 2 shows SEM top-view images of theCu surface with cemented Ag, together with their surface-height-distribution diagramsat various temperatures in anaerobic solution containing 20 mg/dm3 Ag+. A semi-quan-titative analysis of the surface-height distribution was performed. The peak width athalf peak height, W1/2, was measured for all distribution diagrams (Fig. 2).
At the beginning of the process, Ag covers uniformly the Cu surface with tiny Agcrystals [31]. When the surface is covered compactly, the Ag deposition starts from pro-trusions existing on the surface. As a result of the reaction progress, some germs of pre-dendrites appear on the surface. Such germs of pre-dendrites are visible in SEM imagesas white spots. At the same time, anodic sites are formed on the surface and developtheir working surface area mainly in the Cu material just under the deposited Ag,with formation of deep cavities [29]. Anodic sites are exhibited in SEM images as anet of dark cracks. With increasing temperature, the rate of the cementation processincreases, and anodic sites are regularly spread over the reaction surface [30]. As aresult, at the highest temperature, the dense net of cracks is visible in Fig. 2,c. The dis-tribution diagrams in Fig. 2,a and 2,b do not vary significantly (similar W1/2 values)showing relatively narrow and intense peaks. The peak width W1/2 increases slightly
Fig. 1. SEM Top-view image of the Cu surface with Ag deposit formed by cementation in aerobic solu-tion containing 20 mg/dm3 Ag+ at 358. In 0.5M H2SO4 electrolyte for 60 min.
Table. Average Percentage of Cemented Ag on Cu under Different Cementation Conditions
T [8] Anaerobic Aerobic
na) Ag [%]b) SD [%]c) n Ag [%] SD [%]
25 3 77.7 5.0 3 78.4 1.835 3 82.0 2.9 3 81.7 1.855 3 79.8 1.8 3 80.3 1.8
a) Number of independent cementation experiments. b) Determined by atomic absorption spectroscopy(AAS). c) Standard deviation.
Helvetica Chimica Acta – Vol. 89 (2006) 2767

when the temperature increases to 558. The wide range of surface heights in the positiveregion (protruding) of all diagrams presented in Fig. 2 corresponds closely with pre-dendrites visible in SEM images. At the highest studied temperature, the surface-height-distribution histogram shows a small difference in the negative range of surfaceheights in comparison to the others presented in Fig. 2,a and 2,b. The wider range ofnegative heights in Fig. 2,c exhibits a denser net of anodic sites and is directly respon-
Fig. 2. SEM Top-view images and distribution diagrams of the surface height for an anaerobic solutioncontaining 20 mg/dm3 Ag+ at 258 (a), 358 (b), and 558 (c). In 0.5M H2SO4 electrolyte for 60 min. The
analyzed surface area was ca. 500 mm2.
Helvetica Chimica Acta – Vol. 89 (2006)2768

sible for the observed increase in W1/2. SEM Top-view images taken at various temper-atures and, especially, surface-height-distribution diagrams can indicate formation ofcathodic and anodic sites on the surface in the cementation process.
SEM top-view images of the Cu surface with Ag deposit formed at various temper-atures in O2-saturated solution containing 20 mg/dm3 Ag+ are presented in Fig. 3,together with the corresponding surface-height-distribution diagrams calculated for asurface area of ca. 500 mm2. Similar as for the O2-free solution, some germs of dendritesare visible on the reaction surface. In contrast to the O2-free solution, temperature has agreat impact on the morphology of Ag deposit when O2 is present in the system. As canbe expected for aerobic conditions, especially at the highest temperature, Cu corrosionis strongly enhanced. As a result, the anodic sites are spread uniformly over the reac-tion surface and form a very dense net of broad cracks (Fig. 3,c).
Increasing temperature modifies the roughness of the Ag deposit formed in thepresence of O2, as clearly reflected in the distribution diagrams. With increasing tem-perature, a broadening of peaks occurs (W1/2 increases) as a result of formation andexpansion of the anodic sites on the surface. The presence of these anodic sites is espe-cially pronounced at 558, with a very wide range of negative values in the diagramheights (Fig. 3,c). It should be pointed out that the percentage of cemented Ag remainsalmost constant for the studied range of temperatures (Table) and cannot affect the sur-face-height-distribution diagrams. For O2-saturated solutions, due to enhanced Cu cor-rosion, the surface-height-distribution diagrams show broader peaks than those foundunder O2-free conditions (W1/2 in Fig. 2 vs. Fig. 3).
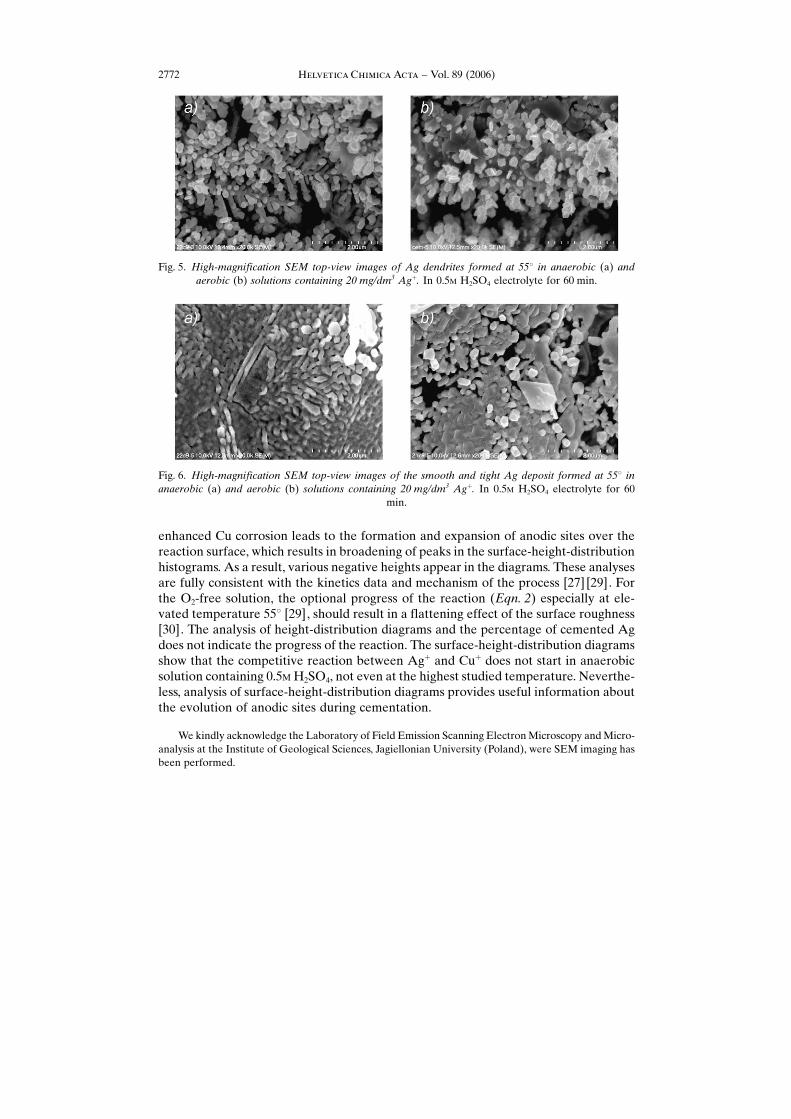
As mentioned before, the cementation process can promote formation of huge Agdendrites. Some parts of the surface are covered with tiny Ag crystals, but others areoccupied by :fern-leaf-shaped; and :lycopodium-twigs-shaped; dendrites. Fig. 4 showsSEM images of such Ag dendrites. Their morphology does not change significantlywith increasing temperature. Moreover, the presence or absence of O2 in the systemdoes not modified strongly the :fern leaf-shaped; dendrites. The only (small) differencecan be observed for the O2-saturated solution at temperatures above 258 (Fig. 4,d and4, f): the Ag deposit seems to be a bit denser and the :twigs; thicker. To further illustratethe possible influence of the presence of O2 on the morphology of dendrites, higher-magnification SEM images are presented in Fig. 5. There is no observable differencein the morphology of Ag dendrites formed at 558 under anaerobic or aerobic condi-tions. The :fern-leaf-shaped; dendrites seems to be covered with fine granular Ag crys-tals sticking out from their surface independently of the presence or absence of O2.
Higher-magnification SEM top-view images of the surface with Ag deposited at 558under anaerobic and aerobic conditions are shown in Fig. 6. The images have beentaken from a flat part of the surface where no dendrite formation was observed. SimilarSEM images of the reaction surface were taken for other studied temperatures. Here,the Ag deposit covers Cu with a uniform Ag layer. Moreover, the size of the Ag crystalsis independent of the presence or absence of O2 in the system. Previously, it was foundthat the adherence of the Ag deposit formed in the O2-free solution was a bit betterthan under aerobic conditions [29]. This apparent difference can be attributed to theevident presence of the anodic site in the close neighbourhood of the examined depositformed in the presence of O2. This detailed examination of Ag crystals formed at var-
Helvetica Chimica Acta – Vol. 89 (2006) 2769

ious temperatures shows that the presence of O2 as well as temperature do not influ-ence significantly the morphology of Ag deposit.
Conclusions. – The cementation process conducted in 0.5M H2SO4 solution contain-ing 20 mg/dm3 Ag+ leads to formation non-homogeneous Ag deposit on the surface,independently of the presence or absence of O2 in the system. Parts of the surface
Fig. 3. SEM Top-view images and distribution diagrams of the surface height for an aerobic solutioncontaining 20 mg/dm3 Ag+ at 258 (a), 358 (b), and 558 (c). In 0.5M H2SO4 electrolyte for 60 min. The
analyzed surface area was ca. 500 mm2.
Helvetica Chimica Acta – Vol. 89 (2006)2770

are covered with a relatively smooth Ag deposit with germs of pre-dendrites, but othersexhibits huge :fern leaf-shaped; and :lycopodium-twigs-shaped; dendrites. The pres-ence of O2 and temperature do not affect significantly the morphology of Ag dendritesas well as the deposit formed on the smooth part of the surface.
For O2-free solutions, the surface-height-distribution diagrams calculated at varioustemperatures for the part of the surface where Ag deposit exhibits a relatively tight,well-adhered structure, with some separate germs of pre-dendrites, show no differencein surface roughness. The roughness of the deposit increases significantly with increas-ing temperature in the case when O2 is present in solution. In the presence of O2,
Fig. 4. SEM Top-view images of Ag dendrites formed at various temperatures in anaerobic and aerobicsolutions containing 20 mg/dm3 Ag+. In 0.5M H2SO4 electrolyte for 60 min.
Helvetica Chimica Acta – Vol. 89 (2006) 2771
enhanced Cu corrosion leads to the formation and expansion of anodic sites over thereaction surface, which results in broadening of peaks in the surface-height-distributionhistograms. As a result, various negative heights appear in the diagrams. These analysesare fully consistent with the kinetics data and mechanism of the process [27] [29]. Forthe O2-free solution, the optional progress of the reaction (Eqn. 2) especially at ele-vated temperature 558 [29], should result in a flattening effect of the surface roughness[30]. The analysis of height-distribution diagrams and the percentage of cemented Agdoes not indicate the progress of the reaction. The surface-height-distribution diagramsshow that the competitive reaction between Ag+ and Cu+ does not start in anaerobicsolution containing 0.5M H2SO4, not even at the highest studied temperature. Neverthe-less, analysis of surface-height-distribution diagrams provides useful information aboutthe evolution of anodic sites during cementation.
We kindly acknowledge the Laboratory of Field Emission Scanning Electron Microscopy and Micro-analysis at the Institute of Geological Sciences, Jagiellonian University (Poland), were SEM imaging hasbeen performed.
Fig. 5. High-magnification SEM top-view images of Ag dendrites formed at 558 in anaerobic (a) andaerobic (b) solutions containing 20 mg/dm3 Ag+. In 0.5M H2SO4 electrolyte for 60 min.
Fig. 6. High-magnification SEM top-view images of the smooth and tight Ag deposit formed at 558 inanaerobic (a) and aerobic (b) solutions containing 20 mg/dm3 Ag+. In 0.5M H2SO4 electrolyte for 60
min.
Helvetica Chimica Acta – Vol. 89 (2006)2772

REFERENCES
[1] M. E. Wadsworth, Trans. Met. Soc. AIME 1969, 245, 1381.[2] J. D. Miller, Metall. Treatises 1981, 95.[3] G. P. Power, I. M. Ritchie, in :Modern Aspect of Electrochemistry;, Eds. B. E. Conway, J. O;M.
Bockris, Plenum Press, New York 1975, Vol. 11, pp. 199–250.[4] R. D. Agrawal, J. Mines, Metals Fuels 1988, March, 138.[5] M. El-Batouti, J. Colloid Interface Sci. 2005, 283, 123.[6] A. A. Mubarak, A. H. El-Shazly, A. H. Konsowa, Desalination 2004, 167, 127.[7] M.-S. Lee, J.-G. Ahn, J.-W. Ahn, Hydrometallurgy 2003, 70, 23.[8] F. A. LOpez, M. I. MartPn, C. PQrez, A. LOpez-Delgado, F. J. Alguacil, Water Res. 2003, 37, 3883.[9] M. El-Batouti, Anti-Corrosion Meth. Mater. 2005, 52, 42.
[10] A. Dib, L. Makhloufi, Chem. Eng. Process. 2004, 43, 1265.[11] K. Lee, I. Lee, J. Ind. Eng. Chem. 2004, 10, 196.[12] S. A. Nosier, Chem. Biochem. Eng. Q. 2003, 17, 219.[13] Y.-S. Shen, Y. Ku, M.-H. Wu, Sep. Sci. Technol. 2003, 38, 3513.[14] Y. Ku, M.-H. Wu, Y.-S. Shen, Waste Manage. 2002, 22, 721.[15] T. Bigg, S. J. Judd, Environ. Technol. 2000, 21, 661.[16] S. A. Nosier, S. A. Sallam, Sep. Purif. Technol. 2000, 18, 93.[17] J. D. Miller, R. Y. Wan, J. R. Parga, in :Precious and Rare Metal Technologies;, Eds. A. E. Torma, I.
H. Gundiler, Elsevier, Amsterdam, Oxford, New York, Tokyo, 1989, pp. 281–290.[18] C. A. Fleming, Hydrometallurgy 1992, 30, 127.[19] B. Dçnmez, F. Sevim, S. Colak, Chem. Eng. Technol. 2001, 24, 91.[20] S. H. Castro, M. STnchez, J. Cleaner Prod. 2003, 11, 207.[21] B. B. Boyanov, V. V. Konareva, N. K. Kolev, Hydrometallurgy 2004, 73, 163.[22] J. NUsi, Hydrometallurgy 2004, 73, 123.[23] T. M. Dreher, A. Nelson, G. P. Demopoulos, D. Filippou, Hydrometallurgy 2001, 60, 105.[24] D. Stanojevic, B. Nikolic, M. Todorovic, Hydrometallurgy 2000, 54, 151.[25] A. Nelson, W. Wang, G. P. Demopoulos, G. Houlachi, Min. Pro. Ext. Met. Rev. 2000, 20, 325.[26] G. D. Sulka, M. Jaskuła, Hydrometallurgy 2002, 64, 13.[27] G. D. Sulka, M. Jaskuła, Hydrometallurgy 2003, 70, 185.[28] G. D. Sulka, M. Jaskuła, Hydrometallurgy 2005, 77, 131.[29] G. D. Sulka, M. Jaskuła, Hydrometallurgy 2004, 72, 93.[30] G. D. Sulka, M. Jaskuła, Helv. Chim. Acta 2006, 89, 427.[31] G. D. Sulka, M. Jaskuła, Helv. Chim. Acta 2006, 89, 902.[32] WSxM, Nanotec Electronica SL, Spain (http://www.nanotec.es).
Received July 10, 2006
Helvetica Chimica Acta – Vol. 89 (2006) 2773


