Embed Size (px)
Citation preview
Final Report for the Variable Speed Integrated Intelligent HVAC Blower
Final Report for BP2 (12/2001 - 6/2003)
Project Start Date: 9/29/00 Interim Topical Report: 11/14/2001 Project End Date: 6/1/2003 Principal Author:
Herman Wiegman Contributing Authors: Charlie Stephens Ralph Carl Paul Szczesny Xiaoyue Liu Sunny Zhuang Kamron Wright Date of Issue: September 23, 2003 DOE Award: DE-FC26-00NT40993 Submitting Organization: GE Global Research Attn: Herman Wiegman, K1-3C26 1 Research Circle Niskayuna, NY 12309 TEL: (518) 387-7527 [email protected]

DE-FC26-00NT40993 p. 2 of 25 Final Report 6/2003
DISCLAIMER
This report was prepared as an account of work sponsored by an agency of the United States Government. Neither the United States Government nor any agency thereof, nor any of their employees, makes any warranty, express or implied, or assumes any legal liability or responsibility for the accuracy, completeness, or usefulness of any information, apparatus, product, or process disclosed, or represents that its use would not infringe privately owned rights. Reference herein to any specific commercial product, process, or service by trade name, trademark, manufacturer, or otherwise does not necessarily constitute or imply its endorsement, recommendation, or favoring by the United States Government or any agency thereof. The views and opinions of authors expressed herein do not necessarily state or reflect those of the United States Government or any agency thereof.
Abstract This comprehensive topical report discusses the key findings in the development of an advanced blower for HVAC applications. The benefits of rearward inclined blades over that of traditional forward inclined blades is well documented, and several prototype wheels are demonstrated in various housings. A comparison of retrofitted blowers to that of three typical units from the industry is presented. The design and modification of the blower housing is addressed and the impact of size limitations on static efficiency is discussed. The roadmap to rearward-inclined wheel technology insertion is presented and typical static efficiency gains are documented.

DE-FC26-00NT40993 p. 3 of 25 Final Report 6/2003
Table of Contents I. Executive Summary .............................................................................................................................................. 5 II. Introduction........................................................................................................................................................... 6 III. Performance Evaluation........................................................................................................................................ 9
A. Blower Performance Metrics ....................................................................................................................... 9 B. HVAC Application Focus .......................................................................................................................... 10 C. Exhaust (or Blast) Area Effects.................................................................................................................. 11 D. Inlet Cone Effects ...................................................................................................................................... 13 E. Cabinet Effects........................................................................................................................................... 14 F. RI Blade Angle .......................................................................................................................................... 15 G. Blower Curve Testing ................................................................................................................................ 16
1. GE demonstration housings..................................................................................................................... 16 2. Type W Housing ..................................................................................................................................... 17 3. Type Y Housing ...................................................................................................................................... 18 4. Type Z Housing....................................................................................................................................... 20
H. Performance Conclusions........................................................................................................................... 21 IV. Additional Performance Enhancements .............................................................................................................. 22
A. Trailing Blade Edge Angle ........................................................................................................................ 22 B. Housing Aspect Ratio ................................................................................................................................ 22 C. Asymmetrical wheels or inlet cones........................................................................................................... 23
V. Additional Features of the Advanced HVAC Blower ......................................................................................... 23 1. Blower Noise........................................................................................................................................... 23 2. Uniformity of Airflow ............................................................................................................................. 24
VI. Conversion Factors ............................................................................................................................................. 25 VII. References........................................................................................................................................................... 25 VIII. List of Acronyms and Abbreviations .................................................................................................................. 25
List of Figures Figure 1 Air moving system efficiency progress vs. technology and SEER regulations. .............................................................................7 Figure 2 Progressive approach to inserting higher efficiency blowers into the market place without loss of tooling investment nor
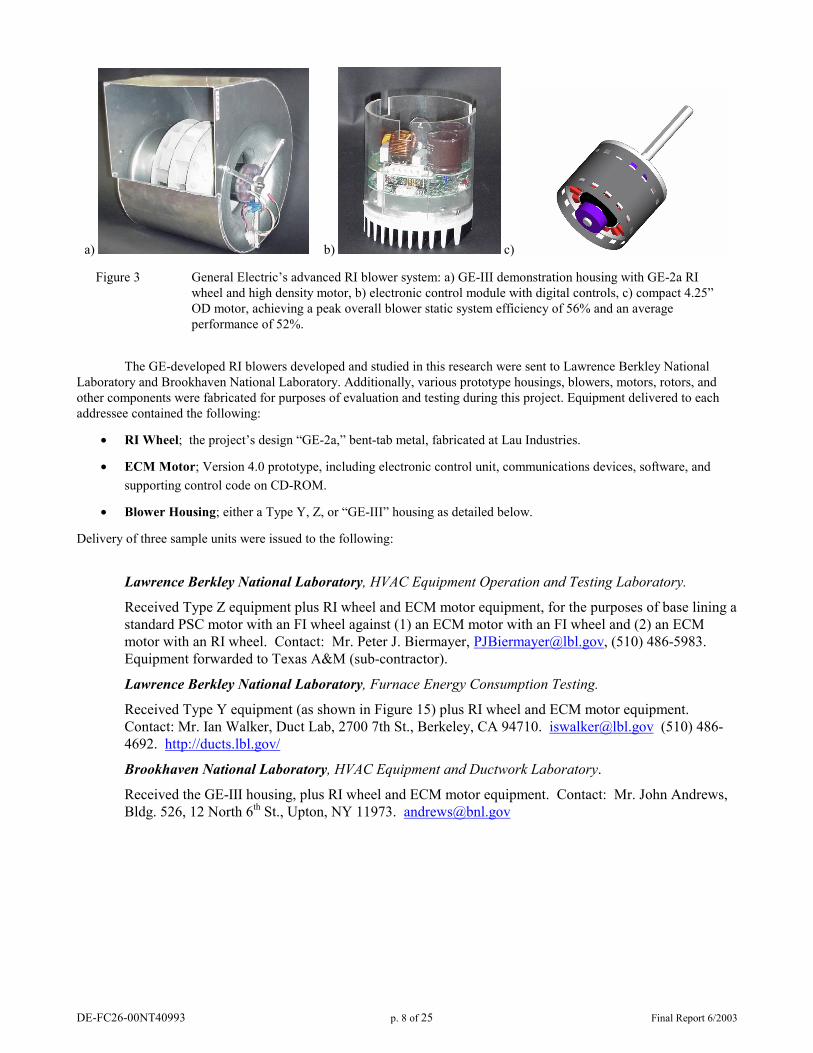
product life cycle investments..................................................................................................................................................7 Figure 3 General Electric’s advanced RI blower system: a) GE-III demonstration housing with GE-2a RI wheel and high density
motor, b) electronic control module with digital controls, c) compact 4.25” OD motor, achieving a peak overall blower static system efficiency of 56% and an average performance of 52%......................................................................................8
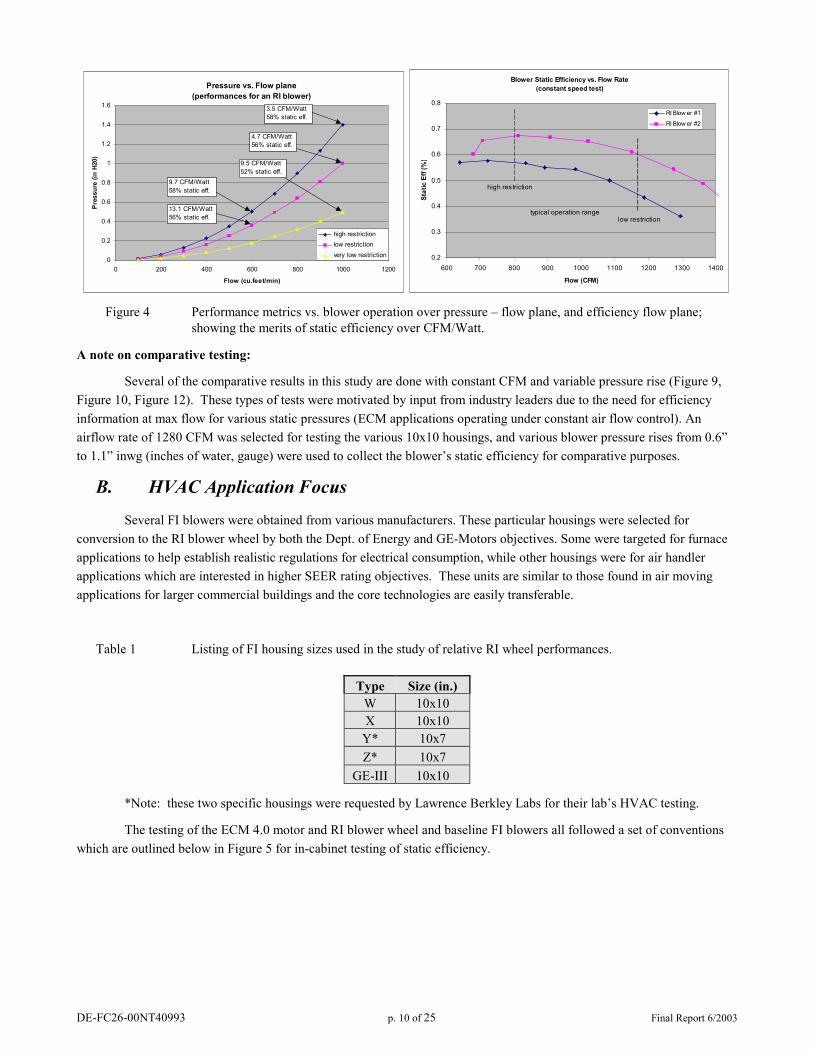
Figure 4 Performance metrics vs. blower operation over pressure – flow plane, and efficiency flow plane; showing the merits of static efficiency over CFM/Watt. ....................................................................................................................................................10
Figure 5 Typical in-cabinet testing and pressure sensing locations which included dynamic intake losses in the blower pressure rise data. .......................................................................................................................................................................................11
Figure 6 Exit air velocity distributions for FI and RI blowers, suggesting an advantage to larger housing exhaust areas for RI wheels, over the FI wheel baseline case..............................................................................................................................................11
Figure 7 Blower static efficiency vs. exhaust area enlargement for both RI and FI versions of two blower applications (both 10x10 applications), suggesting that RI wheels can benefit from 45% larger exhaust area on legacy FI housings. .........................12
Figure 8 Top view of Type X housing with RI wheel installed, exhaust area increases via the cut off plate modification. (Note: base case is normally fitted with a 10x10 FI blower wheel) ..........................................................................................................12
Figure 9 Blower static efficiency vs. pressure rise for various exhaust areas; a) Type X with RI and FI wheels, b) Type W with FI case (nominal and +29% exhaust area).*.......................................................................................................................................13
Figure 10 Blower static efficiency vs. pressure rise for both RI and FI wheels in a Type W housing [1280 CFM] (note: Mod 1 = +16% exhaust area, Mod 2 = +32% exhaust area, optimal improvement projected at +45% exhaust area). .........................13
Figure 11 Inlet cones for the RI blower; a) ProE rendering of the Lau #1 cone, b) 2-D conceptual differences between experimental cones, c) static efficiency results based on “in housing” tests................................................................................................14
Figure 12 Blower static efficiency vs. pressure rise for both RI and FI implementations in a Type W housing, both inside and outside of cabinet (1280 CFM)..............................................................................................................................................15
Figure 13 Metal GE-2a wheel performance, with 3 blade pitch angles, in a GE-III housing, 1500 RPM, tested at Lau Industries, Dayton, OH, Feb. 2003.........................................................................................................................................................16
DE-FC26-00NT40993 p. 4 of 25 Final Report 6/2003
Figure 14 RI wheel equipped (GE-2a wheel) Type W housing blower curves for two RPMs. ...............................................................17 Figure 15 Type Y RI wheel retrofit with motor mount extensions and no exhaust area modifications...................................................18 Figure 16 Type Y performance curves for both RI and FI wheels; a) blower pressure rise vs. flow and b) efficiency vs. flow,
showing a 6-10% static efficiency gain over a typical operating region. ...............................................................................19 Figure 17 Type Z performance curves for an RI wheel ...........................................................................................................................20 Figure 18 Static blower efficiency at two operating points vs. overall wheel diameter for a target 3-ton cooling application using a
parametric GE-2a RI wheel design. .......................................................................................................................................22 Figure 19 CFD blower curve analysis showing asymmetry between motor and non-motor sides...........................................................23 Figure 20 Anemometer recordings of the exit air flow velocity for the ½ wide GE-I demonstration system vs. inches from the lower
left origin position. ................................................................................................................................................................24 Figure 21 3D CFD computations (simulated) of the exit air velocity (z-axis component) at the exit port of the GE-II demonstration
system, showing the asymmetry due to the motor restriction in one intake cone (left side.) .................................................24
List of Tables Table 1 Listing of FI housing sizes used in the study of relative RI wheel performances. .......................................................................10 Table 2 Summary of Performance Conclusions........................................................................................................................................21 Table 3 Sound pressure level at 1 meter and 0.567 m3/sec (1200 CFM) ..................................................................................................24
DE-FC26-00NT40993 p. 5 of 25 Final Report 6/2003
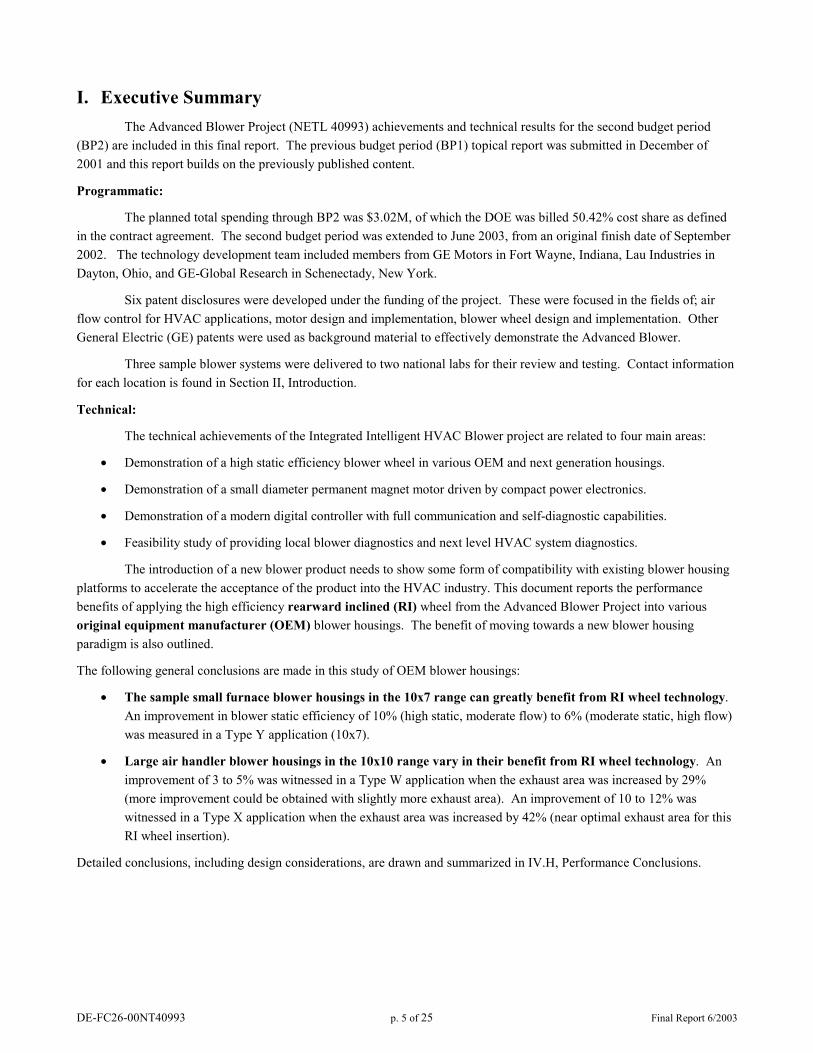
I. Executive Summary The Advanced Blower Project (NETL 40993) achievements and technical results for the second budget period (BP2) are included in this final report. The previous budget period (BP1) topical report was submitted in December of 2001 and this report builds on the previously published content.
Programmatic:
The planned total spending through BP2 was $3.02M, of which the DOE was billed 50.42% cost share as defined in the contract agreement. The second budget period was extended to June 2003, from an original finish date of September 2002. The technology development team included members from GE Motors in Fort Wayne, Indiana, Lau Industries in Dayton, Ohio, and GE-Global Research in Schenectady, New York.
Six patent disclosures were developed under the funding of the project. These were focused in the fields of; air flow control for HVAC applications, motor design and implementation, blower wheel design and implementation. Other General Electric (GE) patents were used as background material to effectively demonstrate the Advanced Blower.
Three sample blower systems were delivered to two national labs for their review and testing. Contact information for each location is found in Section II, Introduction.
Technical:
The technical achievements of the Integrated Intelligent HVAC Blower project are related to four main areas:
• Demonstration of a high static efficiency blower wheel in various OEM and next generation housings.
• Demonstration of a small diameter permanent magnet motor driven by compact power electronics.
• Demonstration of a modern digital controller with full communication and self-diagnostic capabilities.
• Feasibility study of providing local blower diagnostics and next level HVAC system diagnostics.
The introduction of a new blower product needs to show some form of compatibility with existing blower housing platforms to accelerate the acceptance of the product into the HVAC industry. This document reports the performance benefits of applying the high efficiency rearward inclined (RI) wheel from the Advanced Blower Project into various original equipment manufacturer (OEM) blower housings. The benefit of moving towards a new blower housing paradigm is also outlined.
The following general conclusions are made in this study of OEM blower housings:
• The sample small furnace blower housings in the 10x7 range can greatly benefit from RI wheel technology. An improvement in blower static efficiency of 10% (high static, moderate flow) to 6% (moderate static, high flow) was measured in a Type Y application (10x7).
• Large air handler blower housings in the 10x10 range vary in their benefit from RI wheel technology. An improvement of 3 to 5% was witnessed in a Type W application when the exhaust area was increased by 29% (more improvement could be obtained with slightly more exhaust area). An improvement of 10 to 12% was witnessed in a Type X application when the exhaust area was increased by 42% (near optimal exhaust area for this RI wheel insertion).
Detailed conclusions, including design considerations, are drawn and summarized in IV.H, Performance Conclusions.

DE-FC26-00NT40993 p. 6 of 25 Final Report 6/2003
II. Introduction Every year a considerable amount of energy is spent on the operation of commercial and residential heating, ventilation and air conditioning systems (HVAC). The Department of Energy (DOE) has estimated that HVAC, by far the largest consumer of energy in buildings, accounts for 6.7 Quads of energy consumed per year in the U.S. at a national cost of more than $150B.
One of the best opportunities for reducing the energy consumption of HVAC is to improve the air handling and distribution system. Based on DOE data, more than 14% of the residential HVAC and 25% of the commercial energy consumption can be attributed to air handling equipment – primarily fans and motors which by themselves account for 1.23 quads and the equivalent production of 19.3 million metric tons of carbon emissions. The variable speed Electronically Commutated Motor (ECM) introduced several years ago by GE has been one of the few significant technical advancements in residential and commercial air handling systems. Today’s most efficient two stage residential furnaces are dependent on the variable speed ECM that has a significant efficiency advantage over the single speed induction motor. The ability to vary air flow depending upon HVAC usage cycles can significantly reduce the electrical energy consumption by 75-80% for a 3-5 ton residential 2-stage HVAC application (best case).
The recent legislation calling for an increase in the minimum SEER to 12 from 10, is estimated to “save 3 quads of energy over 25 years (2006 through 2030).”
The number of commercial and residential HVAC products incorporating variable speed blowers is still quite low; approximately ~7%. Several reasons for the lack of penetration have been the cost of a variable speed blower along with the more complex engineering and commissioning procedures associated with the technology. The overall system efficiency of an ECM driven blower has also been compromised by poor fan and shroud designs.
To address these issues GE assembled a team that united several major vendors of HVAC subsystems with one of the US’s leading industrial R&D laboratories. This team, consisting of GE Global Research Center (GRC), GE Industrial Systems, Lau Incorporated, the Trane Company, Carrier Corporation, and Nailor Industries has the expertise and desire to substantially increase the efficiency of air handling systems. This team brought together not only a strong group of researchers and engineers capable of developing more efficient air handling and distribution technology, but also a group of leading HVAC vendors who are in a position to leverage the technology directly into products that will make a difference relative to U.S. energy consumption.
During the second budget period of the DOE-NETL award, the GE team developed and demonstrated a set of blower components which can deliver high static efficiencies, through the application of: 1) advanced impeller wheel design, 2) a high-density integral motor, 3) digitally driven power electronics for increased flexibility, and 4) self-diagnostic and system communication methods.
These component technologies were inserted into several conventional blower housings, as well as inserted into custom, GE-designed housings which optimize efficiency. Future blower housings which can grow in height (taller aspect ratio) can gain even further benefits. Figure 1 below shows the position of the project’s static efficiency achievement relative to time. The insertion of higher efficiency blowers into the market place is best done in stages to avoid loss of tooling costs and product investments ($M’s of USD per product family). Figure 2 shows how this project demonstrated Stage 1 and Stage 2 benefits. Predictions to what can be achieved in Stage 3 with new aspect ratio blower housings is discussed.
Note: This report defines the blower static efficiency as the product of blower pressure rise times airflow, divided by the shaft power output of the motor. The calculation does not account for pressure drops in the HVAC system, nor motor inefficiencies, hence it may appear to feature high values to some system level readers who normally account for filter drops, duct work drops and other losses. Alternatively, blower system static efficiency includes motor electrical losses.
Note: In this report, references to specific manufacturers are avoided to minimize inappropriate direct comparison of various model performances. Of the four sets of blower housings, wheels, and applications studied, each is referred to consistently throughout as either Type W, X, Y, or Z.

DE-FC26-00NT40993 p. 7 of 25 Final Report 6/2003
Figure 1 Air moving system efficiency progress vs. technology and SEER regulations.
Figure 2 Progressive approach to inserting higher efficiency blowers into the market place without loss of tooling investment nor product life cycle investments.
DE-FC26-00NT40993 p. 8 of 25 Final Report 6/2003
a) b) c)
Figure 3 General Electric’s advanced RI blower system: a) GE-III demonstration housing with GE-2a RI wheel and high density motor, b) electronic control module with digital controls, c) compact 4.25” OD motor, achieving a peak overall blower static system efficiency of 56% and an average performance of 52%.
The GE-developed RI blowers developed and studied in this research were sent to Lawrence Berkley National Laboratory and Brookhaven National Laboratory. Additionally, various prototype housings, blowers, motors, rotors, and other components were fabricated for purposes of evaluation and testing during this project. Equipment delivered to each addressee contained the following:
• RI Wheel; the project’s design “GE-2a,” bent-tab metal, fabricated at Lau Industries.
• ECM Motor; Version 4.0 prototype, including electronic control unit, communications devices, software, and supporting control code on CD-ROM.
• Blower Housing; either a Type Y, Z, or “GE-III” housing as detailed below.
Delivery of three sample units were issued to the following:
Lawrence Berkley National Laboratory, HVAC Equipment Operation and Testing Laboratory.
Received Type Z equipment plus RI wheel and ECM motor equipment, for the purposes of base lining a standard PSC motor with an FI wheel against (1) an ECM motor with an FI wheel and (2) an ECM motor with an RI wheel. Contact: Mr. Peter J. Biermayer, [email protected], (510) 486-5983. Equipment forwarded to Texas A&M (sub-contractor).
Lawrence Berkley National Laboratory, Furnace Energy Consumption Testing.
Received Type Y equipment (as shown in Figure 15) plus RI wheel and ECM motor equipment. Contact: Mr. Ian Walker, Duct Lab, 2700 7th St., Berkeley, CA 94710. [email protected] (510) 486-4692. http://ducts.lbl.gov/
Brookhaven National Laboratory, HVAC Equipment and Ductwork Laboratory.
Received the GE-III housing, plus RI wheel and ECM motor equipment. Contact: Mr. John Andrews, Bldg. 526, 12 North 6th St., Upton, NY 11973. [email protected]
DE-FC26-00NT40993 p. 9 of 25 Final Report 6/2003
III. Accomplishments
A. Intelligence
The ECM 4.0 demonstrator featured full digital controls and communications with outside equipment. This allowed for the integration of self-diagnostic, system diagnostic, and communication of critical operational parameters to a central HVAC controller and/or building systems.
The previously developed ECM 2.5 digital communication protocol was enhanced for the Advanced Blower demonstrator. The new protocol, when coupled with the Advanced Blower, can more readily share information with the next level HVAC controller, such as; energy usage information, torque and speed operating conditions, and internal over temperature alarms. Other custom features can be considered and integrated with minimal re-engineering.
An automatic calibration feature was also introduced on the Advanced Blower project. Normally, to produce the torque precision needed for air flow control, the electronic controller and motor are closely matched at the factory. This process was simplified with an automatic motor flux linkage test sequence which automatically calibrates any controller to the motor upon startup. If the motor ages, or becomes somewhat demagnetized, the controller automatically compensates.
B. Integration
The ECM 4.0 blower system is the combination of several components; a compact, 4.25 inch (10.8 cm) outer diameter permanent magnet motor, a compact electronic controller (also 4.25 in OD), a set of intake cones, and an impeller wheel. The tolerances, and fitment was designed together to produce an overall more optimal system which is not normally achieved with separate component sourcing.
C. Efficiency
The overall electrical input to air flow output performance of the Advanced Blower achieved unprecedented levels of efficiency for applications in the 800-1500 CFM range. The application of the GE-2a double inlet, rearward inclined blower wheel to various OEM housings is outlined in the following section in detail.
IV. Blower Performance Evaluation This section of the report addresses the blower static efficiency gains of various housings with respect to the original system and the new RI wheel. The first stage of technology insertion as outlined in Figure 2 is the integration of an high efficiency rearward inclined blower wheel into commonly available forward inclined (FI) blower housings. Two sample FI systems are studied in detail and a custom RI blower housing, which is dimensionally compatible with the target 3-ton air-handler system is also studied to show the next stage in the technology insertion plan as outlined in Figure 2.
A. Blower Performance Metrics
The Department of Energy has specified that the findings of this report be clear and use simple performance metrics. The use of Watts per CFM was proposed, but it is not used in this report. Instead, more readily comparable measures of both peak static efficiency and average static efficiency are used to describe and compare various blower systems.
Figure 4 compares the two performance metrics for a typical RI blower and a plot of static efficiency for two RI blower variations. The findings support the use of peak static efficiency as a good comparative metric for blower systems used in common air handling applications, as the CFM/Watt metric is a function of flow rate and pressure drop.
DE-FC26-00NT40993 p. 10 of 25 Final Report 6/2003
Pressure vs. Flow plane(performances for an RI blower)
0
0.2
0.4
0.6
0.8
1
1.2
1.4
1.6
0 200 400 600 800 1000 1200
Flow (cu.feet/min)
Pres
sure
(in
H20)
high restrictionlow restrictionvery low restriction
3.5 CFM/Watt58% static eff.
4.7 CFM/Watt56% static eff.
9.5 CFM/Watt52% static eff.
9.7 CFM/Watt58% static eff.
13.1 CFM/Watt56% static eff.
Blower Static Efficiency vs. Flow Rate(constant speed test)
0.2
0.3
0.4
0.5
0.6
0.7
0.8
600 700 800 900 1000 1100 1200 1300 1400
Flow (CFM)
Stat
ic E
ff (%
)
RI Blow er #1
RI Blow er #2
typical operation range
high restriction
low restriction
Figure 4 Performance metrics vs. blower operation over pressure – flow plane, and efficiency flow plane;
showing the merits of static efficiency over CFM/Watt.
A note on comparative testing:
Several of the comparative results in this study are done with constant CFM and variable pressure rise (Figure 9, Figure 10, Figure 12). These types of tests were motivated by input from industry leaders due to the need for efficiency information at max flow for various static pressures (ECM applications operating under constant air flow control). An airflow rate of 1280 CFM was selected for testing the various 10x10 housings, and various blower pressure rises from 0.6” to 1.1” inwg (inches of water, gauge) were used to collect the blower’s static efficiency for comparative purposes.
B. HVAC Application Focus
Several FI blowers were obtained from various manufacturers. These particular housings were selected for conversion to the RI blower wheel by both the Dept. of Energy and GE-Motors objectives. Some were targeted for furnace applications to help establish realistic regulations for electrical consumption, while other housings were for air handler applications which are interested in higher SEER rating objectives. These units are similar to those found in air moving applications for larger commercial buildings and the core technologies are easily transferable.
Table 1 Listing of FI housing sizes used in the study of relative RI wheel performances.
Type Size (in.) W 10x10 X 10x10 Y* 10x7 Z* 10x7
GE-III 10x10
*Note: these two specific housings were requested by Lawrence Berkley Labs for their lab’s HVAC testing.
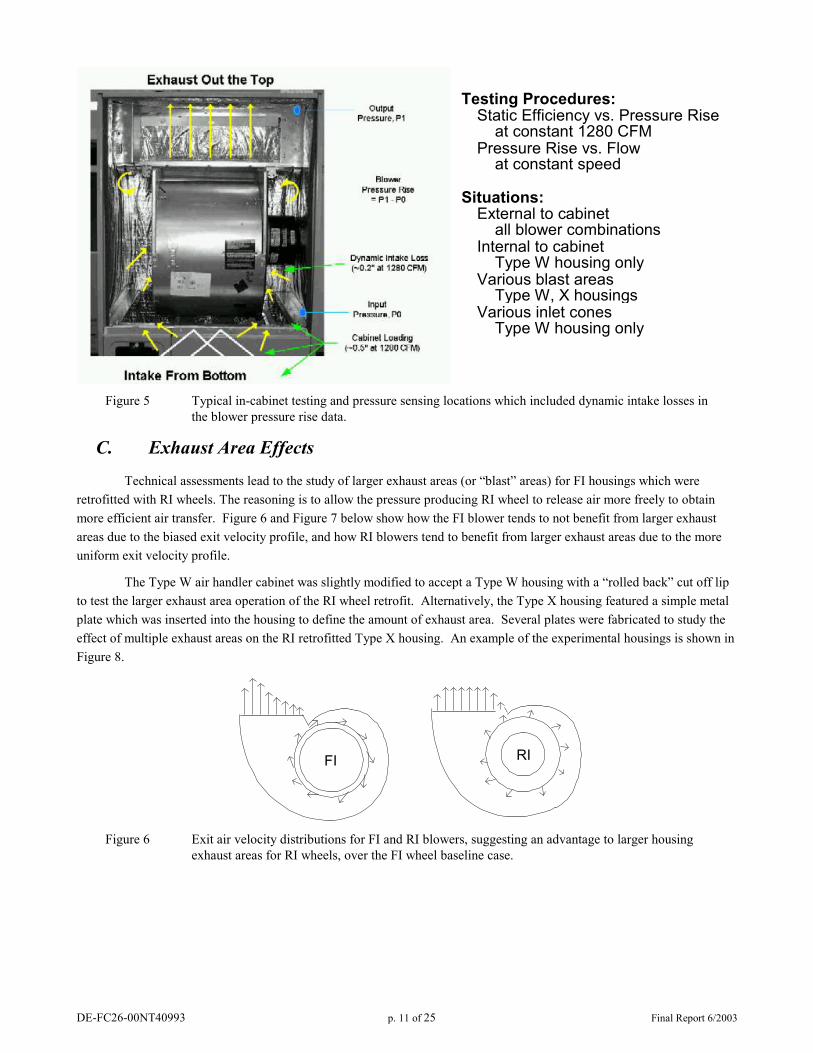
The testing of the ECM 4.0 motor and RI blower wheel and baseline FI blowers all followed a set of conventions which are outlined below in Figure 5 for in-cabinet testing of static efficiency.
DE-FC26-00NT40993 p. 11 of 25 Final Report 6/2003
Testing Procedures: Static Efficiency vs. Pressure Rise
at constant 1280 CFM Pressure Rise vs. Flow
at constant speed
Situations:External to cabinet
all blower combinationsInternal to cabinet
Type W housing only Various blast areas
Type W, X housings Various inlet cones
Type W housing only
Figure 5 Typical in-cabinet testing and pressure sensing locations which included dynamic intake losses in
the blower pressure rise data.
C. Exhaust Area Effects
Technical assessments lead to the study of larger exhaust areas (or “blast” areas) for FI housings which were retrofitted with RI wheels. The reasoning is to allow the pressure producing RI wheel to release air more freely to obtain more efficient air transfer. Figure 6 and Figure 7 below show how the FI blower tends to not benefit from larger exhaust areas due to the biased exit velocity profile, and how RI blowers tend to benefit from larger exhaust areas due to the more uniform exit velocity profile.
The Type W air handler cabinet was slightly modified to accept a Type W housing with a “rolled back” cut off lip to test the larger exhaust area operation of the RI wheel retrofit. Alternatively, the Type X housing featured a simple metal plate which was inserted into the housing to define the amount of exhaust area. Several plates were fabricated to study the effect of multiple exhaust areas on the RI retrofitted Type X housing. An example of the experimental housings is shown in Figure 8.
FI RI
Figure 6 Exit air velocity distributions for FI and RI blowers, suggesting an advantage to larger housing
exhaust areas for RI wheels, over the FI wheel baseline case.
DE-FC26-00NT40993 p. 12 of 25 Final Report 6/2003
Efficiency vs. Blast Area Increases
0.35
0.4
0.45
0.5
0.55
0.6
0.80 1.00 1.20 1.40 1.60 1.80 2.00 2.20
Blower Housing Blast Area (normalized)
Blo
wer
Sta
tic E
ffici
ency
Type X, RI Type X, FI Type W, RI Type W, FI Poly. (Type X, RI) Linear (Type W, RI) Linear (Type W, FI) Linear (Type X, FI)
Case X, out of cabinet 10x10Blast Area = 109 sq.in. Case W, in cabinet testing 10x10Blast Area = 90 sq.in.
All data at 1280 CFM & deltaP = 0.8" H2O trend holds for wide pressure rise range (0.3 - 1.0 inwg)
RI wheels
FI wheels
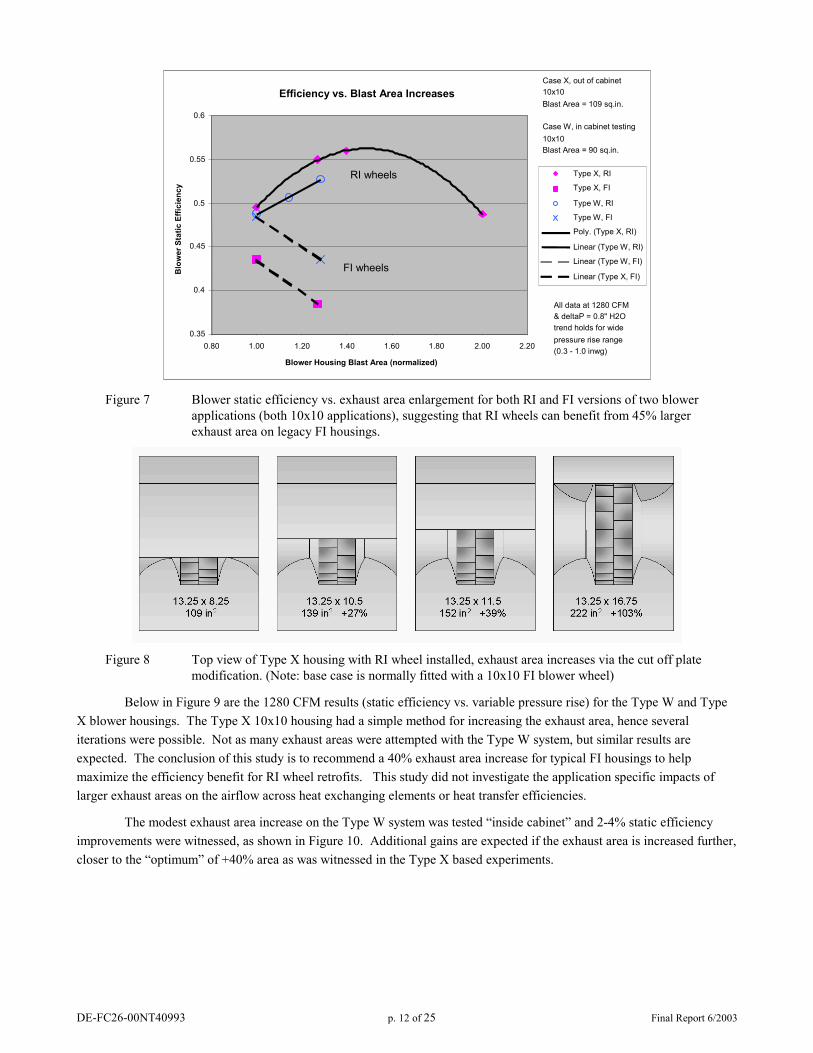
Figure 7 Blower static efficiency vs. exhaust area enlargement for both RI and FI versions of two blower
applications (both 10x10 applications), suggesting that RI wheels can benefit from 45% larger exhaust area on legacy FI housings.
Figure 8 Top view of Type X housing with RI wheel installed, exhaust area increases via the cut off plate
modification. (Note: base case is normally fitted with a 10x10 FI blower wheel)
Below in Figure 9 are the 1280 CFM results (static efficiency vs. variable pressure rise) for the Type W and Type X blower housings. The Type X 10x10 housing had a simple method for increasing the exhaust area, hence several iterations were possible. Not as many exhaust areas were attempted with the Type W system, but similar results are expected. The conclusion of this study is to recommend a 40% exhaust area increase for typical FI housings to help maximize the efficiency benefit for RI wheel retrofits. This study did not investigate the application specific impacts of larger exhaust areas on the airflow across heat exchanging elements or heat transfer efficiencies.
The modest exhaust area increase on the Type W system was tested “inside cabinet” and 2-4% static efficiency improvements were witnessed, as shown in Figure 10. Additional gains are expected if the exhaust area is increased further, closer to the “optimum” of +40% area as was witnessed in the Type X based experiments.

DE-FC26-00NT40993 p. 13 of 25 Final Report 6/2003
Blast Area Improvement for GE-2a in Type X Housing
40%
42%
44%
46%
48%
50%
52%
54%
56%
58%
60%
0.5 0.6 0.7 0.8 0.9 1.0 1.1
Blower Pressure Rise (inwg)
Blo
wer
Sta
tic E
ffici
ency
RI +8.5" opening
RI +3.25" opening
RI +2.25" opening
FI baseline
Type X1280 CFM
Blast Area Effect on FI
40%
42%
44%
46%
48%
50%
52%
54%
56%
58%
60%
0.5 0.6 0.7 0.8 0.9 1.0 1.1
Blower Pressure Rise (inwg)
Blo
wer
Sta
tic E
ffici
ency
FI baselineFI with +29% area
Type W1280 CFM
Figure 9 Blower static efficiency vs. pressure rise for various exhaust areas; a) Type X with RI and FI
wheels, b) Type W with FI case (nominal and +29% exhaust area).*
*Both tests in Figure 9 were done “out of cabinet,” thus lower FI blower performance is expected once inserted into a constraining cabinet due to wall effects close to the housing/FI wheel interface. This loss in performance was not seen in RI systems with long intake cones and is discussed further, below in section E. Cabinet Effects.
Blower Eff vs. delta Pressure
40% 42% 44% 46% 48% 50% 52% 54% 56% 58% 60%
0.5 0.6 0.7 0.8 0.9 1.0 1.1 Pressure Rise (inwg)
Blo
wer
Eff
(%)
GE-2a Mod 2
GE-2a Mod 1
GE-2a baseline Type W FI Baseline
Type W housing demo cones 1280 CFM Inside Cab
Inside Cabinet Performance
Figure 10 Blower static efficiency vs. pressure rise for both RI and FI wheels in a Type W housing [1280
CFM] (note: Mod 1 = +16% exhaust area, Mod 2 = +32% exhaust area, optimal improvement projected at +45% exhaust area).
D. Inlet Cone Effects
The inlet cone is a vital component in the advanced blower system. The cone serves as an intake airflow router and also can help direct the air outward, or radially towards the leading edge of the blade tips. The first generation inlet cone developed at GE Research did not feature a significant reverse radius at the inboard side to promote radial air deflection. The impact of the reverse radius lip on static efficiency was positive, but it may also impact the practical production costs of such a component.

DE-FC26-00NT40993 p. 14 of 25 Final Report 6/2003
Two cones were made from heritage Lau Industries designs; #1, a cone with an aggressive reverse radius and smaller minimum inlet area, and #2, a cone with a softer reverse radius and larger minimum inlet area. The inlet area of GE’s original demonstration inlet cones was the largest as can be seen in Figure 11 b) by the distance between the motor shell and the inlet cone. A smaller inlet area usually promotes higher intake losses, especially due to the presence of the motor shell on one side of the dual inlet blower. The below results show that the #2 cones performed the best, but the true optimum may still lie between the original cone design and the #2 design.
These inlet cones were custom made for the various custom RI and legacy FI housings, even though many were of similar dimensional width (~16”). The use of the reverse radius lip also suggests that a custom inlet cone is needed for each retrofit application, thus increasing part numbers and production costs.
a)
b)
blades
Demo cones (GE)Lau #1 conesLau #2 cones
motor c)
Inlet cone comparison (GE-2a wheel)
40%
42%
44%
46%
48%
50%
52%
54%
56%
58%
60%
0.5 0.6 0.7 0.8 0.9 1.0 1.1Blower Pressure Rise (inwg)
Blo
wer
Sta
tic E
ffici
ency
Demo inlet conesLau #1 conesLau #2 conesPoly. (Lau #2 cones)
Type W 1280 CFM
Figure 11 Inlet cones for the RI blower; a) ProE rendering of the Lau #1 cone, b) 2-D conceptual differences between experimental cones, c) static efficiency results based on “in housing” tests.
E. Cabinet Effects
The airflow inside a cabinet is significantly different than that outside the cabinet. The complex airflow in the region of the intake lip impacts most FI blower systems. The RI system is less sensitive to the inside cabinet air flow due to the long intake cones which reduce any cabinet induced air turbulence before the air reaches the blade tips. Figure 10 and Figure 12 show how the RI and FI systems performed inside and outside the cabinet on a Type W air handler application.
airflow min. inlet area

DE-FC26-00NT40993 p. 15 of 25 Final Report 6/2003
Inside vs. Outside Cabinet Testing
40% 42% 44% 46% 48% 50% 52% 54% 56% 58% 60%
0.5 0.6 0.7 0.8 0.9 1.0 1.1 Blower Pressure Rise (inwg)
Blo
wer
Sta
tic E
ffici
ency
FI outside cabinet RI outside cabinet RI inside cabinet FI inside cabinet
Type W 1280 CFM
FI
RI
Figure 12 Blower static efficiency vs. pressure rise for both RI and FI implementations in a Type W
housing, both inside and outside of cabinet (1280 CFM).
The FI system lost several efficiency points (~7%) when tested inside the cabinet. The RI retrofitted system only lost about 1% static efficiency. This also emphasizes the importance of end-application testing to insure reliable results.
F. RI Blade Angle
The primary design of the GE RI blower wheel was done with computer simulations in 2 and 3 dimensions. A critical design parameter was the “pitch” of the specially inflected RI blade relative to the radial reference. Two special RI wheels with +2.5° and -2.5° blade pitch angle were built to compare with the original design. The blower curve data is shown below in Figure 13. The original design produced the best performance of 70% peak static efficiency, and out-performed the other blade pitch angles by 2% in the typical operating range, thus confirming our original design optimization.

DE-FC26-00NT40993 p. 16 of 25 Final Report 6/2003
Fan Performance -- Standard Air / Corrected RPM
0.00
0.30
0.60
0.90
1.20
1.50
1.80
2.10
2.40
400 600 800 1000 1200 1400 1600 1800 2000Flow (CFM)
Stat
ic P
ress
ure
Rise
(in.
wg)
0.00
0.10
0.20
0.30
0.40
0.50
0.60
0.70
0.80
Com
pens
ated
Sta
tic E
ffic
ienc
y (%
)
Ps nom. pitchPs 2.5deg pitchPs -2.5deg pitchEffst nom pitchEffst 2.5deg pitchEffst -2.5deg pitch
GE-2a metal wheelGE-3 demo housing1500 RPMLau Industries
Figure 13 Metal GE-2a wheel performance, with 3 blade pitch angles, in a GE-III housing, 1500 RPM,
tested at Lau Industries, Dayton, OH, Feb. 2003.
G. Blower Curve Testing
For the industry standard testing of the blowers, constant RPM pressure-flow testing was applied. The following are the baseline and various curves for FI retrofitted blowers and custom RI housing data.
1. GE demonstration housings
The GE demonstration housing is a custom fabricated enclosure which was designed to fit into the typical 10x10 FI blower system slots. The scroll expansion of the housing was of a logarithmic nature and the cut-off region was tuned via CFD simulations to be near ideal. This housing was described in the BP1 report of December 2001.
The data was collected at Lau Industries in Dayton, OH, an AMCA qualified site.
DE-FC26-00NT40993 p. 17 of 25 Final Report 6/2003
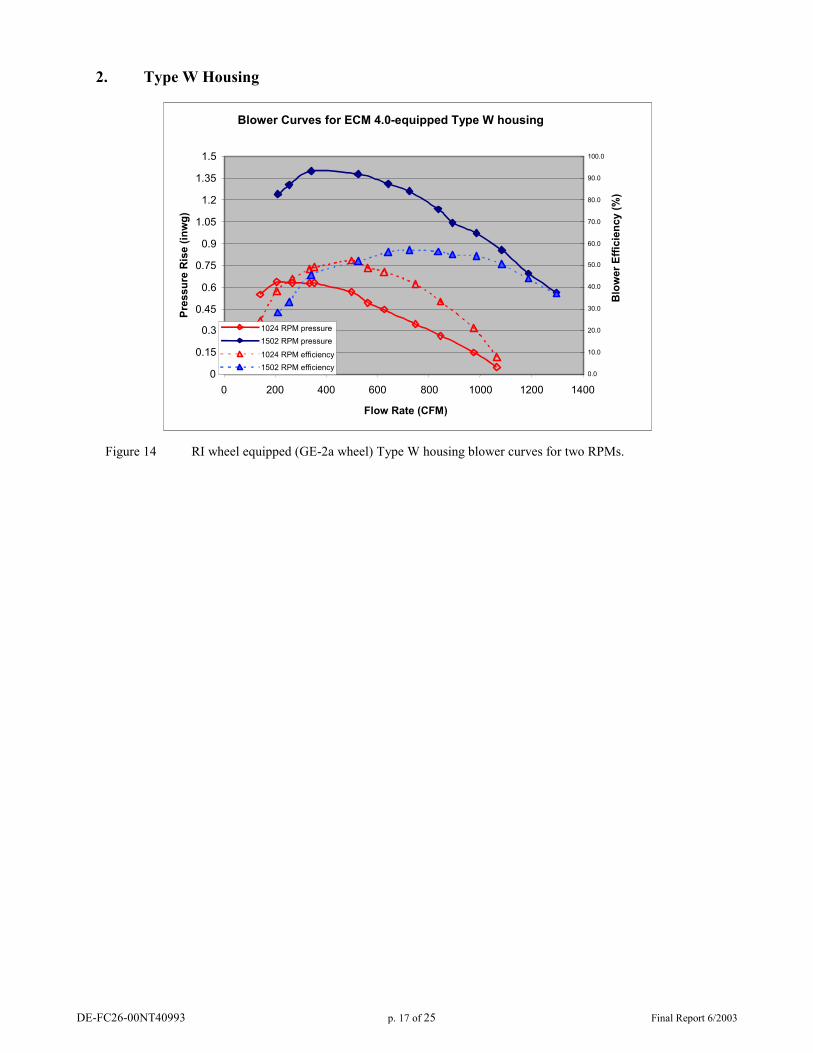
2. Type W Housing
Blower Curves for ECM 4.0-equipped Type W housing
0 0.15
0.3 0.45
0.6 0.75
0.9 1.05
1.2 1.35
1.5
0 200 400 600 800 1000 1200 1400 Flow Rate (CFM)
Pres
sure
Ris
e (in
wg)
0.0 10.0 20.0 30.0 40.0 50.0 60.0 70.0 80.0 90.0 100.0
Blo
wer
Effi
cien
cy (%
)
1024 RPM pressure1502 RPM pressure1024 RPM efficiency1502 RPM efficiency
Figure 14 RI wheel equipped (GE-2a wheel) Type W housing blower curves for two RPMs.

DE-FC26-00NT40993 p. 18 of 25 Final Report 6/2003
3. Type Y Housing
A Type Y furnace blower in the 10x7 size was baseline tested then retrofitted with an RI wheel. The unit was then delivered to Lawrence Berkley Lab. The baseline FI blower curve and static efficiency at 1050 RPM is shown in Figure 16. The RI retrofit data was retested at 1300 RPM to closely simulate the same pressure/flow point in the mid range capability of the wheel, and again at 1500 RPM to simulate the low restriction operation. In general the small furnace housing did not allow for high static efficiencies of the RI wheel at high flows, but the retrofit system was still 10 – 13% more efficient in the mid range than the original FI blower. The exhaust area of this blower was not modified, but seemed sufficiently large relative to the previous studies.
Figure 15 Type Y RI wheel retrofit with motor mount extensions and no exhaust area modifications.

DE-FC26-00NT40993 p. 19 of 25 Final Report 6/2003
a)
Type Y Blower Curves
0 0.1 0.2 0.3 0.4 0.5 0.6 0.7 0.8 0.9
1 1.1
0 100 200 300 400 500 600 700 800 900 1000 1100 1200 1300 1400 1500 1600
Blower Air Flow (CFM)
Blo
wer
Pre
ssur
e R
ise
(inw
g)
baseline FI wheel driven by ECM 2.3 at constant 1050 RPM
improved RI wheel driven by ECM 4.0 at constant RPM
1050 RPM, FI wheel
1500 RPM, RI wheel
1300 RPM, RI wheel
stall region point #1
point #2
point #1; 0.81" @ 520 CFM point #2; 0.66" @ 1010 CFM
b)
Type Y Efficiency Curves
0.0% 5.0%
10.0% 15.0% 20.0% 25.0% 30.0% 35.0% 40.0% 45.0% 50.0% 55.0% 60.0%
0 100 200 300 400 500 600 700 800 900 1000 1100 1200 1300 1400 1500 1600
Blower Air Flow (CFM)
Blo
wer
Sta
tic E
ffici
ency
(%)
baseline FI wheel driven by ECM 2.3 at constant 1050 RPM
improved RI wheel driven by ECM 4.0 at constant RPM
1050 RPM, FI wheel
1500 RPM, RI wheel1300 RPM, RI wheel
stall region
point #1+10%
point #1; 0.81" @ 520 CFM point #2; 0.66" @ 1010 CFM
point #2+6%
Figure 16 Type Y performance curves for both RI and FI wheels; a) blower pressure rise vs. flow and b) efficiency vs. flow, showing a 6-10% static efficiency gain over a typical operating region.
DE-FC26-00NT40993 p. 20 of 25 Final Report 6/2003
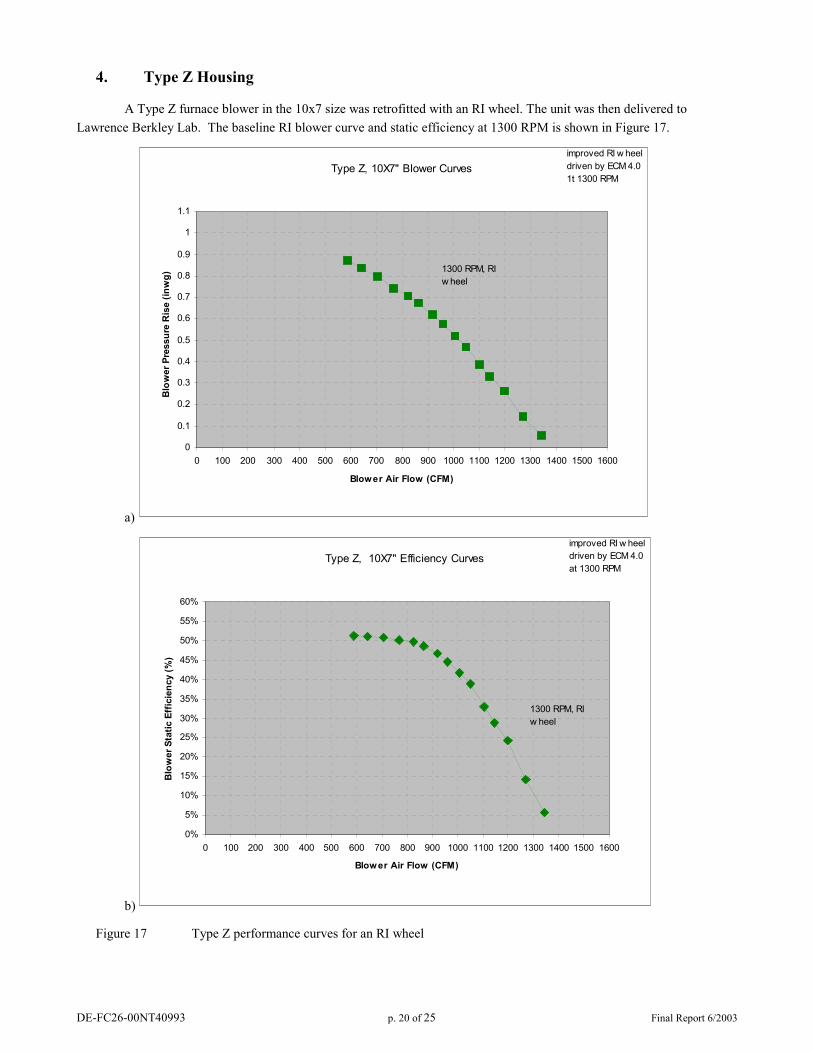
4. Type Z Housing
A Type Z furnace blower in the 10x7 size was retrofitted with an RI wheel. The unit was then delivered to Lawrence Berkley Lab. The baseline RI blower curve and static efficiency at 1300 RPM is shown in Figure 17.
a)
Type Z, 10X7" Blower Curves
0
0.1
0.2
0.3
0.4
0.5
0.6
0.7
0.8
0.9
1
1.1
0 100 200 300 400 500 600 700 800 900 1000 1100 1200 1300 1400 1500 1600
Blower Air Flow (CFM)
Blo
wer
Pre
ssur
e R
ise
(inw
g)improved RI w heel driven by ECM 4.0 1t 1300 RPM
1300 RPM, RI w heel
b)
Type Z, 10X7" Efficiency Curves
0%
5%
10%
15%
20%
25%
30%
35%
40%
45%
50%
55%
60%
0 100 200 300 400 500 600 700 800 900 1000 1100 1200 1300 1400 1500 1600
Blower Air Flow (CFM)
Blo
wer
Sta
tic E
ffic
ienc
y (%
)
improved RI w heel driven by ECM 4.0 at 1300 RPM
1300 RPM, RI w heel
Figure 17 Type Z performance curves for an RI wheel
DE-FC26-00NT40993 p. 21 of 25 Final Report 6/2003
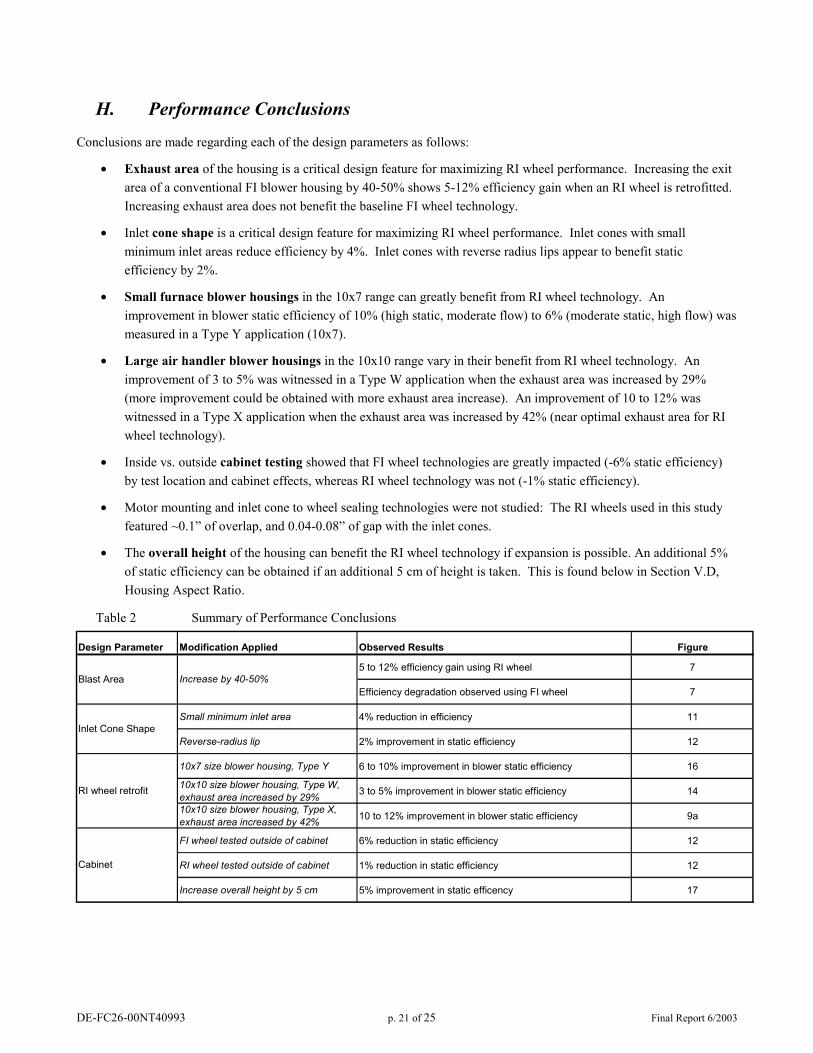
H. Performance Conclusions
Conclusions are made regarding each of the design parameters as follows:
• Exhaust area of the housing is a critical design feature for maximizing RI wheel performance. Increasing the exit area of a conventional FI blower housing by 40-50% shows 5-12% efficiency gain when an RI wheel is retrofitted. Increasing exhaust area does not benefit the baseline FI wheel technology.
• Inlet cone shape is a critical design feature for maximizing RI wheel performance. Inlet cones with small minimum inlet areas reduce efficiency by 4%. Inlet cones with reverse radius lips appear to benefit static efficiency by 2%.
• Small furnace blower housings in the 10x7 range can greatly benefit from RI wheel technology. An improvement in blower static efficiency of 10% (high static, moderate flow) to 6% (moderate static, high flow) was measured in a Type Y application (10x7).
• Large air handler blower housings in the 10x10 range vary in their benefit from RI wheel technology. An improvement of 3 to 5% was witnessed in a Type W application when the exhaust area was increased by 29% (more improvement could be obtained with more exhaust area increase). An improvement of 10 to 12% was witnessed in a Type X application when the exhaust area was increased by 42% (near optimal exhaust area for RI wheel technology).
• Inside vs. outside cabinet testing showed that FI wheel technologies are greatly impacted (-6% static efficiency) by test location and cabinet effects, whereas RI wheel technology was not (-1% static efficiency).
• Motor mounting and inlet cone to wheel sealing technologies were not studied: The RI wheels used in this study featured ~0.1” of overlap, and 0.04-0.08” of gap with the inlet cones.
• The overall height of the housing can benefit the RI wheel technology if expansion is possible. An additional 5% of static efficiency can be obtained if an additional 5 cm of height is taken. This is found below in Section V.D, Housing Aspect Ratio.
Table 2 Summary of Performance Conclusions
Design Parameter Modification Applied Observed Results Figure
5 to 12% efficiency gain using RI wheel 7
Efficiency degradation observed using FI wheel 7
Small minimum inlet area 4% reduction in efficiency 11
Reverse-radius lip 2% improvement in static efficiency 12
10x7 size blower housing, Type Y 6 to 10% improvement in blower static efficiency 16
10x10 size blower housing, Type W, exhaust area increased by 29% 3 to 5% improvement in blower static efficiency 14
10x10 size blower housing, Type X, exhaust area increased by 42% 10 to 12% improvement in blower static efficiency 9a
FI wheel tested outside of cabinet 6% reduction in static efficiency 12
RI wheel tested outside of cabinet 1% reduction in static efficiency 12
Increase overall height by 5 cm 5% improvement in static efficency 17
Increase by 40-50%Blast Area
Cabinet
RI wheel retrofit
Inlet Cone Shape
DE-FC26-00NT40993 p. 22 of 25 Final Report 6/2003
V. Additional Performance Enhancements and Issues
A. Mechanical Tolerancing
The mechanical assembly of the Advanced Blower prototypes were done by hand with non-optimal motor mounts. Two housing mounts were used, one at the motor base, and an other at the opposite end of the shaft. This dual mount method is impractical by today’s fast manufacturing needs. The ability to manufacture a high speed (~1800 RPM max) blower wheel with close tolerances with the inlet cones continues to be a concern. The leakage of high pressure air from the exhaust portion of the housing back into the low pressure input region becomes significant if typical 0.25” gaps are implemented.
B. HVAC System Controls
The authority for the Advanced Blower to make local control decisions or initiate safety modes, or alarms is not well defined by today’s systems. A study of fire safety regulations, building system codes, and energy efficiency initiatives would be helpful in defining a set of blower features which would benefit the building of tomorrow. The Advanced Blower project provided the communication and parameter availability to make a secure and efficient HVAC system easier to achieve, but more work between system controllers and the equipment providers would prove to be fruitful.
C. Trailing Blade Edge Angle
The trailing or exit edge of the rearward inclined blade was inclined slightly to contribute to airflow controllability, but this feature does detract from the static efficiency characteristic. In applications requiring less, or rough air flow control, a less aggressive blade shape can be used to gain up to 3% more static blower efficiency (>70% peak static). See Topical Report in reference 1.
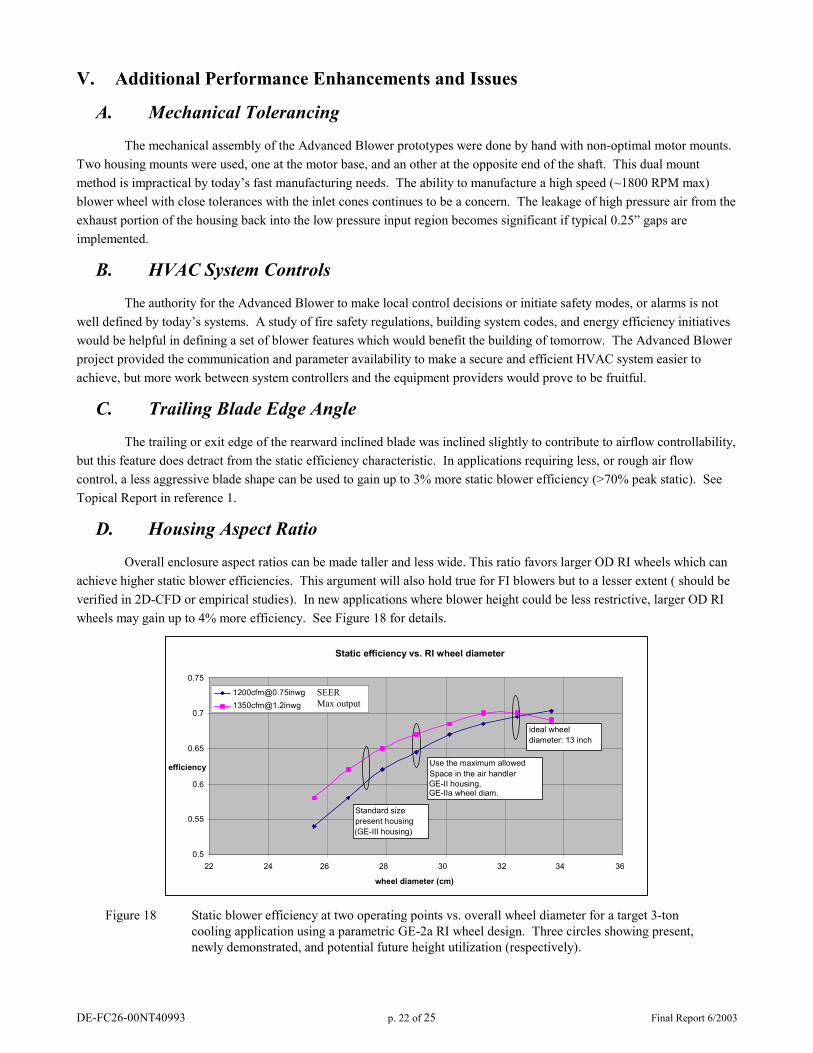
D. Housing Aspect Ratio
Overall enclosure aspect ratios can be made taller and less wide. This ratio favors larger OD RI wheels which can achieve higher static blower efficiencies. This argument will also hold true for FI blowers but to a lesser extent ( should be verified in 2D-CFD or empirical studies). In new applications where blower height could be less restrictive, larger OD RI wheels may gain up to 4% more efficiency. See Figure 18 for details.
Static efficiency vs. RI wheel diameter
0.5
0.55
0.6
0.65
0.7
0.75
22 24 26 28 30 32 34 36 wheel diameter (cm)
efficiency
[email protected]@1.2inwg
Standard size present housing
ideal wheel diameter: 13 inch
Use the maximum allowed Space in the air handler
SEER Max output
(GE-III housing)
GE-II housing, GE-IIa wheel diam.
Figure 18 Static blower efficiency at two operating points vs. overall wheel diameter for a target 3-ton
cooling application using a parametric GE-2a RI wheel design. Three circles showing present, newly demonstrated, and potential future height utilization (respectively).

DE-FC26-00NT40993 p. 23 of 25 Final Report 6/2003
E. Asymmetrical wheels or inlet cones
The double inlet Advanced Blower (GE-2a wheel) is a symmetrical device, but with a motor restriction in one intake cone. The resulting airflow is non-uniform between the two blower halves and a means of compensating the mechanical structure to optimize the overall blower efficiency can be undertaken and are part of ongoing improvements to the GE design. Two approaches are suggested (or a combination of the two);
• the biasing of the blower wheel’s center disk to favor the non-motor restricted side with a larger portion of the blade width and blower wheel volume (use of symmetric inlet cones.)
• the biasing of a symmetric wheel towards the motor restricted side to favor the non-restricted side with a larger portion of the housing volume (use of asymmetrical inlet cones.) This option will probably not net as significant a gain as the previous.
Blower Pressure Rise Vs Flow rate
0.000
0.200
0.400
0.600
0.800
1.000
1.200
0 500 1000 1500 2000 2500
Flow Rate (CFM)
Blow
er P
ress
ure
Rise
(inw
g)
Lab Data GE-2a
Lab Data (+15%)
Lab Data (-15%)
CFD (Full Geo)
CFD (Half Geo - nonmotorside)CFD (Half Geo - motorside)
Figure 19 CFD blower curve analysis showing asymmetry between motor and non-motor sides.
The 3D CFD study of Figure 19 observed different air flows at the 0.8” pressure rise condition for a double restricted, asymmetric restricted, and non-restricted housing (891, 1110, 1257 CFM respectively). This represents a 20% flow reduction in the double restricted case, or a 13% flow increase in the non-restricted case. This suggests a shift of approximately 15% towards the unrestricted side to obtain optimal results.
VI. Additional Features of the Advanced Blower
A. Blower Noise
The noise level of the GE-2a blower wheel is determined by the fluctuation of the air pressure, especially on the surface of the impeller and at both the leading and lagging edges. This is due to the more efficient radiation source of a solid impeller than the airflow pattern (dipole source vs. quadruple source). It is true that the relative velocity in the impeller airflow passage of an RI blower is significantly higher than in a FI blower and higher velocity airflows tend to generate higher-pressure fluctuations. Alternately the flow pattern in the RI impeller is much better than in a FI blower. The industry has commonly believed that FI blowers are quieter than RI blowers, but a back-to-back evaluation of the air handler and furnace FI blower wheels and the GE-I prototyped RI wheel revealed the opposite. Table 3 shows the measured sound pressure levels for the three blowers at the SEER rating point.

DE-FC26-00NT40993 p. 24 of 25 Final Report 6/2003
Table 3 Sound pressure level at 1 meter and 0.567 m3/sec (1200 CFM) Noise comparison GE-I, single inlet Residential
Furnace Industrial VAV
Pressure rise ~170 Pa 176 Pa 176 Pa SPL 60 dBA 62 dBA 63 dBA
The SPL only measures the RMS value of the full noise spectra. The full spectrum of noise was documented and the RI blower did not possess any significant tonal noises which would cause problems. The clearances in the housing can be adjusted to avoid the excitation of blade tip frequency noises and GE is confident that the RI blower will not be a “noisy” system relative to the present FI blowers.
B. Uniformity of Airflow
Two sets of data were taken addressing the airflow uniformity of the GE-I and GE-2a wheels in logarithmic expansion housings (GE-II style or GE-III housings). The first set was experimental results using an anemometer on the single inlet GE-I. The second set was from 3D CFD simulations of the double inlet GE-2a wheel in a GE-III demonstration housing. The two data sets of exit velocity profiles do not fully agree in trend, nor absolute values, but instead suggest that there is a fairly uniform exit characteristic from the housing as compared with the trend in FI blower systems.
1 2 3 4 5 6 7 8 9 101
1.5
2
2.5
3
3.5
4
4.5
5 7
8
8
8
8
8.5
8.5
8.5 8.5
9
9
9 9
9
9.5
9.5
GE1 has been made in half unit and the exit airflow pattern is measured. wheel position
Distance from the origin in inch
origin position
1 2 3 4 5 6 7 8 9 101
1.5
2
2.5
3
3.5
4
4.5
5 7
8
8
8
8
8.5
8.5
8.58.5
9
9
9 9
9
9.5
9.5
Experimental exit air velocity for a single inlet GE-2 wheel application.
intake
wheel position
Figure 20 Anemometer recordings of the exit air flow velocity for the ½ wide GE-I demonstration system
vs. inches from the lower left origin position.
Figure 21 3D CFD computations (simulated) of the exit air velocity (z-axis component) at the exit port of
the GE-II demonstration system, showing the asymmetry due to the motor restriction in one intake cone (left side.)

DE-FC26-00NT40993 p. 25 of 25 Final Report 6/2003
VII. Conversion Factors
Every attempt was made to use SI units in this report and research work, but the HVAC industry is still using various units. A few graphs do contain US conventional units (industry practice) which can be converted with the assistance of the below formulae.
Volumetric Flow: 1 [CFM] = 0.0004719 [m3/sec] or 1200 [CFM] = 0.566 [m3/sec]
Pressure: 1 [inH20] = 248.4 [Pa] or 0.25 [inH20] = 62.5 [Pa]
1 [psi] = 6890 [Pa] or 0.01 [psi] = 68.9 [Pa]
Rotational Speed: 1 [RPM] = 0.1047 [rad/sec] or 1150 [RPM] = 120 [rad/sec]
Torque: 1 [Oz-ft] = 0.0847 [N-m] or 15 [Oz-ft] = 1.271 [N-m]
Electrical Power 1 [hp] = 746 [Watts]
Cooling Power 1 [ton] = 12000 [BTU-hour] = 3520 [Watts]
Air Flow Power Powerair [Watts] = Pressure ⋅ Flow = [Pa] ⋅ [m3/sec] = [inH20] ⋅ [CFM] ⋅ 0.1175
Mechanical Power Powershaft [Watts] = Torque ⋅ Speed = [N-m] ⋅ [rad/sec] = [Oz.-ft] ⋅ [RPM] ⋅ 0.0088738
Electrical Power Powerelectrical [Watts] = VoltageRMS ⋅ CurrentRMS ⋅ pf ⋅ df
where pf and df are the power factor and distortion factor of the sinusoidal source voltage and load current
Blower Efficiency ηstatic = Powerair / Powershaft (static efficiency)
System Efficiency ηsystem = Powerair / Powerelectrical (system efficiency with motor losses)
VIII. References 1. Topical Progress Report for the Variable Speed Integrated Intelligent HVAC Blower, Comprehensive Topical Report for BP1 (9/2000 - 11/2001), Department of Energy report, submitted December, 2001.
IX. List of Acronyms and Abbreviations
CFD computational fluid dynamics CFM cubic feet per minute DSP digital signal processor ECM electronically commutated motor FI forward inclined (blade)
HVAC heating, ventilation & air conditioning OEM original equipment manufacturer RI rearward inclined (blade) SPL sound pressure level VOC voice of the customer
Note: An Appendix is part of this report and it is on file at the Dept. of Energy (paper only copy).