Embed Size (px)
Citation preview
4.0 Overview of Coastal Pelagic Species Fisheries and their Management Dale Sweetnam, Fisheries Resources Division
SWFSC
• Brief description of West Coast CPS
fisheries,
• Changes in management with SWFSC
CPS assessment responsibilities,
• Identify collaborators and clients of the
Pacific Fisheries Management Council
CPS assessments.

Species in the CPS Fishery Management Plan and SWFSC responsibilities: Actively Managed Species
• Pacific Sardine - Assessed annually
• Pacific Mackerel - Assessed annually moving to every 4 years
(2015, 2019) June 2013 PFMC
Monitored Species – Low fishing pressure, rotating assessment schedule
• Jack Mackerel
• Northern Anchovy , Northern Subpopulation
• Northern Anchovy, Central Subpopulation
• Market Squid - CA State Managed Fishery, Large fishery but falls
out of full MSRA management consideration due to <1 year life-
span
Prohibited Species
• Krill – Prohibited fishery
Ecosystem Component Species – Pacific Herring, Jacksmelt – Monitored for
by-catch in CPS fisheries
SWFSC

Species in the CPS Fishery Management Plan and the SWFSC responsibilities:
SWFSC
0
20,000
40,000
60,000
80,000
100,000
120,000
140,000
West coast CPS landings (metric tons) by species, 1981-2012.
Pacific Sardine
Pacific Mackerel
Jack Mackerel
Anchovy
Squid
Met
ric T
ons
Species in the CPS Fishery Management Plan and the SWFSC responsibilities:
SWFSC
$0
$10,000,000
$20,000,000
$30,000,000
$40,000,000
$50,000,000
$60,000,000
$70,000,000
$80,000,000
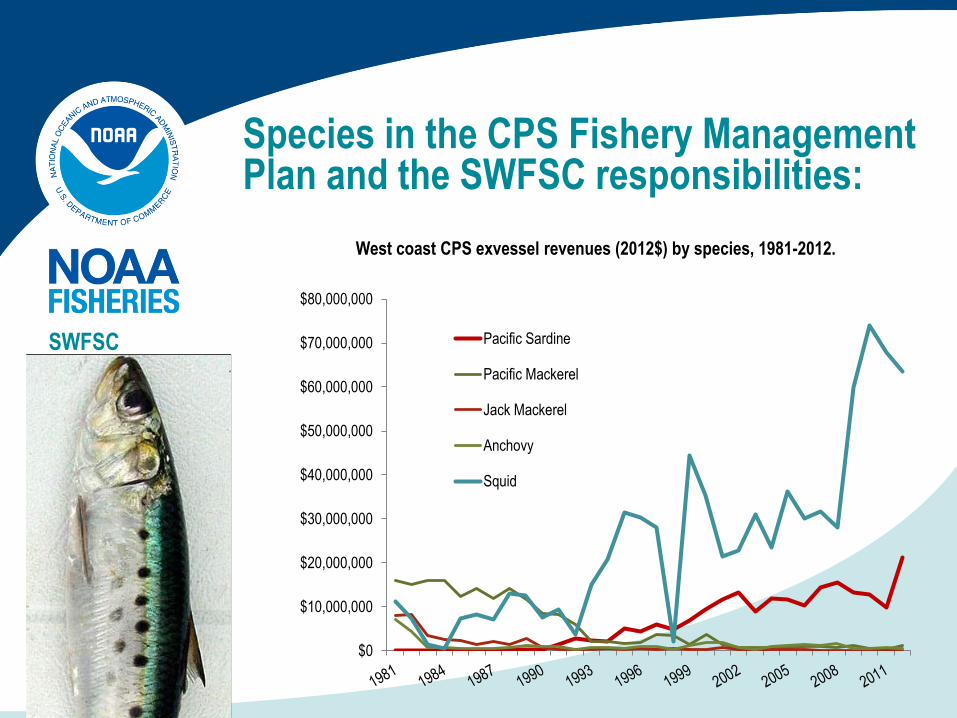
West coast CPS exvessel revenues (2012$) by species, 1981-2012.
Pacific Sardine
Pacific Mackerel
Jack Mackerel
Anchovy
Squid

SWFSC

Species in the CPS Fishery Management Plan and the SWFSC responsibilities:
SWFSC
CPS Fisheries
comprise 48%
of Total US West
Coast Landings
Pacific Coast Fishery Ecosystem Plan, 2013 PFMC

SWFSC
But account for
only 10-14%
of Total US West
Coast Revenues
Pacific Coast Fishery Ecosystem Plan, 2013 PFMC
Species in the CPS Fishery Management Plan and the SWFSC responsibilities:

SWFSC
0.00
1.00
2.00
3.00
4.00
5.00
6.00
0 50 100 150 200 250 300 350 400 450
$/l
b
Millions lbs
Figure 4.9. Average ex-vessel price ($/lb) by average landings (lbs) for PacFIN management groups 2000-2011.
CPEL
CRAB
GRND
HMSP
OTHR
SAMN
SHLL
SRMP
CPS
Groundfish Crab
Shellfish
Species in the CPS Fishery Management Plan and the SWFSC responsibilities:
Pacific Coast Fishery Ecosystem Plan, 2013 PFMC

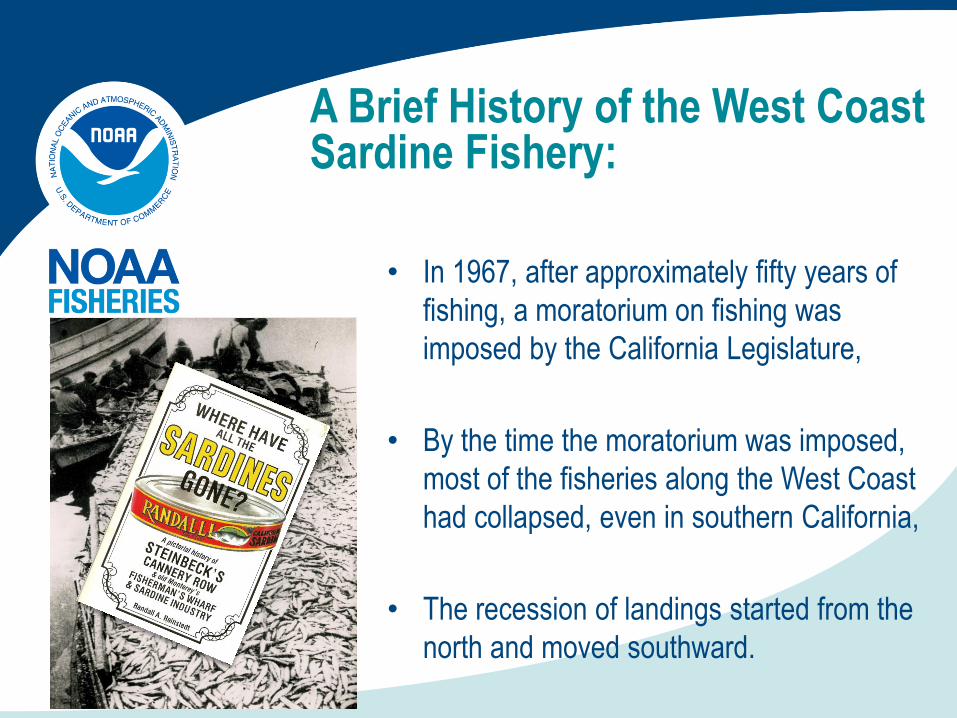
A Brief History of the West Coast Sardine Fishery:
• The Pacific Sardine (Sardinops
sagax caerulea) fishery was the
largest in North America in the 1930s
and 1940s with peak landings of
over 700,000 metric tons in 1936,
• The fishery developed in response to
the demand for food during World
War I and extended from southern
California to British Columbia,
• Sardine were used for either
reduction to fishmeal and oil or
canned for human consumption with
a small portion taken for live bait.
SWFSC

0
100,000
200,000
300,000
400,000
500,000
600,000
700,000
800,000
Metr
ic T
on
s
Season
West Coast Landings of Pacific Sardine from 1916/17 to 2008/09
British Columbia
Washington
Oregon
No. Cal. Reduction Ships
San Francisco
Monterey
Southern California
No. Baja (Cedros Is. to Ensenada)
A Brief History of the West Coast Sardine Fishery:
SWFSC

West Coast Landings of Pacific Sardine
from 1916/17 to 2008/09
0
100,000
200,000
300,000
400,000
500,000
600,000
700,000
800,000
1916-17
1920-21
1924-25
1928-29
1932-33
1936-37
1940-41
1944-45
1948-49
1952-53
1956-57
1960-61
1964-65
1968-69
1972-73
1976-77
1980-81
1984-85
1988-89
1992-93
1996-97
2000-01
2004-05
2008-09
Season
Met
ric
To
ns
British Columbia
Washington
Oregon
No. Cal. Reduction Ships
San Francisco
Monterey
Southern California
No. Baja (Cedros Is. to Ensenada)
Ca
na
da
‘4
7-‘
48
O
reg
on
& W
as
hin
gto
n ’4
8-’
49
C
alC
OF
I F
orm
ed
19
49
Sa
n F
ran
cis
co
’5
1-’
52
Mo
nte
rey ’6
6-’
67
So
uth
ern
Ca
lifo
rnia
’6
7-’
68
SW
FS
C L
a J
oll
a L
ab
op
en
s ‘6
4
A Brief History of the West Coast Sardine Fishery:
• In 1967, after approximately fifty years of
fishing, a moratorium on fishing was
imposed by the California Legislature,
• By the time the moratorium was imposed,
most of the fisheries along the West Coast
had collapsed, even in southern California,
• The recession of landings started from the
north and moved southward.
SWFSC

SWFSC
0
20000
40000
60000
80000
100000
120000
140000
160000
180000
Metr
ic T
on
s
Season
West Coast Landings of Pacific Sardine from 1968/69 to 2008/09
British Columbia
Washington
Oregon
San Francisco
Monterey
Southern California
No. Baja (Cedros Is. to Ensenada)
1st D
ire
cte
d F
ish
ery
1,0
00
st California declares
Sardine resource
recovered – 1999
Management
authority shifts
from California
to NMFS 2000
A Brief History of the West Coast Sardine Fishery:

Changes in management with SWFSC CPS assessment responsibilities:
SWFSC
2000 - Amendment 8
Start of Federal Management:
• Annual harvest guideline (HG), quotas, allocations, timing of assessments
• Limited Entry (LE) program
• Management areas – Limited Entry zone of two sub areas (divided by Pt. Piedras Blancas), open access north of Pt. Arena
• Provisions for closing the fishery when HG achieved, incidental allowance, exempted fishing permits, etc.

Changes in management with SWFSC CPS assessment responsibilities:
SWFSC
California:
• Federal Limited Entry Program
• South of 39° N. latitude (Pt. Arena, CA)
CPS permit (>5mt); 65 permits; 30 vessels in 2011
• North of 39° N. latitude – Open Access
• Capacity goals and transferability provisions (Amendment 10)
• Fleet capacity is calculated on gross tonnage of individual vessels
• No logbook program in place (market squid logbooks required by
California)
Oregon:
• Managed as a developmental fishery 1999-2005
• State Limited Entry Program established 2005
• 2012 - 25 permits, 21 active vessels
• Logbooks required
Washington:
• Started as a “trial” fishery, changed to an “experimental” fishery in
2003
• State Limited Entry Program established in 2009 (up to 25 permits)
• 2011 – 25 permits issued, 7 active vessels
• Logbooks required

Changes in management with SWFSC CPS assessment responsibilities:
SWFSC
0
20,000
40,000
60,000
80,000
100,000
120,000
140,000
1998
1999
2000
2001
2002
2003
2004
2005
2006
2007
2008
2009
2010
2011
2012
Met
ric
Ton
s
Pacific Sardine Landings by State
California Oregon Washington
0%
20%
40%
60%
80%
100%
P
e
r
c
e
n
t
Percent of Landings by State
California Oregon Washington

Changes in management with SWFSC CPS assessment responsibilities:
SWFSC
2005 - Amendment 11
PFMC approves a long-term seasonal allocation program to equitably apportion the available sardine resource along the entire west coast: • 35% of the HG to be allocated coastwide on January 1
• 40% of the HG, plus any portion not harvested from the initial allocation, to be reallocated coastwide on July 1
• On September 15 the remaining 25% of the HG, plus any portion not harvested from earlier allocations, to be reallocated coastwide.
2006 - Amendment 12
PFMC approves a complete ban on commercial fishing of krill

Changes in management with SWFSC CPS assessment responsibilities:
SWFSC
2010 - Amendment 13
PFMC approves revised Annual Catch Limits and Accountability Rules to conform with National Standards 1 Guidelines of MSA reauthorization:
• Modified existing Harvest Control Rules for Actively managed species to include a buffer for scientific uncertainty
• Maintain the default harvest control rules for monitored stocks as modified to specify the new management reference points.
OFL
ABC
ACL
ACT
ABC
OY
overfishing
scientific
uncertainty
increasing
catch
"old"
system
"new"
system
management
uncertainty

Current West Coast Sardine Fishery Management:
SWFSC
CPS fisheries use “roundhaul gear” mainly purse
or drum seine vessels for all CPS including
sardines, mackerel, tuna and market squid
State Limited Entry
Oregon: 25 permits; 17 vessels in 2011
Washington: 25 permits; 7 vessels in 2011

Current West Coast Sardine Fishery Management:
SWFSC
• Average age of vessels - 34 years
• Length rages from 40 to 98 feet
• Gross Tonnage ranges from 23.8 to 340.2, average 88.7
• Fleet GT Capacity = 5,650.9, current = 5,408.4

Current Market Squid Fishery:
• Same purse seines vessels with additional CA squid permits
• Nets are modified to be longer with decrease mesh size
• Lightboats and brail vessels are also permitted
• Incandescent lighting up to 30,000 watts


Current California Market Squid Fishery Management:
SWFSC
California Market Squid FMP in 2005 implemented regulations to
address the following:
Fishery Control Rules
• Seasonal Catch limit of 107,047 mt (118,000 short tons)
• Weekend closures to allow for uninterrupted spawning
• Monitoring program (Egg Escapement) with mandatory logbooks
• Attracting lights limited to 30,000 watts, shielded to reduce bird interactions
Restricted Access Program - based on historical participation in the fishery:
• Market squid Vessel Permits: 69 transferable, 8 non-transferable
• Market squid Brail Permits: 42 transferable, 0 non-transferable
• Market squid Light boat permits: 33 transferable, 3 non-transferable
Ecological Concerns
• Seabird closure area restricting the use of attracting lights for commercial purposes in any waters of the Gulf of the Farallones National Marine Sanctuary
• Additional closure areas to the fishery to protect squid spawning habitat include the Channel Islands Marine Protected Areas (MPAs) and the newly established MPAs along the central California coast as well areas closed to the use of purse seine gear including the leeward side of Catalina Island, Carmel and Santa Monica Bays.

Who are the collaborators on CPS assessments?
SWFSC
• Western Region, NOAA Fisheries – Regulatory
and NEPA responsibilities
• California, Oregon, and Washington continue to
monitor the CPS fisheries landings for fishery
dependent biological information including:
o Collection of catch information on a real
time basis for allocation monitoring
o Collection of biological Information:
length, weight, Age (otolith aging), sex
and maturity, etc.
o Collection of by-catch and incidental
catch information
• Tribal Interests – CPSMT membership
• International Collaborators - Biological and landings
information
• Canada - DFO
• Mexico-Conapesca, Inapesca
Who are the clients of the Pacific Fisheries Management Council CPS assessments?
SWFSC
• CPS Fishing Industry which takes an active role in their management (e.g., aerial surveys, squid paralarvae surveys, participation in the Council process),
• International Management Partners (DFO - Canada, CONAPESCA – Mexico),
• University researchers also interested in sustainable fisheries management (e.g., UW, SIO),
• Other interests which value CPS for human consumption and as forage (sport fishers, NGOs, etc.),
• Trinational Sardine Forum (all interested parties)

SWFSC
Strengths
• Informal exchange of data e.g., Trinational Sardine Forum
• Strong relationships with the CPS fishing industry, partners
Challenges
• Formal transfer of information between international managers
• Continuation of state port sampling programs, especially for monitored species with minimal landings
• Representation in management process, both state and federal
Strategies for Improvement
• Continue formal process with Mexico e.g., MexUS-Pacifico

Questions?
Acknowledgements to Sam Herrick and James Hilger for CPS economic updates
U.S. Department of Commerce | National Oceanic and Atmospheric Administration | NOAA Fisheries | Page 27

La Jolla 2-28-2008