Embed Size (px)
Citation preview

1
4. THE LISBON STRATEGY AND THE EU’S STRUCTURAL PRODUCTIVITY PROBLEM

2
Summary The structural nature of the EU’s productivity downturn is confirmed, with the bulk of the deterioration emanating from an outdated and inflexible industrial structure which has been slow to adapt to the intensifying pressures of globalisation and rapid technological change. The EU’s productivity problems are driven by the combined effect of an excessive focus on low and medium-technology industries (with declining productivity growth rates and a globalisation-induced contraction in investment levels); an inability to seriously challenge the USA’s dominance in large areas of the ICT industry, as reflected in the relatively small size of its ICT production sector; and finally, its apparent slowness in reaping the productivity enhancing benefits of ICT in a range of ICT-using industries, although measurement issues severely complicate an assessment of the gains from ICT diffusion.
The post-1995 differences in EU-US productivity patterns are fundamentally driven by the USA’s superiority in terms of its capacity to produce and absorb new technologies, most notably in the case of ICT. Healthy knowledge production and absorption processes are mutually supportive elements of any successful long run productivity strategy. Evidence is presented which suggests that the USA’s overall innovation system is superior to that of the EU’s, both in terms of the quality and funding of its knowledge sector and the more favourable framework conditions prevailing. The repeated ability of the US system to direct resources towards the newer, high technology (and often high productivity growth), industries is a reflection of the quality of the interrelationships between the different actors in its innovation system and of an economic and regulatory framework which has the capacity to transform excellence in knowledge creation into a globally competitive industrial structure.
The systemic inadequacies of the EU’s innovation system are highlighted by the experience of the ICT industry, with the history of this industry suggesting that a “national champions” strategy in high technology industries is highly problematic. A wide range of factors are shown to have contributed to the USA’s global dominance in ICT. These factors include focussed R&D activities; world class research and teaching establishments; defense procurement contracts which nurtured the ICT industry (on the demand side) in its incubation phase in the 1950s and 1960s; and the unique combination of financing mechanisms and a highly competitive domestic marketplace which brought the ICT industry from the knowledge creation phase to the critical diffusion/mass market phase. The history of the ICT industry also suggests that a “national champions” strategy in high technology industries is a recipe for failure, with the chapter highlighting in particular the large price which Europe has paid for its “national champions” policy in this particular industry back in the 1960s and 1970s, which contrasted sharply with the strategies adopted by Japan and the USA.
In terms of policy, the chapter stresses that the EU’s innovation system needs to be fundamentally reformed if the EU is to make a decisive shift towards realising the vision of a successful, innovation-based, economic model, the broad features of which have been laid out in the Lisbon 2010 agenda. The success of such a model will be determined not so much by a massive increase in the amount of financial resources devoted to knowledge production (i.e. increased spending on R&D and higher education) but by an acceptance of the need to improve linkages in the innovation system and to make painful changes in many areas of the EU’s economic and regulatory environment. More specifically the present study stresses the following:
• The systemic nature of the innovation process needs to be fully recognised and the quality of the interrelationships between the different actors in the EU’s system needs to be dramatically improved.
• The public and private sectors each play important, mutually supportive, roles in determining a country’s innovation capacity and each must assume its responsibilities if the EU’s knowledge economy objectives are to be realised.
• Industry-specific framework conditions need to be taken into account by EU policy makers due to the complicated link between competition and innovation. Product market conditions and the characteristics of specific technologies are what ultimately determines the relationship between market concentration and R&D intensity.
• Market entry and exit rules, by putting pressure on incumbent firms to innovate and by supporting market experimentation, are crucial to an effective innovation process in rapidly changing industries.

3
TABLE OF CONTENTS
1. INTRODUCTION ................................................................................................................................................5 2. EU PRODUCTIVITY TRENDS AT THE ECONOMY WIDE LEVEL ............................................................................6
2.1 Overview of main trends ........................................................................................................................................ 6 2.2 ICT as an explanatory factor at the total economy level ......................................................................................... 7 2.3 Are low EU productivity growth rates a permanent phenomenon or a temporary blip? ......................................... 7
3. THE STRUCTURAL NATURE OF THE EU’S PRODUCTIVITY PROBLEM ...............................................................10 3.1 A 56 industry breakdown of labour productivity trends ....................................................................................... 10 3.2 Where are the ICT productivity gains coming from? ............................................................................................ 14
4. ENHANCING THE EU’S PRODUCTIVITY PERFORMANCE ..................................................................................19 4.1 The knowledge economy must be a central element ............................................................................................. 19 4.2 The USA has a superior innovation model ........................................................................................................... 20 4.3 Reforming the EU’s Innovation Capacity ............................................................................................................. 24
5. SUMMARY OF KEY FINDINGS ..........................................................................................................................29 REFERENCES ............................................................................................................................................................32 ANNEX: PRODUCTIVITY MEASUREMENT ISSUES ....................................................................................................33

4

5
THE LISBON STRATEGY AND THE EU’S STRUCTURAL PRODUCTIVITY PROBLEM
1. Introduction
Europe’s growth performance has been the subject of increasing scrutiny over recent years, most notably in the context of the Lisbon process and its efforts to encourage governments to introduce employment and productivity enhancing reforms. This reform agenda is all the more pressing given that the EU’s underlying growth rate has been trending downwards since the second half of the 1990s and since the medium to long term outlook points to a continuation of these trends. While many EU countries are understandably preoccupied with extricating their economies from the relatively prolonged short run downturn, it is widely acknowledged that many of the solutions to this slow growth problem require a longer term policy perspective. A sustainable medium-term recovery process, according to a wide range of commentators, demands action on a Lisbon-inspired structural reform agenda aimed at effectively addressing the EU’s fundamental growth challenges, presently posed by the accelerating pace of technological change, globalisation (most recently in terms of the growing tradeability of large parts of the service economy) and ageing populations. Whilst accepting the absolute necessity of encouraging a more labour intensive growth pattern over the medium to long term, the present chapter focuses on the productivity part of the Lisbon agenda. It specifically analyses the nature/source of the deterioration in the EU’s productivity performance relative to that in the USA since the mid-1990s and outlines the approach to be adopted in order to remedy this situation. Given the extensive treatment accorded to the productivity theme in last year’s Review, the present chapter will build on this latter work by focussing on three specific issues related to the EU’s recent productivity performance and of its ambitions to become the most competitive, knowledge based, economy in the world by 2010:
Firstly, how does the EU compare with the USA in terms of economy-wide productivity trends and how big a role has ICT played in explaining the diverging patterns? Furthermore, should the post-1995 deterioration in EU productivity be interpreted as a transitory or a structural phenomenon?
Secondly, in explaining recent EU-US divergences in productivity trends, to what extent is the EU’s relatively poor performance linked with its particular industrial structure and its difficulty in reorientating its economy towards the newer, higher productivity, growth sectors such as ICT? In terms of the specific role of ICT, the chapter asks whether the contribution of the ICT-producing industries to overall productivity patterns has been underestimated in favour of ICT diffusion explanations which stress the crucial role of a small number of intensive ICT-using industries such as wholesale and retail trade.
Finally, in the context of delivering on the EU’s longer term ambitions of progressively moving towards a more knowledge-based economy, the study focuses on the specific role to be played by the production and absorption of new technologies in any overall strategy. While the present chapter fully accepts that the absorption of innovation from other industries/countries will remain a fundamental element in determining the EU’s future productivity performance, it nevertheless argues strongly in favour of a greater recognition amongst EU policy makers of the importance of a globally competitive knowledge production system to the realisation of the Lisbon goals. Creating a system capable of delivering on both aspects of the innovation process is not simply an issue of more spending on R&D and 3rd level education. More importantly it is a question of better linkages between the different players in the innovation system and a recognition of the need for a dynamic, competitive, business environment in accelerating the move from the knowledge creation/absorption phase to the critical commercial phase.
6
2. EU productivity trends at the Economy wide level
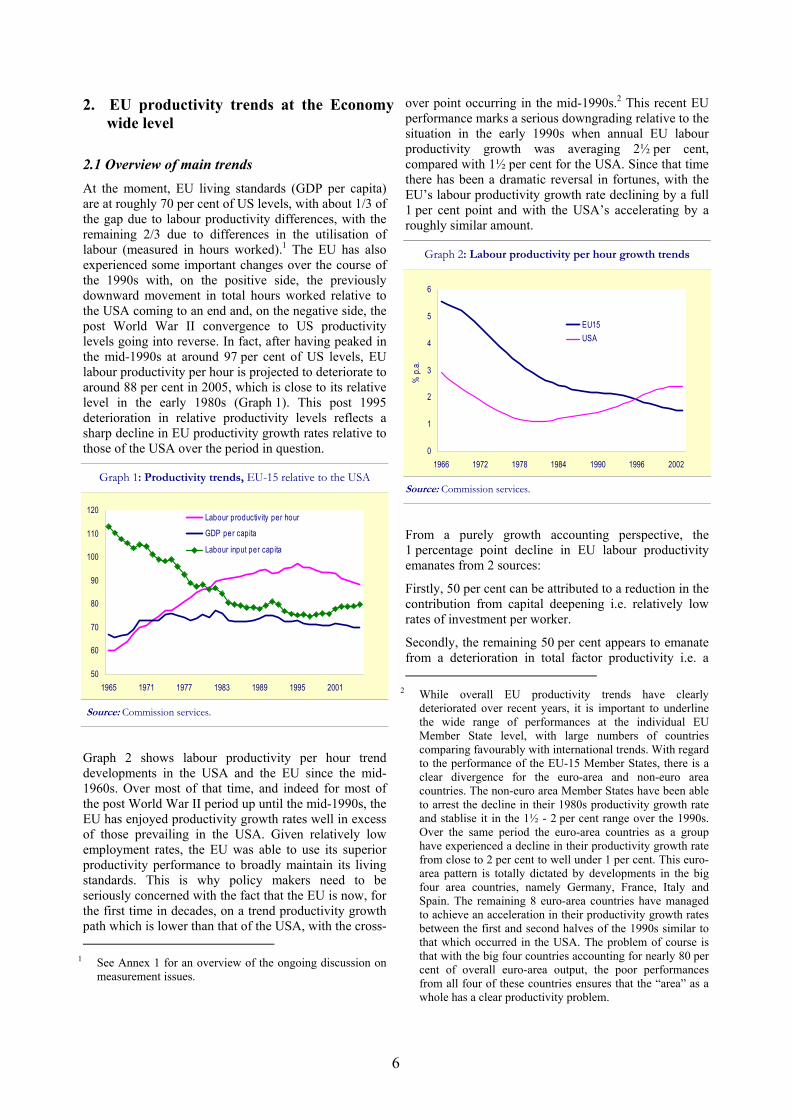
2.1 Overview of main trends At the moment, EU living standards (GDP per capita) are at roughly 70 per cent of US levels, with about 1/3 of the gap due to labour productivity differences, with the remaining 2/3 due to differences in the utilisation of labour (measured in hours worked).1 The EU has also experienced some important changes over the course of the 1990s with, on the positive side, the previously downward movement in total hours worked relative to the USA coming to an end and, on the negative side, the post World War II convergence to US productivity levels going into reverse. In fact, after having peaked in the mid-1990s at around 97 per cent of US levels, EU labour productivity per hour is projected to deteriorate to around 88 per cent in 2005, which is close to its relative level in the early 1980s (Graph 1). This post 1995 deterioration in relative productivity levels reflects a sharp decline in EU productivity growth rates relative to those of the USA over the period in question.
Graph 1: Productivity trends, EU-15 relative to the USA
50
60
70
80
90
100
110
120
1965 1971 1977 1983 1989 1995 2001
Labour productivity per hour
GDP per capita
Labour input per capita
Source: Commission services.
Graph 2 shows labour productivity per hour trend developments in the USA and the EU since the mid-1960s. Over most of that time, and indeed for most of the post World War II period up until the mid-1990s, the EU has enjoyed productivity growth rates well in excess of those prevailing in the USA. Given relatively low employment rates, the EU was able to use its superior productivity performance to broadly maintain its living standards. This is why policy makers need to be seriously concerned with the fact that the EU is now, for the first time in decades, on a trend productivity growth path which is lower than that of the USA, with the cross-
1 See Annex 1 for an overview of the ongoing discussion on measurement issues.
over point occurring in the mid-1990s.2 This recent EU performance marks a serious downgrading relative to the situation in the early 1990s when annual EU labour productivity growth was averaging 2½ per cent, compared with 1½ per cent for the USA. Since that time there has been a dramatic reversal in fortunes, with the EU’s labour productivity growth rate declining by a full 1 per cent point and with the USA’s accelerating by a roughly similar amount.
Graph 2: Labour productivity per hour growth trends
0
1
2
3
4
5
6
1966 1972 1978 1984 1990 1996 2002
% p.
a.
EU15USA
Source: Commission services.
From a purely growth accounting perspective, the 1 percentage point decline in EU labour productivity emanates from 2 sources:
Firstly, 50 per cent can be attributed to a reduction in the contribution from capital deepening i.e. relatively low rates of investment per worker.
Secondly, the remaining 50 per cent appears to emanate from a deterioration in total factor productivity i.e. a
2 While overall EU productivity trends have clearly deteriorated over recent years, it is important to underline the wide range of performances at the individual EU Member State level, with large numbers of countries comparing favourably with international trends. With regard to the performance of the EU-15 Member States, there is a clear divergence for the euro-area and non-euro area countries. The non-euro area Member States have been able to arrest the decline in their 1980s productivity growth rate and stablise it in the 1½ - 2 per cent range over the 1990s. Over the same period the euro-area countries as a group have experienced a decline in their productivity growth rate from close to 2 per cent to well under 1 per cent. This euro-area pattern is totally dictated by developments in the big four area countries, namely Germany, France, Italy and Spain. The remaining 8 euro-area countries have managed to achieve an acceleration in their productivity growth rates between the first and second halves of the 1990s similar to that which occurred in the USA. The problem of course is that with the big four countries accounting for nearly 80 per cent of overall euro-area output, the poor performances from all four of these countries ensures that the “area” as a whole has a clear productivity problem.

7
decline in the overall efficiency of the production process.
2.2 ICT as an explanatory factor at the total economy level
One of the most popular explanations for the diverging productivity fortunes of the EU and the USA has been the relative exposure of both areas to ICT. Last year’s Review showed that ICT has indeed been an important part of the story, especially in terms of explaining the turnaround in the productivity trend of the USA. The overall contribution to labour productivity growth from ICT investments (i.e. purchases of software, computing and communications equipment) and from technical progress in the production of ICT goods and services (e.g. the semiconductor and telecommunications industries) accounted for about 60 per cent of US labour productivity growth over the second half of the 1990s, compared with 40 per cent in the four EU countries for which such a breakdown exists.3 This translates over the second half of the 1990s into an ICT contribution to labour productivity growth of around 1½ percentage points in the USA and ¾ of a percentage point in the case of the EU-4.
In terms of the trend acceleration in US labour productivity growth over the two halves of the 1990s, about half of the 1 percentage point acceleration can be directly attributed to ICT. In the case of the EU-4 group of countries, the effects of ICT on both capital deepening and TFP over the same period was positive, although significantly less positive than in the USA. Consequently, given that ICT was not responsible for the deteriorating EU productivity trend, the role of non-ICT determinants such as labour market reforms or the EU’s outdated industrial structure needs to be assessed. Section 2.3 looks at the role of labour market reforms, with Section 3 asking whether an excessive focus on traditional, low productivity growth, industries could be responsible for the deteriorating EU trend.
3 These are France, Germany, the Netherlands and the UK.
They constitute the EU-4 in the subsequent analysis.
2.3 Are low EU productivity growth rates a permanent phenomenon or a temporary blip? Are low EU productivity growth rates likely to be a permanent phenomenon or a temporary blip linked to labour market reforms? To help answer this question, it is helpful to review the basic growth patterns (employment and productivity) between the EU and the USA in the 1990s
• The EU’s trend productivity growth rate, as shown earlier, continued to decline throughout the 1990s and fell below the equivalent, and rapidly increasing, US productivity growth rate around the middle of the decade.
• Regarding employment, the decline in employment rates in the EU came to an end in the early 1990s and started to trend upwards. In the USA a positive trend continued but at a slower pace.
• Closely associated with the movement in labour productivity growth, fairly parallel trend developments for capital-labour substitution were observed, i.e. a further decline in Europe and an increase in the USA.
Graph 4 shows the basic movements for the EU for these three variables, with these trends especially striking when contrasted with those of the USA over the same period (Graph 5). This comparison shows in a dramatic way the extent to which the EU economy is failing to exploit the technological opportunities which are presently available in the world economy. The USA in contrast has experienced a marked trend reversal in its labour productivity performance, with the latter strongly linked to its exploitation of the opportunities presented by the ICT industry. The trends in these graphs can be assessed in alternative ways, with different interpretations having different implications for the long run outlook for productivity and employment, with our main interest here being productivity.
• A popular interpretation explains the recent productivity trends as a response of the economy to a positive labour supply shock. The shock to labour supply/wages could be the result of labour market reforms. It could also reflect an increasing

8
Graph 3: Breakdown of trend labour productivity into capital deepening and TFP
0
0.5
1
1.5
2
2.5
1966 1972 1978 1984 1990 1996 2002
% p.
a.
Capital deepening EU 15
Capital deepening USA
0
1
2
3
4
1966 1972 1978 1984 1990 1996 2002
% p.
a.
Total factor productivity EU 15
Total factor productivity USA
Source: Commission services.
Graph 4: EU labour productivity, capital-labour, substitution and employment rate trends
0
1
2
3
4
5
6
1966 1972 1978 1984 1990 1996 2002
% p.
a.
Capital-laboursubstitutionLabour productivity
0.55
0.6
0.65
0.7
0.75
0.8
1966 1972 1978 1984 1990 1996 2002
% p.
a.
Employment rate
Source: Commission services.
Graph 5: US labour productivity, capital-labour substitution and employment rate trends
0
1
2
3
4
1966 1972 1978 1984 1990 1996 2002
% p.
a.
Capital-labour substitution
Labour productivity
0.55
0.6
0.65
0.7
0.75
0.8
1966 1972 1978 1984 1990 1996 2002
% p.
a.
Employment rate
Note: The employment rate is defined relative to the population of working age. Source: Commission services.

9
awareness amongst European citizens that pension income will be more uncertain in the future. This negative income effect could have contributed to an increase in labour force participation. Under this interpretation, recent developments could be judged as healthy. Slower wage growth could have led to a temporary decline in capital-labour substitution. Once full employment is reached, wage and productivity growth could accelerate again and the economy could go back to a higher growth rate of labour productivity at a higher level of employment. The decline in productivity growth and in capital-labour substitution (i.e. capital deepening) could thus be regarded as a temporary phenomenon.
• An alternative view regards the labour market story as incomplete. According to this view, the data can be explained correctly only if one assumes a negative shock to productivity, either in the form of a decline in the growth rate of TFP or in the form of a positive shock to capital productivity, with the latter shock induced by higher required rates of return for investors. At the macro level a trend decline in TFP could be due to a further increase in the size of the service sector; a reduction in the quality of labour as more low skilled workers are brought into the labour force; and/or a trend decline in technological advances in traditional manufacturing industries. Also with globalisation and increased international capital mobility, the higher returns which can be earned outside Europe may exert pressure on capital productivity. Both developments could explain why capital-labour substitution declined.
Both of the above interpretations would obviously provide a different diagnosis for Europe. According to the first view, recent productivity trends are a temporary phenomenon and a healthy indication that labour markets in Europe have become more flexible. The second view is more pessimistic. It regards the productivity slowdown as a continuation of the previous adverse productivity trends, with the recent increase in employment simply having an additional temporary, negative, effect on productivity. The productivity picture is further complicated by a third possible explanatory factor, namely aggregate demand, with domestic demand over the most recent period being sluggish, triggering a cyclical impact on measured productivity.
To analyse more rigorously whether the productivity pattern is temporary or more structural, we need to be able to identify the nature of the shocks driving productivity. We use a VAR methodology to analyse the various contributions to the productivity slowdown, coming from the three shock variables: employment, productivity and demand. A VAR analysis is particularly suited for this purpose since it allows us to
Graph 6: Euro-area employment shock: 1995 Q1 to 2003 Q4
-2
-1
0
1
2
3
4
5
6
95Q2 96Q2 97Q2 98Q2 99Q2 00Q2 01Q2 02Q2 03Q2
Employment
Productivity
Source: Commission services.
identify the driving forces behind changes in employment and productivity and, in addition, to analyse the temporary versus permanent nature of the effects.
The employment chapter in the present EU Review4
provides an in-depth examination of the first question in the VAR analysis, namely to what extent the increase in employment can explain the decline in productivity growth. The VAR analysis identifies a sequence of positive employment shocks in the second half of the 1990s which have increased the level of employment by about 5 per cent in the euro area. The shock driving employment, however, only had a small effect on productivity (Graph 6). According to the estimate, the 5 per cent increase in employment has reduced the level of productivity by only about 0.75 per cent. This is about 10 per cent of the total reduction in productivity growth experienced since the mid 1990s. Hence, employment shocks can only marginally explain the decline in productivity growth.5
The second contribution of the VAR model relates to the question of the structural versus temporary nature of the effects. Based on the underlying assumptions on the short, medium and long term impact of the various shocks, the VAR model attributes most of the decline in productivity to a structural trend decline in productivity growth. As can be seen from Graph 7, the autonomous shock to productivity explains a decline in the level of productivity of 5 per cent, which would translate into an
4 Chapter 3 contains a technical description of the VAR
analysis. 5 It should be noted that this VAR estimate of 10 per cent is
at the lower end of the estimates obtained using a range of estimation methods. For example, results from the Commission’s QUEST model suggest that about 30 per cent of the reduction in productivity growth could be explained by the employment shock. Also results from growth regressions suggest that about 25 per cent of the productivity decline is due to the increase in employment.

10
Graph 7: Euro-area productivity shock: 1995 Q1 to 2003 Q4
-5
-4
-3
-2
-1
0
1
95Q2 96Q2 97Q2 98Q2 99Q2 00Q2 01Q2 02Q2 03Q2
% p.
a.
EmploymentProductivity
Source: Commission services.
annual average productivity growth rate effect of the order of 0.6 per cent. This is fully consistent with the growth accounting result given earlier of a decline in TFP of the order of ½ a percentage point, with TFP considered to be a reflection of the structural component of the productivity trend. Graph 7 also indicates that the autonomous productivity shock is unable to explain the increase in employment. Therefore, an interpretation of both shocks is necessary in order to give a complete picture of the employment and productivity developments.6 However, concerning productivity, the overall conclusion from the analysis suggests that the decline in productivity growth is to a large extent structural in nature.
3. The structural nature of the EU’s productivity problem
The present section extends the analysis from Section 2, in particular its suggestion that the EU has a structural productivity problem, by taking a closer look at sectoral/industry level productivity developments. Two specific issues are examined:
• Firstly, an attempt is made in 3.1 to isolate the source of the EU’s productivity problems at the sectoral level: are those difficulties confined to the manufacturing, private services or rest of the economy sectors or linked to particularly dynamic specific industries within these broad categories? In addition, by categorising the different industries on the basis of their ICT content into ICT producing, intensive ICT-using and less-intensive ICT-using industries, the section gives a more detailed insight into the role of ICT in shaping overall EU and US productivity trends. The key question is to what extent Europe’s problems reflect an inflexible and
6 See the employment chapter for a more detailed discussion
of the trade-offs between productivity and employment shocks.
outdated industrial structure which has failed to fully exploit the direct and indirect productivity benefits from new, leading edge, technologies such as ICT.
• Secondly, whilst not questioning the overall contribution of ICT to labour productivity trends, Section 3.2 adds to the ongoing debate regarding the relative importance of the different channels (i.e. production, investment and spillover effects) via which ICT impacts on the respective economies. It is contended that a large proportion of the recent literature may be underestimating the direct gains from the production of ICT goods and services in favour of the view that most of the gains emanate from the use of ICT. This debate on the respective contributions of the different ICT transmission channels is important to the policy debate in the final section of this chapter when we discuss a productivity agenda for the EU and the importance to be attributed to the production and absorption of new technologies.
3.1 A 56 industry breakdown of labour
productivity trends The basis for this industry level analysis is a 56 industry breakdown of the EU and US economies, which enables us to show the contribution of each of the individual industries to overall labour productivity growth in both areas (i.e. the combined effect of productivity growth in the specific industry and of its share in overall output).7 This breakdown is shown in Graph 8 and visualises the productivity dilemma facing the EU by giving a panoramic overview of the contribution of the 56 industries. For ease of exposition the industries are shown as part of the manufacturing, private services and rest of economy (primary industries and public services) sectors.
3.1.1 Overview of all 56 industries (1996-2000) Graph 8 shows that the EU has been doing reasonably well compared with the USA in a wide range of manufacturing and service industries over the second half of the 1990s. However, the problem is that most of these industries are not making big contributions to overall productivity growth, with the graph indicating a contribution of much less than 0.1 per cent for most of the industries concerned. For example, while Graph 8 shows that the EU’s chemical industry contributed more
7 For the analysis in this section we use an internationally
comparable dataset from the Groningen Growth and Development Centre (GGDC). This dataset has a 56 industry breakdown for all 15 of the old Member States and for the USA and is essentially an expanded version of the OECD’s STAN database.

11
Graph 8: Contributions of the 56 industries to overall labour productivity growth in the US+EU 15 (1996-2000)
-0.2%
-0.1%
0.0%
0.1%
0.2%
0.3%
0.4%
0.5%
0.6%Se
mico
nduc
tors
Of
fice
Mach
inery
C
lothin
g
Chem
icals
Ru
bber
& P
lastic
s
Texti
les
Mo
tor V
ehicl
es
F
urnit
ure
Ba
sic M
etals
Air &
Spa
cecra
ft
Pulp
& Pa
per
Me
tal P
rodu
cts
In
strum
ents
R
ailro
ad E
quipm
ent
In
sulat
ed W
ire P
S
hips &
Boa
ts
Leat
her
Te
lecom
Equ
ipmen
t
Mine
ral P
rodu
cts
Oi
l & N
uclea
r Fue
l
Prin
ting
& Pu
blish
ing
Radio
and
TV
W
ood
& W
ood
Prod
ucts
E
lectric
al Ma
chine
ry
Mec
hanic
al En
ginee
ring
Sc
ientifi
c Ins
trume
nts
Fo
od, D
rinks
& T
obac
co
W
holes
ale T
rade
R
etail
Tra
de
Real
Esta
te A
ctivit
ies
A
ux.F
inanc
ial S
ervic
es
Fina
ncial
Ser
vices
Co
mmun
icatio
ns
Ren
ting
of M
achin
ery
Ai
r Tra
nspo
rt
Insu
ranc
e &
Pens
ions
Au
x.Tra
nspo
rt Ac
tivitie
s
Res
earch
& D
evelo
pmen
t
Land
Tra
nspo
rt
Wat
er T
rans
port
L
egal
& Ad
vertis
ing
Comp
uter
Ser
vices
El
ectric
ity, G
as &
Wat
er
Ot
her B
usine
ss A
ctivit
ies
Mo
tor S
ales &
Rep
airs
Co
nstru
ction
Hote
ls &
Resta
uran
ts
Agric
ultur
e
Publi
c Adm
in &
Defe
nce
Fis
hing
Fo
restr
y
Minin
g &
Quar
rying
Socia
l & P
erso
nal S
ervic
es
He
alth
& So
cial W
ork
Ed
ucat
ion
EU 15USA
M anufacturing Private services Rest of econom y
Source: Commission services and GGDC.

12
than twice as much to the EU’s overall productivity growth rate as did the equivalent US industry, it nevertheless still contributed only 0.07 percentage points to the EU’s overall total. This is only 1/8 of the contribution of the semiconductor industry to overall US productivity growth. This latter industry in fact contributed nearly a quarter of all US productivity growth over the period 1996-2000. This basic story is replicated right across the 56 industries. In the 37, mainly traditional and medium tech, industries where the EU has equalled or outperformed the USA over the second half of the 1990s, apart from communications,,8 all of the remainder are either low productivity growth industries or do not have a large enough share of EU output to alter the EU’s overall productivity performance. In addition, for most of these industries not only are productivity growth rates low but they have been declining over the course of the 1990s.9
3.1.2 Breakdown of 56 industries based on their ICT concent
Another way of highlighting the EU’s underlying productivity problem is to classify the 56 industries according to their ICT content into ICT producing, intensive ICT-using and less intensive ICT-using industries. This has the advantage of firstly isolating the importance of ICT in driving overall productivity growth and secondly this three-way ICT breakdown can also be used as a rough proxy for high, medium and low productivity industries in the EU and USA as a whole. This breakdown is given in Table 1 which indicates that the ICT producing manufacturing and intensive ICT-using private services categories are driving the 1996-
8 Within the ICT-producing sector, communications is an industry where the EU has an undoubted advantage over the USA, is characterised by high productivity growth and has a large share of EU output.
9 An analysis of longer term trends 1980-2000 in productivity in the EU and USA is also revealing. At the level of the 3 broad sectors of manufacturing, private services and the rest of the economy, the key developments are the following: 1. For manufacturing, the EU is on a long run downward trend due to its dependence on a range of low to medium technology industries which are increasingly exposed to the competitive pressures of globalisation. The USA on the other hand appears to have arrested its 1980s decline and has managed to put itself on a slightly rising trend since the mid-1990s, driven in large part by its global dominance in high technology industries such as semiconductors and office machinery. 2. More impressive still has been the USA’s relative performance in the private services industries. Nearly 2/3 of the USA’s overall productivity growth rate now emanates from services, compared with as little as 1/6 at the beginning of the 1980s. Over the same period the EU’s private services industries have been contributing less and less in absolute terms to overall EU labour productivity growth. 3. Finally, the EU is doing better than the USA in the “rest of the economy” sector (i.e. primary industries/public services) but even here the trend is downwards and the contribution of the sector to overall productivity growth is small.
2000 divergences in EU-US productivity growth rates (see also Graph 9). In fact, these two groups of industries were responsible for virtually all of the acceleration in US productivity over the second half of the 1990s. It is precisely in these two areas of the economy that the EU fares badly relative to the USA either in terms of the size of the respective industries (i.e. small shares of overall EU output) or by having relatively low productivity growth rates. In addition, as shown in the 2003 Review, in terms of explaining EU-US productivity growth differentials over the second half of the 1990s, it turns out that out of the total of 56 industries, just five (semiconductors; communications; wholesale trade; retail trade; and financial services) dominate the overall labour productivity growth patterns and all five are located in the ICT-producing and ICT-using categories. These 5 specific industries contributed 80 per cent of the US total productivity growth rate over the 1996-2000 period, compared with a contribution of only 40 per cent in the case of the EU.
Regarding the less-intensive ICT-using part of the respective economies, the slowdown in the EU’s productivity growth rate in both the “rest of manufacturing”, “rest of services” and “rest of economy” categories shown in Table 1 is marked over the most recent period. These more traditional industries collectively still account for over 70 per cent of EU GDP. The USA has also experienced a slowdown in productivity growth in their “rest of manufacturing” category, whilst showing only marginal changes in the “rest of services” and the “rest of economy” categories. In the case of the USA, however, the globalisation-related downturn in their more traditional manufacturing industries and the relatively poor contribution from a range of its low to medium-tech service industries was offset by strong performances elsewhere in the economy. In particular the USA has had good performances in the newer, more knowledge intensive, manufacturing industries such as semiconductors and in a number of its intensive ICT-using service industries. The problem for the EU is that its pattern of declining/expanding industries is very different to that in the USA, with the EU’s trend productivity growth rate being pushed downwards by:
Firstly, having a greater share of its production concentrated in traditional manufacturing sectors where the EU has in the past been strong in global terms but where competitive conditions are now becoming more difficult due to globalisation.
Secondly, the EU is experiencing a further increase in its share of private services, with below average growth rates of labour productivity (at least historically), and with an additional downward shift in productivity in these industries over the 1990s due to the labour market reforms discussed earlier. It is in these traditional service industries, such as hotels and restaurants, transport etc, where the productivity reducing effects of these reforms have been felt most.

13
Table 1: Breakdown of total economy into 3 categories – 2 ICT categories (ICT producing + Intensive ICT-
Using) and 1 category of Less Intensive ICT using (i.e. more traditional) Industries
Hourly Labour Productivity (Average % Change)
Value Added Share Contribution to Total Change in Hourly Labour Productivity
1991-1995 1996-2000 1991-1995 1996-2000 1991-1995 1996-2000
Total economy (1+2+3) EU 2.3 1.6 1 1 2.3 1.6 USA 1.1 2.3 1 1 1.1 2.3
1. Manufacturing sector EU 3.7 2.6 0.23 0.21 0.9 0.5 USA 3.6 4.6 0.19 0.18 0.7 0.8
1(a) ICT-producing manufacturing industries EU 9.6 17.1 0.02 0.01 0.2 0.2 USA 16.4 26.0 0.03 0.03 0.4 0.7
1(b) Intensive ICT-using manufacturing industries EU 2.6 2.0 0.07 0.06 0.2 0.1 USA -0.6 1.4 0.06 0.05 0.0 0.1
1(c) Rest of manufacturing (Less-intensive ICT using) EU 3.6 1.6 0.14 0.13 0.5 0.2 USA 2.6 0.6 0.10 0.11 0.3 0.1
2. Private services sector EU 1.9 1.4 0.52 0.54 1.0 0.7 USA 1.0 2.7 0.53 0.54 0.5 1.5
2(a) ICT-producing service industries EU 4.8 6.8 0.03 0.03 0.2 0.2 USA 2.4 0.8 0.03 0.04 0.1 0.0
2(b) Intensive ICT-using service industries EU 1.8 2.1 0.20 0.21 0.4 0.4 USA 1.6 5.3 0.23 0.25 0.4 1.3
2(c) Rest of Services (Less-intensive ICT using) EU 1.7 0.2 0.29 0.30 0.5 0.1 USA 0.2 0.3 0.27 0.26 0.1 0.1
3. Rest of Economy (Primary industries + public services, less intensive ICT-using) EU 2.0 1.1 0.25 0.25 0.5 0.3 USA -0.3 -0.1 0.28 0.27 -0.1 0.0
Source: Commission services and GGDC.
Graph 9: Contribution to the total change in trend labour productivity per hour from the ICT-producing manufacturing and intensive ICT-using private services
0
0.1
0.2
0.3
0.4
0.5
0.6
0.7
1980 1984 1988 1992 1996 2000
% pt
ICT producingmanufacturing EUICT producingmanufacturing USA
0
0.2
0.4
0.6
0.8
1
1.2
1.4
1980 1984 1988 1992 1996 2000
% pt
Intensive ICT usingprivate services EUIntensive ICT usingprivate services USA
Source: Commission services and GGDC.

14
Thirdly, unlike in the case of the USA, the productivity contributions from the EU’s ICT manufacturing and intensive ICT-using service industries cannot make up for the losses in its more traditional manufacturing and private services sectors.
3.2 Where are the ICT productivity gains coming from?
The analysis in Section 3.1 showed that it was the superior performance of the USA in ICT-producing manufacturing and in ICT-using service industries, such as wholesale and retail trade, which was the source of the diverging EU-US productivity trends since the mid-1990s. While this is the generally accepted view of developments, a number of commentators have been surprised by the fact that the large productivity enhancing effects of ICT have tended to appear in the hard-to-measure service industries and not in other well measured areas of the economy such as manufacturing. While the present analysis is not an attempt to rewrite the conclusions from Section 3.1, it nevertheless tries to rebalance the messages coming out from this work in order to impress on policy makers that the EU’s productivity problems emanate both from the ICT production side as well as from the ICT adoption/using side. Whilst accepting that these measurement issues in the services sector are unlikely to be resolved in the near future, what must be avoided at all costs is that erroneous policy conclusions are drawn given the uncertainties involved.
Productivity developments and the difficulties in disentangling the respective contributions from ICT production and diffusion (capital deepening and spillovers). A primary source of the acceleration in US productivity growth in the 1990s has been the increasing share of ICT production in the overall output of the US economy allied to the extraordinary TFP gains in this specific industry. A second channel through which ICT has impacted on productivity has been through capital deepening, with the falling prices for ICT equipment leading to sharp increases in ICT investment rates (i.e. diffusion in the narrow sense of the term). While the economy-wide productivity gains from these two ICT transmission channels are both impressive, what has been missing up until now has been evidence that these large ICT investments have been generating productivity gains in those industries actually using this equipment (i.e diffusion in the wider sense of the term). Given the “general purpose technology” characteristics of ICT, one would expect to be witnessing these productivity “spillover” effects from using the technology, with these TFP gains representing a third channel via which ICT can impact on aggregate productivity.
From the analysis in 3.1 it would appear that the experience of a small number of intensive-ICT using industries in the USA has provided some evidence that these elusive “spillover” effects are finally emerging. However, as this section will show, the debate is far
from settled with a large degree of controversy still surrounding the size of the productivity contribution coming from these specific ICT using industries, with Gordon (2003) remaining sceptical whilst Stiroh (2002) and O’Mahony et al. (2003) are more optimistic. Attempts to disentangle ICT production, ICT investment and ICT spillover effects on labour productivity growth, using different methodologies, different levels of aggregation and different datasets arrive at rather heterogeneous conclusions. This makes it difficult not only to locate the precise source of the current productivity divergence between the USA and Europe but it also complicates projections on future productivity growth and policy recommendations. This section reviews the alternative approaches and tries to trace the source of the productivity gains in specific ICT using service industries, such as wholesale and retail trade, at a higher level of disaggregation. However, it also points to a more fundamental problem, namely how to measure productivity in those service industries which are heavy users of ICT technologies.
Results from international/regional comparison approach. If one looks at international/regional cross section data, then ICT production rather than ICT-use, appears to be the dominant source of productivity growth. As can be seen from Graphs 10 and 11, there is a correlation between productivity growth and ICT production in the 1990s but there is little correlation between productivity growth and ICT investment. Consistent with the international data, Daveri and Mascotto (2002) present evidence across US states which suggest that the productivity acceleration mostly occurred in those States specialised in the production of IT goods and services. Based on cross-State econometric regressions over the period 1987-2000 they conclude that “… when States where IT production and non IT durable manufacturing which are mostly localized are excluded, the remaining States do not exhibit any significant acceleration in productivity. In particular, the association between productivity gains and IT use is weak”.

15
Graph 10: Hourly labour productivity growth and the ICT production share (1995-2000)
USUK
SE
ES
PT
NL
JP
IT
IE
DEFR
FI
DK
CA
AT
AU
-1
0
1
2
3
4
5
6
0 2 4 6 8 10 12 14 16 18ICT share in value added (1995-2000)
% G
rowt
h in h
ourly
labo
ur pr
oduc
tivity
(199
5-20
00)
Source: Commission services.
Graph 11: Hourly labour productivity growth and the ICT investment share (1995-2000)
USUK
SE
ES
PT
NL
JP
IT
IE
DEFR
FI
DK
CA
BE
AT
AU
-1
0
1
2
3
4
5
6
0 0.5 1 1.5 2 2.5 3 3.5 4 4.5
ICT investment share (% ) (1995-2000)
% G
rowt
h in h
ourly
labo
ur pr
oduc
tivity
(199
5-20
00)
Source: Commission services.

16
Table 2: Growth accounting estimates
Productivity growth differentials (% Points)
(1979-1995 versus 1995-2000) USA EU-4
Labour productivity (1+2+3+4+5) 1.25 -0.27 Contributions to Labour Productivity Growth Differential
1. Labour quality -0.07 -0.09 2. Sectoral employment reallocation effect 0.05 -0.06 3. ICT capital deepening : Total economy 0.40 0.19 3a: ICT producing industries 0.04 0.03 3b: ICT using industries 0.29 0.14 -ICT using manufacturing 0.01 0.01 -Wholesale trade 0.05 0.05 -Retail trade 0.01 0.01 -Financial services 0.17 0.02 -Business services 0.05 0.05 3c: Less Intensive ICT using industries 0.07 0.03 4. Non ICT capital deepening :Total economy 0.08 -0.45 5. TFP : Total economy 0.79 0.13 5a: ICT producing industries 0.36 0.24 5b: ICT using industries 0.83 0.02 -ICT using manufacturing 0.06 0.00 -Wholesale trade 0.31 -0.02 -Retail trade 0.28 -0.03 -Financial services 0.27 0.06 -Business services -0.10 0.01 5c: Less Intensive ICT using industries -0.40 -0.13 Note: In terms of non-ICT capital deepening in WT and RT, only small differences exist between the US and the EU-4 (D, F, NL, UK). Source: Inklaar et al (2003).
Table 3 : Productivity in the US wholesale trade (WT) industry
1988-1995 1995-2000
Productivity
Growth Rate (%)
Share of Total Output in WT
Contrib. to Prod’y
Growth Rate
Productivity Growth Rate
(%)
Share of Total Output in WT
Contrib. to Prod’y
Growth Rate
Difference in Contribution
(1995-2000 vs. 1988-1995)
Total Wholesale 3.04 1.00 3.04 4.03 1.00 4.03 0.99
Durables 4.84 0.46 2.24 5.94 0.48 2.86 0.62 Non Durables 0.32 0.42 0.13 0.75 0.38 0.29 0.15 Electronic Markets 4.70 0.12 0.57 6.17 0.14 0.84 0.27
Durables decomposition Motor Vehicles 2.21 0.11 0.23 3.92 0.11 0.44 0.21 Furniture 3.33 0.02 0.05 1.72 0.02 0.03 -0.03 Construction -2.11 0.02 -0.05 -0.36 0.02 -0.01 0.04 Equipment 13.08 0.07 0.97 13.78 0.08 1.13 0.15 Metals -0.31 0.05 -0.02 -0.41 0.04 -0.02 0.00 Electrical & Electronic 8.81 0.06 0.50 12.98 0.07 0.93 0.43
Hardware 2.70 0.02 0.04 2.50 0.02 0.04 0.00 Machinery 2.75 0.08 0.22 2.97 0.08 0.24 0.02 Miscellaneous 2.43 0.04 0.09 3.24 0.04 0.13 0.04 Note: The productivity measure is real output divided by total hours.
Source: BLS.

17
Results from the growth accounting approach. Growth accounting exercises on the other hand attribute a sizeable fraction (i.e. about half) of the productivity acceleration to the use of ICT. Recent exercises10 for the USA estimate that ICT investment has contributed about 0.5 percentage points to US productivity growth, with ICT production contributing another 0.5 percentage points. Other studies, such as Inklaar et al. (2003), suggest a 0.24 percentage point contribution from ICT production and a 0.19 percentage point contribution from ICT investment for an EU4 aggregate (see Table 2),11 with higher contributions for the USA (0.40 percentage points for ICT investment and 0.36 percentage points for ICT production).
As the Inklaar results in Table 2 show, the absolute difference between the USA and the EU in terms of ICT capital deepening is largely due to one specific industry, namely financial services (FS). If one excludes the FS industry, it is striking that the contribution of ICT capital deepening to the change in labour productivity growth (i.e. ICT diffusion in a narrow sense) has been remarkably similar on both sides of the Atlantic. These figures suggest that the EU is catching up with the USA in terms of the usage/diffusion of ICT in the narrow sense of the term (i.e. in terms of the actual purchases of ICT investment goods and services by the different industries).
However, what Table 2 also shows is that there are big differences between the EU and the USA in terms of the spillover effects from these investments. For example, while the EU and the USA wholesale trade (WT) and retail trade (RT) industries have both made similar gains in terms of ICT capital deepening, the USA appears to have reaped substantially more from the use of this capital in the form of much higher TFP gains (i.e. ICT diffusion in the broader sense). It must be emphasised however that these TFP gains occur in a very narrow segment of the services sector where productivity is difficult to measure. In other better measured areas such as ICT using manufacturing, Table 2 shows that the relative TFP gains in the USA are significantly smaller.
One can argue that the above analysis provides evidence of positive spillover effects in the USA, i.e. ICT investment is enabling organisational changes in ICT using industries. The fact that the TFP accelerations in ICT using industries are not observed in the EU could be due either to adjustment costs (EU is in an earlier stage of the transition) or it could be the result of institutional/regulatory constraints in specific industries (e.g. land use regulations/opening hours in WT and RT; less entry of new establishments/insufficient competition etc) which prevents firms from reaping the full benefits of the new technology in EU countries.
10 Gordon (2003) quoting an unpublished update to Oliner and
Sichel (2002). 11 The countries are France, Germany, the Netherlands and the
UK.
There are also two counter arguments to the US spillover thesis that should be taken into account: • Gordon (2003), argues that the revival in RT and
WT productivity is due to organisational changes unrelated to the use of ICT.12 Microeconomic evidence provided by Foster et al. (2002) shows that productivity growth is strongly linked with new establishments, whilst existing establishments do not experience a productivity gain. This is despite the massive investment in ICT which presumably went into both old and new establishments (e.g. bar code readers have become universal in all retail stores). Gordon consequently speculates that productivity gains in the newly built “big box” stores may reflect far more than just the use of computers, such as for example size effects, better unloading systems, improved storage facilities etc.
• A second line of argumentation stresses statistical problems with measuring productivity in WT and RT. Volume measures for WT and RT are calculated using the deflators of the products sold by the WT and RT industries.13 This practice could imply that countries where the share of ICT goods sold to firms and private households is large and where quality improvements are fully taken into account in the price measures, may have a larger increase in WT and RT productivity simply because prices in the basket of goods sold are falling more strongly.14 If there has been a genuine productivity acceleration, because of the higher use of ICT in WT and RT, one would expect the productivity gains to be evenly distributed across different WT and RT sub-sectors. If the productivity acceleration can be traced to specific sub-sectors within the RT and WT industries with a relatively large exposure to ICT, there is a higher likelihood that the acceleration could be predominantly due to measurement issues related to ICT.
• For WT one observes (Table 3) that the productivity increases are concentrated in the durables sector,
12 In the case of financial intermediation, it has been argued by
Stiroh (2002), for example, that one should be careful in assuming spillover effects since the productivity effects in financial services have probably been strongly influenced by the stock market bubble.
13 See Ahmad et al. (2004), Triplett and Bosworth (2000). 14 For example, this means that since the volume of computer
sales has increased due to improvements in speed and capacity, a store which sells the same number of computers at the end and at the beginning of the 1990s would record a higher productivity growth rate without any change in the organisation (number of employees and hours worked) of the store. As noted by Triplett and Bosworth, a volume measure for the goods sold by a certain retail sector which combines the increase in quality with the growth in the number of goods, as is the case with hedonically deflated goods, bears little relationship to the actual activities of the store, even though it is the appropriate output measure for that specific good.

18
and within durables in sub-sectors with a high ICT concentration such as commercial equipment and electrical and electronic goods. This desegregation suggests therefore that the productivity acceleration is closely linked to the evolution of IT prices, with this evidence underlining the need for an extremely careful interpretation of growth accounting studies using data on WT services.
• In RT (Table 4), two sub-sectors, electronics and appliance stores and non-store retailers (with a large share of ICT equipment dealers) show high productivity growth rates. However, compared with WT, the productivity acceleration in RT is more widespread across the sub-sectors. It is difficult nevertheless to assess the extent to which the productivity acceleration in RT can be traced to the use of ICT. A recent paper by Sieling et al. (2001) traces the productivity improvements in various retail sectors to two developments, increased concentration in the industry and ICT investment. In 1987, the 50 largest retail firms accounted for 20 per cent of all sales but by 1997 that proportion had grown to 26 per cent. In the case of department stores, labour productivity growth partly reflects shifts away from conventional stores to discount or mass merchandising department stores. In 1987 the latter had a market share of 43 per cent which increased significantly to 63 per cent in 1997. With such a shift, productivity gains arise naturally because the latter are to a large extent self-service stores.15
Overall assessment of ICT’s contribution to productivity growth. Regarding the international/US regional comparison approach, the results on ICT production/diffusion effects suggest that ICT production rather than ICT-use is the dominant source of productivity growth and that the evidence of extraordinary spillover effects associated with ICT investment is still somewhat questionable. Given the EU’s relatively small ICT producing sector, especially on the manufacturing side, this raises important questions as to why the EU has failed to allocate sufficient resources to ICT production.
15 The composition effect is especially visible with food
stores. Grocery stores are by far the largest group within the food stores area. Here superstores and hypermarkets are replacing conventional grocery stores. In 1988 conventional grocery stores accounted for 43 per cent of all consumer expenditures for food at home; by 1998, that proportion had fallen to 13 per cent. The productivity improvements with car dealers can probably be traced to the increased use of computer diagnostic equipment. Productivity growth amongst the non-store retailers (catalogue and mail order houses) was increased by online sales. Based on annual retail trade data by the Census Bureau, E-commerce sales accounted for 0.5 per cent of total retail sales in 1999, with 77 per cent of these sales occurring in the non-store retailer industry group.
Regarding the results from growth accounting studies and in particular the gains from ICT diffusion, a closer look at the productivity growth acceleration in the WT and RT industries in the USA, which is commonly used as evidence in favour of positive TFP effects, also casts doubt on the robustness of the ICT investment/productivity link. One should bear in mind that the recent growth accounting studies do not attribute the productivity growth acceleration in the USA relative to the EU to different speeds of ICT investment (i.e. ICT diffusion in a narrow sense) but to an increase in TFP in these industries (ICT diffusion in a broad sense). In WT, the measurement effect could explain a substantial part of the TFP acceleration in this industry.16
In RT, while the effects are more dispersed, there are other factors beyond ICT which could account for the TFP acceleration in the USA, such as larger store size, the increased share of self service markets and the greater entry of new establishments. It is difficult however to establish a clear causal ordering amongst these latter factors.
Finally, the above discussion on ICT diffusion effects must not be seen as contradicting the correct belief that ICT spillover effects are making a positive contribution to labour productivity growth, or that these gains may be larger in the USA than in the EU because of institutional/regulatory constraints in a number of the EU’s Member States. It simply suggests that the US benefits are presently not as high as some commentators estimate when one correctly accounts for non-ICT drivers of productivity change and measurement issues. ICT diffusion in the narrow sense of ICT capital deepening is clearly contributing strongly to productivity growth, whereas the evidence for ICT diffusion in the broader sense of large TFP gains in specific ICT-using industries is still open to some debate. While it is undeniable that given the pervasiveness of ICT in developed economies that there are TFP gains related to the use of this general purpose technology, the present section has simply questioned the spectacular nature of those gains in a small number of US service industries.
16 It is important to keep in mind that the mis-measurement of
productivity in the US WT and RT industries is not translated onto the aggregate level. The combined productivity improvement in ICT production plus ICT diffusion is measured correctly, it is only the distribution of the productivity gains across production and diffusion which is questionable. In this context, the present analysis suggests that the contribution from the ICT production side to the acceleration in US labour productivity growth has been underestimated in a lot of the most recent growth accounting studies. In other words while the size of the EU-US productivity growth gap is still the same, less of this gap is due to the US’s performance in ICT-using industries such as WT and RT and more of it is located in semiconductors and other ICT-producing industries.

19
Table 4 : Productivity in the US retail trade (RT) Industry 1988-1995 1995-2000
Productivity Growth
Rate (%)
Share of Total Output
in RT
Contrib. to Prod’y
Growth Rate of RT
Productivity Growth
Rate (%)
Share of Total Output
in RT
Contrib. to Prod’y Growth
Rate of RT
Difference in Contribution (1995-2000 vs. 1988-
1995)
Total Retail 1.91 1.00 1.91 3.79 1.00 3.79 1.88 Motor Vehicles 1.15 0.25 0.28 1.74 0.26 0.46 0.18
Furniture 3.06 0.03 0.10 3.84 0.03 0.11 0.01 Electronics & Appliances 10.81 0.02 0.25 15.46 0.03 0.44 0.19
Building Materials 1.98 0.09 0.18 3.45 0.09 0.30 0.12
Food & Beverages -0.86 0.20 -0.17 1.56 0.17 0.26 0.44
Health / Personal Care
0.74 0.04 0.03 3.61 0.05 0.16 0.13
Petrol 2.16 0.08 0.17 2.76 0.08 0.22 0.05 Clothing 4.21 0.06 0.27 4.62 0.06 0.26 0.00 Sports / Hobbies 2.80 0.02 0.07 5.66 0.03 0.15 0.08
General Merchandise 3.18 0.12 0.39 4.96 0.13 0.65 0.26
Misc Retailers 3.62 0.03 0.10 3.26 0.03 0.11 0.01
Non-Store Retailers 6.52 0.04 0.27 10.26 0.05 0.51 0.24
Note: The productivity measure is real output divided by total hours.
Source: BLS.
4. Enhancing the EU’s productivity
performance
The analysis in Section 3 on the contribution to overall productivity growth from ICT production/ICT use has indicated a more general theme, namely the importance to the EU’s future productivity performance of an ongoing process of structural change aimed at boosting the production and absorption of new, more knowledge intensive, technologies. The relative success of this whole process hinges ultimately on the extent to which the Lisbon Strategy’s objective of creating a more knowledge-driven economic model is realised over the coming years and decades and in particular on the ability of governments to create an environment in which the EU’s innovation infrastructure can generate the new skills, ideas and products needed to compete successfully in the global marketplace.
4.1 The knowledge economy must be a central element
With the striking impact of ICT, there has been considerable interest in analysing the effects of investments in knowledge and human capital formation.
The empirical growth literature emphasises knowledge and the creation of knowledge via the investment activities of firms, households and the government in both R&D and education as significant drivers for enhancing the level of technology (total factor productivity). Last years EU ECONOMY REVIEW indicated the relative potency of knowledge investments (R&D and education) in determining long run productivity growth rates, with a simulation indicating that a combination of regulatory reform and a substantial increase in EU knowledge production could boost EU potential growth rates by between ½ to ¾ of a percentage point annually over a 5-10 year horizon. Investment in education, training and lifelong learning are thus essential to the Union’s international competitiveness in knowledge-intensive, innovation sectors, and to sustainable growth and employment. Regarding the USA, the knowledge based economy would appear to be more fully entrenched, with Graph 12 suggesting that investments in R&D and education can explain nearly 75 per cent of the US productivity growth rate over the period 1950-2003 and with the more recent decades accelerating its dependence on more knowledge intensive forms of investment, such as ICT. According to Jones (2002), the

20
US’s average labour productivity growth rate of 2-2¼ per cent over this period could only have been generated via a permanent shift of resources into knowledge production activities and that without such investments US labour productivity growth would have averaged only 1/3 of a percentage point over this period. In other words, over the longer run, these knowledge investments are the key drivers of productivity growth in advanced economies and our future standards of living depend crucially on them.
Graph 12: Determinants of US labour productivity growth (1950-2003)
R&D EducationPopulation Growth Physical Investments
Source: Commission services and Jones (2002).17
ICT is a striking example of the importance of knowledge investments. As shown in Section 3, specific knowledge intensive sectors such as ICT are now crucial to the overall productivity performances of individual countries. ICT in fact is a very good example of the growth in importance of more knowledge intensive forms of investment, with its share of total investment growing steadily over the last 15-20 years, having now reached 1/3 of overall non-residential gross fixed capital formation in the USA. Within the ICT sector, specific
17 The contributions to productivity growth in the Jones
analysis are calculated by multiplying historical changes (from 1950 to 2003) of R&D, education and capital shares with their respective output elasticities. The relatively small contribution of physical capital to growth is due to the fact that unlike the shares of R&D and educational attainment, the share of physical capital has not changed much over the last 50 years. This is typical of a country (such as the USA) at the technology frontier, with steady state physical investment levels. For countries however in the “catching-up” phase of their economic development the productivity contribution attributed to physical investments would be substantially larger. The contribution of population to productivity growth in the Jones analysis comes from an increasing returns to scale effect in production. The basic point of the graph is that since the EU-15 is now close to the technology frontier, any additional productivity gains over the coming decades are more likely to be generated from a boost to knowledge investments rather than from changes to our present physical investment to GDP ratio.
industries such as semiconductors now have overall knowledge investment budgets which are equal in size to their spending on physical investments such as plant and machinery and buildings. Furthermore ICT investment itself has not only a larger than average “knowledge” content, in the form of the software and R&D spending needed to generate it, but has an additional knowledge element in that it is also complementary to skilled labour.
Given ICT’s status as a high productivity growth industry and at the same time its potential as a “general purpose technology”, inciting productivity growth in ICT-using industries, it should be a concern to policy makers that the USA has established, and is retaining, a large global advantage in this pivotal industry. How have the Americans achieved such a dominant position and why have other industrialized countries failed so far to catch up to the technology frontier? With the USA continuing to reap enormous gains from its dominance of the global ICT industry, Europe should be looking at those factors which have allowed this industry to flourish in the USA. Box 1 explores the mix between knowledge investment, government support and market structure that lay behind the USA’s success in the ICT area and some of the historical reasons why Europe stayed behind.
4.2 The USA has a superior innovation model An important question arising from the analysis in Box 1 is the extent to which the example of ICT will be replicated in future high tech industries. If this is a credible risk then the key issue is whether the EU has specific problems in relation to its innovation infrastructure (i.e. in terms of the resources devoted to innovation, the linkages between the various actors in the system etc) and whether the USA has specific features/framework conditions which make it more likely to be the location of any future breakthroughs in technology. This is a pertinent question if one accepts the contention of Gordon (2004), amongst others, that the USA’s lead in ICT is not an isolated case. The USA holds a comparative or absolute advantage not only in computer hardware, but more broadly in software and in other general purpose technologies, like its initial leadership in the electricity industry and in its exploitation of the internal combustion engine (Gordon 2004). While some comfort can be taken from the EU’s ability in the past to catch up with the USA in the latter technologies, this did not occur without a large restructuring and refocusing of EU industry. In addition, the wider issue is why is it that the USA seems to be systematically better in creating and exploiting new (general purpose) technologies? This requires broadening the discussion beyond ICT to consider why the USA seems to have a better innovation capacity than the EU.
National innovation systems and national innovation capacity. While traditional growth theories explain

21
differences in growth by the expansion in inputs, such as capital and labour, and by the catching-up of countries with lower productivity, modern theories emphasize research inputs and human capital as the key drivers for long-run growth. They stress not only the importance of “own” innovation but also the capacity to imitate and to absorb externally available know-how. Institutional factors and framework conditions are seen as an important part of the “innovative system” in which innovative firms operate.
Using the macroeconomic insights from neo-classical and endogeneous growth theory, as well as the ideas from the literature on “National Innovation Systems”, applied economic theorists have synthesized what determines an economy’s “national innovation capacity” defined as the ability of a nation to not only produce new ideas but also to commercialize a flow of innovative technologies over the longer term.18 From this perspective a range of factors are deemed to be important for an effective innovation effort:
• Overall innovation infrastructure. A sufficiently developed ‘supply’ side of R&D (as reflected in the amount of R&D carried out or the number of skilled researchers) is a necessary but insufficient condition for successful innovation.
• Essential framework conditions/flanking policies. Broader framework conditions are important as well, including a sufficient ‘demand’ for innovation to reward successful innovators. This requires sophisticated lead users willing to pay for innovations, effective intellectual property rights (IPR) schemes, a favourable macro-economic environment and effective competition in output markets.
• Interconnectedness of the overall innovation system. Perhaps the most critical element in the framework is the interconnectedness of the agents in the system, linking the common innovation infrastructure to specific technology clusters. Through networking amongst firms, researchers and governments, the supply of new ideas diffuses throughout the economy. This requires good industry-science links and well functioning capital and labour markets, such that the human and financial capital inputs get allocated to their most efficient applications.
4.2.1 Overview of innovation infrastructures in the EU and the USA
The basic differences in the overall innovation infrastructures of the EU and the USA can be summarised as follows.
18 See, for example, Furman, Porter and Stern (2000).
• Human resources. The USA invests a far larger share of GDP in higher education than the EU (2.7 per cent compared to 1.1 per cent, with a large proportion of the increase accounted by the private sector). The USA employs nearly 300000 more researchers compared with the EU, with the vast majority of the overall total (over 80 per cent) employed in the business sector, compared with less than 50 per cent in the EU.
• Basic R&D expenditure differences at the economy-wide level. A persistent and growing differential exists in the amount of resources devoted to R&D in the EU and the USA both in terms of the overall research intensity of the respective economies (1.9 per cent versus 2.8 per cent of GDP) and in absolute amounts. To put the respective research efforts into context, the absolute gap in the volume of research is roughly $110 billion. If one widens the definition of the knowledge economy to also include expenditure on the higher education sector, the USA is investing well over $200 billion more annually on its knowledge economy compared with the EU.
• Basic R&D expenditure differences at the sectoral level. Compared with the EU, a much larger share of US R&D is carried out by the business as opposed to the government sector. Within the business sector the USA spends substantially more on services compared with the EU, especially in the “Computer and Related Activities” area. Of the total US R&D effort, roughly 1/3 is devoted to services and 2/3 to manufacturing. Regarding the EU, its research efforts continue to be overwhelmingly focussed on the manufacturing sector which presently accounts for around 85 per cent of its overall business sector R&D spending.
• Basic R&D expenditure differences at the industry level (technology specific R&D). Since no reliable comparative figures exist for a breakdown of service sector R&D activities, the industry level comparison is restricted to the manufacturing sector. Of the 27 industries which make up the manufacturing sector in the present study (see Graph 8), only 8 can be regarded as having an above average R&D intensity and therefore classified as high technology industries. The details regarding these 8 industries and their aggregation into the two categories of ICT and non-ICT is given in Tables 5 and 6 below, with some supplementary information given in Graph 13.
22
Table 5: Shares of some specific R&D intensive manufacturing industries in the total R&D spending of the manufacturing sector (period average 1996-1999)
EU USA
% Share of total Manufacturing R&D
Actual Expenditure (Current PPP$)
% Share of total Manufacturing R&D
Actual Expenditure (Current PPP$)
1. Chemicals 17.4 13583 9.2 11307 2. Mechanical engineering 6.8 5314 2.8 3441 3. Office machinery 2.4 1858 6.3 7739 4. Electrical Machinery 3.0 2338 1.9 2384 5. Semiconductors / Communications
10.6 8307 9.0 11067
6. Instruments 4.3 3331 6.9 8502 7. Motor vehicles 12.9 10039 7.3 8985 8. Aircraft and spacecraft 6.7 5225 7.0 8646 Total High-Technology Industries
64.1 49995 50.6 62072
Total Manufacturing 100 78048 100 122717
Source: OECD Anberd Databank.
Table 6: Splitting high-technology manufacturing R&D spending into ICT and non-ICT
EU
Actual Expenditure (Current PPP$)
USA Actual Expenditure
(Current PPP$)
Specialisation Gap Indicator for R&D Spending
EU-USA* 1991-95 1996-99 1991-95 1996-99 1991-95 1996-99
Total High Technology 44488 49995 52033 62072 0.855 0.805
ICT 11849 13496 20125 27308 0.589 0.494 Non- ICT 32639 36500 31918 34764 1.023 1.050
Note: * This gap is calculated by dividing the EU figure with that of the USA, with a value of less than 1 indicating that the USA’s R&D expenditure is relatively more concentrated / specialised in a particular sector or industry, with a value in excess of 1 showing the same for the EU. A value of around 1 suggests broad balance.
Source: Commission services.
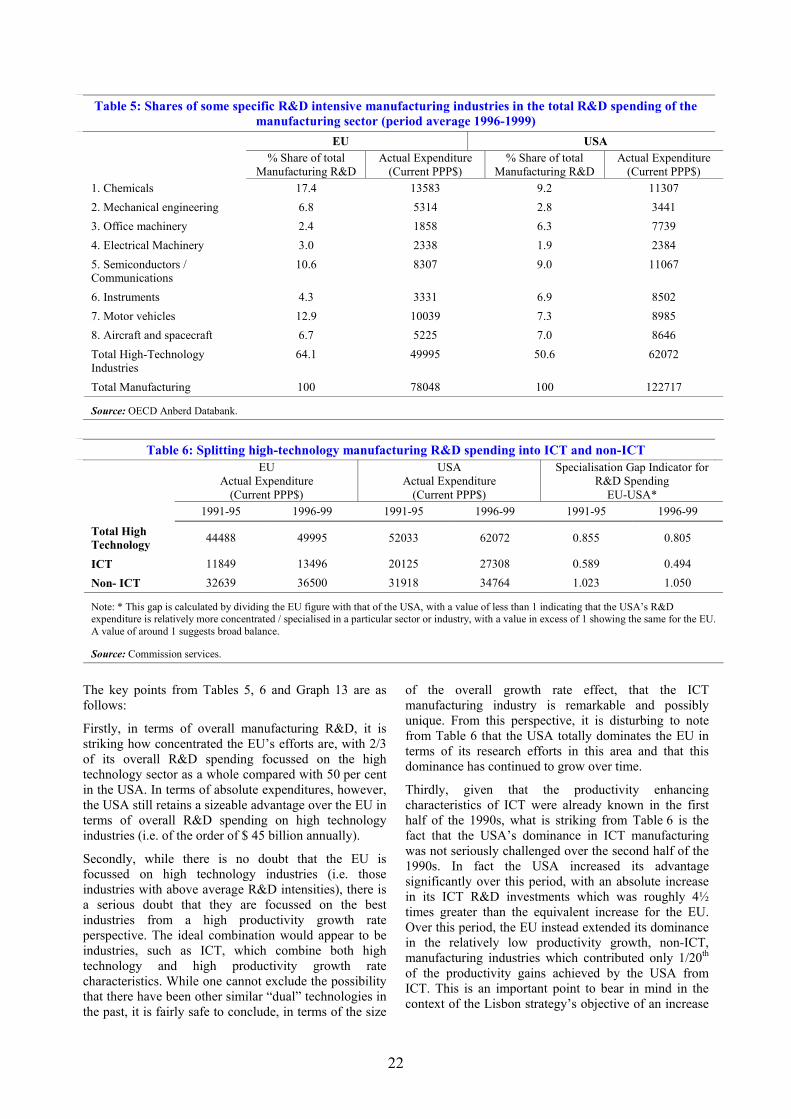
The key points from Tables 5, 6 and Graph 13 are as follows:
Firstly, in terms of overall manufacturing R&D, it is striking how concentrated the EU’s efforts are, with 2/3 of its overall R&D spending focussed on the high technology sector as a whole compared with 50 per cent in the USA. In terms of absolute expenditures, however, the USA still retains a sizeable advantage over the EU in terms of overall R&D spending on high technology industries (i.e. of the order of $ 45 billion annually).
Secondly, while there is no doubt that the EU is focussed on high technology industries (i.e. those industries with above average R&D intensities), there is a serious doubt that they are focussed on the best industries from a high productivity growth rate perspective. The ideal combination would appear to be industries, such as ICT, which combine both high technology and high productivity growth rate characteristics. While one cannot exclude the possibility that there have been other similar “dual” technologies in the past, it is fairly safe to conclude, in terms of the size
of the overall growth rate effect, that the ICT manufacturing industry is remarkable and possibly unique. From this perspective, it is disturbing to note from Table 6 that the USA totally dominates the EU in terms of its research efforts in this area and that this dominance has continued to grow over time.
Thirdly, given that the productivity enhancing characteristics of ICT were already known in the first half of the 1990s, what is striking from Table 6 is the fact that the USA’s dominance in ICT manufacturing was not seriously challenged over the second half of the 1990s. In fact the USA increased its advantage significantly over this period, with an absolute increase in its ICT R&D investments which was roughly 4½ times greater than the equivalent increase for the EU. Over this period, the EU instead extended its dominance in the relatively low productivity growth, non-ICT, manufacturing industries which contributed only 1/20th of the productivity gains achieved by the USA from ICT. This is an important point to bear in mind in the context of the Lisbon strategy’s objective of an increase

23
in the EU’s R&D intensity from 2 per cent to 3 per cent over the coming years. On the basis of the above analysis, if this target had been set in 1990 for attainment in 2000, without any specific sectoral focus, and if the EU continued to invest heavily in the more traditional high technology industries such as cars and chemicals (which it actually did do), it would have gained relatively little in terms of closing the productivity gap with the USA. A sizeable productivity effect from the additional expenditure would have necessitated a shift in focus to the newer, high technology, industries such as ICT.
Finally, Graph 13 confirms the broad trends from Tables 5 and 6, indicating on the basis of the R&D expenditures of the top 300 international firms in each individual sector that while the EU may be dominant in low productivity growth, high technology, industries such as cars and chemicals, the USA is dominant in the high productivity/high technology areas of IT hardware and electronics. This US dominance is already worryingly been extended to software and computer services. Graph 13 further allows one to single out pharmaceuticals and biotechnology from the rest of the chemicals sector. It is again a source of concern to see in the pharma/biotech part that the USA is leading in terms of R&D expenditures. Within the chemicals sector, an area of traditional strength for the EU, pharma/biotech is arguably the key productivity growth component for the future.
The most significant issue posed by the above analysis is not so much the differences in the amounts of resources devoted to the knowledge production sector, but the EU’s systemic failure to refocus its R&D activities over the 1990s, firstly on established high productivity growth industries such as ICT, and secondly on potentially high productivity growth industries in the pharma/biotech area and in a number of service industries (software and computer related services).
Building on the analysis of differences in terms of the innovation infrastructure, an attempt is made in 4.2.2 to assess the extent to which differences in EU-US productivity growth rates can be linked to differences in the innovation capacities of both areas. While this is not possible at the total economy level, a tentative assessment can be made for the manufacturing sector on the basis of the analysis in the present section of R&D spending in this sector. Since this analysis underlined the dominance of the USA’s innovation model, it constitutes a prime candidate for explaining EU-US differences in the productivity growth performances of their respective manufacturing industries.
Graph 13: R&D expenditures by the top 300 international firms by sector: EU 15- USA (2002)
-20 -10 0 10 20 30 40 50
Cars
Pharma + Biotech
IT Hardware +Electronic
Chemicals
Aerospace +Defence
Telecommunications
Software +Computer Services
GAPUSAEU
Source: Commission services.
4.2.2 Can the superiority of the US innovation infrastructure explain EU-US productivity growth differentials in the manufacturing sector?
Beyond the higher expenditures on manufacturing R&D, particularly in the high productivity growth ICT industries, various links can be made at the industry level which can contribute towards explaining the productivity gap through R&D expenditures. In this context, the two key issues are:
• Firstly, has the US economy specialized more in specific high technology industries which are also the high-productivity growth areas – in other words are the EU-US productivity growth differentials linked to industry specialisation?
• Secondly, within each industry, beyond the effect of
differences in spending levels, is the USA getting a higher rate of productivity growth from its R&D spending i.e. a better leverage out of its R&D into productivity growth which can roughly be equated with a higher rate of return on its R&D expenditures.
While the ECFIN analysis of these two issues, and of their role in explaining the link between R&D spending and EU-US productivity growth differentials, is still in its infancy, a number of interesting conclusions are already emerging:

24
Table 7: Contribution to growth in productivity from high technology manufacturing industries (% Points)* EU USA Specialisation Gap Indicator *
1991-1995 1996-2000 1991-1995 1996-2000 1991-95 1996-00
Total High Technology Manufacturing Sector 0.399 0.352 0.830 0.849 0.48 0.41
- ICT 0.137 0.219 0.603 0.802 0.23 0.27
- Non-ICT 0.262 0.132 0.227 0.047 1.15 2.81
Note: * Calculated by dividing the EU figure by the US figure for the respective periods, with a value of less than 1 indicating that the US’s is relatively more specialised in a particular sector or industry, with a value in excess of 1 showing the same for the EU. A value of around 1 suggests broad balance.
Source: Commission services.
Table 8: Comparison of EU-US differences in R&D rates of return
EU-US Gap in R&D Spending EU-US Gap in Productivity Growth Rates
1991-1995 1996-1999 1991-1995 1996-2000 Total High Technology Manufacturing Sector 0.85 0.81 0.48 0.41
- ICT 0.59 0.49 0.23 0.27 - Non-ICT 1.02 1.05 1.15 2.81
Source: Commission services.
Firstly, as shown earlier in Section 3, there are large EU-US differences in terms of specialisation (i.e. differences in the size of specific industries as a share of total output). Within the overall high technology sector, the USA is especially concentrated/specialized in ICT manufacturing, with nearly 15 per cent of total US manufacturing output coming from these ICT industries compared with only 6 per cent for the EU. In the non-ICT area, there are no differences between the EU and the USA, with the high technology industries representing around 34 per cent of the overall manufacturing output of both areas.
Secondly, since amongst the high technology industries as a whole, it is ICT which has been shown to have the highest opportunity for productivity growth, it is not surprising to find in Table 6 that the US’s specialization in these industries, and their realization of a high productivity performance, is a key factor in explaining overall EU-US productivity growth differences. In fact the ICT industry totally explains the better performance of the US’s manufacturing sector over the 1990s compared with that of the EU’s and it contributes nearly four times more to the US’s, economy-wide, productivity growth rate compared with the equivalent sector in the EU. Not only is the productivity gap substantial, there is no evidence of significant catching-up after 1995.
Thirdly, Table 7 presents evidence of EU-US differences regarding “rates of return” from R&D investments. For specific high-tech manufacturing industries, the gap in productivity growth is considerably higher than the gap in R&D spending, implying a lower rate of return from R&D spending in high-tech industries in the EU compared with the USA.
This is entirely due to the ICT high-technology industries
Overall assessment of the EU’s innovation infrastructure in the high technology manufacturing sector. Taking all the caveats in mind of the basic analysis presented, the evidence for the manufacturing sector supports the importance of differences in the innovation system in explaining diverging EU-US productivity growth rates. Within high-technology industries, the specific role of ICT cannot be ignored. ICT producing industries have the highest productivity growth rates in all of manufacturing (in fact in the total economy). The USA is more specialized in these ICT industries as compared to other high-tech sectors; it has a higher productivity growth rate in these sectors; spends more in total on R&D; and gets a higher rate of return out of its R&D investments. For the non-ICT high-tech industries, the picture is less devastating for the EU, particularly in the second part of the nineties. There is no difference in specialization in these industries, nor a productivity disadvantage. The gap in total expenditures on R&D is also minimal. Unfortunately, however, these industries have far less scope for productivity growth than ICT.
4.3 Reforming the EU’s Innovation Capacity In terms of policy prescriptions, what do the results in 4.2 suggest for the innovation capacity of the EU relative to the USA. While differences in the amount of resources committed are large, it is abundantly clear that in addition to much larger investments in R&D both by the public and the private sector (i.e. the basic innovation infrastructure), there are also other characteristics of the US innovation system which

25
explain its ability to focus on the high productivity growth areas and to gain a higher rate of return from its knowledge investments. It is these latter features which determine its superior overall innovation capacity and which need to be taken into account in assessing the relative effectiveness of both systems. These features relate to the USA’s established capacity to link its common innovation infrastructure to technology specific know-how and the generally more favourable environment for innovation in the USA compared to the EU. Gordon (2004) identifies a better connectedness of science and industry with an openly competitive system of private and public universities and government subsidies to universities through peer-reviewed research grants, which result in a higher quality of the research base. Other important framework conditions present in the USA are the advantage of a large, unified market unencumbered by differences in language, customs and standards; a clearer and stronger US Intellectual Property Rights system; more flexible financial markets, making available venture capital finance to innovating firms; and more flexible labour markets, affecting both internal migration and the international immigration of highly skilled people.
The importance of the above features to an effective innovation process may help in explaining a number of specific worrying trends which have emerged in the EU over the 1990s which are suggestive of the need for a radical overhaul of it’s knowledge creation system. These include the failure in the 1990s, as stressed earlier, to re-orientate its R&D activities towards the new, high technology, ICT industries; the increasing proportion of R&D by EU firms which is being done outside the EU (over 40 per cent); the large and growing brain drain from the EU to the USA on the research side (at present, twice as many EU researchers move to work in the USA compared with the opposite inward flows and, in stock terms, DG Research estimates that roughly 40 per cent of US R&D is carried out by EU-trained scientists); and finally the USA’s rapidly expanding share of internationally mobile R&D expenditures. This latter point is an important new risk factor given the evidence that such flows are increasing rapidly and that the relative quality of third level education systems is a key locational determinant for such mobile R&D flows.19 In overall terms, it is reasonable to conclude that without EU reforms to its innovation system, the present haemorrhaging of R&D spending and of research talent from the Member States is set to continue
19 In this context, it is no accident that the top US regions in
terms of knowledge production owe much of their success to the presence of world class educational establishments such as San Francisco’s Stanford / Berkeley and Boston’s Harvard / MIT. These latter universities have been the key driving forces which have propelled the San Francisco and Boston metropolitan areas respectively into the top two positions in most global knowledge competitiveness, benchmarking, exercises.
and with it a large proportion of the EU’s future productivity potential.
Given the above worrying EU trends, the fact that the USA’s comparative advantage in this area of knowledge production appears to be becoming more entrenched, and that the new knowledge industries are increasingly driving economy-wide productivity trends, the calls for reform at the EU level are becoming more urgent. What can policy makers do to address the EU’s innovation weaknesses? The most important point to stress is that R&D spending is only one of the key elements of a country’s knowledge production system – the present analysis has underlined that it is the overall package of elements which matters. Reforms are particularly needed in terms of entry and exit rules (to allow, for example, new innovative firms to come through the system and challenge the incumbents) and in the overall business environment (to improve the “rates of return” of any additional R&D investments which may be linked to the Lisbon 3 per cent target). This will require getting the framework conditions right; improving the overall interconnectedness of the innovation system; and ensuring that the common innovation inputs are better aligned on specific technology clusters, where the EU’s production structure displays a specialisation.

26
Box 1: History of ICT
The invention of the point contact transistor at AT&T’s Bell Laboratories in the USA in 1947 marked the beginning of a new technology, semiconductors, which has paved the way for the information age. An important feature of this technology is the speed with which microprocessors become more powerful, leading to a widening in the number of ICT applications. Semiconductors were initially used for hearing aids and in mainframe computers. In the 1950s computers largely replaced mechanical calculators. They were seen as being good in performing complicated and lengthy sets of arithmetical operations. The first leading edge applications were military. The Korean War won IBM the first contract to deliver a computer. In the late 1950s and early 1960s computers began to be used for simple calculations in civilian government agencies (e.g. the Census Bureau) and by the human resource departments of large corporations. The next generation of computers was used for storing and releasing data in real time. This was important for airline reservation processing, insurance companies and for inventory control. The computer surpassed the stage where it was only used as a calculator and became an organizing device. In a further step, the invention of the spreadsheet computerized white collar work in the 1980s. But the domain of computer usage has been widening further. Robots in manufacturing and scanner based retailing are transforming production and distribution processes. The internet, which connects computers all over the world, further transforms the way business is conducted.In terms of pure numbers, nominal spending on ICT in the USA rose from about 1 per cent of GDP in the 1960s to about 2 per cent in 1980. The share increased further to 3 per cent in 1990 and has reached about 5 per cent to 6 per cent of GDP in the year 2000. Given the other distinguishing feature of this technology, namely the rapid speed of technical progress in the production of semiconductors, this sector now shows up in the aggregate productivity statistics of those countries which have managed to have a sizeable ICT production sector.The semiconductor and computer industry has been a USA dominated industry since the end of the second World War and the USA has not given away the lead to other countries though they have faced severe challenges, especially from Japan. The ICT industry has some special features which poses specific challenges for government-industry interactions. The most important characteristics are: - The semiconductor/computer industry is the high tech industry par excellence. It undertakes large amounts of knowledge
investment, with R&D shares exceeding hugely the average shares of most other manufacturing industries. - The sunk cost nature of R&D requires careful thinking about competition and industrial policy regarding the best strategy of
combining large R&D efforts with a competitive environment. - The industry also relies on a stream of well educated scientists and engineers as well as on the basic research undertaken in
national research labs and universities. - Since ICT has become a general purpose technology (GPT), with the ability to influence the productivity growth rates of ICT-
using industries, it is also therefore of strategic interest since the products sold by this industry shape process innovations in other manufacturing and service sectors.
How have the Americans achieved such a dominant position and why have other industrialized countries failed to catch up to the technology frontier? What was the mix between knowledge investment, government support and market structure that created the success in the USA and what were the reasons why Europe stayed behind. The history of ICT in the USA, Japan and Europe will at least provide some tentative answers to these questions. In the USA, early computer technology had a distinctly military focus (Brock, 2003). Japan and Europe in contrast tried to reduce the substantial lead of US companies in commercial markets. However both regions pursued rather different strategies. Japanese technology policy was based on a system of cooperation and competition amongst diverse groups of firms. In Europe, all bets were usually placed on a single ‘national champion’, the beneficiary of a steady diet of financial subsidies and preferential procurement policies’ (Flamm, 1987). An important factor in the development of the ICT industry has been the level of knowledge investments. The size of R&D spending and government funding in IT shows marked differences between countries. In the early 1970s, total R&D spending in the USA’s computer industry was about 5 to 6 times larger than the combined efforts in Japan, France and the UK (Flamm, 1987). In the 1960s and early 1970s about 1/3 of all R&D spending in the USA was publicly financed, while the French and UK share ranged between 10 per cent and 15 per cent. The Japanese share of public funding was in between. Thus in contrast to the popular view which saw the USA as the least interventionist amongst the major industrial countries, it must be acknowledged that the USA was strongly supporting industrial investment in technology directly in the formative years of the ICT industry.
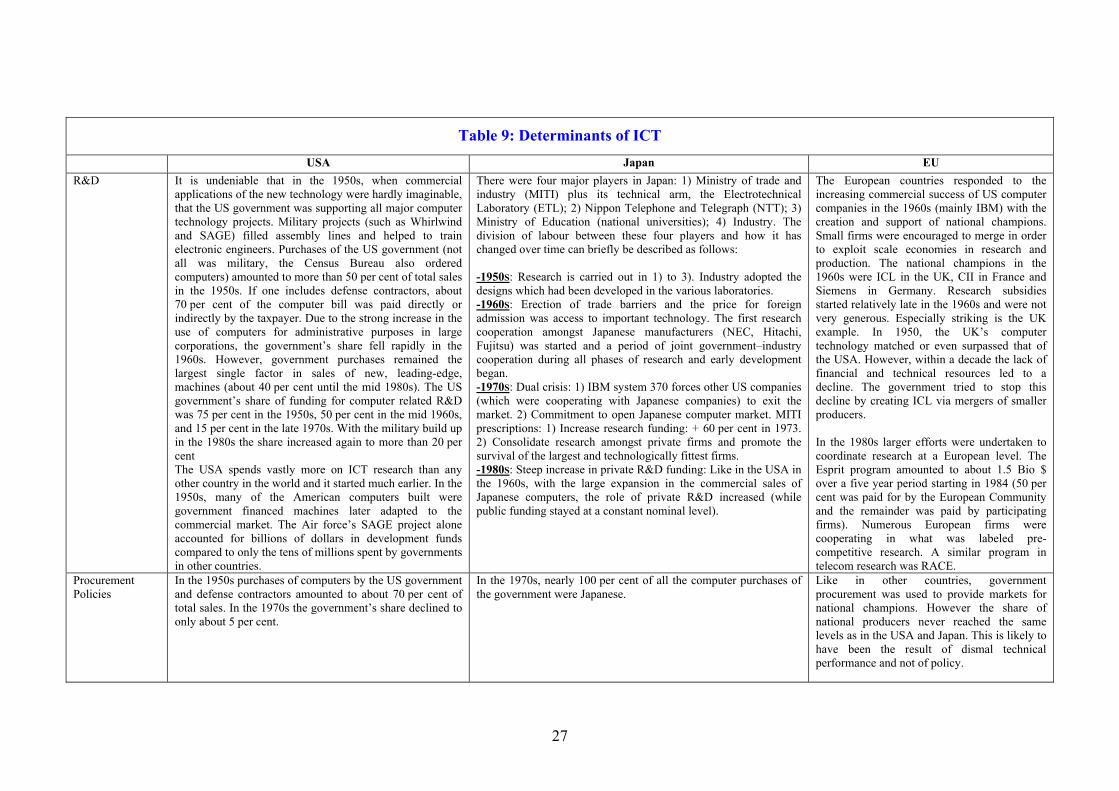
27
Table 9: Determinants of ICT
USA Japan EU R&D It is undeniable that in the 1950s, when commercial
applications of the new technology were hardly imaginable, that the US government was supporting all major computer technology projects. Military projects (such as Whirlwind and SAGE) filled assembly lines and helped to train electronic engineers. Purchases of the US government (not all was military, the Census Bureau also ordered computers) amounted to more than 50 per cent of total sales in the 1950s. If one includes defense contractors, about 70 per cent of the computer bill was paid directly or indirectly by the taxpayer. Due to the strong increase in the use of computers for administrative purposes in large corporations, the government’s share fell rapidly in the 1960s. However, government purchases remained the largest single factor in sales of new, leading-edge, machines (about 40 per cent until the mid 1980s). The US government’s share of funding for computer related R&D was 75 per cent in the 1950s, 50 per cent in the mid 1960s, and 15 per cent in the late 1970s. With the military build up in the 1980s the share increased again to more than 20 per cent The USA spends vastly more on ICT research than any other country in the world and it started much earlier. In the 1950s, many of the American computers built were government financed machines later adapted to the commercial market. The Air force’s SAGE project alone accounted for billions of dollars in development funds compared to only the tens of millions spent by governments in other countries.
There were four major players in Japan: 1) Ministry of trade and industry (MITI) plus its technical arm, the Electrotechnical Laboratory (ETL); 2) Nippon Telephone and Telegraph (NTT); 3) Ministry of Education (national universities); 4) Industry. The division of labour between these four players and how it has changed over time can briefly be described as follows: -1950S: Research is carried out in 1) to 3). Industry adopted the designs which had been developed in the various laboratories. -1960S: Erection of trade barriers and the price for foreign admission was access to important technology. The first research cooperation amongst Japanese manufacturers (NEC, Hitachi, Fujitsu) was started and a period of joint government–industry cooperation during all phases of research and early development began. -1970S: Dual crisis: 1) IBM system 370 forces other US companies (which were cooperating with Japanese companies) to exit the market. 2) Commitment to open Japanese computer market. MITI prescriptions: 1) Increase research funding: + 60 per cent in 1973. 2) Consolidate research amongst private firms and promote the survival of the largest and technologically fittest firms. -1980S: Steep increase in private R&D funding: Like in the USA in the 1960s, with the large expansion in the commercial sales of Japanese computers, the role of private R&D increased (while public funding stayed at a constant nominal level).
The European countries responded to the increasing commercial success of US computer companies in the 1960s (mainly IBM) with the creation and support of national champions. Small firms were encouraged to merge in order to exploit scale economies in research and production. The national champions in the 1960s were ICL in the UK, CII in France and Siemens in Germany. Research subsidies started relatively late in the 1960s and were not very generous. Especially striking is the UK example. In 1950, the UK’s computer technology matched or even surpassed that of the USA. However, within a decade the lack of financial and technical resources led to a decline. The government tried to stop this decline by creating ICL via mergers of smaller producers. In the 1980s larger efforts were undertaken to coordinate research at a European level. The Esprit program amounted to about 1.5 Bio $ over a five year period starting in 1984 (50 per cent was paid for by the European Community and the remainder was paid by participating firms). Numerous European firms were cooperating in what was labeled pre-competitive research. A similar program in telecom research was RACE.
Procurement Policies
In the 1950s purchases of computers by the US government and defense contractors amounted to about 70 per cent of total sales. In the 1970s the government’s share declined to only about 5 per cent.
In the 1970s, nearly 100 per cent of all the computer purchases of the government were Japanese.
Like in other countries, government procurement was used to provide markets for national champions. However the share of national producers never reached the same levels as in the USA and Japan. This is likely to have been the result of dismal technical performance and not of policy.

28
USA Japan EU Market Structure Vigorous antitrust suits instituted during the 1950s played
some role in the rapid diffusion of semiconductor and computer technology from Bell Telephone Laboratories and IBM. Entry and exit into the market played a big role in adapting technologies for commercial use. In the early 1970s, the top 5 companies were IBM, Texas Instruments, Motorola, Western Electric and Fairchild. None of them was a leader in the 1950s. Top ranked companies in the 1990s such as Microsoft and Intel were not around in the 1970s. However, the US government has also responded to foreign competition by allowing for more cooperation amongst US companies in R&D. In 1984 the Joint research and Development Act was passed by Congress, which encouraged firms to undertake cooperative research (this was likely to have been provoked by Japan’s 5th Generation Computer Research Program in 1981). Furthermore, in response to a loss in the USA’s market share in the semiconductor industry (The Japanese market share exceeded that of the USA for the first time in 1986), SEMATECH, a joint research effort of the semiconductor industry, was initiated and supported by the US government. The defense department contributed about 100 Mio $ per year, about 50 per cent of the total budget (the project was expected to end in 1997). Reflecting concerns about the national security implications of dependence on foreign sources for the supply of semiconductors, its goal was mainly to improve US semiconductor production technology. That the US government regarded SEMATECH as a national project can also be seen by the total entry restrictions for the US affiliates of foreign companies. The USA also emphasizes industry-university research centers. They have been initiated by the government but also by private companies. (Flamm 1987)
Joint research (in order to avoid duplication and increase productivity) but competition in downstream applications and commercialization e.g. in the 1970s the three groups of Japanese computer producers (Fujitsu-Hitachi, Mitsubishi-Oki and NEC-Toshiba) shared development costs but remained in direct competition. MITI coordinated the research cooperation. The government also carefully controlled access to the Japanese market, with MITI attempting to induce US producers to transfer computer technology to Japanese manufacturers.
Because the national champions model was adopted early on, antitrust was not an important issue in the computer industry.

29
5. Summary of key findings
Stuctural nature of the EU’s productivity downturn is confirmed. The overriding conclusion from the analysis in this chapter is that the former EU-15 group of countries have a structural productivity problem, with this problem mainly located in the four large euro-area Member States which presently account for close to 80 per cent of the euro area’s overall output (2/3 of EU-15). This interpretation of recent productivity trends differs from that of respected commentators such as Olivier Blanchard and the IMF which suggest that the present productivity downturn is temporary, linked to the substantial labour market reforms enacted in many of the EU’s Member States throughout the 1990s. In our view these reforms can only explain a small proportion of the deterioration in EU productivity since 1995, with the bulk of the decline due to the EU’s outdated and inflexible industrial structure which has been slow to adapt to the intensifying pressures of globalisation and rapid technological change. The EU’s productivity problems reflect the combined effect of an excessive focus on low and medium-technology industries (with declining productivity growth rates and a globalisation-induced contraction in investment levels); an inability to seriously challenge the USA’s dominance in large areas of the ICT industry, as reflected in the relatively small size of its ICT production industry; and finally, its apparent slowness in reaping the productivity enhancing benefits of ICT in a range of ICT-using industries, although measurement issues severely complicate an assessment of the gains from ICT diffusion.20 The chapter also points to the worrying evidence that the USA is extending its dominance in ICT production to a range of new, high technology, areas in pharmaceuticals, biotechnology and computer-related services.
The Post-1995 Differences in EU-US productivity patterns are fundamentally driven by the USA’s superiority in terms of its capacity to produce and absorb new technologies, most notably in the case of ICT. The contrasting productivity experiences of the EU and the USA over the post 1995 period have their origin in the knowledge production sectors of the EU and US economies and in a complex range of institutional
20 The paper stresses the need for a critical assessment of the
respective roles of ICT production and ICT diffusion in explaining EU-USA productivity growth differentials. It suggests that due to measurement issues a higher proportion of the post-1995 acceleration in US productivity should be linked with the production of ICT than is commonly assumed. In terms of diffusion, it stresses that ICT capital deepening (diffusion in the narrow sense) is contributing strongly to US productivity growth but that the evidence for large TFP gains in specific ICT-using industries (diffusion in the broader sense), such as wholesale and retail trade, was still questionable. These latter gains are perhaps more modest when proper account is taken of measurement issues and of the role of a number of important non-ICT productivity drivers in these specific industries.
factors and framework conditions which determine a country’s overall innovation system and ultimately its success in producing and absorbing the latest, leading edge, technologies. The chapter argues strongly that healthy knowledge production and absorption processes are mutually supportive elements of any successful long run productivity strategy. Evidence is presented which suggests that the USA’s overall innovation system is superior to that of the EU’s, both in terms of the quality and funding of its knowledge sector and the more favourable framework conditions prevailing. This system has facilitated a substantial re-structuring of the US economy since the early 1990s towards a range of knowledge intensive, high productivity, growth industries which have compensated for the relatively poor productivity performance of its more traditional industries. The inadequacies of the EU’s overall innovation system have, in contrast, been cruelly exposed over the same period. Despite the growing evidence of the importance of high productivity growth industries such as ICT, the EU continued to focus its R&D investments throughout the 1990s on relatively low productivity growth areas such as cars and chemicals. The repeated ability of the US innovation system to direct resources towards the newer, high technology (and often high productivity growth), industries is a reflection of the quality of the interrelationships between the different actors in its innovation system and of an economic and regulatory framework which has the capacity to transform excellence in knowledge creation into a globally competitive industrial structure.
The systemic inadequacies of the EU’s innovation system are highlighted by the experience of the ICT industry, with the history of this industry suggesting that a “national champions” strategy in high technology industries is highly problematic. The systemic nature of the EU’s productivity problems is highlighted by an analysis of the ICT industry, where a wide range of factors are shown to have contributed to the USA’s global dominance. These factors include focussed R&D activities; world class research and teaching establishments; defense procurement contracts which nurtured the ICT industry (on the demand side) in its incubation phase in the 1950s and 1960s; and the unique combination of financing mechanisms and a highly competitive domestic marketplace which brought the ICT industry from the knowledge creation phase to the critical diffusion/mass market phase. The history of the ICT industry also suggests that a “national champions” strategy in high technology industries is doomed to failure, with a number of interesting questions emerging from the analysis as to the type of optimal competition policy which should be pursued for high technology industries. The chapter highlights in particular the large price which Europe has paid for its “national champions” policy in the ICT industry back in the 1960s and 1970s, which contrasted sharply with the strategies adopted by Japan and the USA. In addition, if one looks to the future, and given the changes which have

30
occurred over recent decades, it is safe to conclude that the case for such a “national champions” policy is becoming more and more tenuous as the new industries of the future will increasingly need to draw on an EU, or even a global, knowledge/talent pool.
Policy conclusions In terms of policy, the chapter stresses that the EU’s innovation system needs to be fundamentally reformed if the EU is to make a decisive shift towards realising the vision of a successful innovation-based, economic model, the broad features of which have been laid out in the Lisbon 2010 agenda. Lisbon is in effect a recognition of the importance of such a model to the EU’s long run economic prospects and of the key role which it must play in responding to the challenges of globalisation and ageing. Creating a successful knowledge-based economy involves both enhancing the EU’s capacity to produce and commercialize a flow of world class innovative technologies and creating an environment conducive to the imitation and absorption of externally available know-how. The success of such a model will be determined not so much by a massive increase in the amount of financial resources devoted to knowledge production (i.e. increased spending on R&D and higher education) but by an acceptance of the need to improve linkages in the innovation system and to make painful changes in many areas of the EU’s economic and regulatory environment. More specifically the present study stresses the following:
The systemic nature of the innovation process needs to be recognised and the quality of the interrelationships between the different actors in the system needs to be dramatically improved. Policy makers need to recognise that the different players in the innovation system, public research institutes; third level education establishments; SME’s and large firms are not isolated players but are part of a complex system, with its overall strength driven by the relative efficiency of its different components. While a large number of specific problems can be highlighted in relation to the specific players, the most serious issue is the poor quality of the linkages within the overall system In addressing this issue of linkages and of the wider problem of an underperforming EU research sector, some politically sensitive areas will need to be examined at the national and EU levels i.e. the principle of an excellence/meritocratic based system for awarding research funds; greater university autonomy, in financial as well as academic terms; a change of culture towards the commercialisation of research via closer university/business sector links; and the need to develop and nurture centres of excellence and leading edge technology clusters.
The public and private sectors each play important, mutually supportive, roles in determining a country’s innovation capacity and each must assume its responsibilities. Governments have crucial direct and indirect roles to play in the innovation process, directly
in the form of financial support for human capital development21 and for the public innovation system and, more importantly, indirectly in terms of shaping the macroeconomic fundamentals (low and stable inflation; moderate tax burdens on labour and capital; trade openness) and providing adequate framework conditions for the private sector to enhance productivity via well functioning product, labour and capital markets.22 The private sector for its part is the ultimate source of productivity growth in an economy, with its overall performance determined by the success of the public sector’s policies in creating a competitive, dynamic, business environment and by its own ability to use its labour and capital resources to create an industrial structure capable of competing successfully in both the domestic and global marketplaces.
Industry-specific framework conditions need to be taken into account due to the complicated relationship between competition and innovation. While competition is a crucial determinant of productivity growth, acting as a powerful incentive for firms to continuously enhance their underlying performance via process or product innovations, there is nevertheless a need to recognise the complicated non-linear relationship between innovation and competition. This relationship may in certain cases favour oligopolistic competition between a few large firms in some industries or stronger competition among many small players in others, as the optimal market structure for boosting the innovation process in the respective industries. Due to this non-linear relationship, it is incumbent on policy makers to take industry-specific circumstances into account when assessing the precise link between competition and productivity. Product market conditions (eg possibilities for product
21 Investment in education, training and lifelong learning are essential to the Union’s international competitiveness in knowledge-intensive, innovation sectors, and to sustainable growth and employment. Investment in education in its widest definition, including non-formal and tacit learning, is, together with technological advance, the driving force of dynamic, innovative growth, restructuring towards more high value-added production, and the generation of a general culture of entrepreneurship. The USA invests a far larger share of GDP in higher education than the EU (2.7 per cent compared to 1.1 per cent, with a large proportion of the increase accounted by the private sector) and has developed a far more effective system of linkages with the world of innovation.
22 The “European Research Area” launched in 2000 and the “Investing in Research Action Plan (2003)” address some of the wider framework conditions which impact on private R&D investment, e.g. intellectual property rights; science and technology human resources; access to venture capital markets; product market regulations; “technological platforms”; with a view to both initiating a process of structural change towards high tech sectors, and supporting the internal specialization of traditional industries towards higher R&D intensity and higher quality products. These measures all aim at influencing the specialization of European industries towards high tech sectors and products. See European Commission (2003).

31
differentiation) and the characteristics of specific technologies (eg is it a radical or incremental innovation; are there network externalities; are there economies of scale in R&D) is what ultimately determines the industry specific relationship between market concentration (i.e. the degree of competition) and R&D intensity.
Market entry and exit rules are crucial to an effective innovation process in rapidly changing industries. The example of the ICT industry highlights the need for policy makers to promote entrepreneurship and a healthy process of “creative destruction”. Entry and exit rules play an important role in boosting productivity by putting pressure on incumbent firms to innovate and by supporting market experimentation. This experimentation role is particularly important in industries where the general purpose technologies being used are changing rapidly such as in the production and use of ICT. In these industries the evidence is clear that product market regulations that facilitate the easy entry and exit of firms have contributed enormously to the diffusion of innovations in these industries.
Concluding remarks The present analysis has highlighted the need for the EU to shift the emphasis in its present economic model more towards innovation. This shift in our view is necessitated by the increasing competitive pressures of globalisation, by the future challenges of ageing populations and by the fact that many of the EU’s Member States are close to the technology frontier. Of these factors, the one of most immediate concern to productivity patterns is undoubtedly globalisation, with the growing interconnectedness of the world’s economy already driving up the pace of technological progress, intensifying competitive pressures and magnifying the gains from excellence, with the gains being reaped by
the USA’s global dominance in the ICT industry being a good example of the latter. While world trade volumes have been rising steadily since the 1950s, what has changed recently is the nature and scale of the globalisation phenomenon, with an increasing focus on trade in services and on capital movements in the form of FDI, with for example the stock of FDI as a per cent of world GDP tripling since the mid-1980s.
This dramatic intensification of the globalisation process is already transforming the economic structures of the developed and developing worlds, with India emerging as a global power in services, China consolidating its position in manufacturing and with the developed world as a whole searching for an appropriate response. Many countries in the developed world have recognised the seismic nature of the change and are responding positively by embracing an open-economy, innovation-based, model which emphasises the importance of world class educational establishments; higher levels of, excellence driven and better targeted, R&D; more market based financing systems; and more flexible regulatory and institutional frameworks delivering a more dynamic and competitive business environment. Others are responding in an inappropriate manner by attempting to cling to the belief that our present economic problems are temporary and that the magnitude of the changes wrought by globalisation will avoid the need for fundamental reforms. In this context, the collective challenge for EU governments is to embrace the reality of a rapidly changing global marketplace and of the structural changes which it inevitably provokes. While Lisbon is a manifestation of the collective desire for change, implementation of the needed reforms will be the litmus test of whether the future will witness a substantial recovery in the EU’s productivity fortunes or will confirm the EU’s ongoing decline as a global economic power.
32
References
AHMAD, N., F. LEQUILLER, P. MARIANNA, D. PILAT, P. SCHREYER AND A. WÖLFL (2004), “Comparing Labour Productivity Growth in the OECD Area: the Role of Measurement”, Paper presented at the Banque de France, CEPII and IFO Workshop, Paris.
BROCK, G. W. (2003), “The Second Information Revolution”,. Harvard University Press.
DAVERI, F. AND A. MASCOTTO, (2002), “The IT revolution across the US States”, IGIER Working Paper, No 226.
EUROPEAN COMMISSION (2003), “Investing in research: an action plan for Europe”.
FLAMM K. (1987), “Targeting the Computer, Government Support and International Competition”, The Brookings Institution, Washington D. C.
FOSTER, L., J. HALTIWANGER AND C. J. KRIZAN (2002), “The Link between aggregate and micro Productivity Growth: Evidence from Retail Trade”, NBER Working Paper No 9120.
FURMAN, J., M. PORTER, S. STERN (2002), “The determinants of national innovation capacity”, Research Policy, 899-934.
GORDON, R. (2003), “Hi-tech innovation and productivity growth: does supply create its own demand?”, NBER Working Paper No 9437.
GORDON, R. (2004), “Why was Europe left at the station when America’s productivity locomotive departed?”, CEPR Discussion Paper No 4416.
INKLAAR, R., M. O’MAHONY AND M. TIMMER (2003). “ICT and Europe’s Productivity Performance: Industry level Growth Account Comparisons with the United States”. Groningen Growth and development Centre, Research Memorandum GD-68.
JONES, C. I. (2002), “Sources of US economic growth in a world of ideas”, American Economic Review, Vol. 92, pp. 220-239.
OECD (2003), “The Sources of Economic Growth in OECD countries”.
OECD (2004), “Understanding Economic Growth”, Paris.
O’ MAHONY, M. AND B. VAN ARK (2003), “EU productivity and competitiveness: an industry perspective”, Study prepared for the Enterprise Directorate General.
OLINER AND SICHEL (2002),”Information Technology and Productivity: Where are we now and where are we going?”, Federal Reserve Bank of Atlanta Economic Review, 3rd Quarter.
SIELING, M., B. FRIEDMAN AND M. DUMAS (2001), “Labour Productivity in the Retail Trade Industry, 1987-99”, Monthly Labor Review, pp. 3-14.
STERN, S., PORTER, M. E. AND J. FURMAN (2000), “The determinants of national innovative capacity”, NBER Working Paper, No 7876.
STIROH, K. (2002), “Are ICT spillovers driving the new economy”, Review of Income and Wealth 48, No 1.
TRIPLETT, J., AND B. BOSWORTH (2000), “Productivity in the Services Sector in the International Economy”, R. M. Stern (ed.), University of Michigan Press.

33
ANNEX: PRODUCTIVITY MEASUREMENT ISSUES
The IMF in its recently released Article IV report on euro-area policies maintained that the euro area did not have a productivity problem since, according to their estimates, hourly productivity was higher than in the USA and all of the differences in per capita incomes were due solely to the lower number of hours worked by euro-area workers. On the basis of Eurostat’s structural indicators, however, a completely different picture emerges, with Eurostat’s productivity measure suggesting that 45 per cent of the gap in living standards between the euro area and the USA is due to lower labour productivity per hour, with the remaining 55 per cent an hours worked issue. To complicate matters even more, the equivalent OECD estimates suggest a position which roughly lies between that of Eurostat and the IMF, namely that the EU has a productivity problem but that it is not as severe as suggested by Eurostat. The OECD figures roughly coincide with those of ECFIN’s own analysis. This ongoing issue of conflicting measurements of the EU-US productivity gap (or the lack of it) is fundamental to the present policy debate and the relative emphasis to be placed on the employment or productivity aspects of the Lisbon strategy.
Overview of current situation and the extent of the problems. The graph shows the extent of the problems to be resolved on the basis of the Eurostat and OECD estimates (comparable IMF data is not available). While there are some differences in terms of GDP per capita and the per person employed productivity measures, it is very clear that the real source of the differences lies in the hours worked calculations and the associated hourly labour productivity figures.
Short and Long Run Solutions. There seems to be only one long term durable solution to these ongoing productivity measurement problems and that is for all of the interested parties, most notably, Eurostat, the OECD and the IMF to discuss the different methodologies which they employ for calculating the various input series. This in fact is what is happening at the moment, with Eurostat and the OECD actively discussing the various issues. It is hoped that a final long run resolution to these problems can be forthcoming before the end of 2004. Regarding possible short run solutions, ECFIN decided that given the uncertainties involved, it was very important to have its own internally produced productivity series for analytical purposes.
Comparison of GDP per capita, employment rates, hours worked per worker and labour productivity: Eurostat versus OECD
0
20
40
60
80
100
120
GDP per capita inPPS
Employment Rate (1) Hours Worked perWorker (2)
Hourly LabourProductivity
Labour Productivity –GDP in PPS per
person employed
EurostatOECD
Note: (1) Calculated- employment rate+100* (GDP per capita/labour productivity per person employed). (2) Calculated- hours worked per worker=100* (labour productivity per person employed hourly labour productivity). EU 15 performance 2002 (US=100). Source: Commission services.
Following an assessment of the strengths and weaknesses of the various statistical sources, the most internally consistent source was deemed to be the OECD’s labour force statistics databank, which has internationally comparable figures for hours worked and employment for both the EU’s Member States as well as for the USA. ECFIN is satisfied that the derived series constitute an acceptable interim solution, with the absolute levels for the different series and their evolution over time indicating a plausible pattern. These derived series, not surprisingly, are very similar to those of the OECD. Once convergence has been reached in the discussions between Eurostat and the OECD regarding the best input series to be utilised, ECFIN will adjust its own methodology to make it fully consistent. According to the ECFIN staff who are participating as observers to the Eurostat/OECD discussions, it appears that the final solution will not differ dramatically from the present ECFIN estimates. In fact, in terms of productivity levels, the EU-15 estimate is likely to lie between the present OECD and Eurostat estimates.23 Since the mid-point estimate looks likely to be the basis of a final consensus, the IMF’s viewpoint that the EU-15 does not have a productivity problem (and consequently that it should focus its Lisbon agenda solely on the employment
23 It has been tentatively agreed that the OECD, for the purpose of productivity measurement, will move from the labour force
framework to the national accounts. Eurostat will align their basic numbers for the USA with those from the OECD, with the OECD in turn converging towards Eurostat’s figures for the individual EU Member States. Eurostat, in a provisional assessment following the discussions with the OECD, now estimates that the EU-15’s hourly labour productivity relative to the USA’s was 88.5 in 2002 (compared with Eurostat’s previous estimate of 86.7 and the OECD’s estimate of 91).

34
front) will not be supported by the underlying data. This IMF position, it should be stressed, only applies to productivity levels, with the IMF also accepting that there has been a significant deterioration in the EU’s relative position over recent years due to much lower EU productivity growth rates compared with those of the USA.