Embed Size (px)
Citation preview

83
4. The connection business cycles and tourism demand
cycles1
Abstract
This study used statistical and econometric techniques to examine the relationship between business cycles and tourism cycle flows to Aruba and Barbados over the period 1995-I to 2011-IV. The study found that tourism cycles are an outcome from business cycles in the source countries, and both cycles are to some extent synchronized. Additionally, the impact of business cycles in source countries on tourism demand in the two destinations is heterogeneous with delayed effects for Aruba, and contemporaneous effects for Barbados. The business cycles effects were asymmetric in terms of the deterioration and recovery periods, suggesting that income effects vary. The policy options for each destination vary from countercyclical in the case of Aruba to pro-cyclical in the case of Barbados.
Key words: business cycles, visitor cycles, cointegration, granger causality,
Aruba, Barbados, small island destinations
1. This chapter is based on: Croes, R.R., & Ridderstaat, J.R. (XXXX). The connection business cycles and tourism demand cycle. (under preparation for submission)
.

84
4.1 Introduction
The purpose of this study is to investigate whether business cycles have a bearing on tourism demand flow cycles. Business cycles are common in modern economies, revealing regular growth fluctuations, and shifting from stages of expansion and recession in economic activity (Krugman, 2009). The impact of these fluctuations, if not tamed, can have devastating effects on economies and human suffering by destroying jobs, prompting lost revenues and increasing advertising costs. The recent economic and financial crisis (2007-2010) affected tourism arrivals negatively, with some countries feeling the brunt of its impact more than others. As such, business cycles are one of the elements that impact the dynamics of tourism, and deciphering this relationship could provide a better opportunity to understand tourism itself, allowing for a greater likelihood to cope and manage its change (Faulkner, 2000). The premise of this study is that tourism as an economic activity is not immune from the effects of business cycles, the reason being that tourism flows are prompted by relatively high income elasticities (Song et al., 2009).
The implication of this premise is that business cycles and tourism flow cycles seem to some extent aligned thereby prodding destinations to keep a close eye on business cycles in the origin markets. Business cycles in source markets could have contemporaneous or delayed effects on tourism flows, consequently requiring different types of policy responses from destination managers. For example, if there are delayed effects between business cycles downturns and tourism flow cycles, as argued by Guizzardi & Mazzocchi (2010), the negative impact of business cycles may be stifled. Another implication is that the outcome of the interaction between business cycles and tourism flow cycles may not be symmetric. In other words, the impact of business cycles during busts may be more severe than periods of boom in the tourist destination (Moore & Whitehall, 2005; Smeral, 2012). Asymmetric effects may, therefore, require different marketing strategies in the source markets.
An additional implication is the variance in the impact of business cycles in the source markets generating different income elasticities. The different intensity across source markets provokes distinctive impacts on the tourism demand to the destination. For example, the impact of one source market due to business cycles may be completely different than another source market on the destination, requiring a nuanced response from destination managers. Finally, the added volatility provoked by business cycles may affect confidence levels that on their turn impact travel behavior. Understanding, therefore the nature of the (mis)alignment between business cycles and tourism cycle flows is relevant for destination managers, because

85
it can affect the economic welfare of the destination as well as the types of policy levers available to destination managers.
This study aims to contribute to the understanding of this macroeconomic phenomenon when interacting with tourism demand. The study examines four questions: (1) are tourism flows synchronized with business cycles? (2) are business cycles and tourism demand flows cointegrated? (3) is the impact of business cycles on tourism flows permanent or transitory? And (4) are the effects of business cycles on tourism cycles asymmetric in terms of deterioration and recovery periods? To investigate these questions, the study employs a case study research design consisting of two small island destinations, i.e., Aruba and Barbados. The selection criteria of these case studies followed the studies of George (1975), Lijphart (1979) and Yin (2009). Both countries are small islands heavily dependent on tourism (Croes, 2011). Tourism has emerged as the main impetus of growth, jobs and a major source of foreign exchange for both islands. Both destinations reveal significant high income demand elasticities. For example, Aruba experienced income elasticity of demand of 1.70, 2.06 and 2.61 from the USA, the Netherlands and Venezuela, respectively (Croes, 2010). Greenidge (2001) reports elasticities in the case of Barbados yielding 1.512, 2.268 and 3.134 percent from the UK, USA and Canadian markets, respectively. These high elasticities highlight how detrimental external shocks could be to the tourism sector of these islands. The impact of tourism on both destinations is extensive and pervasive, thus unexpected deviations from trends can have serious macroeconomic ramifications. Business cycles seem to affect these two island differently, revealing heterogeneous intensities. The difference in intensity may be due to the source market mix; Aruba being mainly dependent on the United States, while Barbados is mainly contingent on the United Kingdom market.
The procedure to answer the previous questions consists of four steps. Step one decomposes the series into trend, cycle, seasonal and irregular component. The smoothing process is done through the Census X-12 decomposition method, and the Hodrick-Prescot filter. The second step is to assess how well the tourism demand cycles moved in concert with the business cycles. A Pearson’s correlation statistics (PCS) is subsequently applied to determine the level of linear similarity between the cycles. The next step (three) estimates the amplitude differences by employing the Euclidean distance measure (EDM). The final step (four) is to determine the long-run and causality relationships through unit root testing (Dickey & Fuller, 1979; Phillips & Perron, 1988; Kwiatkowski et al., 1992); cointegration testing (Pesaran & Shin, 1997; and Pesaran et al., 2001); and causality testing (Narayan & Smyth, 2005; Ghosh, 2010; Sami, 2011; and Ozturk & Acaravci, 2013).

86
The next four sections of the study are organized as follows. Section 4.2 reviews the literature centering on business cycles and tourism demand studies. Section 4.3 addresses the fundamentals of the methodology employed to answer the research questions. This section discusses the procedure consisting of four steps. Section 4.4 presents the empirical findings, while the last section discuss the implications and conclusions of the study.
4.2 Literature review
Over the past one hundred years, economists have struggled to understand business cycles, and how to contain its devastating effects on economies and peoples. The notion of the Walrasian equilibrium assumes that economies would show a steady state where markets usually match supply and demand. Cycles are seen as deviations from this pattern and are governed by shifts in supply and demand. In other words, economic activities involve spurts of growth followed by slowdowns over time. Any deviation from the growth trend for a period of time is considered a business cycle, and is referred to as the output-gap definition (Morley & Piger, 2012). By this definition economic output exposes a cyclical behavior, consisting of a trend and a cycle in the case of annual data. Both trend and cycles are measurable through a number of smoothing techniques (Gomez, 2001; Andrle, 2013).
Economic fluctuations impact the unemployment rate and capacity utilization of the economy (Krugman, 2009). Big booms and busts hurt the economy, provoking either potential overheating of the economy or declines in economic output, employment, and private spending. The problem of the business cycle is that supply and demand may be misaligned. Two schools of thoughts examine the reasons why supply and demand may be out of sync. Both schools are related to choices people make. The first examines how people make choices, while the second focuses on how choices are coordinated. Each perspective yields different consequences to business cycles. The former strand asserts that incentives matter, and confers attributes misalignment of supply and demand to non-economic motives (impulsiveness). Romer (2001) and Akerlof & Shiller (2009) discussed how animal spirits determine choices and distort markets. Smeral (2012) explained how a number of factors related to individual choices, such as ‘loss aversion’, liquidity constraints, and habit modifications influence the stability of demand elasticities across business cycles. The consequence of cycles according to this perspective is that shocks are only transitory.
The other strand in the literature questions whether the overall economic performance is the outcome of individual intentions. This strand posits that

87
there are wider forces in the market that increase the gap between intentions and aggregate outcomes. In other words, the sum of micro behaviors does not add up to one single macro behavior (Schelling, 2006). For example, technology has shown to be very disruptive, revealing a highly non-stationary path thereby instilling a high degree of uncertainty in the economic system (Aghion & Howitz, 1998). How the economy copes with the forces of disruption goes beyond incentives, according to these authors. This perspective also asserts that because disruption affects the productivity level of an economy, shocks of the cycles may be persistent, contrary to the view of shock being transitory where animal spirits matter. In other words, how coordination of choices happens may prompt changes in aggregate demand through changes in levels of productivity (Plosser, 1989) yielding permanent effects to the economy.
It is, therefore, crucial to understand how fluctuations propagate through time and permeate different sectors impacting the coordination between supply and demand. The nature of disturbances stemming from these fluctuations affects the allocations of resources to growth, and the amount of allocation may determine whether these disturbances will be permanent or transitory, or whether these fluctuations will exercise an asymmetric response in demand. Fluctuations may propel contemporaneous or delayed demand responses having different impacts on resource allocations. For example, investments may recede while recovery is not strong enough thereby preventing economic output to return to its trend provoking economic despair beyond the mere added volatility to the economy. For all these reasons, the impact of business cycles would prompt different income elasticities thereby affecting travel behavior dissimilarly.
The tourism sector is not immune from business cycles. The reason is that tourism demand is related to income, and income is identified as a key explanatory variable in tourism demand models. The motions of economic growth and slowdowns may affect aggregate demand in the source country, potentially impacting the demand for tourism offerings (Guizzardi & Mazzocchi, 2010; Smeral, 2012). Consequently, tourist arrivals may deviate from their long-term trend. These deviations, which are known as the cycle in the series, are neither necessarily immediate nor straightforward due to lags in choice and behavior of the customer, and substitution of destinations. For example, Smeral (2012) makes the point that tourists may reveal a delayed adjustment to cycles due to social status nurtured by conspicuous consumption. As the slow growth period deepens, tourists may alter their travel behavior by substituting destinations for ones closer to homes or may forego travel altogether. On the other hand, tourists may immediately adjust their travel demand when there are signs of recovery. While the recovery is
88
still slow, tourism demand may have a significant uptick due to pent-up demand.
These cycles vary greatly in amplitude, diffusion and duration and consequently, exhibiting diverse impacts on the economies of destinations. Tourists may lower their spending, affecting per capita expenditures at a destination or may reduce their length of stay depending on whether shocks are transitory or permanent. For example, Narayan (2011) found that transitory effects of business cycles influence tourism expenditures. The transitory effects are channeled through real exchange rates, and changes in price levels in Australia. Additionally, the interaction between business cycles and tourism demand cycles may exhibit unstable income and price elasticities. For example, Moore & Whitehall (2005) found that tourism demand responses in the case of Barbados were asymmetric over the period 1957-2002. Similar effects were found in Algarve, Portugal by Gouveia & Rodrigues (2005), in Italy by Guizzardi & Mazzocchi (2010), in the panel of EU-15 and Japan by Smeral (2012), and in the panel of sovereign countries, members of the World Tourism Organization (WTO) by Kozic (2013). Determining the relationship between business cycles in source countries and tourism flows will facilitate the understanding of the nature of the fluctuations and their potential impact on the economy of destinations.
Tourism demand studies are remarkably silent on the influence of business cycles on tourism flows. For example, the study of Song et al. (2009) on tourism demand does not mention business cycles. Similarly, Song et al. (2012), in reviewing the evolution of the current tourism economics literature and providing likely future developments, omit discussing the impact of business cycles on tourism demand. Tourism demand studies seem to consider business cycles only implicitly, providing little insights in cyclical tourism fluctuations (Greenidge, 2001; Worrell et al., 2011). However, several studies have long recognized the presence of cyclical patterns in tourism demand in the literature (Gonzalez & Moral, 1996; Greenidge, 2001). The cyclical relationship between tourism and the income of the source country have been implicitly accounted for in tourism demand models. Because the cyclical interaction is only accounted for implicitly, these studies provide little information on the industry’s cyclical characteristics. The reason is that the estimated coefficients from these series may be confounded by structural shifts in the economy, or general trends in the series. The integration of business cycles into tourism demand models was pioneered by Schulmeister (1979) with is work on the effects of ‘the oil crisis’ during the end of the seventies on international tourism demand to Austria. Subsequently, Wong (1997) advocated to explicitly including business cycles into demand models. This insight was eventually followed by the studies of Gouveia & Rodrigues (2005) and Guizzardi &

89
Mazzocchi (2010). For example, Guizzardi & Mazzocchi (2010), employing quarterly data in Italy, found that that the link between the overall business cycle and cycles in tourism are mainly determined by the delayed effects of business cycles.
Guizzardi & Mazzocchi (2010) mention three potential reasons why the interaction between business cycles and tourism demand cycles is under-researched. First, patterns may evolve due to economic growth and policies (labor policy and holiday entitlements). Second, technological changes may generate new practices and opportunities, such as the low cost carriers. Cycle and trend may be affected by these potential changes in travel habits. And third, major events such as the Olympics, the FIFA World Cup, and religious observations may affect the tourism flow. Only recently has Wong (1997) suggested that economic fluctuations may also shape tourism demand. This observation was followed by a handful of studies drawing attention to the relevance of the relationship between business cycles and tourism demand flows (Moore & Whitehall, 2005; Guizzardi & Mazzocchi, 2010; Smeral, 2012; Kozic, 2013).
This study extends on the previous studies. It claims that the overall income (demand) and tourism demand move in the same direction. While previous studies assumed this positive relationship (Moore & Whitehall, 2005; Smeral, 2012; Kozic, 2013); or used proxies to model this relationship (Guizzardi & Mazzocchi, 2010), this study aims to prove the positive relationship between business cycles and tourism flow cycles. Additionally, this study comprehensively examines the relationship between business cycles and tourism flow cycles by integrating all the most relevant questions in one framework. For this purpose the study employs cointegration and causality analysis to examine the direct link between business cycles and tourism flow cycles. The study is concerned with the specific cyclical properties of tourist arrivals in Aruba and Barbados, and thus considers the cyclical properties as the unit of analysis.
4.3 Data and methods
The basis for the analysis is the conceptual framework depicted in Figure 4.1, presenting, both for Aruba and Barbados, the linkage between the cycles of tourism demand and source country economic development. Tourism demand encompasses several markets of origin. For Aruba, the included markets were the United States, Venezuela, the Netherlands, Canada, and the United Kingdom (UK). The first three markets represent the top tier of Aruba’s tourism demand, accounting for 82.0% of the overall stay-over tourism to the island. The Canadian and UK markets were added

90
to the analysis of the Aruban tourism demand to facilitate comparison with the island of Barbados. Both markets represent an additional 8.5% of the total stay-over visitors to Aruba. The data are on a quarterly basis, representing 68 data points, from the first quarter of 1995 to the fourth quarter of 2011. The source of the data is the Central Bank of Aruba.
Figure 4.1: Conceptual framework of the analysis of the relationship between cycles of tourism demand and source country economic development
While the Canadian and UK markets were less significant for Aruba’s tourism, they were more relevant to the case of Barbados’ tourism. Together with the US demand, these markets accounted for 70.9% of the stay-over tourism to Barbados. The data source is the Central Bank of Barbados (1995-I to 2011-IV). The other source of the data is the quarterly real gross domestic product (GDP) (2005 = 100) from the countries of origin of the tourism demand. The data are from the International Financial Statistics database of the International Monetary Fund. The real GDP of the world served as a proxy for the analysis against the total tourism demand of both islands.
The series’ data consist of a number of elements; including a trend (T), cycle (C), seasonal (S) and irregular component (I). The T indicates that
Analysis period: Q1 1995 - Q4 2011
Business cyclesWorld
United StatesCanada
United Kingdom
VenezuelaThe Netherlands
Tourism demand cycles ArubaTotal
United StatesCanada
United KingdomVenezuela
The Netherlands
Tourism demand cycles BarbadosTotal
United StatesCanada
United Kingdom
Causality analysisPattern analysis Amplitude and symmetry analysis

91
there is a long-term secular increase or decrease in the data; C has to do with non-periodic recurring variations around the long-run trend; S denotes repetitive influences between years; and I specifies erratic and irregular movements in the data, reflecting a myriad of unpredictable disturbances such as hurricanes, strikes, etc. (Makridakis et al.,1983; Bails & Peppers, 1993). The study centers on the C component of the data, requiring elimination of the other elements through decomposition of the series. The decomposition includes two steps. First, the study applied the Census X-12 technique to divide the series into a seasonally adjusted series (SA), the S and the I components. The SA is basically a combination of the T and C (TC, thus). The Census X-12 software is a seasonal adjustment program developed by the US Bureau of Census, and served as the basis for calculating the SA component. Second, using the TC component of the series, the study next employed the Hodrick-Prescot filter to split the TC
component of the data into a T and a C element. The latter was the basis for the further analysis in this study, which includes pattern, amplitude, symmetry, and causality tests.
The study applied next a pattern analysis to assess how well the tourism demand cycles moved in concert with the business cycles. Pearson’s correlation statistics (PCS) were used to determine the level of linear similarity between the cycles. This statistics varies between 1 (perfect positive linear correlation) and -1 (perfect negative linear correlation). The PCS was also calculated for lagged values of tourism demand, given that the latter could react in a lagged form to developments in the business cycle.
Additionally, the study considered the amplitude differences between the tourism demand cycles and the business cycles. Amplitude is defined in this study as the difference between a point on the cycle component and zero. The larger the difference between these two points, the bigger the amplitude dispersion would be. Comparing amplitude differences provides another indication of how close the cycles are moving together. For this purpose, the study applied the Euclidean distance measure (EDM), according to the following formula:
��� =�1��� − ��� ����
(1)
where BC = business cycle; TDC = tourism demand cycle;

92
t = time; i = lag (from 0 to 7). Basically, this formula implies a standard deviation-type of calculation, with the difference that (1) the deviation is now calculated between two variables, instead of one variable and its mean value; and (2) lags are included in the calculation. Similar to the PCS, the EDM was also calculated with lagged values of tourism demand cycles. The smallest the EDM value of all lagged combinations would indicate the smallest differences in amplitude.
The study also calculated the EDM differences between periods of deterioration and recovery in the series. First, the authors applied a version of the dating method suggested by Harding & Pagan (2002) and Gouveia & Rodrigues (2005), whereby the peaks and troughs were dated according to the following formula:
���� → � ��, � ��, � ��, � �� <� <� ��, � ��, � ��, � �� (2) � !"#ℎ → � ��, � ��, � ��, � �� >� < � ��, � ��, � ��, � ��(3)
where y = quarter; t = time. Basically, these formulas compare a cycle value at a certain quarter (yt), with the values up to four quarters earlier and up to four quarters later. The range of quarter comparison is larger than those applied by Harding & Pagan (2002), to minimize the risk of selecting either suboptimal peaks or a throughs. Next, the authors applied the dated results as turning points to further code the remaining data into periods of either deterioration or recovery, following the method proposed by Gouveia & Rodrigues (2005): 1 if deterioration
Period = (4)
0 if recovery
The differences between deterioration and recovery periods were assessed using the previously described EDM methodology.
At this point, the study shifted from statistics to econometrics determining whether there is causality between the cycles of tourism

93
demand and those of the economic performance in the source countries. A number of steps were undertaken to accomplish this task. First, unit root tests were applied to examine the properties of data; in other words, to investigate if the data were stationary or non-stationary. A stationary time series would have a constant mean, variance and covariance over time (Song et al., 2009). The unit root tests consisted of Dickey & Fuller (1979) (the so-called Augmented Dickey-Fuller test, or ADF), Phillips & Perron (1988) (the Phillips-Perron test, or PP), and Kwiatkowski et al. (1992) (the Kwiatkowski-Phillips-Schmidt-Shin test, or KPSS for short). The KPSS test is often used to complement the ADF an PP tests to obtain robust results (Ghosh, 2010; Pao et al., 2012; Jafari et al., 2012). Following the unit root tests, the existence of a long-run equilibrium relationship (cointegration) between the tourism demand cycles and their respective business cycles was examined. The aim here is to assess whether there is, what is being referred to in the literature as, a common cycle (Vahid & Engle, 1993; Engle & Issler, 1995; Hecq et al., 2000; Picci, 2001). This can be interpreted as a linear combination of the error correction terms of the two variables being analyzed (Engle & Issler, 1995). The applied technique was the Autoregressive Distributed Lags (ARDL) method, based on Pesaran & Shin (1997) and Pesaran et al. (2001). Following Ridderstaat et al. (2014), the following equations were estimated: ∆���' =() + ∑ (��∆���', �� +,�-� ∑ (��∆��', �� +,�-) (����', �� +(���', �� + .�
(5)
∆��', =(/ + ∑ (0�∆��', �� +,�-� ∑ (1�∆���', �� +,�-) (2��', �� +(3���', �� + .� (6)
where x = tourism market; ∆ = first difference; α’s = coefficients; ɛ = white noise term.
94
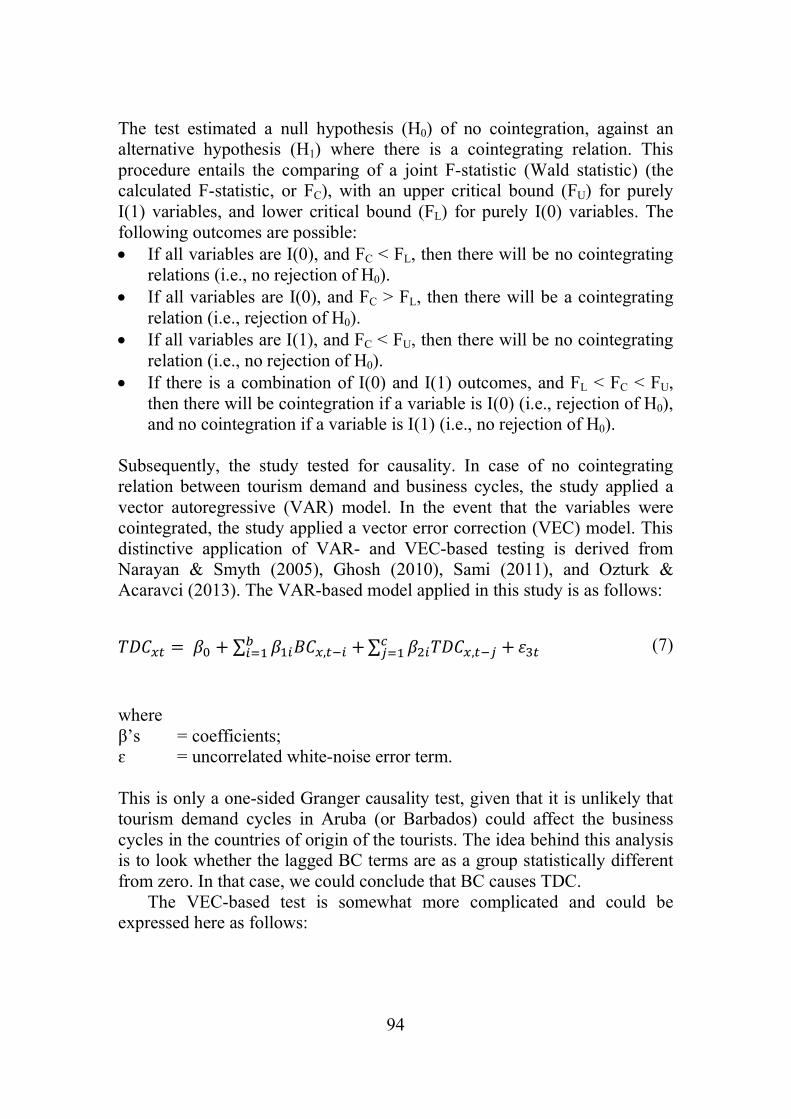
The test estimated a null hypothesis (H0) of no cointegration, against an alternative hypothesis (H1) where there is a cointegrating relation. This procedure entails the comparing of a joint F-statistic (Wald statistic) (the calculated F-statistic, or FC), with an upper critical bound (FU) for purely I(1) variables, and lower critical bound (FL) for purely I(0) variables. The following outcomes are possible:
• If all variables are I(0), and FC < FL, then there will be no cointegrating relations (i.e., no rejection of H0).
• If all variables are I(0), and FC > FL, then there will be a cointegrating relation (i.e., rejection of H0).
• If all variables are I(1), and FC < FU, then there will be no cointegrating relation (i.e., no rejection of H0).
• If there is a combination of I(0) and I(1) outcomes, and FL < FC < FU, then there will be cointegration if a variable is I(0) (i.e., rejection of H0), and no cointegration if a variable is I(1) (i.e., no rejection of H0).
Subsequently, the study tested for causality. In case of no cointegrating relation between tourism demand and business cycles, the study applied a vector autoregressive (VAR) model. In the event that the variables were cointegrated, the study applied a vector error correction (VEC) model. This distinctive application of VAR- and VEC-based testing is derived from Narayan & Smyth (2005), Ghosh (2010), Sami (2011), and Ozturk & Acaravci (2013). The VAR-based model applied in this study is as follows:
���' =4) + ∑ 4����', �� +5�-� ∑ 4�����', �6 +76-� .� (7)
where β’s = coefficients; ɛ = uncorrelated white-noise error term. This is only a one-sided Granger causality test, given that it is unlikely that tourism demand cycles in Aruba (or Barbados) could affect the business cycles in the countries of origin of the tourists. The idea behind this analysis is to look whether the lagged BC terms are as a group statistically different from zero. In that case, we could conclude that BC causes TDC.
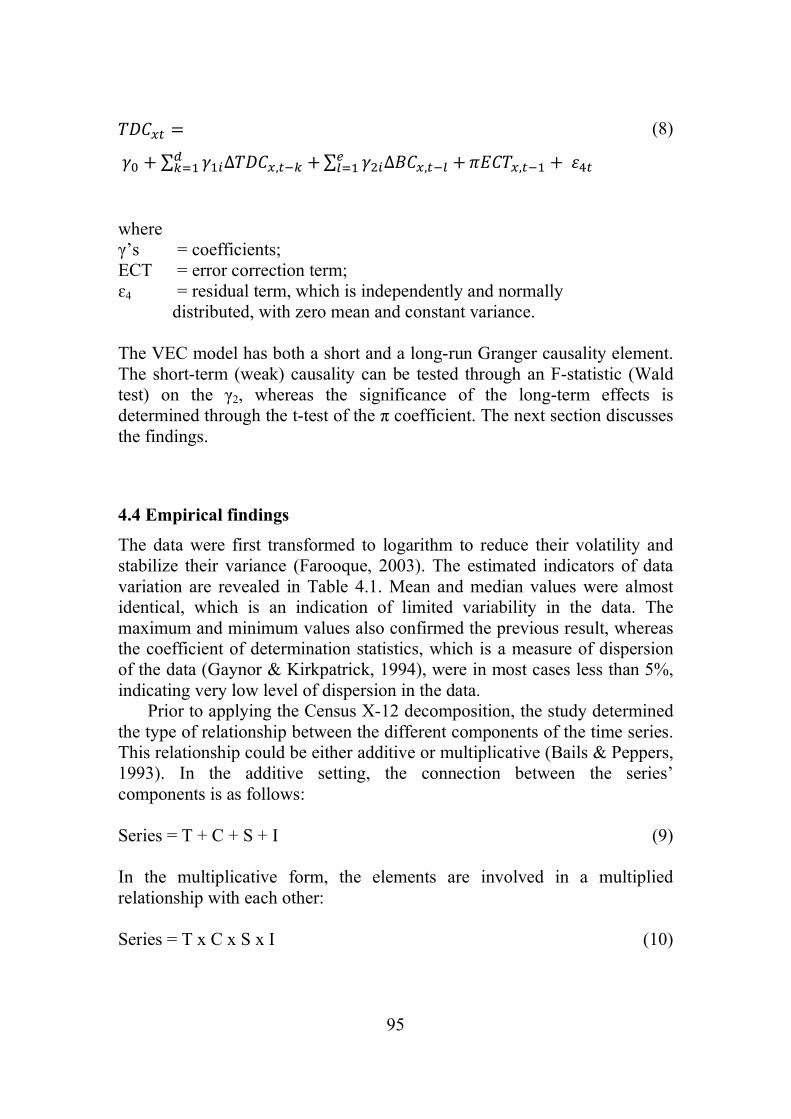
The VEC-based test is somewhat more complicated and could be expressed here as follows:
95
���' =8) + ∑ 8��∆���', �9 +:9-� ∑ 8��∆��', �; +<;-� =���', �� +.� (8)
where γ’s = coefficients; ECT = error correction term; ɛ4 = residual term, which is independently and normally distributed, with zero mean and constant variance. The VEC model has both a short and a long-run Granger causality element. The short-term (weak) causality can be tested through an F-statistic (Wald test) on the γ2, whereas the significance of the long-term effects is determined through the t-test of the π coefficient. The next section discusses the findings.
4.4 Empirical findings
The data were first transformed to logarithm to reduce their volatility and stabilize their variance (Farooque, 2003). The estimated indicators of data variation are revealed in Table 4.1. Mean and median values were almost identical, which is an indication of limited variability in the data. The maximum and minimum values also confirmed the previous result, whereas the coefficient of determination statistics, which is a measure of dispersion of the data (Gaynor & Kirkpatrick, 1994), were in most cases less than 5%, indicating very low level of dispersion in the data.
Prior to applying the Census X-12 decomposition, the study determined the type of relationship between the different components of the time series. This relationship could be either additive or multiplicative (Bails & Peppers, 1993). In the additive setting, the connection between the series’ components is as follows:
Series = T + C + S + I (9) In the multiplicative form, the elements are involved in a multiplied relationship with each other: Series = T x C x S x I (10)

96
Table 4.1: Variables used in the analysis
Variable Description Mean Median Maximum Minimum Standard deviation
Coefficient of variation
L_GDPR_WOR Logarithm of the real gross domestic product of the world (2005=100)
4.5 4.5 4.8 4.2 0.2 3.8
L_GDPR_US Logarithm of the real gross domestic product of the USA (2005=100)
4.5 4.5 4.7 4.3 0.1 2.7
L_GDPR_VEN Logarithm of the real gross domestic product of Venezuela (2005=100)
4.6 4.6 4.8 4.3 0.1 1.9
L_GDPR_NED Logarithm of the real gross domestic product of the Netherlands (2005=100)
4.6 4.6 4.7 4.3 0.1 2.4
L_GDPR_CAN Logarithm of the real gross domestic product of Canada (2005=100)
4.5 4.5 4.7 4.3 0.1 3.0
L_GDPR_UK Logarithm of the real gross domestic product of the UK (2005=100)
4.5 4.5 4.7 4.3 0.1 2.8
L_TOUR_TOT_AUA Logarithm of total visitors to Aruba 12.1 12.1 12.3 11.8 0.1 1.0
L_TOUR_US_AUA Logarithm of visitors to Aruba from US
11.6 11.7 12.0 11.2 0.2 1.5
L_TOUR_VEN_AUA Logarithm of visitors to Aruba from VEN
9.9 9.9 10.8 9.0 0.4 4.4
L_TOUR_NED_AUA Logarithm of visitors to Aruba from The Netherlands
2.1 2.1 2.2 2.0 0.1 2.6
L_TOUR_CAN_AUA Logarithm of visitors to Aruba from Canada
8.6 8.6 9.8 7.8 0.5 5.9

97
Table 4.1: Variables used in the analysis (continued)
Variable Description Mean Median Maximum Minimum Standard deviation
Coefficient of variation
L_TOUR_UK_AUA Logarithm of visitors to Aruba from UK
7.1 7.0 8.9 6.0 0.7 10.5
L_TOUR_TOT_BAR Logarithm of total visitors to Barbados
11.8 11.8 12.3 11.8 0.1 0.9
L_TOUR_UK_BAR Logarithm of visitors to Barbados from UK
10.8 10.8 11.0 10.2 0.2 1.7
L_TOUR_US_BAR Logarithm of visitors to Barbados from US
11.6 11.7 12.0 11.2 0.2 1.5
L_TOUR_CAN_BAR Logarithm of visitors to Barbados from Canadian market
9.5 9.4 10.3 8.8 0.4 4.3

98
Following Den Butter & Fase (1991), the regression below was effected to test the nature of the relationship:
|? − ?� | =∝)+ 4?� + . (11)
where S = time series; ST = centered moving average of S over a period of one year; α, β = coefficients; t = time; ɛ = residual term. This regression analysis centered on the estimation of β. If β is statistically different from zero, S and ST are correlated, and the model type is multiplicative. If β is not statistically different from zero, both S and ST will be uncorrelated, and the model will be additive. According to Ridderstaat et al. (2014b), the basic question here is whether movements away from the moving trend (the absolute difference between S and ST, or |S – ST|), be it C, S or I, are related to ST or not. If they are, (meaning that β is significantly different from zero), then the T, C, S and I elements are related to each other in a multiplicative way. Otherwise (β is not significantly different from zero), these elements will have an additive relationship with each other. The results of this analysis are shown in Table 4.2, where β appears not to be statistically significant in all the cases, meaning that the variables are all additive in nature.
With the latter confirmation, the series was decomposed, first via the Census X-12 method and, subsequently, through the Hodrick-Prescott filter to further split the TC element (T + C in this case) into separate components. The resulting cycles are depicted in Figure 4.2. To compare the cycles, the data were first standardized. In the case of Aruba, the overall tourism demand seems to move in concert with the world business cycle, but the relationship becomes less parallel after 2003. In the instance of the US, Venezuelan and Dutch markets, the charts reveal periods of visible co-movements, but in the situation of the Canadian and UK markets, the correlation between the tourism demand and business cycles does not seem synchronized. In the case of Barbados, visual inspection suggests correlation between tourism demand and business cycles for the total and all individual markets involved in the study. Further statistical and econometric analyses

99
should give closure about the nature of the relationship between both types of cycles.
Table 4.2: Type of model
c β Conclusion
L_GDPR_WOR 0.0071 -0.0016 Additive
L_GDPR_US -0.0068 0.0015 Additive
L_GDPR_VEN 0.2055 -0.0449 Additive
L_GDPR_NED -0.0115 0.0025 Additive
L_GDPR_CAN -0.0074 0.0016 Additive
L_GDPR_UK -0.0059 0.0013 Additive
L_TOUR_TOT_AUA -0.1547 0.0186 Additive
L_TOUR_US_AUA -0.4317 0.0371 Additive
L_TOUR_VEN_AUA -0.2885 0.0289 Additive
L_TOUR_NED_AUA -0.0405 0.0191 Additive
L_TOUR_CAN_AUA -0.3408 0.0397 Additive
L_TOUR_UK_AUA 0.0470 -0.0071 Additive
L_TOUR_TOT_BAR -0.1547 0.0186 Additive
L_TOUR_US_BAR -0.4317 0.0371 Additive
L_TOUR_UK_BAR 0.0564 -0.0051 Additive
L_TOUR_CAN_BAR -1.1319 0.1197 Additive
Note: None of the estimated β coefficients were statistically significant. Therefore, all models were determined to be additive.
Before proceeding with the statistical and econometric analyses, the study estimated the significance of the cycles in the overall series by determining the overall volatility of the series. The estimation included comparing the standard deviations of the whole series as well the cycles. Table 4.3 reveals that the volatility in the business cycles in the case of tourism demand cycles in Aruba, which was in most cases below 10%, except for Venezuela and the Netherlands. The volatility in the case of tourism demand cycles to Aruba varied between 30% and 40%, with the exception of visitor cycles from Canada and the UK. This indicates important influences of tourism demand cycles of the US, Venezuelan and Dutch markets in the overall performance of the respective tourism demand figures. The volatility in the

100
Canadian market is about similar to the case of Barbados, but the UK market cycle has a more prominent role in explaining tourism demand to Barbados compared to Aruba. Table 4.3: Explanatory power of cycles in volatility of the series
Variable σSeries σCycle [σCycle/σSeries] x 100%
L_GDPR_WOR 0.1713 0.0112 6.5
L_GDPR_US 0.1223 0.0120 9.8
L_GDPR_VEN 0.0873 0.0199 22.7
L_GDPR_NED 0.1089 0.0135 12.4 L_GDPR_CAN 0.1336 0.0113 8.5
L_GDPR_UK 0.1251 0.0119 9.5
L_TOUR_TOT_AUA 0.1166 0.0468 40.1
L_TOUR_US_AUA 0.1803 0.0543 30.1
L_TOUR_VEN_AUA 0.4343 0.1615 37.2
L_TOUR_NED_AUA 0.1605 0.0613 38.2
L_TOUR_CAN_AUA 0.5102 0.0731 14.3
L_TOUR_UK_AUA 0.7454 0.1250 16.8
L_TOUR_TOT_BAR 0.1047 0.0395 37.7
L_TOUR_UK_BAR 0.1883 0.0579 30.7
L_TOUR_US_BAR 0.1269 0.0523 41.2
L_TOUR_CAN_BAR 0.4031 0.0573 14.2
Note: σ = standard deviation.

101
Figure 4.2: Tourism demand and business cycle comparisons (Aruba)
Fig. 2.1.a: World business cycle and total tourism cycle to Aruba Fig. 2.1.b: US business cycle and US tourism cycle to Aruba Fig. 2.1.c: Venezuelan business cycle and Venezuelan tourism
cycle to Aruba
Fig. 2.1.d: The Netherlands business cycle and The Netherlands
tourism cycle to Aruba
Fig. 2.1.e: Canadian business cycle and Canadian tourism cycle to
Aruba
Fig. 2.1.f: UK business cycle and UK tourism cycle to Aruba
-3
-2
-1
0
1
2
31
99
5.0
1
19
96
.01
19
97
.01
19
98
.01
19
99
.01
20
00
.01
20
01
.01
20
02
.01
20
03
.01
20
04
.01
20
05
.01
20
06
.01
20
07
.01
20
08
.01
20
09
.01
20
10
.01
20
11
.01
SD_L_GDPR_WOR_C SD_L_TOUR_TOT_AUA_C
-3
-2
-1
0
1
2
3
19
95
.01
19
96
.01
19
97
.01
19
98
.01
19
99
.01
20
00
.01
20
01
.01
20
02
.01
20
03
.01
20
04
.01
20
05
.01
20
06
.01
20
07
.01
20
08
.01
20
09
.01
20
10
.01
20
11
.01
SD_L_GDPR_US_C SD_L_TOUR_US_AUA_C
-3
-2
-1
0
1
2
3
4
19
95
.01
19
96
.01
19
97
.01
19
98
.01
19
99
.01
20
00
.01
20
01
.01
20
02
.01
20
03
.01
20
04
.01
20
05
.01
20
06
.01
20
07
.01
20
08
.01
20
09
.01
20
10
.01
20
11
.01
SD_L_GDPR_VEN_C SD_L_TOUR_VEN_AUA_C
-4
-3
-2
-1
0
1
2
3
19
95
.01
19
96
.01
19
97
.01
19
98
.01
19
99
.01
20
00
.01
20
01
.01
20
02
.01
20
03
.01
20
04
.01
20
05
.01
20
06
.01
20
07
.01
20
08
.01
20
09
.01
20
10
.01
20
11
.01
SD_L_GDPR_NED_C SD_L_TOUR_NED_AUA_C
-4
-3
-2
-1
0
1
2
3
19
95
.01
19
96
.01
19
97
.01
19
98
.01
19
99
.01
20
00
.01
20
01
.01
20
02
.01
20
03
.01
20
04
.01
20
05
.01
20
06
.01
20
07
.01
20
08
.01
20
09
.01
20
10
.01
20
11
.01
SD_L_GDPR_CAN_C SD_L_TOUR_CAN_AUA_C
-3
-2
-1
0
1
2
3
4
19
95
.01
19
96
.01
19
97
.01
19
98
.01
19
99
.01
20
00
.01
20
01
.01
20
02
.01
20
03
.01
20
04
.01
20
05
.01
20
06
.01
20
07
.01
20
08
.01
20
09
.01
20
10
.01
20
11
.01
SD_L_GDPR_UK_C SD_L_TOUR_UK_AUA_C

102
Figure 4.2: Tourism demand and business cycle comparisons (Barbados)
Fig. 2.2.a: World business cycle and total tourism cycle to
Barbados
Fig. 2.2.b: US business cycle and US tourism cycle to Barbados Fig. 2.2.c: UK business cycle and UK tourism cycle to Barbados
Fig. 2.2.d: Canadian business cycle and Canadian tourism cycle to
Barbados
-4
-3
-2
-1
0
1
2
31
99
5.0
1
19
96
.01
19
97
.01
19
98
.01
19
99
.01
20
00
.01
20
01
.01
20
02
.01
20
03
.01
20
04
.01
20
05
.01
20
06
.01
20
07
.01
20
08
.01
20
09
.01
20
10
.01
20
11
.01
SD_L_GDPR_WOR_C SD_L_TOUR_TOT_BAR_C
-4
-3
-2
-1
0
1
2
3
19
95
.01
19
96
.01
19
97
.01
19
98
.01
19
99
.01
20
00
.01
20
01
.01
20
02
.01
20
03
.01
20
04
.01
20
05
.01
20
06
.01
20
07
.01
20
08
.01
20
09
.01
20
10
.01
20
11
.01
SD_L_GDPR_US_C SD_L_TOUR_US_BAR_C
-3
-2
-1
0
1
2
3
4
19
95
.01
19
96
.01
19
97
.01
19
98
.01
19
99
.01
20
00
.01
20
01
.01
20
02
.01
20
03
.01
20
04
.01
20
05
.01
20
06
.01
20
07
.01
20
08
.01
20
09
.01
20
10
.01
20
11
.01
SD_L_GDPR_UK_C SD_L_TOUR_UK_BAR_C
-4
-3
-2
-1
0
1
2
3
19
95
.01
19
96
.01
19
97
.01
19
98
.01
19
99
.01
20
00
.01
20
01
.01
20
02
.01
20
03
.01
20
04
.01
20
05
.01
20
06
.01
20
07
.01
20
08
.01
20
09
.01
20
10
.01
20
11
.01
SD_L_GDPR_CAN_C SD_L_TOUR_CAN_BAR_C

103
Table 4.4 provides the results of the pattern analysis based on PCS. To determine correlation, multiple lag events should include highly significant correlation values (1% or 5%). This seems to be the case in the correlations between the cycles of the total, US, and Dutch tourism demand to Aruba and their respective business cycles. The PCS in these cases are generally positive, meaning that the cycles of tourism demand move parallel with those of economic development. Moreover, the PCS in these cases are relatively small (between 30% and 45%), possibly indicating that the levels of synchronization are weak. For Barbados, the correlation can be established between the cycles of the total, US and UK markets and their respective business cycles. The PCS are also usually positive, varying between 25% and 60%, suggesting that the levels of synchronization also are weak. The lack of correlation in the other markets and their relevant business cycles (Aruba: Canada and the UK; Barbados: UK) suggest prima facie that these tourism markets do not seem strongly influenced by their own respective business cycle. This may suggest that tourism demand in these markets may be influenced by other factors that possibly weight heavier on the decision of these tourists to travel to, respectively Aruba or Barbados. For example, the fact that a disproportionate number of UK visitors to Barbados stay in villas and upmarket properties (Worrel et al. 2011), may signal an affluent type of tourist, probably more resilient to business cycle fluctuations. The significant PCS at multiple lags is a primary indication of possible lagged reaction of tourism demand cycles to business cycle fluctuations. This can be further tested by looking at the amplitude distances of the cycles.

104
Table 4.4: Pearson's correlation coefficients of cycles R2
Lag = 0 Lag = 1 Lag = 2 Lag = 3 Lag = 4 Lag = 5 Lag = 6 Lag = 7
L_TOUR_TOT_AUA vs. L_GDPR_WOR
0.4206 *** 0.3576 *** 0.2074 0.0118 -0.1725 -0.3044 ** -0.3624 *** -0.3469 ***
L_TOUR_US_AUA vs. L_GDPR_US
0.3260 ** 0.3116 ** 0.2444 * 0.1275 -0.0105 -0.1252 -0.1858 -0.1912
L_TOUR_VEN_AUA vs. L_GDPR_VEN
-0.1458 -0.2853 -0.4229 -0.5274 -0.5650 -0.5000 -0.3068 -0.0674 *
L_TOUR_NED_AUA vs. L_GDPR_NED
0.4452 *** 0.3941 *** 0.3426 *** 0.2864 ** 0.2109 0.1206 0.0138 -0.1170
L_TOUR_CAN_AUA vs. L_GDPR_CAN
-0.0477 0.0597 0.161 0.1311 -0.0470 -0.2195 * -0.2436 * -0.0765
L_TOUR_UK_AUA vs. L_GDPR_UK
-0.2434 * -0.2014 -0.0983 0.0012 0.0494 0.0322 -0.0235 -0.0546
L_TOUR_TOT_BAR vs. L_GDPR_WOR
0.5444 *** 0.4772 *** 0.3656 *** 0.2609 ** 0.1893 0.1424 0.1139 0.0866
L_TOUR_US_BAR vs. L_GDPR_US
0.2539 ** 0.2925 ** 0.2024 0.0935 0.0346 0.0317 0.0544 0.0610
L_TOUR_UK_BAR vs. L_GDPR_UK
0.5982 *** 0.4276 *** 0.2425 * 0.0682 -0.1034 -0.2640 ** -0.3787 *** -0.4169 ***
L_TOUR_CAN_BAR vs. L_GDPR_CAN
-0.0094 -0.0368 -0.0618 -0.0437 0.0117 0.0851 0.1533 0.2033
Note: Data are standardized. ***, ** and ** indicate significance at, respectively, 1%, 5% and 10%.

105
Figure 4.3 discloses the outcome of the (lagged) EDM calculations between the tourism demand cycles and their respective business cycles. In general, two periods of minimum EDMs could be distinguished, namely at zero and at four lags. The lag = 0 cases (Aruba: Total and Dutch markets; Barbados: Total and Canadian markets) suggest, generally, an almost immediate reaction of tourism demand cycles to changes in the business cycles. Contrariwise, the lag = 4 cases (Aruba: US, Venezuelan, Canadian, and UK markets; Barbados: US market) suggest, commonly, a delayed reaction of tourism demand cycles to business cycle fluctuations.
Figure 4.4 provides another calculation of the (lagged) EDMs, this time distinguishing between periods of deterioration and recovery. The results show differences in EDMs between deterioration and recovery periods, indicating asymmetry in the reaction of tourism demand cycles on business cycle changes during both stages. In the case of Aruba, EDMs during deterioration periods were generally higher than during recovery periods, with the exception of Venezuela and the UK. The Barbados case also suggests larger EDMs during deterioration periods than during recovery episodes, with the exception of the US, where the effects of business cycles on tourism demand flow cycles seem more pronounced during recovery periods.
The previous two analyses suggest almost immediate or trailed reactions of tourism demand cycles to business cycle variations, under the assumption that the latter affects the previous. However, the question is whether business cycles actually do influence tourism demand cycles or not. For this purpose, the study tested the causality running from business cycles to tourism demand cycles. To arrive at the causality calculations, the study first tested the variables for stationarity, with the results presented in Table 4.5. The outcomes show that, with the exception of the UK business cycle, all other cycles were integrated of order 1 (I(1)). The implication of these results is that shocks causing cycle developments will have a long memory, suggesting that they may permanently affect the future progress of the series.

106
Figure 4.3: EDM between tourism demand and business cycles (Aruba)
Fig. 3.1.a: EDM Total tourism to Aruba and world GDP, lags 0-7 Fig. 3.1.b: EDM US tourism to Aruba and US GDP, lags 0-7 Fig. 3.1.c: EDM Venezuelan tourism to Aruba and Venezuelan
GDP, lags 0-7
Fig. 3.1.d: EDM Dutch tourism to Aruba and Dutch GDP, lags 0-7 Fig. 3.1.e: EDM Canadian tourism to Aruba and Canadian GDP, lags
0-7
Fig. 3.1.f: EDM UK tourism to Aruba and UK GDP, lags 0-7
1.0
77
28
45
35
1.1
33
24
16
87
1.2
63
22
17
33
1.4
21
31
33
21
1.2
66
43
43
1.6
60
47
08
02
1.7
07
45
68
18
1.7
09
88
53
1
00.20.40.60.8
11.21.41.61.8
0 -1 -2 -3 -4 -5 -6 -7
L_TOUR_TOT_AUA versus L_GDPR_WOR
1.2
22
50
86
13
1.2
22
01
79
5
1.2
62
85
96
07
1.3
39
17
22
51
0.9
12
27
54
2
1.5
21
64
54
16
1.5
78
20
95
37
1.6
06
50
26
11
00.20.40.60.8
11.21.41.61.8
0 -1 -2 -3 -4 -5 -6 -7
L_TOUR_US_AUA versus L_GDPR_US
1.4
52
63
68
47
1.6
03
55
61
79
1.6
16
96
16
26
1.6
63
80
59
87
1.1
83
73
81
81
1.6
76
79
93
12
1.5
99
09
74
98
1.4
86
54
60
48
00.20.40.60.8
11.21.41.61.8
0 -1 -2 -3 -4 -5 -6 -7
L_TOUR_VEN_AUA versus L_GDPR_VEN
1.0
43
57
52
58
1.0
93
06
91
63
1.1
45
67
72
5
1.2
01
75
93
44
1.2
74
50
28
72
1.3
58
45
67
51
1.4
52
11
78
54
1.5
57
16
21
07
0
0.2
0.4
0.6
0.8
1
1.2
1.4
1.6
1.8
0 -1 -2 -3 -4 -5 -6 -7
L_TOUR_NED_AUA versus L_GDPR_NED
1.4
17
56
69
84
1.3
46
56
17
18
1.2
93
57
43
19
1.3
31
39
67
69
1.1
33
24
16
87
1.5
45
48
81
78
1.5
61
03
92
63
1.4
67
87
46
36
00.20.40.60.8
11.21.41.61.8
0 -1 -2 -3 -4 -5 -6 -7
L_TOUR_CAN_AUA versus L_GDPR_CAN
1.5
59
23
62
12
1.5
44
42
91
98
1.4
90
89
52
58
1.4
33
74
15
41
1.2
22
01
79
5
1.4
21
77
11
92
1.4
62
64
50
86
1.4
96
93
58
71
00.20.40.60.8
11.21.41.61.8
0 -1 -2 -3 -4 -5 -6 -7
L_TOUR_UK_AUA versus L_GDPR_UK

107
Figure 4.3: EDM between tourism demand and business cycles (Barbados)
Fig. 3.2.a: EDM total tourism to Barbados and World GDP, lags 0-7 Fig. 3.2.b: EDM US tourism to Barbados and US GDP, lags 0-7 Fig. 3.2.c: EDM UK tourism to Barbados and UK GDP, lags 0-7
Fig. 3.2.d: EDM Canadian tourism to Barbados and Canadian GDP,
lags 0-7
0.9
84
79
30
31
1.0
42
81
15
78
1.1
31
40
79
26
1.2
18
51
83
85
1.6
03
55
61
79
1.3
37
06
64
56
1.3
64
31
94
15
1.3
88
49
93
09
0
0.2
0.4
0.6
0.8
1
1.2
1.4
1.6
1.8
0 -1 -2 -3 -4 -5 -6 -7
L_TOUR_TOT_BAR versus L_GDPR_WOR
1.2
66
43
43
1.2
31
69
26
96
1.2
90
62
00
22
1.3
59
77
48
39
1.0
93
06
91
63
1.4
07
97
74
99
1.4
02
57
75
25
1.4
13
22
17
73
0
0.2
0.4
0.6
0.8
1
1.2
1.4
1.6
0 -1 -2 -3 -4 -5 -6 -7
L_TOUR_US_BAR versus L_GDPR_US
0.9
12
27
54
2
1.0
82
43
31
5
1.2
45
40
30
87
1.3
87
13
86
64
1.3
46
56
17
18
1.6
26
61
04
02
1.7
06
21
71
22
1.7
40
56
77
71
00.20.40.60.8
11.21.41.61.8
2
0 -1 -2 -3 -4 -5 -6 -7
L_TOUR_UK_BAR versus L_GDPR_UK
1.1
83
73
81
81
1.4
26
22
91
4
1.4
37
43
47
1.4
24
69
17
38
1.5
44
42
91
98
1.3
36
19
61
8
1.2
91
50
06
32
1.2
48
50
87
37
00.20.40.60.8
11.21.41.61.8
0 -1 -2 -3 -4 -5 -6 -7
L_TOUR_CAN_BAR versus L_GDPR_CAN

108
Figure 4.4: EDM differences between deterioration and recovery of cycles (Aruba)
Fig. 4.1.a: EDM Total tourism to Aruba and world GDP, lag 1 - 7 Fig. 4.1.b: EDM US tourism to Aruba and US GDP, lag 1 - 7 Fig. 4.1.c: EDM Venezuelan tourism to Aruba and Venezuelan
GDP, lag 1 - 7
Fig. 4.1.d: EDM Dutch tourism to Aruba and Dutch GDP, lag 1 - 7 Fig. 4.1.e: EDM Canadian tourism to Aruba and Canadian GDP, lag
1 - 7
Fig. 4.1.f: EDM UK tourism to Aruba and UK GDP, lag 1 - 7
0
0.5
1
1.5
2
0 -1 -2 -3 -4 -5 -6 -7
L_TOUR_TOT_AUA versus L_GDPR_WOR_DETERIORATION
L_TOUR_TOT_AUA versus L_GDPR_WOR_RECOVERY
0
0.5
1
1.5
2
0 -1 -2 -3 -4 -5 -6 -7
L_TOUR_US_AUA versus L_GDPR_US_DETERIORATION
L_TOUR_US_AUA versus L_GDPR_US_RECOVERY
0
0.5
1
1.5
2
0 -1 -2 -3 -4 -5 -6 -7
L_TOUR_VEN_AUA versus L_GDPR_VEN_DETERIORATION
L_TOUR_VEN_AUA versus L_GDPR_VEN_RECOVERY
0
0.5
1
1.5
2
0 -1 -2 -3 -4 -5 -6 -7
L_TOUR_NED_AUA versus L_GDPR_NED_DETERIORATION
L_TOUR_NED_AUA versus L_GDPR_NED_RECOVERY
0
0.5
1
1.5
2
0 -1 -2 -3 -4 -5 -6 -7
L_TOUR_CAN_AUA versus L_GDPR_CAN_DETERIORATION
L_TOUR_CAN_AUA versus L_GDPR_CAN_RECOVERY
0
0.5
1
1.5
2
0 -1 -2 -3 -4 -5 -6 -7
L_TOUR_UK_AUA versus L_GDPR_UK_DETERIORATION
L_TOUR_UK_AUA versus L_GDPR_UK_RECOVERY

109
Figure 4.4: EDM differences between deterioration and recovery of cycles (Barbados)
Fig. 4.2.a: EDM total tourism to Barbados and World GDP, lag 1 - 7 Fig. 4.2.b: EDM US tourism to Barbados and US GDP, lag 1 - 7 Fig. 4.2.c: EDM UK tourism to Barbados and UK GDP, lag 1 - 7
Fig. 4.2.d: EDM Canadian tourism to Barbados and Canadian GDP,
lag 1 - 7
0
0.5
1
1.5
2
2.5
0 -1 -2 -3 -4 -5 -6 -7L_TOUR_TOT_BAR versus L_GDPR_WOR_DETERIORATION
L_TOUR_TOT_BAR versus L_GDPR_WOR_RECOVERY
0
0.5
1
1.5
2
2.5
0 -1 -2 -3 -4 -5 -6 -7L_TOUR_US_BAR versus L_GDPR_US_DETERIORATION
L_TOUR_US_BAR versus L_GDPR_US_RECOVERY
0
0.5
1
1.5
2
0 -1 -2 -3 -4 -5 -6 -7L_TOUR_UK_BAR versus L_GDPR_UK_DETERIORATION
L_TOUR_UK_BAR versus L_GDPR_UK_RECOVERY
0
0.5
1
1.5
2
0 -1 -2 -3 -4 -5 -6 -7L_TOUR_CAN_BAR versus L_GDPR_CAN_DETERIORATION
L_TOUR_CAN_BAR versus L_GDPR_CAN_RECOVERY

110
Table 4.5: Unit root results of cycles
ADF PP KPSS Int.
L_GDPR_WOR Level L = 4 -2.8491 * -2.7016 * 0.0526 *
First diff.
L = 3 -4.6666 *** -3.3756 ** 0.0363 *
Order of integration I(1) I(1) I(0)/I(1) I(1)
L_GDPR_US Level L = 3 -3.6123 *** -2.5186 0.0524 *
First diff.
L = 3 -3.7043 *** -2.9788 ** 0.0665 *
Order of integration I(0)/I(1) I(1) I(0)/I(1) I(1)
L_GDPR_VEN Level L = 6 -2.8095 ** -4.0443 *** 0.0458 *
First diff.
L = 2 -3.7949 *** -4.2005 *** 0.1496 *
Order of integration I(1) I(0)/I(1) I(0)/I(1) I(1)
L_GDPR_NED Level L = 6 -1.7790 -2.4089 0.0542 *
First diff.
L = 5 -4.5953 *** -3.1956 ** 0.0468 *
Order of integration I(1) I(1) I(0)/I(1) I(1)
L_GDPR_CAN Level L = 3 -2.4041 -3.0627 ** 0.0478 *
First diff.
L = 3 -4.8188 *** -2.6719 * 0.1040 *
Order of integration I(1) I(0) I(0)/I(1) I(1)
L_GDPR_UK Level L = 3 -3.8116 *** -2.8025 ** 0.0534 *
First diff.
L = 3 -4.3967 *** -2.4350 0.0342 *
Order of integration I(1) I(0) I(0)/I(1) I(0)
L_TOUR_TOT_AUA Level L = 3 -4.0132 *** -2.2913 0.1444 *
First diff.
L = 5 -5.8965 *** -2.9500 ** 0.0558 *
Order of integration I(1) I(1) I(0)/I(1) I(1)
L_TOUR_US_AUA Level L = 3 -4.6774 *** -3.4358 ** 0.0303 *
First diff.
L = 5 -5.2061 *** -5.5711 *** 0.0622 *
Order of integration I(0)/I(1) I(1) I(0)/I(1) I(1)
L_TOUR_VEN_AUA Level L = 5 -3.5010 ** -2.4327 0.0637 *
First diff.
L = 1 -6.6873 *** -3.6707 *** 0.0418 *
Order of integration I(1) I(1) I(0)/I(1) I(1)
L_TOUR_NED_AUA Level L = 2 -3.0385 ** -2.1295 0.0742 *
First diff.
L = 1 -6.1805 *** -3.3175 ** 0.0429 *
Order of integration I(1) I(1) I(0)/I(1) I(1)
Note: L = lag. Int. = order of integration. The symbols ***, ** and * indicate, respectively the 1%, 5% and 10% significance levels.

111
Table 4.5: Unit root results of cycles (continued)
ADF PP KPSS Int.
L_TOUR_CAN_AUA Level L = 2 -3.2770 ** -3.0830 ** 0.0656 *
First diff.
L = 1 -11.2700 *** -6.4827 *** 0.3771 **
Order of integration I(1) I(1) I(0) I(1)
L_TOUR_UK_AUA Level L = 6 -2.8121 * -2.5997 * 0.0359 *
First diff.
L = 1 -10.1522 *** -5.2543 *** 0.3810 **
Order of integration I(1) I(1) I(0) I(1)
L_TOUR_TOT_BAR Level L = 3 -3.1824 ** -2.4156 0.1201 *
First diff.
L = 2 -3.6210 *** -3.4550 ** 0.1280 * I(1)
Order of integration I(1) I(1) I(0)/I(1)
L_TOUR_US_BAR Level L = 3 -4.1632 *** -2.8975 ** 0.1011 *
First diff.
L = 3 -5.8693 *** -4.9524 *** 0.4928 ***
Order of integration I(0)/I(1) I(1) I(0) I(1)
L_TOUR_UK_BAR Level L = 3 -4.2437 *** -2.7144 * 0.0533 *
First diff.
L = 3 -4.2695 *** -5.3054 *** 0.0665 *
Order of integration I(0)/I(1) I(1) I(0)/I(1) I(1)
L_TOUR_CAN_BAR Level L = 3 -4.0606 *** -2.7301 * 0.0710 *
First diff.
L = 3 -5.0856 *** -4.4841 *** 0.4050 **
Order of integration I(0)/I(1) I(1) I(1) I(1)
Note: L = lag. Int. = order of integration. The symbols ***, ** and * indicate, respectively the 1%, 5% and 10% significance levels.
Next, the study proceeded to analyze the existence of long-run equilibrium relationships using the ARDL bounds cointegration testing method. The calculation implied using lags based on the lowest Schwarz Bayesian Information Criterion, which according to Pesaran & Shin (1997) performs somewhat better than the Aikaike Information Criterion. The results are revealed in Table 4.6, indicating several instances where the null hypothesis of no cointegration was rejected. This implies that there is a linear combination between the business cycles and the tourism demand cycles for these source markets, suggesting persistent income elasticities of tourism demand in these cases. In the case of Aruba, cointegrating relationships were found for all tourism markets in the sample, with the exception of the Dutch market. The latter suggests that there is no long-run equilibrium relationship between the cycle of the Dutch economy and the Dutch tourism demand cycle for Aruba. One possible explanation could be found in the kind of Dutch visitors coming to the island. Data from the Dutch central

112
bureau of statistics indicate that by end-2013, there were slightly more than 145,000 people of Aruban and Antillean descent living in the Netherlands (http://statline.cbs.nl). Aruba has historically been sending many students to the Netherlands for further education, and many continued to live in that country after their study. All these Dutch residents with Aruban background could possibly still be willing to visit the island even in times of recession in the Netherlands, possibly explaining the lack of a long-run equilibrium relationship between the tourism demand cycle and that of economic activity. According to Croes et al. (2011), the Dutch traveler’s behavior seems to be affected by important events in Aruba, such as carnival, vacations and the Christmas holidays, strengthening the argument that former residents of Aruba may be coming back to visit family on the island. In the case of Barbados, cointegrating relationships were found in the Total and Canadian tourism demand cycles and their respective business cycles, but not for the US and UK markets. The latter result may be an indication that both the US as well the UK markets are upscale markets being less sensitive to business cycles. The above findings on cointegrating relationships provide insights on the long-term linkages between the cycles of tourism demand and economic development in the host country.
Table 4.6: ARDL results
F-statistics
FL_TOUR_TOT_AUA(L_TOUR_TOT_AUA| L_GDPR_WOR) 6.4956 **
FL_TOUR_US_AUA(L_TOUR_US_AUA| L_GDPR_US) 7.2367 ***
FL_TOUR_VEN_AUA(L_TOUR_VEN_AUA| L_GDPR_VEN) 4.5144 *
FL_TOUR_NED_AUA(L_TOUR_NED_AUA| L_GDPR_NED) 3.4589
FL_TOUR_CAN_AUA(L_TOUR_CAN_AUA| L_GDPR_CAN) 5.9112 **
FL_TOUR_UK_AUA(L_TOUR_UK_AUA| L_GDPR_UK) 6.2396 **
FL_TOUR_TOT_BAR(L_TOUR_TOT_BAR| L_GDPR_WOR) 12.3459 ***
FL_TOUR_US_BAR(L_TOUR_US_BAR| L_GDPR_US) 4.2046
FL_TOUR_UK_BAR(L_TOUR_US_BAR| L_GDPR_UK) 2.8412
FL_TOUR_CAN_BAR(L_TOUR_CAN_BAR| L_GDPR_CAN) 5.0715

113
Table 4.6: ARDL results (continued)
Critical values Lower bound (I(0)) Upper bound (I(1))
1% 5.487 6.880
5% 3.947 5.020
10% 3.250 4.237
Note: Critical values are based on Narayan (2005), based on unrestricted intercept and no trend. The critical values for 70 data points are used here in the absence of critical values for 68 observations. ***, **, and * indicate significance at, respectively 1%, 5%, and 10%.
The last analysis aims to determine the causality running from the business cycle of the host countries to the respective tourism demand cycle. Table 4.7 reveals the VAR- and VEC-based causality tests. The VAR-based results for Aruba suggest no causality in the case of the Dutch tourism market, confirming the argument that economic cycles in the Netherlands do not influence tourism demand cycles to Aruba. Alternatively, there is a strong causality in the case of the Total and US markets, while both short- and long-run causalities were present in the case of Venezuela, Canada and the UK markets. The Barbados case shows no causality at all for the US market, but the UK market does show a short-run causality. Additionally, there is a long-run causality present in the case of the Canadian market, while the Total tourism demand shows both a short-run and a long-run causality.

114
Table 4.7: Granger causality test results
Dependent variables VAR-based causality test VEC-based causality test
Short-run (or weak) Granger causalities (Wald
test)
Long-run Granger causality (t-test)
L_GDPR_WOR → L_TOUR_TOT_AUA 0.4457 8.4770 ***
L_GDPR_US → L_TOUR_US_AUA 1.4281 10.8364 ***
L_TOUR_VEN_AUA → L_GDPR_VEN 2.3179 * 12.6549 ***
L_TOUR_NED_AUA → L_GDPR_NED 1.2053
L_TOUR_CAN_AUA → L_GDPR_CAN 2.8096 ** 21.3975 ***
L_TOUR_UK_AUA → L_GDPR_UK 8.6601 *** 18.1297 ***
L_TOUR_TOT_BAR → L_GDPR_WOR 6.7860 *** 4.2189 ***
L_TOUR_US_BAR → L_GDPR_US 1.2860
L_TOUR_UK_BAR → L_GDPR_UK 4.1207 ***
L_TOUR_CAN_BAR → L_GDPR_CAN 1.3367 15.6073 ***
Note: The symbols ***, ** and * indicate, respectively, the 1%, 5% and 10% significance levels.

115
4.5 Conclusion
This study used statistical and econometric techniques and quarterly observations to examine the relationship between business cycles and tourism flows to Aruba and Barbados over the period of the first quarter of 1995 to the fourth quarter of 2011. The study examined four questions: (1) are tourism flow cycles synchronized with business cycles? (2) are business cycles and tourism demand flow cycles cointegrated? (3) is the impact of business cycles on tourism flow cycles permanent or transitory? And (4) are the effects of business cycles asymmetric? The study applied a three pronged approach. First a model with a stochastic cyclical component was determined through the Hodrick-Prescott filter. Second, the previous step was followed by determining the synchronization and volatility of the cycles through an analysis based on PCS and EDM. Finally, a cointegration and causality analysis was conducted to discover the short and long term dynamics between business cycles and tourism flows for Aruba and Barbados.
Four relevant conclusions can be drawn from the results. First, the results suggest that business cycles are variables in their own right impacting to some extent tourism flow cycles in these two island destinations. Overall, business cycles seem to reveal significant similarities with demand flow cycles to both Aruba and Barbados. Total tourism demand in both case studies is synchronized with the world business cycle, revealing that the transmission of effects of the business cycles is rapid. This rapid transmission may be due to the greater openness of these two small island destinations. This finding means that these two destinations should track business cycles as another important determinant of tourism demand together with other influential variables which have been reviewed by the mainstream tourism demand literature (Song et al., 2009).
Second, the impact of business cycles in source countries on tourism demand in the two destinations is heterogeneous. For example, in the case of Aruba, tourism demand cycles are mainly provoked by the US, Dutch and Venezuelan markets, while in the case of Barbados the tourism demand cycles seem prompted by the UK market. Source countries exhibit a distinguished different pattern in terms of their effects on tourism flows, whether to Aruba or Barbados. The response of tourism demand to business cycles also seems heterogeneous. For example, the case of Aruba indicates that the business cycle is procyclical, and reveals intertemporal effects stemming from a delayed reaction of four lags with regard to the majority of its markets (e.g., US, Venezuelan, UK and Canadian markets); only the Dutch market reveals a contemporaneous effects of the tourism cycle. The

116
exception of the Netherlands may be due to the strong presence of ethnic travel between the Netherlands and Aruba. The Barbados case seems to exhibit a different pattern; the Barbados situation indicates that the relationship is countercyclical, and only the US market is permeated by intertemporal effects.
Third, there are differences in the timing of the sensitivity of the response of demand to cyclical fluctuations in economic output in the source country. For example, travel decisions of potential tourists from the US, Venezuela and Canada to Aruba are more likely to be affected by economic fluctuations in their own country four quarters before the travel date, while tourists from the UK seem asynchronously related to the business cycle. In the case of Barbados, the travel decision of US visitors shows similarity with that of Aruba, but the response sensitivity timing in the case of the UK and Canadian markets is the highest one quarter before the date of travel to that island. The latter may suggest short-term decision-making processes.
Third, the results also suggest that economic recovery has a different impact on tourist arrivals than economic contractions. Tourism demand appears to be asymmetrical in each business cycle. Tourism demand for both Aruba as well as Barbados reveals higher values in times of recovery compared to times of contraction. This implies that any forecasting of tourism demand for Aruba and Barbados grounded on a symmetric approach will increase the likelihood of errors in the forecast. Tourism demand seems affected by reduced disposable income of tourists and increase in prices of tourist offerings associated with economic downturns. Reduced levels of demand can affect destinations in different ways, such as reduced profitability of tourist companies, the level of investments and reduced government revenues. In times of economic downturn in the source countries (economic contraction), it seems prudent for destinations to shift the marketing campaign from the conventional marketing approach to account for changes in the travel landscape. For example, special promotional campaigns could focus on reducing the accessibility costs to these two destinations by lowering airport taxes and fees, thus making airfare costs cheaper and affordable.
Finally, the relationship between business cycles and tourism flows is not necessarily co-integrated. Other forces seem to confound this relationship thereby drifting these time series away from each other. The case of Aruba suggest that tourism cycles are prompted by business cycles in the source countries, as all countries with the exception of the Dutch market, are co-integrated. The result supports the hypothesis that income fluctuations in the source countries are a key determinant of arrivals. Consequently, tourism seems to be a key channel through which cycles from source markets may be transmitted. The Barbados case reveals a more

117
complex picture; business cycles from two of its most important markets, namely the UK and the US, seem to drift away from tourist cycles within the destination, suggesting that these markets are less sensitive to economic fluctuations. On the other hand, only Canada reveals a significant long-term impact on demand flows towards Barbados. Additionally, the non-stationary nature of the data in both cases, with the exception of the UK market, suggests that the variability in tourism demand flows provoked by the business cycles in the source markets is persistent. This means that both island destinations are faced with a large degree of uncertainty regarding tourism planning and hence economic planning in the long run.
The implications of the results are three-fold. Policy-making should be informed by accurate assessment of cyclical developments and their relationship with tourism cycles. Neglecting the impact of cyclical developments may have devastating effects on island destinations which are highly dependent on tourism development. The tourism sector of both cases seems vulnerable to deterioration in the source countries. This vulnerability is enhanced due to the high degree of synchronization of the source countries’ business cycles. Barbados seems more vulnerable than Aruba because source countries (especially the UK) display pro-cyclical patterns. This means that tourism flows are higher, on average, when the economy in source countries is expanding and lower when the economy is contracting. Additionally, Barbados is straddled by the almost immediate reactions of the tourism cycle to the business cycle in the source country, leaving little time and policy space to maneuver the effects of the cycles. Aruba, on the other hand, seems to have an ace up its sleeve due to the presence of countercyclical patterns in three countries (particularly in the UK). Thus, the UK market exhibits different cyclical patterns with regard to Aruba and Barbados. Additionally, the most important source markets to Aruba allow time to adjust to the impending situation due to the presence of intertemporal effects.
Finally, the policy implication is that Barbados should pursue a diversification strategy, while Aruba should design a flexible marketing strategy focusing during boom times on the US market, while during deterioration time it should focus more on the Netherlands, UK and Venezuela. Barbados should enhance its market mix by integrating both the US and the Latin American markets as more prominent markets in its portfolio. This market mix may enhance its policy maneuverability trading off recovery and stagnation in the tourism cycle. Diversifying its portfolio of markets may imply that Barbados should look more into its hotel inventory and decide whether to make the presence of time share hotels more prominent in its portfolio. The case of Aruba suggests that the strong presence of a timeshare hotel portfolio has dampened the negative effects of

118
deterioration in the source countries, in particular in the US market (Croes, 2011). The latter market represents about 50% of its total international arrivals.
The suggestion for Aruba to implement countercyclical strategies requires strong institutional practices. Small islands appear to possess weak institutional capacity, while the literature indicates that strong institutions are required to foster development. The lack of strong institutions may stifle the effectiveness of policies that can counter cyclical development. The institutional requirements that are necessary to manage cycles and transmission effects due to tourism consist of practices that include fiscal, financial, and economic conventions that together hoard money in times of growth and provide stimulus in times of deterioration. Additionally, these practices require a proactive perspective of the government in terms of understanding the impact of the cyclical developments, their impact on the economy, and assessing the timing for the required adjustments. It is not clear whether the institutional capacity of small island destinations will be up to the task demanded by tourism being a key transmission channel of international business shocks. Mitigating these shocks is crucial for the economic development of these small island destinations.

119
References Ackerlof, G., & Shiller, R. (2009). Animal Spirits. Brilliance Audio. Aghion, P., & Howitt, P. (1998). Endogenous Growth Theory. MIT Press,
Cambridge, MA. Andrle, M. (2013). What is in your output gap? Unified framework &
decomposition into observables. IMF Working Paper WP/13/15.
Bails, D., & Peppers, L. (1993). Business Fluctuations: Forecasting
Techniques and Applications. Prentice-Hall, Inc. Butter, F.A.G. den, & M.M.G. Fase (1991), Seasonal Adjustment as a
Practical Problem. North-Holland, Amsterdam/New York. Croes, R. (2010). Anatomy of Demand in International Tourism: The Case
of Aruba. Lambert Academic Publishing. Croes, R. (2011). The Small Island Paradox. Tourism Specialization as a
Potential Solution. Lambert Academic Publishing. Croes, R., Rivera, M., Pizam, A., Olsen, E., Lee, S., & Zhong, Y. (2011).
Winning the Future, Strategic Plan for the Development of Tourism. Ministry of Tourism Transportation and Labour.
Dickey, D., & Fuller, W. (1979). Distribution of the estimators for autoregressive time series with a unit root. Journal of the American
Statistical Association, 74(366), 427-431. Engle, R. F., & Issler, J. V. (1995). Estimating common sectoral cycles.
Journal of Monetary Economics, 35(1), 83-113. Farooque, G. (2003). Effects of transformation choice on seasonal
adjustmen diagnostics and forecast errors. Retrieved August 20, 2012, from http://www.fcsm.gov/03papers/Farooque.pdf
Faulkner, B. (2000). “The future ain't what it used to be", Coping with change, turbulence and disasters in tourism research and destination managemen. Professorial lecture delivered on Thursday, 17 August,
Griffith University. Retrieved October 23, 2013, from http://www.griffith.edu.au/__data/assets/pdf_file/0016/314611/faulkner00.pdf
Gaynor, P., & Kirkpatrick, R. (1994). Introduction to Time-Series Modeling
and Forecasting in Business and Economics. McGraw-Hill, Inc., United States.
George, A. (1979). Case Studies and Theory Development: The Method of
Structured, Focused Comparison. In Diplomacy: New Approaches
in History, Theory and Policy (pp. 43-68). New Approaches, New York.
Ghosh, S. (2010). Examining carbon emissions economic growth nexus for india: A multivariate cointegration approach. Energy Policy, 38(6), 3008-3014.

120
Gomez, V. (2001). The use of butterworth filters for trend and cycle estimation in economic time series. Journal of Business &
Economic Statistics, 19(3), 365-373. Gonzalez, P., & Morales, P. (1996). Analysis of tourism trends in Spain.
Annals of Tourism Research, 23(4), 739-754. Gouveia, P., & Rodrigues, P. (2005). Dating and synchronizing tourism
growth cycles. Tourism Economics, 11(4), 501-515. Greenidge, K. (2001). Forecasting tourism demand: An STM approach.
Annals of Tourism Research, 23(4), 739-754. Guizzardi, A., & Mazzocchi, M. (2010). Tourism demand for Italy and the
business cycle. Tourism Management, 31(3), 367-377. Harding, D., & Pagan, A. (2002). A comparison of two business cyle dating
methods. Journal of Economic Dynamics & Control, 27, 1681-1690.
Hecq, A., Palm, F. C., & Urbain, J. P. (2001). Testing for common cyclical
features in nonstationary panel data models (Vol. 15, pp. 131-160). Emerald Group Publishing Limited.
Jafari, Y., Othman, J., & Nor, A. (2012). Energy consumption, economic
growth and environmental pollutants in Indonesia. Journal of Policy
Modeling, 34(6), 879-889. doi:http://dx.doi.org/10.1016/j.jpolmod.2012.05.020
Kozic, I. (2013). Detecting international tourism demand growth cycles. Current Issues in Tourism, 1-7.
Krugman, P. (2009). The Return of Depression Economies and the Crisis of
2008. W. W. Norton & Company, New York. Kwiatkowski, D., Phillips, P., Schmidt, P., & Shin, Y. (1992). Testing the
null hypothesis of stationarity against the alternative of a unit root. Journal of Econometrics, 54, 159-178.
Lijphart, A. (1975). The comparable-cases strategy in comparative research. Comparative Polictical Studies, 8, 158-177.
Makridakis, S., Wheelwright, S., & McGee, V. (1983). Forecasting:
Methods and Applications. John Wiley & Sons, Inc. Moore, W., & Whitehall, P. (2005). The tourism area lifecycle and regime
switching models. Annals of Tourism Research, 32(1), 112-126. Morley, J., & Piger, J. (2012). The asymmetric business cycle. The Review
of Economics and Statistics, 94(1), 208-221. Narayan, P. (2011). Are shocks to tourism transitory at business cycle
horizon? Applied Economics, 43(16), 2071-2077. Narayan, P., & Smyth, R. (2005). Electricity consumption, employment and
real income in Australia Evidence from multivariate Granger causality tests. Energy Policy, 33(9), 1109-1116.

121
Ozturk, I., & Acaravci, A. (2013). The long-run and causal analysis of energy, growth, openness and financial development on carbon emission in Turkey. Energy Economics, 36, 262-267.
Pao, H., Fu, H., & Teng, C. (2012). Forecasting of CO2 emissions, energy consumption and economic growth in China using an improved Grey model. Energy, 40, 400-409.
Pesaran, M., & Shin, Y. (1997). An autoregressive distributed lag modelling approach to cointegration analysis. Retrieved April 15, 2013, from http://www.google.com/url?sa=t&rct=j&q=&esrc=s&frm=1&source=web&cd=1&ved=0CDQQFjAA&url=http%3A%2F%2Fciteseerx.ist.psu.edu%2Fviewdoc%2Fdownload%3Fdoi%3D10.1.1.153.3246%26rep%3Drep1%26type%3Dpdf&ei=oOFrUbfIMJLy9gSalYDACg&usg=AFQjCNH2-FMUeb_0oeztx4mpMCMNDMyI
Pesaran, M., Shin, Y., & Smith, R. (2001). Bound testing approaches to the analysis of level Relationships. Journal of Applied Econometrics,
16(3), 289-326. Phillips, P., & Perron, P. (1988). Testing for a unit root in time series
regression. Biometrica, 75(2), 335-346. Picci, L. (2001). Explaining long-and short-run interactions in time series
data. Journal of Business & Economic Statistics, 19(1), 85-94. Plosser, C. (1989). Understanding real business cycles. The Journal of
Economic Perspectives, 3(3), 51-78. Ridderstaat, J., Croes, R., & Nijkamp, P. (2014a). The tourism development-
quality of life nexus in a small island destination. Journal of Travel
Research,DOI: 10.1177/0047287514532372. Ridderstaat, J., Oduber, M., Croes, R., Nijkamp, P., & Martens, P. (2014b).
Impacts of seasonal patterns of climate on recurrent fluctuations in tourism demand: Evidence from Aruba. Tourism Management, 41, 245-256.
Romer, D. (2001). Advanced Macroeconomics (2nd ed.). McGraw-Hill. Sami, J. (2011). Multivariate cointegration and causality between exports,
electricity consumption and real income per capita: Recent evidence from Japan. International Journal of Energy Economics and Policy,
1(3), 59-68. Schelling, T. (2006). Micromotives and macrobehavior. WW Norton &
Company. Schulmeister, S. (1979). Tourism and the Business Cycle. Austrian Institute
for Economic Research. Smeral, E. (2012). International tourism demand and the business cycle.
Annals of Tourism Research, 39(1), 379-400.

122
Song, H., Dwyer, L., & Zhengcao, L. (2012). Tourism economics research: A review and assessment. Annals of Tourism Research, 39(3), 1653-1682.
Song, H., Witt, S., & Li, G. (2009). The Advanced Econometrics of Tourism
Demand. Routledge. Vahid, F., & Engle, R. F. (1993). Common trends and common cycles.
Journal of Applied Econometrics, 8(4), 341-60. Wong, K. (1997). The relevance of business cycles in forecasting
international tourist arrivals. Tourism Management, 18(8), 581-586. Worrel, D., Belgrave, A., Grosvenor, T., & Lescott, A. (2011). An analysis
of the tourism sector in Barbados. Economic Review, XXXVII(1), pp. 49-78.
Yin, R. (2009). Case Study Research: Design and Methods. Sage Publications, Newbury Park, CA.