Embed Size (px)
Citation preview

85
4. Lake Volta, Ghana
4.1 INTRODUCTION TO THE LAKE VOLTA REVIEWThe completion of the Akosombo Dam on the Volta River in 1964 resulted in the creation of an immense reservoir (Lake Volta) with a length of 520 km and covering about 8 500 km2, or 3.2 percent of Ghana’s total land area (Figure 46). The reservoir stores about 149 billion m3 (149 km3) of water. Although Lake Volta itself lies entirely in Ghana, the Volta River system is shared by six West African countries: Benin, Burkina Faso, Côte d’Ivoire, Ghana, Mali and Togo. The main aim of constructing the dam was to produce electricity, but the reservoir’s fisheries were soon recognized to be of significant socio-economic importance to Ghana. A large fishery developed, upon which some 300 000 fisherfolk depend for their livelihood (Braimah, 2003). According to FAO statistics, inland capture fisheries contributed 27 percent of total Ghanaian fish production in 2009 (FAO FishStat Plus). It is estimated that the reservoir provides 90 percent of national freshwater fish production (Abban, 1999). The reservoir also facilitates the transportation of goods and passengers and the provision of services, linking different parts of the country.
Because of the important contributions of the fishery to socio-economic development in Ghana, the Government of Ghana has undertaken efforts to sustain and enhance fish production from Lake Volta. Notable among these were the establishment of Volta Lake Research and Development Project in the 1960s and its related research projects through the 1960s, 1970s and 1980s, followed by the institution of the United Nations Development Programme (UNDP) project Integrated Development of Artisanal Fisheries (IDAF) from about 1989 to the late 1990s. A major objective of both projects was to establish community fishery centres. The Volta Lake Research and Development Project established the first of these at Kpando, and the IDAF completed
Courtesy: CSIR Water Research Institute, Ghana.

Review of tropical reservoirs and their fisheries86
about 90 percent of the second at Yeji. The community fishery centres were meant to facilitate fish processing and trade by providing various facilities to operators and supporting the collection of fishery data, including information on commercial fish species in segments of the reservoir.
FIGURE 46The Volta Basin, showing political boundaries and important tributaries
Source: Andah and Gichucki, 2003.
FIGURE 47Fish landings in Ghana by origin, 1950–2006
Source: FAO statistics.
1950 1955 1960 1965 1970 1975 1980 1985 1990 1995 2000 2005
Year
0
100 000
200 000
300 000
400 000
500 000
600 000
Land
ings
(to
nnes
)
0
10
20
30
40
50
Freshwater landings
Marine landings
Proportion of landingsfrom freshwater
Pro
port
ion
of la
ndin
gs fr
om fr
eshw
ater
(%
)

Lake Volta, Ghana 87
The landings of freshwater fish in Ghana were officially estimated to be 75 000 tonnes in 2006 and formed 20 percent of the total fish landings from the country (Figure 47). The estimated landings for Lake Volta are probably greatly underestimated. De Graaf and Ofori-Danson (1997) estimated the catch to be between 150 000 and 200 000 tonnes/year (180–240 kg/ha). Other, unpublished, catch estimates based on reservoir-wide catch-assessment surveys and frame surveys proposed that the reservoir produced 217 000–251 000 tonnes in 2000 (Braimah, 2000, 2001, 2003 in Béné, 2007; see discussion in Chapter 5).
4.2 PHYSICAL FEATURES: GEOGRAPHY, WATER, CLIMATE, SOILSThe Volta River Basin occupies 417 382 km2 in six countries (Figure 46). The basin drains 70 percent of Ghana, which occupies 42 percent of the basin. Basin elevations range from sea level to 920 m above sea level, with a mean elevation of 257 m and correspondingly low channel grades. The lower Volta River is fed by three major tributaries. To the west, the Black Volta River, or Nakambe River, drains 147 000 km2, mostly of western Burkina Faso with small areas of Mali and Côte d’Ivoire. The White Volta River, or Nazinon River, drains 10 000 km2 including much of northern and central Ghana and Burkina Faso. To the east, the Oti River drains 72 000 km2 of northwestern Benin and Togo. The three tributaries join in northern Ghana to form Lake Volta.
The basin is primarily underlain by a Voltarian formation consisting of sandstone, shales and mudstones. Another formation is Precambrian, classified into Birimain, Buem and Tarkwaian rocks (Dickson and Benneh, 1977). Parts of the Afram, Pru and Tain sub-basins to the west of Lake Volta are characterized by semi-deciduous forest, while the remainder of the basin supports interior savannah and woodland. The soils of the semi-deciduous forest area are forest ochrosols, which are alkaline and well drained. The soils are groundwater laterites and savannah ochrosols in the savannah and woodland.
The Volta Basin has at least four climatic zones, from lowland rainforest in the south, where annual precipitation can exceed 2 000 mm, to Sahel-Sudan in the north, where average rainfall is well below 1 000 mm per year and potential evaporation is considerably higher. Basin-wide, rainfall averaged 1 025 mm per year from 1936 to 1963, of which roughly 9 percent becomes river discharge as measured by Akosombo Dam outflows. Climatic patterns are strongly influenced by the movement of the intertropical convergence zone, which generates unimodal as well as bimodal rainy seasons. The north has only one wet season, from May to November, with peak rainfall occurring in September. In the south, there are two rainy seasons, with peaks in June–July and September–October. Mean annual temperatures approach 30 °C, and humidity varies between 90 percent in coastal areas to below 20 percent in the north during the harmattan (northeasterly winds). The harmattan, typically occurring from December to February, brings hot, rainless conditions and haze originating in the Sahara. In January or early February, Lake Volta lies wholly within harmattan-affected areas, with dry, warm days and cool nights. In June and July, easterly winds predominate over the reservoir, bringing squally thunderstorms and heavy precipitation. By August, the whole reservoir comes under the influence of the moist southwesterly to southeasterly monsoon, with prolonged light rain. The very cold harmattan winds in the dry season in January and the heavy rains together with the southwesterly monsoon from June to September cause lower water temperatures and mixing of the waters (Ewer, 1966; Biswas, 1969; Viner, 1969). Reservoir stratification takes place from April to June.
Small changes in precipitation in the basin bring proportionately large changes in runoff. Volta Basin runoff, therefore, exhibits higher temporal variability than does basin rainfall. After 340 km3 is precipitated (or 85 percent of the average annual rainfall), roughly half of the precipitation volume becomes discharge. Mean basin yield

Review of tropical reservoirs and their fisheries88
was about 35 km3/year in 1936–1963, prior to the closing of the Akosombo Dam, and 31 km3/year in 1967–1998.
Climatologists in Ghana and the Institute for Meteorology and Climate Research – Atmospheric Environmental Research in Garmisch-Partenkirchen, Germany, are investigating probable delays in the onset of the rainy season over the past several decades, which have been widely reported by farmers in the basin. This is an issue of great concern given the likelihood of altered rainfall patterns as a consequence of changes in global air circulation (Kunstmann and Jung, 2004).
4.3 WATER LEVEL AND RESERVOIR AREA Lake Volta is fed by numerous tributary rivers to the Volta River, all of them rainfed. Thus, the volume of water in the reservoir and the area shrinks during the dry season and swells during the rainy season. After the closure of the dam in 1964, the reservoir filled in about three years and reached its maximum recorded level of 85 m above sea level in 1976 (Figure 48). After 1976, the water level started to drop, reaching its lowest limit of 72 m in 1984 after the severe drought in 1983. Water levels started to rise again, regaining maximum levels in 1989 and 1992 and subsequently dropping. Over the whole period from 1966 to 2006, water levels have steadily decreased by an average of about 15 cm per year, but with distinct periods of lows and highs; from 1967 to 1981 the reservoir level was on average 81 m, or 5 m higher than in the subsequent period to 2006.
FIGURE 48Reservoir levels at Akosombo
Note: The graph show monthly average water levels (masl) relative to the long-term mean of 78 m since November 1965 (main graph line with markers) and monthly average absolute water levels since the closing of the dam in January 1964 (inset). Also shown is the trend line for 1964–2005, indicating that average reservoir levels are now 5 m lower than in the 1970s. The average level between 1967 and 1981 was 81 m, dropping to an average of 76 m from 1982 to 2006.Source: Based on data from the Volta River Authority.
There is a large inflow of water into the reservoir in August and it attains its highest level in August–September. Spillage is always carried out in September. The water level starts falling in October–November, with the onset of the harmattan in the catchment area, and generally reaches its lowest level in May–July. The difference in seasonal
J65 66 67 68 69
J70 71 72 73 74
J75 76 77 78 79
J80 81 82 83 84
J85 86 87 88 89
J90 91 92 93 94
J95 96 97 98 99
J00 01 02 03 04
J05
-7
-6
-5
-4
-3
-2
-1
0
1
2
3
4
5
6
7
Mon
thly
rel
ativ
e re
serv
oir
leve
l at A
koso
mbo
(m
)
0
10
20
30
40
50
60
70
80
90
20.12.62 11.6.68 2.12.73 25.5.79 14.11.84 7.5.90 28.10.95 19.4.01 10.10.06

Lake Volta, Ghana 89
minimum and maximum levels per year is high, varying between 1.5 m in 1972 and 7.8 m in 1989, with an average of 3.7 m since 1967. Decadal seasonal variation in rising water levels has increased from 2.6 m (ten-year moving average 1969–1978) to 4.6 m (1987–1996) and has recently been 4.1 m (1997–2006). The ten-year moving average of receding levels ranged from 2.4 m to 3.7 m in the first two decades, rose to 4.9 m in the 1980s and has recently been 4.2 m (Figure 49). Thus, seasonal variation has increased since the early 1980s as the average water level has dropped.
Large parts of the reservoir area can be characterized as lacustrine with a strong riverine influence. This is particularly the case in the northern areas where confluence takes place. In fact, in these areas, receding water exposes the original riverbanks, allowing the original river bed to be recognized. This is a slow process that starts at the upper end of the reservoir above the confluence of the White Volta and Black Volta Rivers, moving gradually southwards with falling water levels. The inundated riverbanks, which are several times the size of the original river in surface area, show all the characteristics of a floodplain, and the area involved depends on the annual and decadal reservoir fluctuations.
FIGURE 49Seasonal variation in water level in Lake Volta, 1966–2006
Note: For both the inundation (top) and recession (bottom) series, a ten-year moving average is shown at year 5 (e.g. the point 1970 shows the average seasonal variation between 1966 and 1975). By multiplying the annual change in water level by 320 km2, one can obtain an estimate of the area that is inundated or becomes available during a flood cycle.Source: Based on data from the Volta River Authority.
Most publications give Lake Volta’s area at about 8 500 km2. However, the reservoir is situated in areas with relatively low differences in elevation, such that the large overall variations of 13 m and seasonally of 1.5–8 m can cause the area of inundation to
1965 1970 1975 1980 1985 1990 1995 2000 2005
0
1
2
3
4
5
6
7
8Ann
ual m
ax (
prev
ious
yea
r) -
min
res
ervo
ir le
vel (
m)
Annual variation in reservoir level (m) 10-year moving average
Receding waters
0
1
2
3
4
5
6
7
8
Ann
ual m
ax -
min
res
ervo
ir le
vel (
m)
Inundating floods

Review of tropical reservoirs and their fisheries90
be highly variable. Indeed, elevation models of the topography of the area (Tanaka et al., 2002) have yielded estimated areas of 9 970 km2 at the maximum level of 84 m and of 4 450 km2 at 76.2 m in February 1995, when the lowest recorded level of 71.8 m was reached, for a difference of 5 520 km2, or approximately 700 km2 per vertical metre. This estimate seems to be too high, and it is not clear from the report whether groundtruthing took place. Vanderpuye (1984) reported a time series of reservoir levels, reservoir volumes and reservoir areas from 1971 to 1982, with water levels between 75.5 and 84.1 m. Reservoir area and level are correlated whereby a change of 1 m in water level brings a change of 320 km2 in reservoir area, or about half of the Tanaka et al. (2002) report. Vanderpuye (1984) claims that a drop of about 3.4 m renders at least 800 km2 of land in the ecotone available for agriculture. However, his time series over the 11 years examined shows a median of 690 km2 and a range of 61–1 620 km2 of land becoming available after recession. Vanderpuye’s estimates are used in further discussion on the impacts of change and variability in water level.
Assuming that the linear relation found by Vanderpuye (1984) of 320 km2 in area per metre change in water level still holds over the time series between 1965 and 2006 (minimum 71.9 m, maximum 84.2 m) the median land area becoming available after the waters have receded is 640 km2 (maximum 1 860 km2 , minimum 115 km2). Conversely, in the same period, a median of 610 km2 of land was inundated by rising waters (maximum 1 420 km2, minimum 270 km2). These figures indicate a huge impact on the shape and productivity of the reservoir resulting from variability in the annual flood pulse. Although the flood pulse concept was developed for rivers (Junk, Bayley and Sparks, 1989), it can also be applied to river-driven reservoirs like Lake Volta. Land becomes available each year over a period of eight to nine months between October–November and June–July. Inundation again takes place in the subsequent three to four months. Productivity estimates of the reservoir need to take account of this highly pulsating ecotone, as the floodplains that are exposed when water recedes are used for agriculture and animal grazing. No data are available, but it can be expected that many agricultural effects, such as treading by cattle and deposition of cow dung, will stimulate the release of nutrients during subsequent inundations.
The proportion of land inundated after a recession can serve as an index of the strength of the flood pulse and be indicative of peaks and troughs in reservoir productivity. Assuming again the linear relation by Vanderpuye (1984), a simple index is:
Inundation index (Ii) = inundated area in yeart × 100/receded area in yeart As not enough information is available on the actual area of land inundated
by the flood or made available during recession, the increase in water level (m)/decrease in water level in the previous period (m), or inundation index (Ii) can be used as a proxy (Figure 50). In 1965–1970, during the filling phase of the reservoir, Ii was > 100 percent (the area of land inundated exceeded the area uncovered in the previous recession), which was higher than in other periods. Since 1970, 35 percent of the years have had an Ii > 100 percent, so once every two to three years more than 100 percent of the land that dried out during the previous recession again became flooded. In the six years since 2000, this happened twice. Peaks in the inundation index, and in particular extreme peaks as in 1999 and 2003, can be expected to bring important pulses of productivity and may be indicative of fish recruitment peaks. In the next section, it will be shown that the riverine waters causing the flood pulse are poor in nutrients. The high productivity of the reservoir can be attributed to the annual flooding of large tracts of land, as the riverine and reservoir waters are relatively low in nutrient concentrations (see below). The large annual variations in flooding, including years in which no recession takes place, suggest that the annual production of fish may vary accordingly.

Lake Volta, Ghana 91
FIGURE 50Inundation index of Lake Volta
Note: The inundation index is calculated as the rise in water level (m) in yeart divided by the fall in water level between yeart-1 and yeart (as in Figure 49) times 100. Ii > 100% represents a net increase in inundated area of land. A more realistic index would be defined if the actual area of inundation and recession were known for each metre of rise and fall between the lowest and highest water levels recorded.Source: Based on data from the Volta River Authority.
4.4 PHYSICOCHEMICAL AND LIMNOLOGICAL FEATURES OF RESERVOIR PRODUCTIVITY4.4.1 Water quality Generally, the nutrient level of the reservoir is very low. This is attributed to a catchment area that is poor in nutrients and the low solubility of the Precambrian granites in the upper catchment area (Antwi, 1990). Only traces of phosphate, nitrate, nitrite, ammonia and sulphate have been recorded in the upper 40 m of the reservoir, while measurable quantities of these ions were recorded in the bottom waters. Physicochemical data collected by Antwi (1990) at Ajena in 1989, 25 years after the closure of the dam, are summarized in Table 20. The observations are comparable with those of earlier research by Biswas (1966a) and Obeng-Asamoah (1984). A study by Ofori-Danson and Ntow (2005) in the Yeji sector, or stratum VII (Figure 51), concluded that, as in Lake Volta’s early life, the water is oligotrophic, with low concentrations of nitrates, ranging from 0.51–0.82 mg/litre, nitrites (0.02–0.05 mg/litre) and phosphates (0.34–0.41 mg/litre) (Table 21). Sodium (Na+) was the dominant ion, with a mean concentration of 12.1 mg/litre. Generally, the ionic dominance pattern recorded was calcium (Ca+) > sodium > potassium (K+) > chlorine (Cl-) > magnesium (Mg2+). Obeng-Asamoah (1984) noted that the pH of the surface water was about 7.0, declining with depth to 6.5 in the anoxic water near the bottom of the reservoir. Total alkalinity increased during the filling and post-impoundment phases (Biswas, 1966b) and total alkalinity of 41 mg calcium carbonate (CaCO3)/litre was observed in 1989. Tables 20 and 21 indicate that differences exist in the reservoir on the north–south axis in pH, salinity, nutrients, conductivity, total dissolved solids and primary and secondary production, with the northern part of the reservoir being more riverine in character.
All authors cited indicate that the reservoir is warm polymictic. Stratification is fairly stable in April to June, but is frequently broken down during the rest of the
1965 1970 1975 1980 1985 1990 1995 2000 200530
100
1 000
9 000P
erce
ntag
e ar
ea o
f inu
ndat
ion
afte
r pr
evio
us y
ear’s
rec
essi
on
Inundation index = % inundation area/recession area

Review of tropical reservoirs and their fisheries92
year by the southerly and harmattan winds and annual floods. The action of southerly winds blowing up the Akosombo Gorge mixes the water. Such winds tend to drive the surface layers northward, drawing the anoxic, iron-rich bottom waters to the surface. This is reflected in the high iron content throughout the water mass. During the flood periods, transparency is low, especially in the north owing to the progressive increase in colloidal suspended matter such as clay, silt and fine organic particulates washed into the reservoir by rain runoff. Mixing also causes the water to be turbid, limiting transparency. It is not clear from the reports whether algal blooms occur after resuspension of nutrient-laden water in the epilimnion.
Inflows from the Black Volta and White Volta Rivers to the upper reaches of the reservoir cause constant turbulence, which is especially noticeable in the rainy season. With the start of the first wet season in April, large quantities of suspended, dissolved
TABLE 20Physicochemical data at Ajena, near Akosombo Dam of Lake Volta, 1989
Depth (m)Parameter 0 1 5 10 15 20 30 40 50 60 70
Temperature (°C) 29.1 28.7 28.6 28.1 27.8 27.5 26.8 26.7 26.5 26.1 26.1pH 7.0 7.1 7.1 6.9 6.9 6.9 6.7 6.7 6.7 6.6 6.6Oxygen (mg/litre) 11.8 8.5 8.8 7.5 5.9 5.0 4.6 3.0 2.2 1.8 0.4Oxygen (% saturation) 138.1 110.8 87.1 86.7 67.0 60.0 49.4 35.7 24.5 17.7 5.9Acidity (mg/litre CaCO3) 16.8 16.9 17.8 17.7 17.7 18.5 18.2 19.1 19.6 20.8 24.1Alkalinity (mg/litre CaCO3) 40.8 40.7 40.6 41.5 42.4 40.4 41.1 42.8 41.8 40.3 39.9Total hardness (mg/litre CaCO3) 27.1 27.3 27.9 26.9 28.0 25.8 29.1 31.3 28.9 29.9 26.1TDS (mg/litre) 34.9 35.1 37.0 37.9 34.5 33.9 34.2 34.7 35.4 35.2 30.8Conductivity (μS/cm at 25 °C) 68.8 67.9 74.8 64.8 67.3 68.7 69.6 68.6 71.2 72.6 75.1Sodium (mg/litre) 3.9 4.0 4.2 4.0 3.8 4.0 3.9 3.8 3.8 3.1 3.8Potassium (mg/litre) 2.1 2.3 2.4 2.0 2.6 2.3 1.9 2.0 2.0 2.2 3.0Calcium (mg/litre) 5.1 5.8 5.8 5.4 5.4 5.5 5.1 6.0 5.8 6.0 6.1Magnesium (mg/litre) 4.2 4.0 4.2 4.1 4.6 3.8 4.7 5.2 4.4 3.9 3.5Chloride (mg/litre) 7.7 7.5 7.7 7.5 7.6 7.5 7.6 7.6 7.6 7.3 7.3Orthophosphate (μg/litre) 3 4 2 3 7 4 6 8 18 27 240Nitrate (μg/litre) 50 40 70 40 40 50 80 110 130 180 190Nitrite (μg/litre) 5 13 6 6 6 40 20 20 90 90 50Ammonium (μg/litre) 10 20 10 10 2 6 40 50 100 110 270Silicate (mg/litre) 3.1 3.1 3.1 3.0 3.0 3.3 3.7 3.4 2.8 3.5 5.4Sulphate (mg/litre) 0.2 0.6 0.4 0.3 0.3 0.4 0.3 0.7 0.7 0.8 6.2Secchi disc depth (cm) 220
Note: Values are means over the sampling period of February–December 1989, with samples taken monthly.Source: Antwi, 1990.
TABLE 21Mean values of limnochemical parameters, Yeji sector of Lake Volta (VII), February 1995–January 1996
Limnochemical factor
Depth (m)0 2 6 10 14
Temperature (°C) 31.0 30.0 29.5 29.4 29.3pH 7.2 (7.3) 7.2 7.0 6.9 (6.9) 6.7DO (mg/litre) 8.1 7.9 7.2 6.5 5.2O2 saturation (%) 108.9 103.9 94.1 85.2 67.5BOD (mg/litre) 3.9 na na na naAlkalinity (mg/litre CaCO3) 44.3 (35.7) 44.3 41.7 40.2 (37.3) 38.5TDS (mg/litre) 25.2 25.8 25.0 24.5 23.8Conductivity (μS/cm) 84 79 76 76 80Sodium (mg/litre) 12.1 (4.6) 9.6 11.0 12.1 (4.5) 11.7Phosphate (mg/litre) 0.41 (0) 0.34 0.36 0.50 0.39Nitrate (mg/litre) 0.51 0.63 0.66 0.82 0.97Nitrite (mg/litre) 0.02 (0.02) 0.02 0.02 0.02 0.05Ammonia-nitrogen (mg/litre) 0.83 (0.08) 0.33 0.36 0.57 (0.08) 0.43Secchi disc depth (cm) 50.2
Note: Comparative values recorded in 1968–1970 by Czernin-Chudenitz (1971) are in parentheses (number of samples and variability not given). na= not available.Source: Ofori-Danson and Ntow, 2005.

Lake Volta, Ghana 93
and colloidal organic matter enter the reservoir with the turbid river water and reduce the Secchi disc depth to a minimum of 21 cm in October. Later, there is a gradual increase in Secchi disc depth, reaching a maximum of 81 cm in February as the dry season sets in, suggesting a gradual loss of suspended matter as it settles on the reservoir bottom. Transparency increases further with the loss of the seasonal algal blooms in the dry months. Ofori-Danson and Antwi (1994) recorded a Secchi disc depth of 220 cm in the gorge area in 1990. Ntow (2003) measured a mean Secchi disc depth of 50 cm and asserted that it had decreased from previous years. In the Yeji area (also called stratum VII), Secchi disc depth measurements for July 1968–July 1980 ranged from 35 cm to 260 cm, with a mean of 134 cm (FAO, 1971). More recent measures indicate Secchi disc depth of 50 cm at stratum VII (Viner, 1990). Although all measurements fall in the range measured by FAO (1971), the later measurements by Ntow and Viner are described as decreased transparency, which are perhaps a result of increased colloidal suspended particles rising from sediments at the reservoir bottom. Biswas (1966b) observed that the depth of light penetration was drastically reduced during the flood period of July–September and the harmattan season. Increases in turbidity are regarded by Ofori-Danson and Ntow (2005) as a major constraint on primary production and potential fish yield.
Turbidity brings high oxygen saturation levels of greater than 100 percent at the surface, possibly restricting primary production by limiting light penetration. Ewer (1966) and Viner (1966 unpublished, reported in Entz [1969]) have shown that the well-oxygenated zones of the reservoir that are suitable habitats for fish were restricted to the uppermost 5–10 m in depth. No large seasonal variation in the oxygen content was observed. Very low oxygen levels were measured earlier in the reservoir’s history and were attributed to the inundated area not having been cleared of vegetation, leaving gigantic quantities of organic material to rot once submerged. The difference in temperature between the surface and bottom is narrow, at only 1.7 °C, with practically no thermal stratification in the Yeji sector of the reservoir. This suggests the mixing of surface and deeper layers, thereby enhancing oxygen availability at deeper levels, thus enabling fish to live in all sectors of the water column.
Potential fish yields were estimated using the morpho-edaphic index model (MEI = total conductivity in microsiemens per centimetre over mean depth in metres) (Ryder, 1965, 1982; Welcomme, 1972; Henderson and Welcomme, 1974). According to Ofori-Danson and Ntow (2005), the potential fish yield of Lake Volta declined from 32.8 kg/ha in 1974 (27 880 tonnes at 8 500 km2) to 29.0 kg/ha (24 650 tonnes) in 1995/96. Although these calculated figures from the MEI are lower than any reported production figures based on landings estimates, the “decline” is attributed to limnological changes in the reservoir, notably increased turbidity. Current productivity estimates based on total landings may be as high as 295 kg/ha (see Section 4.5), or up to tenfold higher than the estimates calculated using the MEI. As nutrient concentrations can be low owing to rapid absorption by phytoplankton, standing concentrations and associated conductivity estimates are of limited value for estimating productivity. Ideally, nutrient loadings should be quantified. As standing concentrations are extremely low, organic eutrophication is not a problem in Lake Volta at this stage. The limnochemical characteristics of the reservoir are affected by climatic, hydrological and internal factors that show large fluctuations. Secondary and higher biological production characteristics are subject to regulatory hydrophysical and biological processes, causing fluctuations in local zooplankton, zoobenthos and fish population abundance and seasonal, patchy distributions of these biota.
4.4.2 Phytoplankton, zooplankton and primary productivityLimited work has been carried out on estimating primary productivity through the composition and abundance of phytoplankton and zooplankton. Work done by Viner

Review of tropical reservoirs and their fisheries94
(1969, 1990) indicated that phytoplankton were uniformly distributed in the water column at Ajena, in the southern part of the reservoir, but were limited in abundance further north at the Afram confluence, Kpando and Kete Krachi. Bacillariophyta were more dominant at the southern stations, while cyanophytes were dominant further north. Chlorophyta were more abundant north of Kpando, while along the Oti River arm of the reservoir, north of Kete Krachi, cyanophytes were dominant. At Ampem – again further north, where the reservoir was shallow – bacillariophytes, cyanophytes and chlorophytes were dominant. No data are available after these 1965–66 reports. Light penetration could be responsible for the marked differences in phytoplankton composition along the various axes of the reservoir, but no information on transparency is available to assess this.
Phytoplankton abundance varied between the dry and rainy seasons (Biswas, 1966a). Phytoplankton growth was prolific in dry seasons and slower in rainy seasons. Plankton abundance in the southern part of the reservoir was low, as was the number of species (Rajagopal, 1969). More than 20 species confined to 10 genera were identified. The most abundant genera were Synedra and Melosira for the main channel, while Oscillatoria dominated the shallow arms and inshore areas. Eudorina and Volvox also occurred in relatively large numbers and algal blooms were observed only occasionally in some areas (Obeng-Asamoah, 1984). As observed by Biswas (1966a), rotifers formed the major constituent of zooplankton (90 percent) while copepods, cladocerans and protozoa were present in much smaller numbers (Obeng-Asamoah, 1984).
Estimates of primary productivity were undertaken using the light and dark bottle method. The daily values ranged from 0.8 to 5.2 g C/m3 in different regions of Lake Volta (a daily value of 5.2 g C/m3 would indicate that the reservoir is not oligotrophic). It was noted that a similar range of values was found in various Ugandan lakes (Talling, 1963). Low daily values of 0.8–1.8 g C/m3 were found in Lake Bunyoni, moderate daily values of 2.0–4.0 g C/m3 in Lake Edward, and high daily values of 4.0–6.0 g C/m3 in Lake George. Both moderate and high values have also been found in different parts of Lake Victoria. Gross primary productivity measurements at the surface of Lake Volta at Ajena showed that daily values were low, ranging from 0.2 to 1.35 g C/m3. Antwi (1990) ascribed this to limited nutrients.
4.5 FISH AND FISHERIES OF LAKE VOLTA4.5.1 Estimates of catchFish landings from Lake Volta have been recorded since the formation of the reservoir in 1965, when the Volta Lake Research and Development Project introduced a recording system that focused on landings of processed fish at central trading places around the reservoir (Table A2.1). Lake Volta is subdivided into eight strata (Figure 51) (Evans and Vanderpuye, 1973). In every stratum, a number of periodic markets – 32 in total for the whole reservoir, most of them operating every four days – are set up to trade in fresh and processed fish. Most fish is processed, as smoked, salted, dried or fermented (known as momone and mainly consisting of elephant fish [Mormyridae]) products. Fish is brought to these markets by boat, packed in baskets. The importance of a market is limited where a small number of baskets of fish, fewer than ten or so, are bartered for food and fuelwood. Large markets have more than 1 000 baskets of fish sold for cash each day. The main weekly markets around the Lake Volta are at Buipe, Yeji, Makango, Dambai, Kwamekrom, Tapa-Abotoase, Kpandu-Tokor, Dzemeni and Ampem. At each of these main markets, at least one recorder is available to monitor landings. A summary of landings from these nine markets was made annually until 1977, when the project ended. Since then, data have been collected and sent to the regional fisheries offices, but no reservoir-wide summaries have been made and no checking of local recorders has taken place, allowing the quality of the data to

Lake Volta, Ghana 95
deteriorate. Landing estimates are based mostly on basket size and fullness. In Yeji, the project system was used until June 1990, after which a simplified system similarly based on basket size and fullness was introduced. At Kpandu-Tokor, the fish arriving at the market is weighed with a scale.
Annual estimates of production from Lake Volta fisheries are thus based on landings of processed fish at the nine main fish markets around the reservoir. Both overestimation and underestimation of total landings take place. As all fish arriving at the markets are recorded, recycling is a source of error, as fish is presented at market, taken home and treated (e.g. smoked), and thus double counted when returned to market at the following session. Moreover, fish can be sold at a secondary market and presented for sale again at a primary market. More severe errors cause underestimates. Landings in smaller markets are not taken into account, nor are landings at the spontaneous temporary markets at landing places where transport vessels stop. Many fishers also find ways of transporting their fish to the main markets in Kumasi and Accra themselves. Thus, it is clear that not all fish passes through the central market places.
In addition, production estimates are based on processed fish landings, which means that a fresh weight equivalent needs to be calculated based on a conversion factor that has been set at about 1.5–2, but should be about 2–3 (de Graaf and Ofori-Danson, 1997). Reservoir production estimates seem to take into account local consumption, and post-harvest losses are allowed for as a certain percentage of total landings (Braimah, 1995). Based on surveys, it is estimated that about one-third of the catch is consumed locally, while 50 percent of the remaining two-thirds passes through the main markets (P.C. Goudswaard, personal communication, 2008).
FIGURE 51Lake Volta, indicating the eight strata for collecting fishery statistics

Review of tropical reservoirs and their fisheries96
De Graaf and Ofori-Danson (1997) report that about 4 500 tonnes of fresh fish is consumed annually by the population around stratum VII of Lake Volta, which amounts to a per capita consumption of 44 kg/year, or 120 g/day. All this means that the historical production estimates for Lake Volta are highly uncertain and, most probably, are severe underestimates.
The following analysis relies heavily on data and information taken from several unpublished reports by Goudswaard (1993a, 1993b, 1993c) and by Goudswaard and Avoke (1993a, 1993b, 1993c), which were based on work performed between 1991 and 1993 for the FAO/UNDP IDAF project in Yeji, and the report by de Graaf and Ofori-Danson (1997). Moreover, a time series of monthly fish landings by species category from 1998 to 2006 was available for the combined Kpandu-Tokor and Dzemeni markets, while a shorter, interrupted time series for 1990 and 2003–06 was available for the Yeji market. The first data set was used to analyse changes in target species and trophic levels over time as an index for species change in the reservoir. The second data set was used for comparison where possible. Total landings averaging 4 600 tonnes fresh weight at the two southern markets represent about 7 percent of the official landings of Lake Volta. Similar time series of landings are available for some other areas of Lake Volta, in particular stratum VII. These time series would enable a more detailed comparison of species changes in different areas of the reservoir, but were not available for this synthesis.
4.5.2 Fish species and trophic categoriesNot much is known of the fish fauna of the Volta River prior to its damming. Trewavas (Irvine, 1947) indicated which species were recognized at that time from the Volta River. A provisional checklist by Roberts (1967) included all species whose presence was recorded and could be expected from the Volta River. Daget (1956, 1960) and Roman (1966) collected specimens for taxonomic studies from the upper reaches of the Black Volta and White Volta Rivers in Burkina Faso. Detailed studies on the changes of the fish community of Lake Volta were made in the years immediately after the creation of the reservoir (Petr, 1968, 1973; Reynolds, 1973), but no complete review of the fish fauna has been made to date. Taxonomic knowledge has increased during recent decades, including the discovery and description of new species, and the removal of some species names through the discovery of synonyms and redescriptions. A publication on species abundance in a number of Nilo-Sudan river basins includes Lake Volta as part of the Volta Basin (Lévêque, Paugy and Teugels, 1991). This publication is based on preserved specimens in the collections of three European museums and a literature review. The present checklist of species in Table 22 is based on work done by Goudswaard and Avoke, who systematically collected specimens of fish caught by fishers and found during inspections around the town of Yeji from 1991 to 1993, between the village of Bonya along the White Volta River and Abugame in the south of the northern arm of Lake Volta. Of their more than 74 species recorded, about 60 are commercially important. The list is provisional and probably not complete. Over the same period, a collection was made through a zoological museum in Japan, but no published records of these specimens seem to exist. The collections were made in stratum VII of Lake Volta. Roberts (1967) recorded 112 fish species during the pre-impoundment phase, and Denyoh (1969) recorded 108 species during the filling stage. Currently, 121 species have been recorded (Dankwa et al., 1999) (Table 22). It is also known that 32 fish species are present that were not recorded during the early stages of reservoir filling (Denyoh, 1969).

Lake Volta, Ghana 97
TABLE 22Fish species and families of Lake Volta
Family Number Species (trophic level)
Alestidae 7 Alestes baremoze (3.1), Alestes dentex (2.9), Brycinus leuciscus (2.91), Brycinus nurse (2.44), Brycinus macrolepidotus (2.34), Hydrocynus brevis (3.4), Hydrocynus forskalii (3.98)
Anabantidae 1 Ctenopoma petherici (3.16)
Arapaimidae 1 Heterotis niloticus (2.55)
Ariidae (+1) Arius gigas (presence uncertain) (?)
Bagridae 2 Bagrus bayad (3.99), Bagrus docmac (4.08)
Channidae 1 Parachanna obscura (3.4)
Cichlidae 9 Steatocranus irvinei (3.32), Chromidotilapia guntheri (2.44), Hemichromis fasciatus (3.18), Hemichromis bimaculatus (3.93), Tilapia dageti (2.06), Tilapia zillii (2.0), Tilapia guineensis (2.8), Oreochromis niloticus (2), Sarotherodon galilaeus (2.05)
Citharinidae 3 Distichodus rostratus (2), Paradistichodus dimidiatus (3), Citharinus citharus (2)
Clariidae 3 Heterobranchus bidorsalis (3.69), Clarias gariepinus (3.15), Clarias anguillaris (3.35)
Claroteidae 3 (+1) Chrysichthys auratus (3.66), Chrysichthys nigrodigitatus (2.58), Auchenoglanis occidentalis (2.9), Clarotes laticeps (presence uncertain) (3.1).
Clupeidae 3 Odaxothrissa mento (4.29), Pellonula leonensis (3.3), Sierrathrissa leonensis (3.1)
Cyprinidae 6 Barbus macrops (3.04), Labeo coubie (2.04), Labeo senegalensis (2.09), Labeo parvus (2), Leptocypris niloticus (2.9), Raiamas senegalensis (2.84)
Gobiidae 1 Nematogobius maindroni (?)
Gymnarchidae 1 Gymnarchus niloticus (3.71)
Hepsetidae (+1) Hepsetus odoe (from reservoir?) (4.5)
Latidae 1 Lates niloticus (4.48)
Malapteruridae 1 Malapterurus electricus (2.93)
Mochokidae 9 Hemisynodontis membranaceus (?), Synodontis clarias (2.96), Synodontis violaceus (?), Synodontis filamentosus (2.88), Synodontis eupterus (2.65), Synodontis velifer (2.89), Synodontis nigrita (2.89), Synodontis ocellifer (3.12), Synodontis schall (2.92)
Mormyridae 14 Mormyrus rume (2.48), Mormyrus macrophthalmus (3.15), Mormyrus hasselquistii (3.17), Hyperopisus bebe (3.6), Campylomormyrus tamandua (3.24), Marcusenius senegalensis (3.1), Marcusenius abadii (3.07), Hippopotamyrus pictus (3.21), Mormyrops anguilloides (3.58), Brienomyrus niger (3.25), Petrocephalus bane (3.2), Petrocephalus bovei (3.1), Petrocephalus soudanensis (3.14), Pollimyrus isidori (2.61).
Polypteridae 2 Polypterus senegalus (3.5), Polypterus endlicheri (3.8)
Protopteridae 1 Protopterus annectens (3.8)
Schilbeidae 4 Parailia pellucida (3.5), Siluranodon auritus (2.86), Schilbe intermedius (3.6), Schilbe mystus (3.45)
Tetraodontidae 1 Tetraodon lineatus (3.6)
Total 74 (+3)
Note: Trophic level in parentheses according to FishBase (www.fishbase.org) accessed on 14 June 2008. Estimates are made from the presence of individual food items. If both are available the trophic level second estimation is used.Source: Species list based on Goudswaard and Avoke (1993a).
No detailed studies of food preference by stomach analysis have been carried out for Lake Volta. Many freshwater fish have facultative feeding habits and can feed at different trophic levels depending on age, food availability, season, etc. However, a tentative classification of fish species according to trophic group can be made based on the literature, FishBase and incidental observations. The most numerous and commercially important fishes in Lake Volta are phytoplanctivorous species (Hemisynodontis membranaceus, Oreochromis niloticus and Sarotherodon galilaeus). Together with the detritivorous species (Chrysichthys auratus, C. nigrodigitatus, Heterotis niloticus and Synodontis species) they form the main consumers of primary algal production and detritus in the reservoir. Insectivorous species include many Mormyridae including Marcusenius senegalensis and Mormyrus rume. Alestes dentex and Brycinus nurse were found to be opportunistic insect feeders feeding on swarms of migrant locusts when they struck the water surface. The only specialist mollusc-eating species in Lake Volta, Tetraodon lineatus, is very rare although bivalves and gastropods are available in abundance. The number of piscivorous species in the
Review of tropical reservoirs and their fisheries98
reservoir is high, but none is very numerous except the pelagic species Odaxothrissa mento, Schilbe mystus and S. intermedius, larger individuals of which are piscivorous. These are abundant but most specimens are small and feed mainly on insects. Large fish predators such as Lates niloticus and Gymnarchus niloticus are not abundant. Stocks of Bagrus bayad and B. docmac are heavily exploited. Hydrocynus brevis and H. forskalii are present in commercial catches, but gillnets select disproportionately for these species, so catches may not reflect actual species composition.
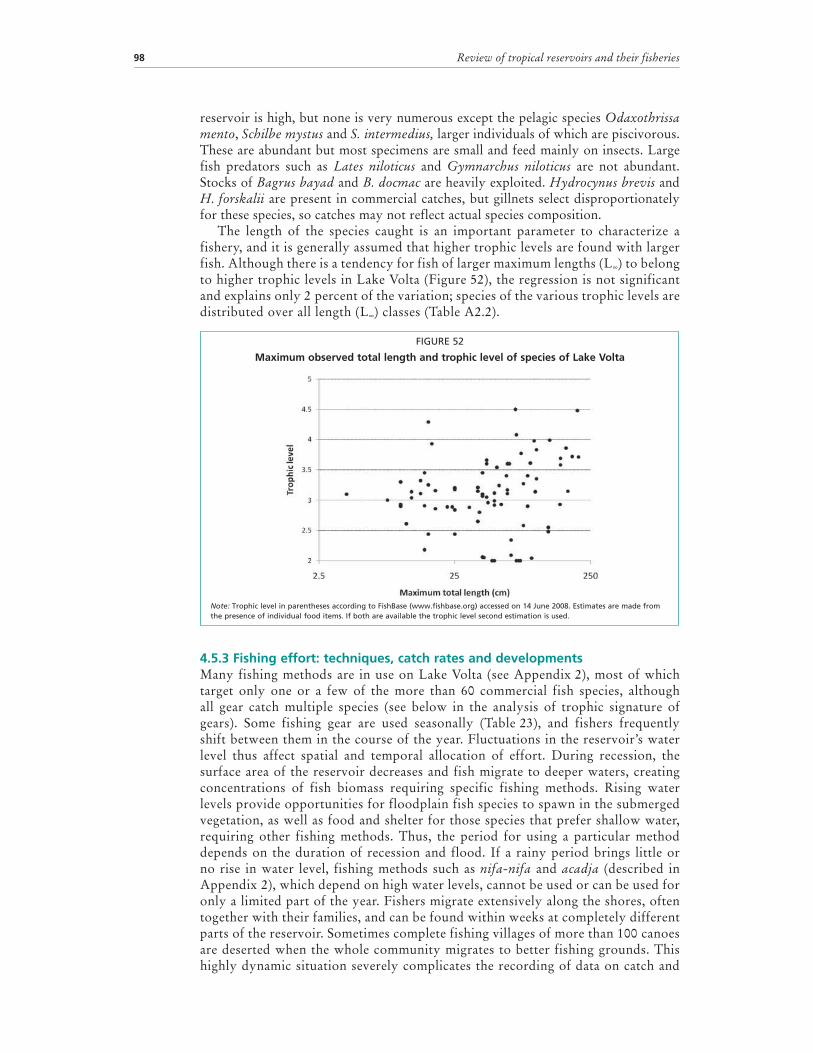
The length of the species caught is an important parameter to characterize a fishery, and it is generally assumed that higher trophic levels are found with larger fish. Although there is a tendency for fish of larger maximum lengths (L∞) to belong to higher trophic levels in Lake Volta (Figure 52), the regression is not significant and explains only 2 percent of the variation; species of the various trophic levels are distributed over all length (L∞) classes (Table A2.2).
FIGURE 52
Maximum observed total length and trophic level of species of Lake Volta
Note: Trophic level in parentheses according to FishBase (www.fishbase.org) accessed on 14 June 2008. Estimates are made from the presence of individual food items. If both are available the trophic level second estimation is used.
4.5.3 Fishing effort: techniques, catch rates and developmentsMany fishing methods are in use on Lake Volta (see Appendix 2), most of which target only one or a few of the more than 60 commercial fish species, although all gear catch multiple species (see below in the analysis of trophic signature of gears). Some fishing gear are used seasonally (Table 23), and fishers frequently shift between them in the course of the year. Fluctuations in the reservoir’s water level thus affect spatial and temporal allocation of effort. During recession, the surface area of the reservoir decreases and fish migrate to deeper waters, creating concentrations of fish biomass requiring specific fishing methods. Rising water levels provide opportunities for floodplain fish species to spawn in the submerged vegetation, as well as food and shelter for those species that prefer shallow water, requiring other fishing methods. Thus, the period for using a particular method depends on the duration of recession and flood. If a rainy period brings little or no rise in water level, fishing methods such as nifa-nifa and acadja (described in Appendix 2), which depend on high water levels, cannot be used or can be used for only a limited part of the year. Fishers migrate extensively along the shores, often together with their families, and can be found within weeks at completely different parts of the reservoir. Sometimes complete fishing villages of more than 100 canoes are deserted when the whole community migrates to better fishing grounds. This highly dynamic situation severely complicates the recording of data on catch and

Lake Volta, Ghana 99
effort in the artisanal fisheries of Lake Volta, apparently exacerbated by many fishers’ reservations on cooperation with fishery data collectors and researchers (P.C. Goudswaard, personal communication, 2008).
Fishers on Lake Volta are generally full-time, operating about 300 days/year, in working weeks of about 6–6.5 days, with slight differences among the various ethnic groups involved in fishing. All fishers are absent from their village for about 30 days per year, depending on the annual festival at their place of origin: the Fanti (Efutu) have their Aboakyer in May, the Ga have Asafotu in August, the Ewe (Battor) celebrate their Asafotu in August and Hogbetsotso in December. Around Easter and Christmas, some fishers travel to their home towns. The absence of canoe owners does not mean that all activities are suspended. It is common practice that helpers continue regular fishing during the absence or illness of gear and boat owners. Relatives from elsewhere can take over all fishing activities during the absence of gear owners (Goudswaard of UNDP–FAO IDAF 1992–1993, unpublished data; Prins, 1992).
Only limited data on fishing effort exist (Tables 24–26). The data on total effort suggest that between 1970 and 1998 the total number of fishers increased by 3.5 times and the number of vessels doubled. This means that the mean number of fishers per vessel doubled from 1.5 in 1970 to about three in 1998, possibly an indication of reduced investment per fisher over the whole Lake Volta over this 20-year period. Effort data from stratum VII are less clear in this respect, as the number of fishers per boat varied between 2.8 and 4.7 in different estimates between 1989 and 1999. Results from the frame survey of 1998 (MOFA, 2003) are shown in Tables 25 and 26. The number of fishers per boat varies between 1.3 and 3.2 in different strata, with an average of 3. The low proportion of vessels with engines is another indication of low investment per fisher, which is typical in many small African freshwater fisheries (Jul-Larsen et al., 2003).
TABLE 23Seasonality in gear use on Lake Volta
Gear1 Jan Feb Mar Apr May Jun Jul Aug Sep Oct Nov Dec
Receding water level Rising water level
Palm trap
Hook (Bagrus)
Nifa-nifa
Beach seine
Acadja
Ripping hook
Gillnet
Bamboo pipe
Winch net
Wangara
Drift net
Cast net
Tilapia trap
Hook (Lates)
Lift basket
1 Light grey = used; black = best period; white = not used. Sources: 55 interviews with village chiefs, elders and fishers conducted between March and April 1992, as well as informal enquiries during 1992 and 1993 (Goudswaard, unpublished results).

Review of tropical reservoirs and their fisheries100
TABLE 24Estimated fishing effort on Lake Volta since 1970, whole reservoir (total) and stratum VII
Fishers Boats Reference
Total Stratum VII Total Stratum VII
1970 18 358 12 074 1 700 VLRDP Phase I, UNDP
1975 20 600 13 800 1 900 VLRDP Phase II, UNDP/FAO/VRA
1978 14 746 de Graaf and Ofori-Danson, 1997
1989 15 500 4 300 de Graaf and Ofori-Danson, 1997
1992 18 300 6 500 de Graaf and Ofori-Danson, 1997
1996 39 934 8 068 canoes, 358 winch boats
de Graaf and Ofori-Danson, 1997
1998 71 861 17 278 28 053 5 369 MOFA, 2003
Note: FAO = Food and Agriculture Organization of the United Nations; MOFA = Ministry of Fisheries and Aquaculture; UNDP = United Nations Development Programme; VLRDP = Volta Lake Research and Development Project; VRA = Volta River Authority.
TABLE 25Estimate of gear numbers on Lake Volta from the frame survey, 1998
Gear Number Gear Number
Gillnet 998 250 Winch net 447
Fishing line 791 571 Atigya 3 500
Trap 338 667 Wangara 6 046
Cast net 8 972 Bamboo pipe 4 180 630
Nifa-nifa 5 700 Spear 76
Beach seine 10 895 Poisoning 0
Source: MOFA, 2003.
TABLE 26Some characteristics of the Lake Volta fishery by stratum, based on the frame survey, 1998
CharacteristicI II III
Stratum
IV V VI VII VIIITotal
Fishing villages 161 152 167 115 182 146 237 72 1 232
Fishers 9 574 5 612 9 333 8 187 8 378 8 715 17 278 4748 71 861
Fishing boats 3 620 1 795 3 059 2 685 6 636 3 167 5 369 1 704 28 035
Outboard motors 134 126 260 105 110 33 111 33 973
Fishers per village 59 37 56 71 46 60 73 66 58
Fishers per boat 2.6 3.1 3.1 3.0 1.3 2.8 3.2 2.8 3.0
Boats with engines (%) 4 7 8 4 2 1 2 2 4
Source: MOFA, 2003.
Daily catch rates using different gear vary from 6 kg/boat (pellonula seines) to 82 kg/boat (winch nets with engines) (Table 27). Catch rates per canoe in an area of stratum VII measured by de Graaf and Ofori-Danson (1997) are within the same range (Figure 53). Both the average catch rates and the coefficients of variation by gear observed during the surveys that are the basis for Table 27 are within known ranges for these gears in other fisheries (van Densen, 2001; van Zwieten et al., 2006). Median daily catch rates of all gear were 25 kg/boat. This would mean that the annual catch of a canoe is about 7.5 tonnes/year. An average two or three fishers per boat (see Table 27, and de Graaf and Ofori-Danson, 1997) gives a catch of 2.5–3.8 tonnes/fisher, which is in the range of values known for other African freshwater fisheries (Jul-Larsen et al., 2003; Kolding and van Zwieten, 2006).
De Graaf and Ofori-Danson (1997) presented catch rates per gear and focused on gillnets and lift nets in the northern, central and southern parts of stratum VII. Canoes with gillnets caught 14.7 kg/day (coefficient of variation [CV] = 81, N = 530), 11 kg/day (CV = 109, N = 939) and 19.9 kg/day (CV = 60, N = 272) in the three areas, with a large seasonal and spatial variation. The relatively high CV for the central region may indicate

Lake Volta, Ghana 101
that the sample was not homogeneous and may have consisted of a variety of gears. On average, the estimated annual catch per canoe (unstratified in time) was 3.4 tonnes, which is equivalent to a catch per fisher of about 1.7 tonnes/year. Winch boats operating lift nets caught 13–97 kg/day, with an average of 49 kg/day. These boats caught on average 16.8 tonnes/year. With an average of nine fishers per winch boat, this would give an annual catch of about 1.9 tonnes/fisher. Both average catch values per fisher are on the low side of the range that can be expected from small African freshwater fisheries.
FIGURE 53 Range and mean catch per canoe per day at Jaklai (central stratum VII), June 1991–December 1995
Source: Redrawn after De Graaf and Ofori-Danson (1997) using the original data courtesy of G. De Graaf.
TABLE 27Catch data for selected fishing methods in northern Lake Volta (stratum VII), 1992–93
N CPUE1
(kg/boat per day)Coefficient of variation
(%, 100 × sd/mean)Min. catch
(kg/boat per day)Max. catch
(kg/boat per day)
25 mm gillnet 11 27.4 57 6.2 52.7
50 mm gillnet 102 20.0 64 2.5 70.8
75 mm gillnet 48 24.0 96 1.7 92.6
≥ 100 mm gillnet 29 25.1 92 2.7 96.8
Pelagic net 11 34.6 97 9.9 127.4
Drift net 11 19.0 50 4.7 31.3
Beat and gillnet 2 39.1 84 6.2 71.9
Cast net 10 28.8 74 4.6 59.2
Beach seine 19 40.1 115 5.2 224.6
Mosquito seine 5 6.4 31 3.9 8.2
Pellonula seine 6 10.6 53 2.5 16.8
Longlining 1 18 28.9 108 5.4 139.6
Longlining 2 3 7.5 41 4.8 11.9
Longlining 3 16 17.6 246 0.0 169.8
Ripping hook 4 15.6 30 9.9 21.9
Bamboo pipe 11 71.7 44 29.8 127.3
Lift basket 6 12.5 70 3.9 27.9
Palm leaf trap 5 32.5 15 24.5 38.6
Tilapia trap 1 16.0 – – –
Acadja 6 29.4 51 13.6 61.8
Nifa-nifa 1 106.2 – – –
Winch engine 22 81.8 68 16.8 239.0
Winch manual 7 25.2 70 4.4 52.6
Overall mean – 28.9 – – –
Median – 25.2 – – –
Note: CPUE = catch per unit effort; N = number; sd = standard deviation.1 Estimates are based on unstratified sample averages.Source: Goudswaard, 1993a, 1993b, 1993c.
0,00
10,00
20,00
30,00
40,00
50,00
60,00
01-ju
n-91
21-ju
l-91
09-s
ep-9
1
29-o
ct-9
1
18-d
ec-9
1
06-f
eb-9
2
27-m
ar-9
2
16-m
ay-9
2
05-ju
l-92
24-a
ug-9
2
13-o
ct-9
2
02-d
ec-9
2
21-ja
n-93
12-m
ar-9
3
01-m
ay-9
3
20-ju
n-93
09-a
ug-9
3
28-s
ep-9
3
17-n
ov-9
3
06-ja
n-94
25-f
eb-9
4
16-a
pr-9
4
05-ju
n-94
25-ju
l-94
13-s
ep-9
4
02-n
ov-9
4
22-d
ec-9
4
10-f
eb-9
5
01-a
pr-9
5
21-m
ay-9
5
10-ju
l-95
29-a
ug-9
5
18-o
ct-9
5
07-d
ec-9
5
Dai
ly C
PU
E (
kg/c
ano
e)
DATE

Review of tropical reservoirs and their fisheries102
Braimah (1995) presents catch rates per canoe per stratum fluctuating between 2.74 and 19.59 kg/day, with an average per stratum of 7.3–9.6 kg/day, or an annual catch of about 2.2–2.9 tonnes/canoe (unstratified spatially or temporally). With two to three fishers per canoe, this would yield an annual catch of about 0.7–1.5 tonnes per fisher, which seems rather low.
4.5.4 Fishing effort: trophic signature, habitat use, length and resilience of the catch by gearThe highly adaptable effort dynamics on Lake Volta are comparable with those of many other small-scale African freshwater fisheries. With its mixed lacustrine, floodplain and riverine characteristics, it may even represent this dynamism in an extreme form, judging from the many highly inventive gear types and large dynamics in spatial effort allocation, both seasonally (in response to floods), daily and weekly in response to the local availability of fish and fish traders (P.C. Goudswaard, personal communication, 2008). These effort dynamics may generate an overall picture of species, abundance and size composition in the catch of the combined fisheries of the reservoir that may closely match the dynamics in size and species structure of a fish community, as well as the productivity of its various components. In principle, a fishery that harvests all species at all trophic levels and sizes at rates proportional to their natural mortality pattern is not selective at the community level. Unselective harvesting patterns can maintain the relative size and species structure of fish community, with each of the components fished according to its surplus productivity (taking into account the part of the surplus production taken by fish predation), and will lower only biomass (Jul-Larsen et al., 2003) (Figure 54). Overfishing at the community level occurs if the total fishery exceeds the overall annual surplus production of the combined fish community in the reservoir. A specific component of the fish community will be overfished only when specific investments are directed at that component, and fishers continue to fish the species despite the greater effort needed to maintain catches. This can be economically viable only if such catches are compensated with higher fish prices, or supported by increased efficiency per unit of labour, or increased economic efficiency in distributing fish to consumers. Data to test this hypothesis are generally lacking. What would be needed are data on the trophic level of each species caught, the relative species composition for each gear, and the total effort and catch by gear next to an estimate of the productivity of each species. The fishing in balance (FiB) index (Pauly, Christensen and Walters, 2000; Pauly and Watson, 2005) could be an important indicator for assessing changes in catch over time. The index shows whether trophic-level changes
FIGURE 54The trophic level at which a fishery intervenes
Note: Triangles represent trophic pyramids (Lindeman diagrams) with fish predators at the top (trophic level ≥ 4) and phytoplanctivores and detritivores (trophic level = 2) near the bottom. The width of the triangle represents relative biomass. Black curves represent selective exploitation, arrows indicate the direction of increased fishing pressure.Source: Adapted from Jul-Larsen et al., 2003.

Lake Volta, Ghana 103
are matched by increases in catch proportionally related to abundance at different trophic levels (FiB = 0). It will increase (FiB > 0) if bottom-up effects or expansions in the fishery occur and decrease (FiB < 0) when the fishery loses so much biomass that decline in catch does not compensate for declines in trophic level. The index does not evaluate the specific impacts of fishing patterns, either on trophic levels or on ecological spaces.
There are indications that the Lake Volta fishery is an example of an unselective harvesting pattern, judged from a set of indicators that can be devised to assess these impacts and make a judgement regarding whether fishing down (Welcomme, 1999) is taking place. Three indicators based on direct observations are as follows:
(1) Trophic signature of a fishing gear. This indicates the average trophic level of the catch of a gear. Analysed over all gear, this indicator gives information on the levels at which the whole fishery targets the fish community and whether it has the potential to change the structure of a fish community.
(2) Average length of species caught. A main driver of “fishing down” is a decrease in mean length of the catch through the successive removal of larger fish. The anticipation is that fishers will respond either by reducing the mesh size or by shifting to gear that select for smaller individuals and species. Such information on gear changes is not available, but it can be inferred from the species targeted and the different lengths these can attain whether this process may be occurring on Lake Volta.
(3) Spatial habitat targeted by the gear. This indicator is estimated from the habitat preferences of the species caught and informs about the various habitats that are covered by fishers. A change in this indicator gives information on the current spatial utilization of gear in a fishery and, over time, a possible expansion of a fishery over different habitats.
A fourth potential indicator is the average resilience of the species in the catch. This indicator could be constructed based on a number of life-history parameters, some of which are derived from models. Such an indicator could provide information about the changes in dominant life-histories in the fishery. Length-at-catch data are generally not available for the Volta fisheries, except for a dedicated short study under the Improved Fisheries Productivity and Management in Tropical Reservoirs Project (Figure 55). However, the maximum total length (L∞) that the species can attain is available (Appendix 2, Table A2.2). These indicators can be constructed based on reported data on the relative species composition of the catch by gear and on information provided by FishBase on the trophic level, maximum length, habitat use and resilience by species.5 In addition, a data set of reported catches by species and gear types for 21 types of gear (Goudswaard, unpublished) was used for Lake Volta (see FishBase and captions of Figures 55 and 56 for calculations).
5 Trophic levels in FishBase are estimated from the diet composition (percentage of volume or number of food items in the stomach) or from food items (lists of food items found in the stomach). The trophic level estimates are either the single value that is currently available or the median number of values available from several studies or localities. Habitat: Fishbase recognizes three basic spatial domains where fish reside that are called habitats: pelagic, bentho-pelagic and benthic. Resilience: the American Fisheries Society has suggested values for several biological parameters that permit the classification of a fish population or species into the categories of high, medium, low and very low resilience or productivity (Musick, 1999). FishBase restricts the assignment of resilience categories to values of von Bertalannfy’s growth coefficient k, the age at maturity tm and the maximum age tmax and those records of fecundity estimates that referred to the minimum number of eggs or pups per female per year, assuming that these were equivalent to average fecundity at first maturity. The von Bertalanffy growth coefficient k addresses the potential vulnerability of stocks to excessive mortality, with k ≤ 0.10 indicating high vulnerability. Another useful index in assessing the vulnerability of stocks to excessive mortality is the intrinsic rate of increase r. Vulnerability is inversely proportional to r and groups that have annual increase rates of less than 10 percent are particularly at risk.

Review of tropical reservoirs and their fisheries104
FIGURE 55Trophic signature of fishing gear and maximum length of species
Note: On left: The trophic signature of fishing gear, showing mean trophic level of the catch in 21 types of gear operated in Lake Volta. The weighted mean is calculated by multiplying the trophic level of a species (taken from FishBase) by its proportion in the catch and summing these over all the species in the catch. Maximum, minimum and median trophic levels of the species caught by a gear are indicated. On right: The average of the maximum length that species can attain caught by 21 types of gear operated in Lake Volta. Calculations are as with trophic signature, with trophic level replaced by maximum observed total length of the species. Shown in brackets are the numbers of species caught by a gear, followed by the number of samples (n) on which the proportion is calculated.
The 21 types of gear caught a variety of species. The minimum number of species caught by one gear was 9 (sample size n = 1) and the maximum 56 (n = 102). The difference could be the result of differences in sampling frequency, but all types of gear clearly target multiple species. Moreover, most gear catch species present over the whole trophic range. Virtually all gear catch species with a minimum trophic level of 2. Most species targeted by each gear have a trophic level of about 3, while the maximum trophic level is more variable (Figure 55, left).
All the types of gear used in the Lake Volta fishery have a clearly different trophic signature, indicating that all trophic levels available appear to be utilized (Figure 55). Weighting the trophic level with the proportion of each species in the catch gives an average trophic level for each gear that ranges between 2 and 4.5. Each of the 21 types of gear targets a different part of the fish community and thus has a different impact on the food web. Gear that fish at low trophic levels are tilapia traps, acadja, nifa-nifa and cast nets. Longlining for Bagrus (longline 3) and longlining for Lates (1) and Clarias (2) have high trophic signatures in that they catch species that are high in the trophic spectrum. One-inch (25 mm) gillnets that target the small pelagic predator Odaxothrissa mento also have a high trophic signature (Figure 55, left).
Fourteen of the 21 types of gear examined target species that can attain maximum weighted-average lengths of between 35 and 70 cm. Mosquito seines, pellonula seines and one-inch gillnets target smaller species, while ripping hooks and the various longlines target species that can attain larger lengths. Virtually all gear catch species that can attain lengths ranging between 10 and 200 cm. Small length ranges were found with mosquito seines targeting small species with lengths of between 4 and 16 cm, dominated by Pellonula leonensis (86 percent of the catch). Species of median length (40–150 cm) targeted by bamboo traps are dominated by Chrysichthys auratus (86 percent) and to a lesser extent C. nigrodigitatus (14 percent), while species targeted by palm traps are dominated by C. auratus (23 percent), C. nigrodigitatus (57 percent) and Synodontis schall (11 percent). Longlines mainly target large (71–200 cm) Lates niloticus (99 percent) (Figure 55, right).
Tilapia trap (9, n=1)Acadja (13, n=6)
Nifa-nifa (11, n=1)Castnet (31, n=10)
Gillnet 3" (45, n=48)Gillnet 4"+ (19, n=29)
Ripp.hook (10, n=4)Winch-manual 19, n=(7)
Beachseine (43, n=19)Driftnet (26, n=11)
Winch-engine (39, n=22)Palmtrap (6, n=5)
Gillnet 2" (56, n=102)Mosquitoseine (5, n=5)
Pellonula seine (14, n=6)Longline 2 (6, n=3)Liftbasket (6, n=6)Bamboo (5, n=11)
Longline 1 (19, n=18)Gillnet 1" (22, n=11)Longline 3 (4, n=16)
1 2 3 4 5
Trophic level
Mosquitoseine (5, n=5)Pellonula seine (14, n=6)
Gillnet 1" (22, n=11)Driftnet (26, n=11)Liftbasket (6, n=6)Bamboo (5, n=11)
Tilapia trap (9, n=1)Gillnet 2" (56, n=102)
Nifa-nifa (11, n=1)Gillnet 3" (45, n=48)
Castnet (31, n=10)Palmtrap (6, n=5)
Winch-manual 19, n=(7)Beachseine (43, n=19)
Winch-engine (39, n=22)Acadja (13, n=6)
Gillnet 4"+ (19, n=29)Ripp.hook (10, n=4)
Longline 1 (19, n=18)Longline 2 (6, n=3)
Longline 3 (4, n=16)
3 10 100
300
Maximum total length (cm)

Lake Volta, Ghana 105
A study under the CP34 Project6, covering the dominant types of gear in the fishery, was conducted in 2007/08 with ten fishers who recorded daily the length of their catch using their own gears. Results showed that 90 percent of the majority of the specimens caught were less than 35 cm long and 10 percent were less than 15 cm (Figure 56). This corresponds to about 40–50 percent of the maximum length of most of the targeted species. Large cichlid species tend to reduce in size under heavy fishing pressure. The most important gear in the fishery targeting cichlids are acadjas, or atidzas. The average size of the two most important cichlids, forming about 85 percent of the total cichlid catch over one year in one atidza, was 28 cm (37 percent of Lmax) for Oreochromis niloticus and 25 cm (62 percent of Lmax) for Sarotherodon galilaeus. Average size of Tilapia zillii was 20 cm (40 percent of Lmax), Hemichromis fasciatus 15 cm (60 percent of Lmax) and Chromidotilapia guntheri 7 cm (39 percent of Lmax). For all species, sizeable proportions of the catch were large specimens, showing limited indication of an overall reduction in size resulting from heavy fishing pressure (Figure 57).
FIGURE 56Relative length-to-frequency distribution in the catch of dominant gear used
in the Lake Volta fishery at Dzemeni, Kpando area
Note: Between March 2007 and June 2008, ten fishers recorded their catches twice a week utilizing their own gear. Indicated are the number of sets recorded for a set of gear and the average number of specimens caught per set. The largest specimen caught was a Lates niloticus measuring 188 cm.
6 Improved Fisheries Productivity and Management in Tropical Reservoirs, funded by the CGIAR Challenge Program on Water and Food.
0
5
10
15Acadja, #set=266, avg=23.1
0
5
10
15<2" Gillnets, #set=35, avg=50.2
0
5
10
152"-<3" Gillnets, #set=286, avg=30.2
0
5
10
153"-<5" Gillnets, #set=447, avg=19,9
0
5
10
15> 5" Gillnets, #s et=100, avg=7.4
0
5
10
15Net traps, #set=249, avg=60.6
0 5 10 15 20 25
Length (cm)
0
5
10
15
Freq
uenc
y (%
)
Basket traps, #set=128, avg=50.0
0
0
0
0
0
0
30 35 40 45 50 55 60 65

Review of tropical reservoirs and their fisheries106
FIGURE 57Proportional length frequency distribution of five cichlid species in the catch of an acadja
in the Dzemeni area of Lake Volta
Note: Data were collected daily for one year in 2007/08.
Next to their impact on the food web and size distributions, gear differ in the spatial distribution of the catch. Most gear target species that live in benthic and bentho-pelagic habitats, but again each at a slightly different level. Many fishers target the species that appear in flooded areas or that are associated with the benthic or bentho-pelagic parts of the fish community. Clearly spatially distinct are the one-inch (25 mm) gillnets targeting small pelagics, drift nets targeting pelagic and anadromous fish, pellonula seines (a bait fishery for the Bagrus line fishery) and mosquito nets targeting the clupeid Sierrathrissa leonensis – all targeting pelagic species (Figure 58, left). Thus, the different types of gear target species in different spatial sectors of the ecosystem.
Most types of gear target species with intermediate resilience to fishing pressure as defined by FishBase (footnote 5) and have a median resilience of 3 (Figure 58, right). Gear that target species with high resilience are one-inch (25 mm) gillnets, pellonula seines, lift baskets and mosquito seines. Gear that catch a suite of species with a weighted-average resilience to fishing higher than 3.1 are as follows (with the dominant species in the catch that to a large extent determines this position indicated in parentheses): four-inch (100 mm) gillnets (Citharinus citharus), drift nets (the small alestid Brycinus nurse), one-inch (25 mm) gillnets (the small clupeid Odaxothrissa mento, the alestids Parailia pellucida and the schilbeid Schilbe mystus), pellonula seines (the small clupeids Pellonula leonensis and Sierrathrissa leonensis), lift baskets (Schilbe mystus) and mosquito seines (Sierrathrissa leonensis). These gear target species that can withstand high fishing pressure.
Gear that catch a range of species with a weighted-average resilience lower than 2.9 are as follows (with the species with low resilience to fishing [1 and 2] in parentheses): ripping hooks (the large elephant fish Mormyrus rume), longlines (Polypterus senegalus, Malapterurus electricus, Heterobranchus bidorsalis, Gymnarchus niloticus, Labeo coubie and the large elephant fish Mormyrops anguilloides) and three-inch (75 mm) gillnets (Gymnarchus niloticus, Labeo coubie and the large elephant fishes Mormyrus rume and Mormyrops anguilloides). Except for Mormyrus rume, caught by ripping hooks, none of the species is the main target of the gear that catch them. The main target for longlines is Bagrus bayad and for three-inch (75 mm) gillnets is Sarotherodon galilaeus. High fishing pressure from these gear may be an important cause of the perceived decline in bycatch species.
0 5 10 15 20 25 30 35 40 45 50 55
Length (cm)
0.0
0.2
0.4
0.6
0.8
1.0
1.2
1.4
1.6
Freq
uenc
y (%
)
Acadja - cichlids#set = 266, N = 5 127
Sarotherodongalilaeus (L
max=41)
Oreochromisniloticus (Lmax=74)
Tilapiazillii (Lmax=49)
Hemichromisfasciatus (L
max=25)
Chromidotilapiaguentheri (Lmax=16)

Lake Volta, Ghana 107
FIGURE 58
Mean habitat left and mean resilience of the catch of 21 types of gear operated in Lake Volta
Note: The weighted mean is calculated by multiplying the habitat or resilience category of a species (taken from FishBase) by its proportion in the catch and summing these over all the species in the catch. Median habitat and resilience categories of the species caught by a gear are indicated. The number of species caught is shown in parentheses after a gear, followed by the number of samples (n) on which the proportion is calculated. (Habitat: 1 = benthic, 2 = bentho-pelagic, 3 = pelagic. Resilience: 2 = low, 4 = high).
4.5.5 Developments in total landings and total catchThe annual total catch was estimated at 61 700 tonnes, from surveys carried out by the Volta Lake Research Project Phase II in 1969. Subsequently and until 1977, it averaged 38 500 tonnes/year (Figure 59 and Appendix 2, Table A2.1). In 1996, De Graaf and Ofori-Danson estimated the catch of stratum VII alone through stratified random sampling of gillnets and winch boats at 33 800 tonnes. They therefore concluded that the previously used production estimate of 44 000 tonnes/year for the whole reservoir was an underestimate. They concluded from their findings that the total production of the reservoir was most likely 150 000–200 000 tonnes/year (180–240 kg/ha) with a total annual value of US$30 million. Other unpublished catch estimates based on reservoir-wide catch assessment surveys and frame surveys proposed an annual production of 251 000 tonnes for 2000 (Braimah, 2000, 2001, 2003 in Béné, 2007). Another estimate for the same year amounted to 271 000 tonnes (De Graaf and Ofori-Danson, 1997).
Rough estimates based on annual catch rates per fisher at the 1998 level of effort (see Table 24) range from 110 000 to 271 000 tonnes, with a median of 130 000 tonnes. Even the lowest estimate based on data from Braimah (1995) of 0.7 tonnes per fisher would lead to an annual catch of 50 500 tonnes. Using the same catch rate data, but multiplied by the number of canoes, resulted in a total production of 70 000–181 000 tonnes (median 81 000 tonnes). In sum, catch estimates of Lake Volta’s fishery at present range from 40 000 to 271 000 tonnes. Within this broad range of estimates there is no consensus regarding the most probable range in production, although based on the previous analyses it is likely to be much higher than the catches reported by the Fisheries Directorate. Production figures are at least much higher than 100 000 tonnes. This upward revision of the catch estimates of Lake Volta confirms the emerging evidence that catches from many inland fisheries are severely underestimated (FAO, 2003; Kolding and van Zwieten, 2006, Mius et al. 2011).
Bamboo (5, n=11)
Longline 3 (4, n=16)
Ripp.hook (10, n=4)
Liftbasket (6, n=6)
Palmtrap (6, n=5)
Longline 1 (19, n=18)
Tilapia trap (9, n=1)
Beachseine (43, n=19)
Gillnet 4"+ (19, n=29)
Gillnet 3" (45, n=48)
Gillnet 2" (56, n=102)
Nifa-nifa (11, n=1)
Winch-manual 19, n=(7)
Castnet (31, n=10)
Winch-engine (39, n=22)
Longline 2 (6, n=3)
Acadja (13, n=6)
Gillnet 1" (22, n=11)
Driftnet (26, n=11)
Pellonula seine (14, n=6)
Mosquitoseine (5, n=5)
1 2 3
Habitat
Ripp.hook (10, n=4)
Longline 1 (19, n=18)
Gillnet 3" (45, n=48)
Beachseine (43, n=19)
Winch-manual 19, n=(7)
Acadja (13, n=6)
Tilapia trap (9, n=1)
Nifa-nifa (11, n=1)
Longline 3 (4, n=16)
Bamboo (5, n=11)
Longline 2 (6, n=3)
Palmtrap (6, n=5)
Gillnet 2" (56, n=102)
Castnet (31, n=10)
Winch-engine (39, n=22)
Gillnet 4"+ (19, n=29)
Driftnet (26, n=11)
Gillnet 1" (22, n=11)
Pellonula seine (14, n=6)
Liftbasket (6, n=6)
Mosquitoseine (5, n=5)
2.0
2.5
3.0
3.5
4.0
Resilience

Review of tropical reservoirs and their fisheries108
The total annual production of the reservoir could fluctuate greatly as a result of high annual variability in the area flooded by the annual increases in discharge. As the dominant fishing methods generally target fish that are between one and four years old, fishery production will reflect recruitment variability caused by the variable annual floods. Despite – or perhaps because of – this high uncertainty, many documents claim that the resources of the reservoir are overexploited. The claims of overfishing are consistently made using both the high and the low estimates of total production, thereby constituting one of the few constants in the information around the Lake Volta fishery. The cause of the large decrease in landings after 1969 and the equally large, but more gradual, increase from 1996 onwards remains unexplained (Figure 59), although the former could have reflected the initial peak productivity period generally observed in newly inundated reservoirs. Béné (2007) conjectures that a reverse correlation may exist between the water level and landings in an interannual time frame. This hypothesis remains to be tested, however. The large changes in landings could also reflect changes or heterogeneity in statistical recording.
The catch estimate by minor stratum in 2000 based on a limited data set suggests that the largest proportion of the catch is taken from stratum VII (38 percent), followed by stratum V (21 percent) and stratum VIII (13 percent) (Figure 60). All three strata
1965 1970 1975 1980 1985 1990 1995 2000 20050
20 000
40 000
60 000
80 000
100 000
Land
ings
(to
nnes
)
0
100 000
200 000
300 000
Land
ings
(to
nnes
)
Reported Fisheries Directorate Other estimates
FIGURE 59Estimates of total catch from Lake Volta
Note: The left axis shows catch estimates from the Fisheries Directorate, and right axis shows other estimates (see Table A1.1 and text).
FIGURE 60Total weight of fish landed from Lake Volta, by stratum, in 2000
Source: Unpublished data from the Fisheries Directorate.

Lake Volta, Ghana 109
are in the northern part of the reservoir, where the Volta Rivers merge. This means that the highest production is taken from areas that have the typical characteristics of a productive riverine floodplain.
4.5.6 Developments in composition of landingsChanges can be expected in catch composition resulting from changes in the composition of the fish community and the biomass of the different target species, as consequences of three interacting processes: (i) natural succession of species after the impoundment of the Volta River; (ii) decadal and long-term trends in water levels driven by climate variation and water management; and (iii) fishing pressure. Although the largest changes in fish community composition can be expected in the first decade after impoundment, succession may still play a role in the observed changes, in particular when combined with climatic changes and associated changes in water level, as observed in Lake Kariba (Kolding, Musando and Songore, 2003). Water levels show a general decreasing trend following impoundment, both as a result of climate and management, albeit with large decadal variations. How fishing pressure interacts with, and contributes to, these directional changes and with annual and decadal fluctuations depends on the size ranges, trophic levels and spatial ranges of the fish community.
For example, if fishers target specific size classes, they exert a directional influence on the trophic interactions within the fish community through the selective removal of these size classes. In the previous paragraphs, it was argued that Lake Volta fishers probably exploit all trophic levels and a wide range of spatial habitats. Judging from the wide range of gear and mesh sizes used, the available information (presented in Figures 56 and 57) and anecdotal information (Goudswaard, unpublished reports), a wide range of sizes in the catch can also be expected. A tendency for large individuals and species to disappear from the fisheries has been widely recorded from many rivers and lakes, irrespective of fishing strategy (Welcomme, 1999, 2001), but no direct information that this has occurred on Lake Volta is available. Large individuals are still present in the fishery (Figure 56), although, as will be shown with catch developments by category, a shift to smaller specimens in catch is probably taking place (Figure 61).
FIGURE 61Relative changes in catch composition from Lake Volta at Dzemeni and Kpando markets
(southern section of the reservoir), 1989–2006

Review of tropical reservoirs and their fisheries110
High-resolution time series of catch rates are needed, preferably from experimental surveys using consistent survey design to monitor changes in relative biomass, species composition, length and food web structure. In the absence of such data, catch rates from the fishery can be used as a proxy. However, the only long-term data that are available for Lake Volta are landing estimates from the various markets around the reservoir. If the Lake Volta fishery is indeed an unselective fishery that closely follows and adapts to long-term and short-term changes taking place in the fish communities, the aggregated landings at the markets will reflect these changes in the fish community as a result of the three processes acting on them. If aggregated landings at different markets along the reservoir show the same or similar directional patterns, this would confirm that similar processes are taking place in different parts of the reservoir and that the fishery at least reacts to these processes in the same way. Local differences in species composition may reflect local differences in the availability of species, but probably more important than species per se are the changes in community composition with regard to different aspects such as trophic position, size and behavioural patterns in relation to the flood pulse (migration, habitat utilization, breeding patterns, etc.). Long-term landings data are available for the two markets along the southern part of the reservoir, Dzemeni and Kpando-Tokor. Long-term data on landings exist for other markets, in particular Yeji, but only a few years of data were available for this review. The relative composition of landings changed considerably over the period examined, most notably with the increasing dominance of Chrysichthys species and the decline of tilapia. This is particularly clear for the Dzemeni and Kpando landings (Figure 61), but similar changes seem to have taken place in Yeji (Figure 62). The relative composition of landings at Yeji also shows a large increase in the contribution of Clupeidae (Cynothrissa), but this is less apparent at Dzemeni and Kpando.
FIGURE 62Relative changes in catch composition from Lake Volta at Yeji market
(northern section of the reservoir), 1990–2006
Note: No data for 1991–2002.

Lake Volta, Ghana 111
Closer inspection of developments in landings of individual categories reveals that at Dzemeni and Kpando, ten categories show declining trends in landings, two categories (Distichodus, Labeo) remain stable (although with much variation), and three categories (Chrysichthys, Bagrus and Clupeidae) show increasing trends in landings (Figure 63). The available time series data from Yeji are too short, and data gaps are too wide, to make any conclusive statements, but visual inspection of the time series shows patterns that generally do not contradict those of the Dzemeni and Kpando landings (Figure 64). The two series have four categories that are not in common: Gymnarchus (declining trend) and Clarias (stable) at Yeji and Hemichromis (declining) and other (stable) at Kpandu. Five of the remaining 14 categories (Labeo, Alestes, Schilbeidae, Hydrocynus and tilapia) seem to be stable or show declining trends at Yeji, in contrast to the Dzemeni and Kpandu time series. The remaining nine categories at Yeji show trends similar to those in the Dzemeni and Kpandu time series: increasing trends can be inferred for Chrysichthys, Bagrus and Clupeidae, while Distichodus is stable. Five categories (Citharinidae, Mormyridae, Heterotis, Lates and Synodontis) show declining trends.
Similar patterns in fish availability seem to occur in the northern and southern parts of the reservoir. This is confirmed when analysing changes in the overall trophic level of landings at these two sites (Figure 65). The overall trophic level is lower at Yeji than at Dzemeni and Kpando, although over the last few years it has been almost the same. In both cases, a slight increase to just above trophic level 3 is seen. Excluding the two main contributors to the landings, Chrysichthys and tilapias, the trophic level of the landings at the two markets clearly increases over time.
These findings contradict those in marine systems, where fishers worldwide are fishing down the food web, whereby large species that feed at higher trophic levels are
01 1
01 2
01 3
01 4 )67;0.2;1( sudohcitsiD
01 1
01 2
01 3
01 4 )29-74;0.2;3( oebaL
01 1
01 2
01 3
01 4 )17;0.2;1( sunirahtiC
01 1
01 2
01 3
01 4 )56-51;0.3-3.2;4( setselA
01 2
01 3
01 4
01 5 )52-71;9.3-2.3;2( simorhcimeH
01 2
01 3
01 4
01 5 )16-04;5.3;2( eadieblihcS
5002000259910991589101 3
01 4
01 5
01 6 )051-11;6.3-5.2;21( eadirymroM
5002000259910991589101 3
01 4
01 5
01 6 )221;6.2;1( sitoreteH
sn = psn = p
10.0 < pr2 45.0 =
10.0 < pr2 74.0 =
50.0 < pr2 32.0 =
50.0 < pr2 53.0 =
10.0 < pr2 74.0 =
10.0 < pr2 94.0 =
01 1
01 2
01 3
01 4
01 5
01 6 )61-4;3.4-1.3;3( eadiepulC
01 3
01 4
01 5
01 6 )402-8;3.3;71( srehtO
01 3
01 4
01 5
01 6 )002;5.4;1( setaL
01 3
01 4
01 5
01 6 )521-17;0.4;2( surgaB
01 3
01 4
01 5
01 6 )16-22;9.2;8( sitnodonyS
01 4
01 5
01 6
01 7 )19;7.3;2( sunycordyH
5002000259910991589101 4
01 5
01 6
01 7 ) 47-61;1.2;4( aipaliT
5002000259910991589101 4
01 5
01 6
01 7 )68-34;7.3-6.2;3( syhthcisyrhC
10.0 < pr2 14.0 =
100.0 < pr2 65.0 =
100.0 < pr2 18.0 =
50.0 < pr2 92.0 =
100.0 < pr2 28.0 =
100.0 < pr2 18.0 =
50.0 < pr2 26.0 =
sn = p
FIGURE 63Trends in log10-transformed landings (kilograms dry weight) by species group at Dzemeni
and Kpando markets between 1989 and 2008
Note: The figure shows only significant trends (p < 0.05) and the proportion of explained variability (coefficient of determination = r2). In parentheses are, respectively, the number of species, the trophic level and its range, and the maximum observed total length of the species and its range (cm). If variation in trophic level is ≤ 10, the average trophic level is given. Note differences in scale on the y axes.
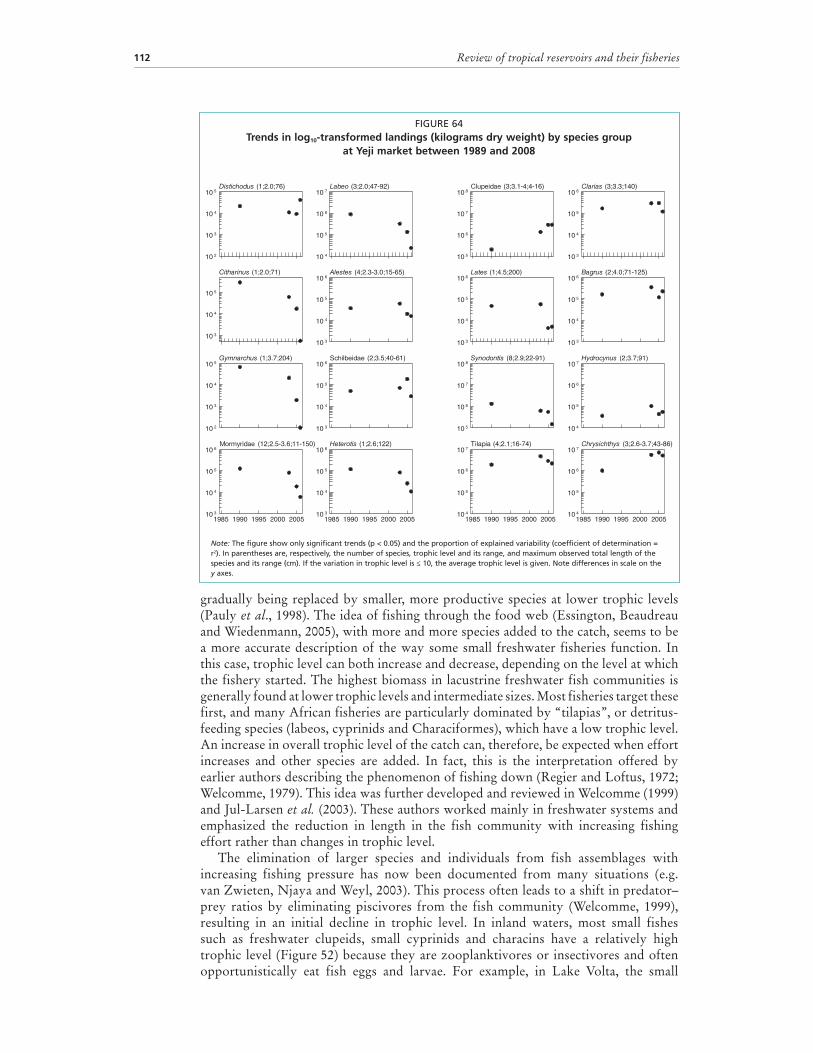
Review of tropical reservoirs and their fisheries112
gradually being replaced by smaller, more productive species at lower trophic levels (Pauly et al., 1998). The idea of fishing through the food web (Essington, Beaudreau and Wiedenmann, 2005), with more and more species added to the catch, seems to be a more accurate description of the way some small freshwater fisheries function. In this case, trophic level can both increase and decrease, depending on the level at which the fishery started. The highest biomass in lacustrine freshwater fish communities is generally found at lower trophic levels and intermediate sizes. Most fisheries target these first, and many African fisheries are particularly dominated by “tilapias”, or detritus-feeding species (labeos, cyprinids and Characiformes), which have a low trophic level. An increase in overall trophic level of the catch can, therefore, be expected when effort increases and other species are added. In fact, this is the interpretation offered by earlier authors describing the phenomenon of fishing down (Regier and Loftus, 1972; Welcomme, 1979). This idea was further developed and reviewed in Welcomme (1999) and Jul-Larsen et al. (2003). These authors worked mainly in freshwater systems and emphasized the reduction in length in the fish community with increasing fishing effort rather than changes in trophic level.
The elimination of larger species and individuals from fish assemblages with increasing fishing pressure has now been documented from many situations (e.g. van Zwieten, Njaya and Weyl, 2003). This process often leads to a shift in predator–prey ratios by eliminating piscivores from the fish community (Welcomme, 1999), resulting in an initial decline in trophic level. In inland waters, most small fishes such as freshwater clupeids, small cyprinids and characins have a relatively high trophic level (Figure 52) because they are zooplanktivores or insectivores and often opportunistically eat fish eggs and larvae. For example, in Lake Volta, the small
01 2
01 3
01 4
01 5 )67;0.2;1( sudohcitsiD
01 4
01 5
01 6
01 7 )29-74;0.2;3( oebaL
01 3
01 4
01 5
)17;0.2;1( sunirahtiC
01 3
01 4
01 5
01 6 )56-51;0.3-3.2;4( setselA
01 2
01 3
01 4
01 5 )402;7.3;1( suhcranmyG
01 3
01 4
01 5
01 6 )16-04;5.3;2( eadieblihcS
5002000259910991589101 3
01 4
01 5
01 6 )051-11;6.3-5.2;21( eadirymroM
5002000259910991589101 3
01 4
01 5
01 6 )221;6.2;1( sitoreteH
01 5
01 6
01 7
01 8 )61-4;4-1.3;3( eadiepulC
01 3
01 4
01 5
01 6 )041;3.3;3( sairalC
01 3
01 4
01 5
01 6 )002;5.4;1( setaL
01 3
01 4
01 5
01 6 )521-17;0.4;2( surgaB
01 5
01 6
01 7
01 8 )19-22;9.2;8( sitnodonyS
01 4
01 5
01 6
01 7 )19;7.3;2( sunycordyH
5002000259910991589101 4
01 5
01 6
01 7 )47-61;1.2;4( aipaliT
5002000259910991589101 4
01 5
01 6
01 7 )68-34;7.3-6.2;3( syhthcisyrhC
FIGURE 64Trends in log10-transformed landings (kilograms dry weight) by species group
at Yeji market between 1989 and 2008
Note: The figure show only significant trends (p < 0.05) and the proportion of explained variability (coefficient of determination = r2). In parentheses are, respectively, the number of species, trophic level and its range, and maximum observed total length of the species and its range (cm). If the variation in trophic level is ≤ 10, the average trophic level is given. Note differences in scale on the y axes.

Lake Volta, Ghana 113
clupeid Odaxothrissa mento feeds on fish, while Sierrathrissa leonensis feeds on zooplankton and insects (E. Abban, personal communications, 2009). The length-based process is therefore expected to force the fish assemblage in the direction of these small species, as opposed to towards the detritus and phytoplankton feeders, which are usually larger, giving rise to the apparent reversal in fishing down the food web. Whether such a fishing down process has taken place cannot be fully ascertained owing to limited category resolution in the catch data. Present catches of demersal fish are dominated by specimens of < 35 cm (Figure 56). Categories of larger fish such as Citharinus, Heterotis, Lates and Hydrocynus indeed show decreasing catch trends, while small clupeids have increased. Other categories are more difficult to interpret, as they include catches of species that can attain a wide range of maximum lengths, but it can be expected that large Mormyridae and Alestidae are also susceptible to increased fishing pressure, so decreasing catches of these groups may indicate such trends as well. On the other hand, catches of Bagridae, which can become quite large,
FIGURE 65Mean trophic levels of landings and the FiB index
Note: Mean trophic level (TL) of the landings at Dzemeni and Kpando markets (south) and at Yeji market (north) and the mean TL of the landings at both markets, excluding Chrysichthys and tilapia. Fishing-in-balance (FiB) index calculated from the total catch in a year and the mean TL of the catch in that year, both of total catches and catches excluding Chrysichthys and tilapia. The trophic efficiency is set at 0.1. Changes in the FiB index are relative to 1989 in the south and 1990 in the north. The continuous line is the three-year moving average relative water level.

Review of tropical reservoirs and their fisheries114
are increasing. Whether the increase in Chrysichthys indicates a shift from the larger C. nigrodigitatus to the smaller C. auratus is not clear. However, a shift in targeting species that attain smaller sizes is indeed taking place in Lake Volta and is consistent with the generally observed pattern that fishers are reducing their mesh sizes (Dankwa, personal communication).
The FiB index (Pauly and Watson, 2005) is defined as: FiBk = log[Yk .(TE-1)TL
k] – log[Y0. (TE-1)TL0]
where Y = yield, TL = trophic level, and TE = transfer efficiency, here set at 0.1. The subscripts refer to the year k counted from the baseline year 0. This index reveals whether changes in trophic level are associated with proportional increases in catch related to abundance at different trophic levels (FiB = 0). Figure 65 (bottom) indicates that for Dzemeni and Kpando the FiB index initially fell in the early 1990s. After 1994, it increased to a level > 0 and steeply increased after 2001. After 2005, it fell again slightly. The FiB index for the Yeji area shows a similar pattern. This indicates that bottom-up effects – in other words, nutrient-driven effects – are increasingly dominant in the fishery. Further spatial expansion of the fishery became unlikely as the nearshore, benthic and pelagic areas of the reservoir became fully utilized (over the period). However, it appears that tilapia (Oreochromis, Sarotherodon and tilapia species) and Chrysichthys catches are dominant in driving the observed increase in the FiB pattern. When they are excluded, the FiB index now fluctuates around 0, indicating a balanced fishery where changes in trophic level are met by appropriate catch levels at the trophic level targeted. Both Chrysichthys and tilapia species groups are low trophic-level categories, which points to a fishery that is increasingly reliant on, and adapts itself to, the bottom-up processes that drive these catch categories and, therefore, is increasingly reliant on the flooding regime. That long-term changes in water level may partly drive these processes is suggested by Figure 65, in which the FiB index may be negatively correlated with average water levels over longer periods of generally increasing or decreasing water levels, indicated by the three-year moving averages.
4.5.7 Effect of water level on fish productionThree processes that operate at different temporal and spatial scales affect fish catches that respond to changes in water level:
or rising water levels and the associated changes in reservoir area and volume. This change in catchability will be observed almost immediately in the catch rates of a specific fishery, with a short lag of one to two months (fishers may also adapt by changing the types of fishing gear they use).
size of the change in water levels, both as results of changing nutrient inputs from the flood pulse and of the area of the ecotone or floodplain inundating or drying up. Changes in the size of the flood pulse will result in changes in recruitment, which will be observed with a lag of one to several years (up to four) in the catch depending on the size range caught in the fishery and the growth rate of the species.
long-term climatic variability brings long-term trends in reservoir water volume or area overall. This will bring changes in community composition depending on the direction of the change and the form of the reservoir basin. These last changes are confounded by the expected natural succession in the fish community. Lake Volta has large areas of relatively shallow inundated plains combined with the deep gorge of the original river, and it can be expected that fish communities may change between those adapted more to

Lake Volta, Ghana 115
riverine and floodplain (lotic) conditions or those adapted more to lake-like (lentic) conditions.
Floodplain characteristics in fisheries as described in the flood pulse concept (Junk, Bayley and Sparks, 1989), with its seasonal growth and seasonal reproduction related to water level, are generally recognized as typical for reservoirs such as Lake Volta. However, limited analysis has been carried out on the short-term and long-term effects of the seasonal fluctuations of the water level. De Graaf and Ofori-Danson (1997) correlated total daily catch rates of the fishery in stratum VII with water levels and the number of canoes. They concluded that catch rates correlate positively with water levels with some time lag and negatively with the number of canoes. Although it is not clear at what temporal scale the analysis was done, it was most probably on a monthly scale (their graph shows daily catch rates and water levels, but an earlier analysis of effort shows monthly totals in number of canoes, while no sample size of any of the variables is given). Given the above information, their analysis shows the effect of changes in catchability and local effects of changes in effort (process 1).
A similar process of seasonal changes in catchability has been noted by Braimah (1995). He observed that fish catches were high when water levels were low and vice versa (Figure 66) – based on water level fluctuations and monthly commercial fish catches recorded in the Yeji part of the Lake Volta from July 1989 to December 1991. These fluctuations in monthly fish catches in the Yeji part of the reservoir are very much influenced by the tilapia and Chrysichthys catches – when water levels are high, catches for both species groups are low, and vice versa. No information on changes in fishing effort over the same period was given. These seasonal changes in the relative availability of species, and in particular of tilapia and Chrysichthys, may also be inferred by visual inspection of the relative composition of landings as shown in Figure 61, although further analysis is needed to confirm this.
FIGURE 66Reservoir water levels and commercial catches in stratum VII, July 1989–December 1991
Source: Braimah, 1995.
Different parameters of the flood pulse can have different impacts on recruitment levels to the fishery (Welcomme and Halls, 2004). The speed and size of the change in water level can even have divergent effects on availability and accessibility of habitats, as well as recruitment for different species. This analysis used the absolute minimum

Review of tropical reservoirs and their fisheries116
and maximum water levels and the degrees of inundation (water level rise in metres over one year) and recession (water level decline in metres over one year) to analyse these impacts on recruitment to the fishery. The absolute maximum and minimum levels signify the total amount of potentially available habitat for spawning, nursing, feeding and growing, while the levels of inundation and recession signify the relative change in availability of habitats during a year (Figure 49). This is better expressed by an inundation index, which indicates annual habitat availability (Figure 50). The impacts on the catches and landings in the fishery can be immediate, i.e. within the same year with no lag. For most species, this would be a result of changed availability of habitats characterized by different levels of accessibility. This corresponds in fact to a change in catchability, although it can be a recruitment effect on fast-growing species that are caught in their first year of growth. Conversely, the impacts can have a lag of one or more years. These are true recruitment effects, i.e. changes in water-level parameters that cause changes in survival and individual and population growth rates. As most fish species recruit to the fishery within one to four years after birth, similar lags of one to four years are expected. This was tested through regression analysis of annual changes in landings on maximum or minimum water levels or seasonal levels of inundation and recession with lags of zero to four years (Table 28).
TABLE 28Regression of annual change in landings in kilogram with changing water level, by species
Species Water-level parameter
No lag Lag 1 year Lag 2 years Lag 3 years Lag 4 years
slope r2 Slope r2 slope r2 slope r2 slope r2
Bagrus Maximum + 0.27*
Chrysichthys Maximum + 0.27*
Heterotis Maximum + 0.21*
Others Maximum + 0.36*
Synodontidae Maximum + 0.32*
Total Maximum + 0.25*
Bagrus Minimum + 0.25*
Chrysichthys Minimum + 0.24*
Others Minimum + 0.24* + 0.31*
Synodontidae Minimum + 0.32*
Alestes recession – 0.37** + 0.31*
Citharinus recession + 0.56*
Hemichromis recession – 0.27* + 0.31*
Heterotis recession + 0.25*
Hydrocynus recession – 0.27*
Labeo recession + 0.45**
Others recession + 0.54*** – 0.39**
Tilapia recession – 0.39** + 0.29* – 0.25*
Total recession + 0.26* – 0.24*Alestes inundation + 0.35**
Citharinidae inundation – 0.58* – 0.51*
Labeo inundation + 0.31* – 0.40* – 0.32* + 0.45**
Mormyridae inundation + 0.26* – 0.35* + 0.31*
Others inundation + 0.25*
Synodontidae inundation + 0.35**
Alestes Inundation index + 0.53*** + 0.44*
Citharinus Inundation index – 0.54*
Labeo Inundation index + 0.53**
Mormyridae Inundation index – 0.23*
Others Inundation index – 0.42**
Synodontidae Inundation index + 0.36*
Tilapia Inundation index + 0.37**
+ = positive slope, – = negative slope, * = significant at 5%, ** = significant at 1%, *** = significant at 0.1%, r2 = coefficient of determination.Note: Annual maximum or minimum water level or the seasonal levels of inundation (maximum this year, minimum last year) and recession (maximum last year, minimum this year) are in metres. Regressions are carried out with lags of zero (level of this year) to four years (level of four years ago). Only significant relations are shown. N = 17 in all cases.

Lake Volta, Ghana 117
Positive relations in Table 28 indicate a positive effect of the specific water-level parameter on the catch, in other words on species availability through effects of recruitment, survival and growth. Negative relations are somewhat harder to understand, as higher or more quickly rising water levels would lead to decreased survival and growth in later years and vice versa, which could be the result of species-specific requirements regarding the size and timing of inundation and recession. Mechanisms of the impacts of water levels on species survival and growth may be different on a species-by-species basis; both for positive and negative relations, and final explanations should be on a species (group) or trait basis. The landings data for Dzemeni and Kpando markets are used as a proxy for species availability over years. Virtually all the species show increasing or declining trends over time as a result of succession, fishing or long-term fall in water levels. To disregard these long-term processes and focus on the immediate (or lagged) effect of the water-level parameters on the landings, one needs to consider the variations around the long-term trends, i.e. the change in landings. To achieve this, long-term trends in catches of species were removed through differencing the data, i.e. the landings of yeart-1 were subtracted from the landings of yeart. Absolute maximum water levels positively affected total landings four years after the event. Recessions immediately boosted landings, with greater recessions bringing greater increases in total catches relative to the trend. Two different groups of species contribute to these two different effects, while a third group shows no effect in relation to changes in water levels.
Direct negative effects of the size of recession (no lag) were observed for Alestes, Hemichromis and tilapia, indicating that larger recessions result in lower relative catches of these species in that year and vice versa. Except for Alestes baremoze and A. dentex, these species are nesting or substrate spawners that require swampy or floodplain conditions for reproduction and enter floodplains during inundation. Hemichromis lives in littoral riverine habitats and permanent floodplain lagoons with clear water. This is a nesting substrate spawner that breeds in the early summer. Tilapia zillii is a substrate spawner that prefers shallow, vegetated areas. Fry are common in marginal vegetation, while juveniles are found in the seasonal floodplain. The negative relation with the size of recession may be related to specific fishing methods for these species that target them in shallow waters. Larger areas of this habitat will remain in years with limited recessions. Both Alestes and tilapia are positively related to the inundation index, pointing to an increased relative catch with larger availability of flooded areas. Alestes baremoze performs downstream migrations during floods and recessions, and Alestes landings were positively affected by the size of the inundation (35 percent of the variability explained). Alestidae are open-water spawners and can have huge fluctuations in juvenile abundances depending on the size of the flood pulse, so the immediate effect can be on landings of both adults and young of that year. Recessions have a positive relation to the catch two years later, possibly indicating an effect of increased survival during large recessions and vice versa. In conclusion, landings of these species all increase with increased areas of inundation during a year. Heterotis, a typical floodplain species, can grow quite large, and landings of this species are again affected by the absolute flood levels three to four years earlier.
The second group of species – those affected by the absolute maximum levels four years earlier – are all large catfish such as Chrysichthys, Synodontis and Bagrus. Most of these species can grow large and can live in lakes, swamps and rivers, but prefer muddy and silty substrates. Some of the species are nest builders and require shallow, quiet areas. Synodontids are also positively affected by high minimum water levels, again indicating that these species do well in large, relatively stable, flooded areas. A similar explanation could be given for the Citharinidae, Labeo and Mormyridae. In this group of species, the size of inundation negatively correlates

Review of tropical reservoirs and their fisheries118
with the relative size of the landings with a two-to-three-year lag, whereas landings are positively related to the size of recession. The specific life-history requirements of these categories of species apparently demand shorter periods of inundation for their recruitment to be successful. A factor influencing their breeding success may be that a very rapid rise and fall in level negatively affects spawning and nursery areas by stranding or overly deep flooding. Landings of the third group of species, Clupeidae, Lates spp. and Schilbeidae, showed no effects from water levels.
A word of caution regarding the interpretation of these results is that no statistical power analysis was carried out, but it can be expected that statistical power would be low, given the low number of observations and the high uncertainty around landings data. It is also probable that some of the observed significant effects are spurious. Longer time series and comparison between time series from different landing sites would allow more certain conclusions. Interactions between the ecotone and deeper parts of the reservoir, as well as the effects of more upstream areas on lower parts of the reservoir, should also be taken into account. Correlations between catches in different areas could reveal spatial shifts in species composition. It is too early to infer strong predictions from these analyses. However, it is encouraging that the effects of the various water-level parameters can be directly related to market landings and, further, that these effects appear to be logically related to the specific behavioural and life-history requirements of the species considered. It suggests that the aggregated landings at the various markets could be useful for examining and predicting the effects of the flood pulse. It also confirms that the fishers of Lake Volta readily adapt to changing conditions, make use of the flood pulse and efficiently follow changes in fish stocks.
4.6 EXTERNAL FACTORS AFFECTING LAKE VOLTA FISHERY PRODUCTIVITY4.6.1 Demography and sociocultural transformationPrior to the creation of the Lake Volta, the Ewe (specifically, the Battor) people were the dominant fishers on the Volta River. The creation of the reservoir prompted a rush of people to settle around it and the current main ethnic groups, in order of dominance, are the Mafi, Agave, Bakpa, Ga Adangbe, Fante, Battor, Mepe, Tefle, Nehummuru, Ningo, Anlo, Sokpoe and Gonja. The other groups are the Hausa/Gao, Vume and Nzima, who are minorities in the fishing villages. The Battor, Mafi, Agave, Bakpa, Mepe, Tefle, Sokpoe, Anlo and Vume (generally referred to as Ewe) dominate fishing on Lake Volta. They are followed by Ga Adangbe and Fante. This illustrates the way in which the traditional occupants of the river area around the present reservoir are being supplanted by incoming ethnic groups from various regions of Ghana.
In settlements, ethnic groups tend to aggregate in clusters. The organization of clusters seems to depend on fish availability in parts of the reservoir and, therefore, on the water level, as people tend to follow the floods and receding waters. Ewe and some Ga Adangbe build more permanent mud-walled houses, as compared to the temporary straw houses of the Fante that correspond to their higher mobility in search of better fishing grounds. Although the ethnic groups generally live in harmony, conflicts arise over fishing methods (e.g. regarding acadjas). Fisherfolk spend the greater part of their life in fishing villages, with the age of the oldest active fishers varying between 61 and 90 years (STEPRI-WorldFish, unpublished data). However, fisherfolk are generally relatively young. The modal age class for both sexes is 21–30 years (83.3 percent of women and 83.9 percent of men are aged between 10 and 40 years). The average household tends to be large, numbering between 10 and 12. This is often attributed to the labour-intensive nature of fishing and fish processing, for which more hands are needed. Males constitute 54 percent of the entire population. The average population growth rate in the fishing villages is 5.2 percent/year, which is higher than the national average of 3.1 percent/year, probably indicating significant immigration into fishing

Lake Volta, Ghana 119
communities. Until recently, the main occupation for fishers was fishing combined with farming and livestock and poultry rearing as supplementary activities. However, with low fish catches per fisher, the latter activities are becoming increasingly important. By the early 1990s, farming had become the most important economic activity in just over 10 percent of fishing villages (Asare and Osei-Bonsu, 1993).
4.6.2 Urbanization and tourismThe 32 major fish markets on Lake Volta are developing quickly, together with high concentrations of human settlements. Like most rural communities in Ghana, fishing villages on Lake Volta lack adequate infrastructure such as good roads, regular transport services, proper waste and sewage disposal systems, and schools. Associated with the fish-marketing centres has been the provision of ferry-crossing points, which facilitate vehicular and passenger mobility. Increased accessibility to market centres has increased demand for services of various kinds, thus initiating and expanding service industries and the jobs they bring in catering, entertainment, accommodation, trade, fishing and farming. Traders concentrate their commercial activities at fish markets and trade in fish, salt, fishing gear, yams, cassava dough and petroleum products. Other major business pursuits include outboard-motor spare parts and repair, boat and canoe construction, hotel accommodation, and abattoirs. Other small businesses are conducted from small shops, kiosks and table tops. Trading in maize, the distilling of local drinks and baking are other commercial activities flourishing at market centres. Fish traders from all the regions patronize the fish markets, and residents of market centres have gradually become less dependent on farming and hunting and increasingly enter into regular paid employment and trading. The centres around the fish markets have relatively little or no proper waste or sewage disposal or toilet facilities, with sewage and waste draining or being washed directly into the reservoir. In some places, such as Dodi Island in stratum II, recreational facilities and a resort have been established. Thousands of visitors visit the island, especially on weekends. Private entrepreneurs plan more resorts at Yeji, Abotoase and Buipe. A large crowd of holidaymakers may cause eutrophication in the reservoir, and there is concern for nearby fishing communities that drink untreated water from the reservoir.
The Government of Ghana plans the establishment of communal fishery centres in the major market centres Lake Volta. One has been completed at Kpando and Torkor, and another at Yeji. The centres provide facilities for landing, handling, processing and marketing fish, as well as stores, workshops, training and social facilities, and are intended to serve the needs of several thousand communities around the reservoir and distant fish traders. Conflicts have arisen over the sharing of revenue among traditional authorities, district assemblies and the management of the centres.
4.6.3 IndustrializationThe northern part of Lake Volta, especially the Buipe area and parts of the Volta Region (e.g. the Aveme area), have deposits of high-quality limestone. While the exploitation of the natural resource is well organized at the Buipe limestone quarry, small local operations in the Aveme area are thought to cause considerable damage. In addition to the limestone factory at Buipe, small entrepreneurs have established mills for cassava, maize and rice all along the reservoir, but highly concentrated in the fish market centres. A few timber merchants have established sawmills in Krachi District. Furniture builders are found in all the market centres. No information has been presented on the potential or actual extent of the impact of these activities on the reservoir environment.
Two major port facilities at Buipe and Akosombo for north–south water transportation have created conditions for the development of bulk storage facilities for fuel, fertilizers and cement for onward redistribution in northern Ghana. Burkina Faso now uses Ghana as its gateway for importing goods and benefits from these new ports. Bulk storage

Review of tropical reservoirs and their fisheries120
facilities, however, are thought to create large quantities of waste and spillover into the reservoir. No information has yet been presented detailing the impact on the reservoir.
4.6.4 Lake transportTransportation on Lake Volta is officially managed by the Volta Lake Transport Company. The transport system on the reservoir comprises: (i) a multipurpose bulk-cargo system for transporting commodities other than mineral oil products and a small number of passengers; (ii) a specialized bulk-cargo system for the contract transport of mineral oil products; and (iii) a passenger transport system.
Besides some divergence with the Volta River Authority (VRA), whose primary function is to generate and supply electrical energy for industrial commercial and domestic use in Ghana, when low water levels impede the movement of vessels, conflicts also occur between the Volta Lake Transport Company ferry operations and private transport boats for passengers and cargo across the reservoir. This has implications for fish traders, as they often travel on cargo boats and spontaneous fish markets generally arise at the landing sites of these boats along the reservoir (P.C. Goudswaard, personal communication).
4.6.5 Forestry and reforestationTree cover in the catchment area is thought to reduce wind and water erosion of soil, thereby improving water quality. Under the sponsorship of the VRA, two projects were initiated in 1995 to stimulate reforestation in the reservoir catchment. The Tree Cover Depletion Minimization Project was executed by the Integrated Development of Artisanal Fisheries Project in collaboration with other agencies with the aim of restoring 1 500 ha of tree cover by establishing wooded lots. Under the community collaborative forestry management programme, forest reserves are being established that are to be managed in collaboration with the settler communities in the reserves. A second project has the VRA working in collaboration with the Forestry Services Division of the Forestry Commission to restore 7 000 ha with fast-growing trees to protect the high slopes of the gorge area from erosion and prevent their causing siltation. Conflicts often arise between the VRA and the traditional authorities, which also lay claim to the lands adjoining the reservoir and wish to use the areas for other purposes than forest development.
4.6.6 Agricultural practicesAgricultureThe physical and ecological links between agriculture and fisheries of Lake Volta mainly relate to the intensity of erosion and subsequent siltation of the reservoir and to the use of agricultural fertilizers and pesticides. Major cropping systems in rainfed agriculture are: (i) the cassava–maize system found in deforested and degraded forest areas, in which cassava is intercropped with pepper, tomatoes, okra and nerri (watermelons Citrullus lanatus var. citroides); (ii) the yam–maize–cassava system practised in the disturbed and degraded forest zones, in which yam is intercropped with maize and cassava; and (iii) a rice system practised in lowlands and swampy upland sites.
Farmers have limited ability to take conservation measures to reduce soil erosion, as they use such simple tools as machetes, hoes and fire to clear and prepare land. The scale of soil disturbance may be great in shifting cultivation, as the soils are poor. Conflicts arise between farmers and the VRA, as the latter attempts to replant forests to mitigate siltation problems in the reservoir. Similar conflicts occur with the small irrigation schemes operating near the reservoir.
An important form of agriculture around the Lake Volta uses the land exposed during the seasonal recession of reservoir water level, locally called “drawdown agriculture”. The normal drop in the water level ranges from 2 to 6 m, which offers substantial areas of rich, arable land available for drawdown agriculture. Vanderpuye

Lake Volta, Ghana 121
(1984) estimated that a drop of 3.4 m drains at least 80 000 ha of additional land. In recent years, 35 percent of the drawdown area has been almost permanently cultivated under beans, rice, tomatoes, vegetables, okra and groundnuts as a result of the generally lower water levels (Figure 49) (Braimah, 1995).
The increase in the area under agriculture in the uplands and the drawdown area of the reservoir appears to accelerate wind and water erosion. The use of fertilizers and field-burning are thought to affect the reservoir through eutrophication. The use of herbicides and insecticides is known to cause mass fish kills when incorrectly applied, especially in the drawdown area. Fishing with agricultural pesticides used as poison is practised in shallow pools that remain when the water has receded, as well as in small streams. The target species is Heterotis niloticus. Because it is illegal and because there is considerable opposition to the method from many fishers in the area, it tends to be carried out in secret so it may be more common than reported (P.C. Goudswaard, personal communication).
LivestockLivestock production has become important since the late 1980s. Animals reared in the catchment area are cattle, sheep, goats, pigs and poultry. Most livestock are free range and kept by herders who do not practise supplementary feeding. Large herds of cattle from neighbouring countries, especially Burkina Faso, also use the area around the reservoir. The presence of these cattle herds contributes significantly to the income of traditional authorities through the sale of grazing rights. However, negative aspects are the conflicts that arise between upland settler farmers and herders, and between them and the operators of the tree-planting programmes, as well as with drawdown farmers whose crops are destroyed when cattle approach the reservoir for watering.
WildlifeThe 3 478 km2 Digya National Park was established on the western shore of Lake Volta near stratum IV, along the Sene, Digya and Obosum arms, in September 1971 (Figure 51). Fishing is not allowed at all in the Digya arm, but communities along the Sene and Obosum arms are allowed to fish on the bank bordering the park. Conflicts arise between fishers and hunters on one hand and the Wildlife Services of the Forestry Commission on the other.
4.7 CONCLUDING REMARKSThe information available for this review suggests that the plethora of data that exist on catch, catch rates, landings and reservoir dynamics are severely underused for managing the fisheries. Landings data seem to be used solely to estimate and report the total production of Lake Volta. Production estimates that are based on these landings are underestimated, as indicated by the analysis of catch rates in this review and by past and recent catch assessment and frame surveys. Moreover, in many reports the view is advocated that traditional stock assessment through standard models is all the information needed to manage the fishery, while it is clear and generally acknowledged that effort and landings estimates are not very well suited for making even simple assessments of biomass-dynamic approaches in a fluctuating environment. However, the analysis shows that existing data can be used to assess changes in the fishery. If one recognizes that fishers on Lake Volta target the whole fish community and, to a large extent, follow the ecological changes that arise from long-term and short-term variations in the flood pulse – i.e. fishers react to changes in catch rates that largely result from processes related to the flooding regime of the reservoir, even more than they create them through increased effort – it could be inferred that the landings data actually reflect the changes in the fish community and the availability of fish species. Hence, the landings data can be used to monitor long-term changes in fish

Review of tropical reservoirs and their fisheries122
communities in the reservoir, while short-term predictions could be made about the availability of species in relation to flood pulse dynamics. The long-term landings data that are available from several markets are an asset of which better use should be made. In the first place, the landing statistics of the different markets are independent samples from the same reservoir. Careful comparisons among these landing statistics in relation to some of the processes analysed in this review could provide more certainty in interpreting observed trends and reveal differences among various parts of the reservoir. Apart from short-term predictions of landings in relation to the flood pulse, knowledge of the behaviour and life-history of important species could inform local management approaches to fisheries and water levels. This knowledge would inspire management superior to that derived from traditional stock assessments, which do not take into account environmental variations or changes in carrying capacity that dominate the fish community processes in the reservoir.
Attempts at stock assessment in Lake Volta have been useful in so far as their outcomes have pointed to the fact that total production is severely underestimated, which was later confirmed by more detailed observations. However, they also led to the conclusion that the reservoir was severely overfished, as is usually the case with these models. While this cannot be ruled out, it turns out that claims of overfishing have been made over virtually the whole history of in the reservoir fishery, even when catch estimates were at 20 percent of what they are now. This points not only to the failure of these approaches and the inadequacy of the information base gained through species-by-species assessments for managing fisheries, but also to the failure to examine such claims critically. The overfishing discourse that has been adopted by many institutions and policy-makers, both directly and indirectly, and applied to fishery management may result in the marginalization and sometimes the criminalization of fishing communities (Béné, 2007), which are penalized as a direct result of this uncritical approach to fishery management information.
An approach to fishery management that recognizes the highly adaptive capacity of small-scale fisheries on this reservoir and could guide the efficient use of its available productivity would need a different information base. To follow and monitor the situation, a series of indicators needs to be developed that would reflect the dynamic nature of both the reservoir’s productivity and fishers’ reaction to that productivity. This review gives some direction to developing such an approach. Water level plays a central role in the productivity of the reservoir and should be central to fishery management plans. Attention to this dominant driver of the reservoir’s productivity should also direct more scientific attention to the mechanisms of species productivity at different temporal and spatial scales. For example, it should be recognized that Lake Volta is a relatively young reservoir and that the ecological succession of species in the fish communities may still play a dominant role in the observed changes, as has been recorded in Lake Kariba (Kolding, Musando and Songore, 2003). Such succession changes may be confounded with or accelerated by the changing long-term dynamics of water levels, with their overall downward trend, as well as with increasing fishing effort.
These conclusions call for an urgent and comprehensive assessment of the Lake Volta fisheries. A very important part of this assessment should be a careful and thorough reanalysis of the existing long-term but fragmented data sets, including market landings that have been collected over the years and are still being collected. Such an assessment would help identify the information available for fisheries management and guide the choice of the appropriate methodologies for statistical fishery monitoring. It would further directly inform policies on improving the reservoir’s productivity, while maintaining the ecological sustainability of the pulsing heart of Ghana.
REFERENCESAbban, E.K. 1999. Integrated development of artisanal fishes. Integrated Development
of Artisanal Fisheries Project. GHA/93/008 43 pp.

Lake Volta, Ghana 123
Andah, W. & Gichuki, F. 2003. Volta Basin Profile: Strategic research for enhancing agricultural water productivity (Draft). International Water Management Institute, Challenge Program on Water and Food, Accra.
Antwi, L.A.K. 1990. Limno-chemistry of Volta Lake 25 years after its formation. Institute of Aquatic Biology Technical Report. 11 pp.
Asare, E.O. & Osei-Bonsu, S.N. 1993. Impact assessment of project on the forest ecosystem. Integrated Development of Artisanal Fisheries Project Technical Report. 136 pp.
Béné, C. 2007. Diagnostic study of the Volta Basin fisheries. Focal Basin Project – Volta. Report No. 1: Overview of the Volta Basin fisheries resources. Penang, Malaysia, WorldFish Center. 32 pp.
Biswas, S. 1966a. Ecological studies of phytoplankton in the newly forming Volta Lake of Ghana. Journal of the West African Science Association, 11: 14–19.
Biswas, S. 1966b. Oxygen and phytoplankton changes in the newly forming Volta Lake in Ghana. Nature, 209(5019): 218–219.
Biswas, S. 1969. Hydrobiology of the Volta River and some of its tributaries before the formation of the Volta Lake. Ghana Journal of Science, 8: 152–166.
Braimah, L.I. 1995. Recent developments in the fisheries of Volta Lake (Ghana). In R.R.M. Crul & F.C. Roest, eds. Current status of fisheries and fish stocks of four largest African reservoirs, pp. 111–134. Committee for Inland Fisheries of Africa Technical Paper No. 30. Rome, FAO. 134 pp.
Braimah, L.I. 2000. Full frame survey at Lake Volta, Ghana – 1998. Fisheries Subsector Capacity Building Project. Integrated Development of Artisanal Fisheries Project, Yeji, Ghana. 196 pp.
Braimah, L.I. 2001. Volta Lake fisheries management plan. Fisheries Subsector Capacity Building Project, Accra.
Braimah, L.I. 2003. Fisheries Management Plan for the Volta Lake, Accra, Ghana. Ministry of Food and Agriculture, Directorate of Fisheries. 77 pp.
Czernin-Chudenitz, C.W. 1971. Volta Lake research, Ghana: physico-chemical conditions of Lake Volta, Ghana. Technical Report No. 1 prepared for the Government of Ghana by FAO as executing agency for UNDP: FISF/GHA 10. Rome, FAO. 77 pp.
Daget, J. 1956. Les eaux et les poissons de Haute-Volta Mem. Institut français d’Afrique noire, 50: 95–169.
Daget, J. 1960. Poissons de la Volta Noire et de la Haute Comoé. Bulletin du Museum National d’Histoire Naturelle, 2e sér., 32(4): 320–330.
Dankwa, H.R., Abban, E.K. & Teugels, G.G. 1999. Freshwater fishes of Ghana: identification, distribution, ecological and economic importance. Annales Sciences Zoologiques, 283: 53.
de Graaf, G.J. & Ofori-Danson, P.K. 1997. Catch and fish stock assessment in stratum VII of Lake Volta. Integrated Development of Artisanal Fisheries Project Technical Report No. 97/I. Rome, FAO. 96 pp.
Denyoh, F.M.K. 1969. Changes in fish populations and gear selectivity in Volta Lake. In L.E. Obeng, ed. Man-made lakes: the Accra symposium, pp. 206–219. Accra, Ghana University Press.
Dickson, K.B. & Benneh, G. 1977. A new geography of Ghana. London, Longman Group. 173 pp.
Entz, B. 1969. Observations on the limno-chemical conditions of the Volta Lake. In L.E. Obeng, ed. Man-made lakes: the Accra symposium, pp. 110–115. Accra, Ghana University Press.
Essington, T.E., Beaudreau, A.H. & Wiedenmann, J. 2005. Fishing through marine food webs. Proceedings of the National Academy of Sciences, 103(9): 3171–3175.

Review of tropical reservoirs and their fisheries124
Evans, W. A. & Vanderpuye, J. 1973. Early development of the fish populations and fisheries in Volta Lake. In W.C. Ackerman, G.F. White & E.B. Worthington, eds. Manmade lakes: their problems and environmental effects, pp. 94–100. Washington, DC, American Geophysical Union.
Ewer, D.W. 1966. Biological investigations on Volta Lake, May 1964 to May 1965. In R.H. Lowe-McConnell, ed. Man-made lakes, pp. 21–31. London, Symp. Biol. Inst.
FAO. 1971. Volta Lake Research, Ghana. Physico-chemical conditions of Lake Volta, Ghana. Based on the work of C.W. Czernin-Chudenitz. Technical Report No. 1. FI:SF/GHA 101. Rome.
FAO. 2003. Review of the state of world fishery resources: inland fisheries. FAO Fisheries Circular No. 942. Rome. 60 pp.
Goudswaard, P.C. 1993a. Biometric data on commercial fish species of Lake Volta. Integrated Development of Artisanal Fisheries Project unpublished report. Rome, FAO. 5 pp.
Goudswaard, P.C. 1993b. Catch and effort of commercial fishing methods in Lake Volta. Integrated Development of Artisanal Fisheries Project unpublished report. Rome, FAO. 19 pp.
Goudswaard, P.C. 1993c. Length frequency of processed fishes at the Yeji market, November 1991–December 1992. Integrated Development of Artisanal Fisheries Project unpublished report. Rome, FAO. 14 pp.
Goudswaard, P.C. & Avoke, S.K. 1993a. Fish species in the northern arm of Lake Volta. Integrated Development of Artisanal Fisheries Project unpublished report. Rome, FAO. 19 pp.
Goudswaard, P.C. & Avoke, S.K. 1993b. The Chrysichthys fishery in the northern arm of Lake Volta, Ghana. Integrated Development of Artisanal Fisheries Project unpublished report. Rome, FAO. 15 pp.
Goudswaard, P.C. & Avoke S.K. 1993c. Landing, transporting, trading and recording of processed fish in Yeji market. Integrated Development of Artisanal Fisheries Project unpublished report. Rome, FAO. 12 pp.
Henderson, H.F. & Welcomme, R.L. 1974. The relationship of yield to morpho-edaphic index and numbers of fishermen in African inland fisheries. Rome, FAO. 26 pp.
Irvine, F.R. 1947. The fishes and fisheries of the Gold Coast. London, Crown Agents for the Colonies.
Jul-Larsen, E., Kolding, J., Overa, R., Nielsen, J.R. & van Zwieten, P. 2003. Management, co-management or no management? Major dilemmas in southern African freshwater fisheries. FAO Fisheries Technical Paper No. 426/1. Rome, FAO. 127 pp.
Junk, W.J., Bayley, P.B. & Sparks, R.E. 1989. The flood pulse concept in river-floodplain systems. In D.P. Dodge, ed. Proceedings of the International Large Rivers Symposium, pp. 110–127. Canadian Special Publications of Fisheries and Aquatic Science No. 106.
Kolding, J. & van Zwieten, P. 2006. Improving productivity in tropical lakes and reservoirs. Challenge Programme on Food and Water, Aquatic Ecosystems and Fisheries. Cairo, WorldFish Center. 139 pp.
Kolding, J., Musando, B. & Songore, N. 2003. Inshore fisheries and fish population changes in Lake Kariba. In E. Jul-Larsen, J. Kolding, R. Overa, J.R. Nielsen & P. van Zwieten, eds. Management, co-management or no management? Major dilemmas in southern African freshwater fisheries, pp. 67–101. FAO Fisheries Technical Paper No. 426/1. Rome, FAO. 127 pp

Lake Volta, Ghana 125
Kunstmann, H. & Jung, G. 2004. Impact of regional climate change on water availability in the Volta Basin of West Africa. IAHS, Foz do Iguaçu, Brazil, April 2005. IAHS publ. 295. pp. 1–11.
Lévêque, C., Paugy, D. & Teugels, G.G. 1991. Annotated check-list of the freshwater fishes of the Nilo-Sudan river basins, in Africa. Revue Hydrobiologie Tropicale, 24(2): 131–154.
Mills, D.I., West lund, L., de Graaf, G., Willmann, R., Kura, Y. & Kelleher, K. 2011. Under reported and under valued: Small-scale fisheries in the developing world. In: R.S. Poomeroy & N.L. Andrew, eds. Small-scale Fisheries Management: Frame worlds and Approaches for the Developing World, pp. 1-15. CABI, Oxfordshire.
Ministry of Fisheries and Aquaculture (MOFA). 2003. Fisheries Management Plan for the Volta Lake. Accra. 75 pp.
Musick, J.A. 1999. Criteria to define extinction risk in marine fishes: the American Fisheries Society initiative. Fisheries, 24(12): 6–14.
Ntow, W.J. 2003. The limnochemical conditions of the northern portion (Yeji area) of the Volta Lake 30 years after impoundment. Tropical Ecology, 44(2): 263–265.
Obeng-Asamoah, E.K. 1984. A limnological evaluation of Volta Lake. SCOPE/UNDP United Nations Development Programme, Sonderband Heft 55. Hamburg, Germany. pp. 425–435.
Ofori-Danson, P.K. & Antwi, L.A.K. 1994. Limnology of the Volta Lake (Akosombo Gorge area) twenty five years after impoundment. Tropical Ecology, 35(1): 69–82.
Ofori-Danson, P.K. & Ntow, W.J. 2005. Studies on the current state of the limno-chemistry and potential fish yield of Lake Volta (Yeji sector) after three decades of impoundment. Ghana Journal of Agricultural Science, 35: 65–72.
Pauly, D. & Watson, R. 2005. Background and interpretation of the ‘marine trophic index’ as a measure of biodiversity. Philosophical Transactions: Biological Sciences, 360: 415–423.
Pauly, D., Christensen, V. & Walters, C. 2000. Ecopath, ecosim and ecospace as tools for evaluating ecosystem impact of fisheries. ICES Journal of Marine Science, 57: 697–706.
Pauly, D., Christensen, V., Dalsgaard, J., Froese, R. & Torres, Jr., F.J. 1998. Fishing down marine food webs. Science, 279: 860–863.
Petr, T. 1968. Distribution, abundance and food of commercial fish in the Black Volta and the Volta man-made lake in Ghana during its first period of filling (1964–1966). I. Mormyridae. Hydrobiologia, 32: 417–448.
Petr, T. 1973. Distribution, abundance and food of commercial fish in the Black Volta and the Volta man-made lake in Ghana during the filling period (1964–1968). II. Characidae. Hydrobiologia, 45(2–3): 303–337.
Prins, H.P. 1992. Tsakla. Een vissersdorp aan het Volta meer. Verslag van een veldonderzoek naar de leefwijze van de vissers in het noordelijk deel van het Volta-meer in Ghana (West Africa). University of Amsterdam. (MSc thesis)
Rajagopal, P.K. 1969. Preliminary observations on the vertical distribution of plankton in different areas of Volta Lake. In L.E. Obeng, ed. Man-made lakes, the Accra symposium, pp. 123–126. Accra, Ghana University Press.
Regier, H.A. & Loftus, K.H. 1972. Effects of fisheries exploitation on salmonid communities in oligotrophic lakes. Journal of the Fisheries Research Board of Canada, 29(6): 959–968.
Reynolds, J.D. 1973. Biology and fisheries potential of four species of Alestes (pisces Characidae) in the new Volta Lake, Ghana. Revue de zoologie et de botanique africaines, 87: 298–307.

Review of tropical reservoirs and their fisheries126
Roberts, T.R. 1967. A provisional check-list of the fresh-water fishes of the Volta basin, with notes on species of possible economic importance. Journal of the West African Science Association, 12(1): 10–18.
Roman, R. 1966. Les poissons des hautes bassins de la Volta. Annales of the Musée Royal d’Afrique Centrale, Ser. 8.
Ryder, R.A. 1965. A method for estimating the potential fish production of north-temperate lakes. Transactions of the American Fisheries Society, 94: 214–218.
Ryder, R.A. 1982. The morphoedaphic index: use, abuse, and fundamental concepts. Transactions of the American Fisheries Society, 111: 154–164.
Talling, J.F. 1963. Origin of stratification in an African rift lake. Limnology and Oceanography, 8: 68–78.
Tanaka, M., Adjadeh, T.A., Tanaka, S. & Sugimura, T. 2002. Water surface area measurement of Lake Volta using SSM/I 37-GHz polarization difference in rainy season. Advances in Space Research, 30: 2501–2504.
van Densen, W.L.T. 2001. On the perception of time trends in resource outcome. Its importance in fisheries co-management, agriculture and whaling. Enschede, The Netherlands, Twente University. 328 pp.
Vanderpuye, C.J. 1984. Synthesis of information on selected African reservoirs – Lake Volta in Ghana. In J.M. Kapetsky, & T. Petr, eds. Status of African reservoir fisheries, pp. 261–321. Rome, FAO. 326 pp.
van Zwieten, P.A.M., Njaya, F. & Weyl, O. 2003. Effort development and the collapse of the fisheries of Lake Malombe: Does environmental variability matter? In E. Jul-Larsen, J. Kolding, R. Overa, J.R. Nielsen & P. van Zwieten. 2003. Management, co-management or no management? Major dilemmas in southern African freshwater fisheries, pp. 134–162. FAO Fisheries Technical Paper No. 426/2. Rome, FAO. 271 pp.
van Zwieten, P.A.M., Sidik, S.A., Noryadi, Suyatna, I. & Abdunnur. 2006. Aquatic food production in the coastal zone: data-based perceptions on the trade-off between mariculture and fisheries production of the Mahakam Delta and Estuary, East Kalimantan, Indonesia. In C.T. Hoanh, T.P. Tuong, J.W. Gowing & B. Hardy, eds. Environment and livelihoods in tropical coastal zones: managing agriculture - fishery - aquaculture conflicts, pp. 219–236. UK, CABI Publishing, in association with the International Rice Research Institute, Philippines, and the International Water Management Institute, Sri Lanka.
Viner, A.B. 1969. Observations of the hydrobiology of the Volta lake, April 1965–April 1966. In L.E. Obeng, ed. Man-made lakes: the Accra symposium, pp. 133–144. Accra, Ghana University Press.
Viner, A.B. 1990. Hydrobiology of Lake Volta: some observations on biological features associated with the morphology and water stratification. Hydrobiologia, 35: 230–248.
Welcomme, R.L. 1972. The inland waters of Africa. Committee for Inland Fisheries of Africa Technical Paper No. 1. Rome, FAO. 117 pp.
Welcomme, R.L. 1979. Fisheries ecology of floodplain rivers. Longman. 317 pp.Welcomme, R.L. 1999. A review of a model for qualitative evaluation of exploitation
levels in multi-species fisheries. Fisheries Ecology and Management, 6: 1–20.Welcomme, R. L. 2001. Inland fisheries, ecology and management. Oxford, UK,
Blackwell Science. Welcomme, R.L. & Halls, A. 2004. Dependence of Tropical River Fisheries on Flow. In
R.L. Welcomme & T. Petr, eds. Proceedings of the Second International Symposium on the Management of Large Rivers for Fisheries, pp. 267–284. Vols. I & II. RAP Publication 2004/17. Bangkok, FAO Regional Office for Asia and the Pacific.

127
5. General discussion
5.1 IS FISHING EFFORT DRIVING CATCH RATES OR ARE CATCH RATES DRIVING FISHING EFFORT? Nearly all reservoirs and artificial lakes become less fertile some years after inundation, as the initial supplies of nutrients are washed out or fixed in sediments (Petr, 1975, 1978; Kolding, Musando and Songore, 2003). The chemical composition of freshwater systems is a function of the hydrological regime and the geological nature of the surrounding catchment area. Schindler (1978) found that external nutrient loading explained most of the variance in phytoplankton production in a global lake review. Together, this indicates that lakes and reservoirs do not maintain their fertility unless external loading of nutrients is continually applied, and the hydrological regime is a major regulator for this supply (Kolding, 1994; Kolding and van Zwieten, 2006). Lakes and reservoirs can vary from highly stable systems to highly pulsed, but most reservoirs are at the pulsed end of the spectrum owing to their intimate association with rivers (Jul-Larsen et al., 2003). The more pulsed a system is, in terms of water-level changes relative to the depth of the system, the more the hydrological regime will act as a productivity driver and the less amenable it becomes to traditional fishery control, in which effort is considered the regulator of productivity.
It is still generally assumed, however, that unmanaged open-access fisheries will overshoot the sustainable carrying capacity of the system and eventually undermine productivity, leading to overfishing and possibly fishery collapse. Small-scale African freshwater fisheries are generally unmanaged in the sense that there are very few restrictions on nominal effort or fishing gear that are actually enforced (Jul-Larsen et al., 2003). This situation is generally perceived and interpreted as the main cause for the overfishing that is almost uniformly claimed in all lakes and reservoirs. However, when examining the output of a range of African freshwater fisheries, expressed as annual catch per area, or tonnes per square kilometre – in effect a measure of the productivity of a water body – against the density of operating fishers (numbers per square kilometre), it appears that each fisher catches on average 3 tonnes (range 1–5 tonnes) irrespective of the system in which they fish, indicating a linear relationship between production and effort (Kolding et al., 2008; and Figure 67).
This result suggests that the overall fishing effort (density of fishers) exerted on these systems is regulated by the productivity of the ecosystem through individual catch rates, instead of the other way around (productivity regulated by fishing effort) as usually assumed. Several conditions may lead to this particular situation:
not only choose between different fishing patterns, they may also choose to enter or to leave the fishery depending on the opportunities it offers in relation to other options, as well as the risks involved in fishing per se. In other words, catch rates can be driving fishing effort instead of the other way around, and fishers will, on average, start targeting different species or groups in the fish community or simply leave a fishery when individual catch rates drop below about 3 tonnes.
fishers cannot boost their catch rates to a high level because they cannot invest in more efficient or larger gear, often owing to lack of access to credit.

Review of tropical reservoirs and their fisheries128
to increase the efficiency of particular types of gear. This means that the types of gear are chosen based on their efficiency in selectively targeting a particular component of a fish community, but the overall selection by the fish community of all gear taken together reflects the productivity of the various components of that fish community. Fishers go for the highest biomass present in different components of a fish community, which may change seasonally or over the years. This may also explain the high spatial and temporal dynamics in fishing patterns, or choice of fishing methods, often seen in these fisheries.
Preferences exist in species, taste and size (for non-cured fish); but on a per kilogram basis the differences in price are minimal between, say, “chisense”, “Kapenta” and dried “Pale” (Oreochromis) or “Nile perch”. This means that there is no selectivity on sizes and species driven by markets, as there is for example with many North Sea fishes.
FIGURE 67Catch rates and effort density in 15 African lakes and reservoirs
Note: Data are from 1989–1992. The regression line indicates an average annual yield of about 3 tonnes/fisher irrespective of waterbody and country. Superimposed (open circles) is the development in Lake Victoria between 1970 and 2004, which shows how productivity increased over time concurrently with the increase in effort. After an initial boom in production in the late 1980s and early 1990s, the catch rates again approached the overall mean.Source: Kolding et al., 2008.
In situations where these conditions are met, effort will regulate itself through a dynamic range of fishing patterns and through catch rates. It can also be assumed that the productivity of the system will be largely optimized by the same mechanisms, as any decrease in catch rates below the average will drive fishers out of the fishery, unless no other livelihood opportunities exist to reduce the risk of fishing.
The fisheries of Lake Volta and the IGB reservoirs can both be described as effectively open access. However, the resulting dynamics in the utilization of productive capacity appears to be rather different between the two systems, possibly because of differences in the potential “exit” strategies available to the local fishers. There is insufficient information from the reviews to fully support this claim, but there is enough evidence to advance it as a hypothesis that merits further investigation. The Lake Volta fishery, with its average annual catch per fisher of about 2–4 tonnes for all fishing methods, appears to share at least a number of the characteristics listed above. Since 1970, the number of fishers has increased by four times. This development has coincided with

General discussion 129
a decrease in average investment per fisher, as indicated by the increase in the number of fishers per vessel. A highly diverse and dynamic fishery has developed, illustrated by the ability of fishers and fishing communities to react quickly through seasonal and spatial reallocation of fishing effort. The result is a wide range of sometimes highly inventive fishing methods that are often applied only seasonally, depending on the availability of target species. The fishing methods used target a range of different trophic levels (Figure 55) and cover a large spatial range (Figure 58). A trading system has developed that is geared towards these dynamics. Multispecies landings at different markets show the same directional patterns in composition, reflecting the general changes in the fish community that probably are a result of separate processes acting on them: nutrient supply (determined by water level); succession; and effort. The landings show that, as effort increases, additions and shifts in the importance of species result in an overall increase in trophic level.
This suggests that the fishery started at lower trophic levels, mainly targeting tilapias, and only later shifted to higher trophic levels, targeting catfishes and pelagic species when the biomass of the species in the early fishery decreased. These adaptations have created a fishery for all trophic levels, which could be an indication that it is becoming unselective at the community level. This is supported by the general increase in the diversity of gear, from an initial gillnet fishery to a multigear fishery at present. Limited information is available on fisher movements in and out of the fishery and the relationship between agriculture and fishing, but it can be expected that fishing is a temporary or complementary occupation for many. No direct information is available on the marketing or pricing of fish, but the markets appear to readily adjust to the changes in species.
The very high efficiency of the Lake Volta fishery is clearly illustrated in Figure 67, where it has the highest productivity of the 15 African lakes and reservoirs compared. Although it also has by far the highest density of fishers, the average catch rate is not below the regression line, which suggests that the productivity is sustainable and is regulating effort, as opposed to the more conventional view that effort drives productivity. Based on this figure alone, there are no indications that Lake Volta is overfished at present and recent size frequencies (Figures 56 and 57) support this notion.
Lake Nasser, on the other hand, is found at the lower end of the productivity range in Figure 67. There are a number of explanations for this. This is probably at least partly the result of Lake Nasser being the northernmost, and therefore seasonally coldest, of the 15 lakes and reservoirs. More important, though, is that: (i) there is no fishery for small pelagics in Lake Nasser; (ii) there are few landing sites; (iii) riparian settlements are few and fishing pressure fairly low; and (iv) a black market is estimated to subtract about 50 percent of the catch from the official landings. Still, it is interesting that Lake Nasser is considered overfished by the local management institutions, largely owing to the decrease in official landings, although they are strongly biased by smuggling. No other objective criteria support the notion that Lake Nasser is being overfished. As with other reservoirs, productivity correlates with changes in water level, which is a proxy for nutrient inputs (Figures 43 and 44).
When examining the large database on productivity and fishing effort for numerous reservoirs in the IGB, two things are striking: (i) the average productivity for these small, shallow waterbodies is extremely low; and (ii) the ratios between effort and fish productivity (kilograms per hectare) were less than one, indicating on average a falling marginal outcome per fisher with increasing productivity (see Figure 16). Although the data should be treated with caution, this lack of correlation suggests that fishing effort is determined by factors other than the productivity or the catch rates of the reservoir, which is the opposite of the case with African freshwater fisheries (Figure 67). In addition, no redistribution of fishing effort to reservoirs of higher productivity or to other income-generating activities seems to take place. Some of

Review of tropical reservoirs and their fisheries130
the management arrangements that could lead to this perhaps distorted relationship between productivity and effort densities have been described in the review. In earlier years, reservoir fishers were assisted with loans and subsidies, enhancement programmes, market interventions (e.g. fish pricing), crop-sharing schemes and licences issued either free or for a nominal fee, perhaps because they were perceived as one of the least organized and least productive groups in society. Reservoir fisheries in the IGB states often seem to serve as a safety-net option, where only limited opportunities for alternative employment exist (Paul and Sugunan, 1990). However, this situation has been found to be detrimental to the ecosystems and the exploited resource and is now presented as counterproductive to conservation and yield optimization. Although this scenario is largely associated with what are thought to be open-access situations, this system is not open access but highly regulated through some of the interventions listed above. It may, therefore, be more accurate to say that the absence of other income-generating opportunities is the major cause of low productivity. Therefore, the large variations in catch rates in Indian reservoirs, where fishers catch on average between 0.1 and 4 tonnes/year, possibly reflect different fishing arrangements for these reservoirs. There is indeed a wide range of different management systems adopted by the states, ranging from outright auctioning to almost free fishing, and it would be interesting to find out if and how such arrangements lead to the anomalously low productivity per fisher of these reservoirs, for which no other clear explanation exists.
5.2 PRODUCTIVITY OF RESERVOIRSGeneralizing about capture fishery production per water surface area is difficult because catch data are lacking or unreliable and, surprisingly, because of the paucity of data on water surface area in many countries. Productive reservoir fisheries have developed in small reservoirs in Africa with annual yields of up to 329 kg/ha, in Latin America and the Caribbean with annual yields of up to 125 kg/ha, and in Asia with annual yields of up to 650 kg/ha (FAO, 2002). By comparison, the estimated productivity of all Indian reservoirs, ranging from 11 to 46 kg/ha, as well as the Lake Nasser estimate of 36.4 kg/ha, are extremely low. In contrast, the productivity of Lake Volta, assuming a catch of 250 000 tonnes and an area of 8 500 km2, is high at 294 kg/ha. Even when the official (and most likely underestimated) landings statistics are used, the reservoir would still be producing 51–88 kg/ha. Therefore, the low productivity observed in Lake Nasser and the IGB may simply reflect underreported catches, as with many other inland fisheries. Even so, if one assumes that the landings reported from Lake Nasser represent only 50 percent of the total catch, production per hectare would still be only about 73 kg/ha, which is comparable with low-productivity reservoirs in China (79 kg/ha), Thailand (74 kg/ha) and Indonesia (64 kg/ha). The productivity of Lake Nasser may, therefore, indicate underutilization of available resources, in addition to the lack of an open-water pelagic fishery, as described earlier.
It is difficult to compare directly data on a yield-per-hectare basis, as yield is not proportionally related to lake or reservoir size. A direct comparison between the productivity of the various lakes and reservoirs is possible, using annual yields of a hypothetical 1 000 ha lake based on log-log regressions of yield and lake area (Figure 68). This type of analysis, based on a selection of waterbodies for which information is available (Kolding and van Zwieten, 2006), provides estimates of annual average yields in Asia of 365 kg/ha for Philippine lakes, 239 kg/ha for Sri Lankan reservoirs, 79 kg/ha for Chinese reservoirs, 74 kg/ha for Thai reservoirs and 65 kg/ha for Indonesian reservoirs (Van Densen et al., 1999). Similar regressions for South American reservoirs suggest annual yields for a 1 000 ha reservoir of 144 kg/ha for Cuba and of 234 kg/ha for Mexico. By comparison, a hypothetical African lake of 1 000 ha would produce 168 kg/ha. Note from these figures that only in the case of the Philippines would the catch increase proportionally with the size of the waterbody;

General discussion 131
for the rest, the slope is less than one. However, for a set of small reservoirs in South America, including very small ponds and reservoirs with high stocking densities, there is a significant increase in yield per unit area with waterbody size (Kolding and van Zwieten, 2006). Generally, however, in Africa, China, Cuba and Thailand, measures of catch per unit area decrease significantly with increase in lake or reservoir area. Medium-sized Sri Lankan reservoirs are highly productive, with annual catches sometimes reaching well above 200 kg/ha.
FIGURE 68Comparison of productivity of selected lakes and reservoirs
Note and sources: (A) Plot of total yield in kilograms on surface area in hectares for (1, open squares) 83 reservoirs in China of 9–10 824 ha (De Silva, Lin and Tang, 1992); (2, crosses) 20 reservoirs in Thailand (1 280–41 000 ha); (3, dots) 19 reservoirs in Sri Lanka (225–7 825 ha); (4, triangles) 17 Philippine lakes (206–90 000 ha, including Laguna de Bay) (Moreau and De Silva, 1991) and (5, open circles) 9 reservoirs in Indonesia (Hardjamulia and Suwignyo, 1988) (referred to in and plot redrawn from van Densen et al., 1999). (B) Plot of total yield on surface area for (1, open squares) 86 reservoirs in Cuba (5–7 945 ha); (2, crosses) 7 reservoirs in Mexico (5 200–96 000 ha); (3, open circles) 31 small reservoirs in Brazil, 1 in Peru, 1 in Costa Rica, 4 in others (0.016–0.07 ha) (data from Quirós, 1998). (C) Plot of total catch on surface area for 19 African lakes and reservoirs (11 300–6 880 000 ha) (data from van den Bossche and Bernacsek, 1990; Bayley, 1988; Kolding and van Zwieten, 2006). (D) Plot of total yield on surface area for reservoirs in Madhya Pradesh (27), Rajasthan (20), Uttar Pradesh (4), Himachal Pradesh (2) and Bihar (33) (data from Sugunan, 1995). All regressions are according to: log10 Yij = log10 a + b. log10 Si + ij, where Yij = total yield (kg), Si= area (ha), log a = intercept and b = slope. SE = the standard error, r2 = proportion of explained variation, *** = p < 0.001. No regression was made for the reservoirs in Rajasthan as the data appear to be calculated through a model and not based on observations. A, B and C adapted and updated from Kolding and van Zwieten (2006).
The catches from smaller tropical Southeast Asian reservoirs are generally dominated by the introduced tilapia, which is self-sustaining without supplementary stocking.
Following a similar analysis, a hypothetical 1 000 ha IGB reservoir would yield a low average of 20 kg/ha. This is anomalously low and seems to be far below the theoretical potential yield. It is not clear from either the present review or the general literature what causes this low productivity in reservoirs of the IGB.
The general explanation is based on the “the lack of understanding of reservoir ecology, trophic dynamics, inadequate stocking, wrong selection of species for stocking, small size of stocking materials and ‘irrational’ exploitation” (CIFRI, 2006), which apparently characterize many reservoirs in the IGB. To these potential reasons could be added the impacts of hydrological regimes for electricity generation or irrigation that may not fit species requirements for habitat and spawning, as well as the management regimes regulating fishing effort and fishing patterns as described above. Whatever the cause, these different hypotheses indicate a need for a more thorough

Review of tropical reservoirs and their fisheries132
study of these reservoirs, recognizing that the causes may not be wholly ecological but related to overall effort as well as the management regime. It is clear that the theoretical potential for improvement is very high.
5.3 TOWARDS INDICATOR-BASED MANAGEMENTConsiderable quantities of data and information have been compiled for this review and an attempt has been made to summarize them. In all three case studies, the review reveals that information from different disciplines has rarely been integrated into a consistent framework useful for fishery management. Overall, the available information fails to explain the low productivity observed in the IGB reservoirs and Lake Nasser. In both cases, many data from a range of studies are available, although rarely synthesized. Yet all these fragmented, short-term, piecemeal studies do not allow good analysis and comprehension of the main drivers and changes in states that were observed in these systems. In fact, all these data, when considered separately or compiled as mere descriptions, may even lead to an information overload that prevents meaningful analyses. To allow the emergence of patterns through data analysis, a historical perspective is required. Ordering data in time series is an essential and necessary step towards assessing changes in relation to fisheries, fish communities and productivity. This essential step in understanding system drivers and pressures on fish stocks and fish communities, and in framing the processes examined into observed patterns, proved to be an almost insurmountable task in all three case studies.
The process of gathering information appears to be informed by institutional preconceptions as to the underlying mechanisms. Typical of these is the “effort drives catch rates” preconception in the cases of Lakes Nasser and Volta, or “nutrients drive fish production” in the case of the IGB reservoirs. Gathering data and managing information, therefore, focused on achieving better knowledge in relation to the preconceived notions, such as catch and effort through single-species stock assessments in the case of Lakes Nasser and Volta, and of fish production by stocking and enhancement through establishing the limnologically determined productive capacity of reservoirs in the case of the IGB reservoirs. Other information not included in the institutionalized paradigm, but possibly relevant to explaining the behaviour of fish communities, ecosystems and users of the reservoirs were, unfortunately, considered extraneous. For example, it is quite revealing that very few data are available on fishing effort, stocking levels or catch for virtually all the IGB reservoirs examined. Judging from the available literature, these types of variables do not seem to be considered important information for management. At the same time, detailed information is available on a range of physical, limnochemical and limnological properties of all reservoirs. By contrast, in Lake Volta, where the maintenance of catch and effort data collection is problematic, this limitation is considered a real hindrance to assessing the state of the fishery. Meanwhile, the most important physical feature of the Volta system – the enormous annual changes in reservoir area – is a factor that has a great impact on its productivity, but is largely ignored by the management and research institutions. In the case of Lake Nasser, it has been noted that, since the 1970s, fishery research has largely focused on limnology and fish biology, even though this research has rarely been used to guide management decisions. For a long time, the management focus appeared to be on the output (catch) and not so much on the input (effort), although this seems to have changed more recently, as there is now a perceived need to assess the stocks in the reservoir in order to optimize production. Research on fish biology and limnology concentrates on separate and isolated states and processes at different ecosystem levels – nutrients, algae, zooplankton and fish – which are all studied separately and with limited recognition of states and flows at other levels. There is, however, limited focus on such main external drivers of the ecosystem behaviour of Lake Nasser as long-term, gradual changes through sediment input and
General discussion 133
seasonal changes in fluctuations in water levels, both of which can be expected to have a strong influence on fish community change and ecological succession.
Any attempt to account for both the full range and size of species caught in a reservoir or lake, as well as the full range of gear catching them, and to relate this information to external drivers of nutrients and productivity, such as water levels, requires complex information. This requirement to present large quantities of information in an informative way is addressed by indicator approaches now being developed in the context of ecosystem approaches to fisheries management (e.g. Cury and Christensen, 2005). The use of indicators has the advantage of making a direct link between drivers (e.g. water level, and climate affecting temperature and nutrient inputs), states (e.g. species abundance and catch rates) and pressures (e.g. fishing effort and catch), something that is often lacking in current stock-assessment models in fisheries management. In all three cases examined in this report, an examination of the time series of relevant information on ecosystem drivers, fish stocks and fish community states, as well as human-use pressures (effort, catch and stock enhancement), would offer a better understanding of the system and a longer-term perspective on the validity and outcomes of management approaches. This approach would assist in identifying fishery-management and ecosystem-management problems and in setting appropriate and realistic goals and quantified objectives for management. In addition, it would allow evaluation of the effectiveness of management measures and development initiatives. Last but not least, a time series approach to information could be a vehicle to direct management-relevant, process-based research with regard to both biological processes and the social and economic aspects of the productive use of the reservoirs.
This review is a first attempt to systematically compile and consolidate the available data over as long a time frame as possible. In all cases, it is clear that there is a great need to establish or maintain good catch and effort data-recording systems, i.e. recording both the output of and the input to the fishery, without which any evaluation of developments in the fishery and its productive capacity is virtually impossible. All three case studies confirm that analyses of productivity and productivity changes are severely limited by this lack of data and/or their unreliability. Calculating estimated yield capacity on the basis of primary production and related approaches, as is done in the IGB reservoirs, is merely a theoretical first-step exercise and cannot replace the actual monitoring of catch, stock enhancement and effort data to assess the effectiveness of biological management. A following step would be selecting indicators that cover the physical environment, primary and secondary biological levels, fish faunal composition, life-histories and abundance of the resources, and fishery dynamics in terms of yields, effort and catch rates, economics, and management.7 Together, these indicators should represent and illustrate a comprehensive picture of the present status and the past trends and changes of a reservoir ecosystem and its fisheries based on the best data available. Only when these data are viewed in combination will it be possible to derive an evidence-based understanding of the main processes that drive changes in productivity in reservoir ecosystems. In other words, there is a need for a phenomenological understanding of the system dynamics based on empirical observations, next to and in association with more theoretical and process-based approaches that aim at forecasting. This will be an iterative process where present understanding and needs will drive the choice of indicators. Through repeated evaluation of the changes monitored through the set of chosen indicators, a more comprehensive understanding of the emerging properties of the dynamics of the ecosystem will be possible (Kolding et al., 2008).
7 The reader may refer to recent literature on methodologies of selecting indicators for management within a predetermined framework (e.g. Rice and Rochet, 2005; Degnbol and Jarre, 2004; Shin et al., 2005; Choi et al., 2005), while van Zwieten et al. (2005) give an example of the development and use of such frameworks.
Review of tropical reservoirs and their fisheries134
Compiling information through indicators in regularly updated state-of-the-system reports would consolidate the information base for understanding these dynamics. These reports would help in steering monitoring programmes to collect information on all relevant levels of ecosystem behaviour as well as specific management questions for which detailed, process-based research may be necessary. In contrast to the more traditional approaches to management, which generally focus on only one driver (effort or nutrients), the broader, more systemic or holistic analyses would allow regularly updated assessments of the relative impacts of multiple drivers and pressures on the regime, the productivity of fish communities in the system, and an evaluation of the success of management in the light of the different drivers and pressures. In summary, all three case studies in this review have illustrated a serious mismatch between short-term academic, reductionist research approaches that aim to know all about a few isolated processes and simpler, but long-term and consistent, monitoring schemes that aim to map and eventually understand higher-level drivers and major interactions affecting human pressures, fish stocks and reservoir productivity. It is better to see the forest than scrutinize the trees.
REFERENCESBayley, P.B. 1988. Accounting for effort when comparing tropical fisheries in lakes,
river floodplains, and lagoons. Limnology and Oceanography, 33(4): 963–972.Central Inland Fisheries Research Institute (CIFRI). 2006. Inventory of reservoirs
in the Indian Indo-Gangetic Basin. Project report for the Challenge Programme CP34 Improved fisheries productivity and management in tropical reservoirs. Barrackpore, India. 33 pp.
Choi, J.S., Frank, K.T., Petrie, B.D. & Leggett, W.C. 2005. Integrated assessment of a large marine ecosystem: A case study of the devolution of the eastern Scotian shelf, Canada. Oceanography and Marine Biology: An annual review, 43: 47–67.
Cury, P.M. & Christensen, V. 2005. Quantitative ecosystem indicators for fisheries management. ICES Journal of Marine Science, 62: 307–310.
De Silva, S.S., Lin, Y. & Tang, G. 1992. Possible yield-predictive models based on morphometric characteristics and stocking rates for three groups of Chinese reservoirs. Fisheries Research, 13: 369–380.
Degnbol, P. & Jarre, A. 2004. Review of indicators in fisheries management: A development perspective. South African Journal of Marine Science 26: 303–326.
FAO. 2002. The State of World Fisheries and Aquaculture 2002. Rome. 150 pp.Hardjamulia, A. & Suwignyo, P. 1988. The present status of the reservoir fishery in
Indonesia. In S.S. De Silva, ed. Reservoir fishery management and development in Asia, pp. 8–18. IDRC Proceedings Series 264-e. Ottawa.
Jul-Larsen, E., Kolding, J., Nielsen, J.R., Overa, R. & van Zwieten, P.A.M. 2003. Management, co-management or no management? Major dilemmas in southern African freshwater fisheries. Part 1: Synthesis report. FAO Fisheries Technical Paper No. 426/1. Rome, FAO. 127 pp.
Kolding, J. 1994. Plus ça change, plus c’est la même chose. On the ecology and exploitation of fish in fluctuating tropical freshwater systems. University of Bergen (Dr. Scient. thesis)
Kolding, J. & van Zwieten, P.A.M. 2006. Improving productivity in tropical lakes and reservoirs. Challenge Program on Water and Food. Aquatic Ecosystems and Fisheries Review Series 1, Theme 3 of CPWF. Cairo, WorldFish Center. 139 pp.

General discussion 135
Kolding, J., Musando, B. & Songore, N. 2003. Inshore fisheries and fish population changes in Lake Kariba. In E. Jul-Larsen, J. Kolding, R. Overa, J.R. Nielsen, & P. van Zwieten, eds. Management, co-management or no management? Major dilemmas in southern African freshwater fisheries, pp. 67–101. FAO Fisheries Technical Paper No. 426/1. Rome, FAO. 127 pp.
Kolding, J., van Zwieten, P.A.M., Mkumbo, O., Silsbe, G. & Hecky, R. 2008. Are the Lake Victoria fisheries threatened by exploitation or eutrophication? Towards an ecosystem-based approach to management. In G. Bianchi & H.R. Skjoldal, eds. The ecosystem approach to fisheries, pp. 308–354. Wallingford, UK, CAB International.
Moreau, J. & de Silva, S.S. 1991. Predictive yield models for lakes and reservoirs of the Philippines, Sri Lanka and Thailand. FAO Fisheries Technical Paper No. 319. Rome, FAO. 42 pp.
Paul, S. & Sugunan, V.V. 1990. Development of reservoir fisheries: areas of hope and despair. In A.G. Jhingran, & V.K. Unnithan, eds. Reservoir fisheries in India, pp. 29–32. Proceedings of the national workshop on reservoir fisheries (3-4 January 1990). Special publication 3. Mangalore, India, Asian Fisheries Society Indian Branch.
Petr, T. 1975. On some factors associated with the initial high fish catches in new African man-made lakes. Archives of Hydrobiology, 75(1): 32–49.
Petr, T. 1978. Tropical man-made lakes: their ecological impact. Archives of Hydrobiology, 81(3): 368–385.
Quirós, R. 1998. Reservoir stocking in Latin America, and evaluation. In T. Petr, ed. Inland fishery enhancements. Papers presented at the FAO/DFID expert consultation on inland fishery enhancements in Dhaka, Bangladesh, 7–11 April 1997. FAO Fisheries Technical Paper No. 374. Rome, FAO. 463 pp.
Rice, J.C. & Rochet, M-J. 2005. A framework for selecting a suite of indicators for fisheries management. ICES Journal of Marine Science, 62(3): 516.
Schindler, D.W. 1978. Factors regulating phytoplankton production and standing crop in the world’s freshwaters. Limnology and Oceanography, 23(3): 478–486.
Shin, Y-J., Rochet, M-J., Jennings, S., Field, J.G. & Gislason, H. 2005. Using size-based indicators to evaluate the ecosystem effects of fishing. ICES Journal of Marine Science, 62: 384.
Sugunan, V.V. 1995. Reservoir fisheries of India. FAO Fisheries Technical Paper No. 345. Rome, FAO. 423 pp.
van den Bossche, J.P. & Bernacsek, G.M. 1990. Source book for the inland fishery resources of Africa, vol. 1 and 2. FAO Fisheries Technical Paper Nos. 18/1 and 18/2. Rome, FAO. 411 and 240 pp.
van Densen, W.L.T., Kechik, I.B.A., Balayut, E.A., Chookajorn, T., Moreau, J., Sarnita, A.S. & Yap, S.Y. 1999. Fish production, catch composition and changes in the freshwater fish communities in ASEAN lakes and reservoirs. In W.L.T. van Densen & M.J. Morris, eds. Fish and fisheries of lakes and reservoirs in Southeast Asia and Africa, pp. 229–244. Otley, UK, Westbury Publishing.
van Zwieten, P.A.M., Banda, M., Mwakiyongo, K., Manase, M., Kanyerere, G. & Nyasulu, T. 2005. Potential biological state and pressure indicators to evaluate the fisheries of Lake Malawi SE arm and Lake Malombe: Evaluative capacity of Fisheries Research Unit of Malawi. Literature review and indicator assessment. Case study: Southeast Arm of Malawi Knowledge in Fisheries Management Project (EU/INCO-DEV). 93 pp.


137
APPENDIX 1
Lake Nasser: additional tables
TABLE A1.1Water levels and area of Lake Nasser, 1979–2004
Year Maximum level (masl)
Minimum level (masl)
Average level (masl)
Surfacearea (km2)
Fresh fish output
(tonnes)
Total fish output (tonnes)
1979
1980
1981
1982
1983
1984
1985
1986
1987
1988
1989
1990
1991
1992
1993
1994
1995
1996
1997
1998
1999
2000
2001
2002
2003
2004
175.95
176.22
175.96
172.63
169.86
169.42
164.34
163.61
161.66
168.82
169.79
169.05
169.35
170.75
174.32
177.28
176.93
178.54
178.52
181.30
181.60
180.63
180.68
177.69
177.91
175.56
173.03
171.18
171.13
170.18
165.64
162.97
156.16
157.14
154.05
150.62
164.03
163.72
162.23
163.84
167.24
169.51
172.32
172.28
175.40
174.66
175.66
175.84
175.85
175.12
172.02
171.70
174.49
173.70
173.54
171.41
167.75
166.19
160.25
160.37
157.85
159.72
166.91
166.39
165.79
167.30
170.78
173.40
174.63
175.41
176.96
177.98
178.63
178.24
178.27
176.41
174.97
173.63
4 143
3 830
3 826
3 661
3 152
3 477
2 211
2 305
2 058
1 697
2 990
2 953
2 803
2 965
3 328
3 426
4 023
4 016
4 538
4 419
4 578
4 606
4 536
4 473
4 024
4 620
22 649
26 344
31 295
25 979
28 342
23 269
25 249
15 023
15 287
14 814
14 031
20 129
29 642
24 721
16 723
20 436
19 692
18 159
16 644
15 013
9 876
3 908
7 556
18 513
12 734
8 070
27 021
30 216
34 026
28 667
30 762
24 531
26 724
16 315
16 815
16 123
15 650
21 882
30 838
26 219
17 931
22 019
22 058
20 540
20 601
19 203
13 983
8 281
12 164
22 093
17 030
12 435
Source: Lake Nasser Development Authority.

Review of tropical reservoirs and their fisheries138
TABLE A1.2Evolution of reported fish catch from Lake Nasser by total weight, 1966–2004
Year
Fish catch
(tonnes)
Fresh Salted Total
1966 347 404 751
1967 782 633 1 415
1968 1 152 1 510 2 662
1969 2 802 1 868 4 670
1970 3 370 2 306 5 676
1971 4 316 2 503 6 819
1972 5 303 3 040 8 343
1973 8 027 2 560 10 587
1974 8 030 4 225 12 255
1975 10 384 4 251 14 635
1976 10 979 4 862 15 791
1977 12 279 6 192 18 471
1978 17 852 4 873 22 725
1979 22 649 4 372 27 021
1980 26 344 3 872 30 216
1981 31 295 2 911 34 206
1982 25 979 2 688 28 667
1983 28 885 2 397 31 282
1984 22 069 2 465 24 534
1985 24 975 1 475 26 450
1986 15 023 1 292 16 315
1987 15 287 1 528 16 815
1988 14 579 1 309 15 888
1989 14 031 1 619 15 650
1990 20 129 1 753 21 882
1991 29 642 1 196 30 838
1992 24 721 1 498 26 219
1993 16 723 1 208 17 931
1994 20 491 1 583 22 074
1995 19 693 2 365 22 058
1996 18 159 2 381 20 540
1997 16 546 3 957 20 503
1998 15 013 4 190 19 203
1999 9 876 4 107 13 983
2000 3 908 4 373 8 281
2001 7 556 4 608 12 164
2002 18 513 3 580 22 093
2003 12 734 4 295 17 030
2004 8 070 4 364 12 435
2005 11 015 4 270 15 285
Source: Lake Nasser Development Authority.

Appendix 1 139
TABLE A1.3Evolution of reported fish catch from Lake Nasser by species, 1966–2004
YearOutput (tonnes)
Fish species
Tilapia Samoos Bayad Libees Others Salted fish
(tonnes) (%) (tonnes) (%) (tonnes) (%) (tonnes) (%) (tonnes) (%) (tonnes) (%)
1966 752 275 36.6 6 0.8 25 3.3 133 17.7 na na 313 41.6
1967 1 414 471 33.3 27 1.9 69 4.9 310 21.9 na na 537 38.0
1968 2 663 764 28.7 77 2.9 64 2.4 751 28.2 na na 1 007 37.8
1969 4 670 1 975 42.3 289 6.2 112 2.4 953 20.4 na na 1 341 28.7
1970 5 676 2 384 42.0 451 7.9 176 3.1 817 14.4 na na 1 848 32.6
1971 6 819 3 157 46.3 518 7.6 245 3.6 934 13.7 na na 1 965 28.8
1972 8 343 4 146 49.7 451 5.4 259 3.1 826 9.9 na na 2 661 31.9
1973 10 588 7 108 67.1 391 3.7 161 1.5 210 2.0 na na 2 718 25.7
1974 12 255 7 243 59.1 490 4.0 124 1.0 83 0.7 na na 4 315 35.2
1975 14 634 9 659 66.0 525 3.6 121 0.8 4 0.0 na na 4 325 29.6
1976 15 791 10 582 67.0 448 2.8 76 0.5 na na na na 4 685 29.7
1977 18 470 11 182 60.5 563 3.0 66 0.4 362 2.0 na na 6 297 34.1
1978 22 725 17 044 75.0 na na na na na na na na 5 681 25.0
1979 27 020 22 346 82.7 373 1.4 46 0.2 332 1.2 na na 3 923 14.5
1980 30 216 25 427 84.2 432 1.4 30 0.1 375 1.2 na na 3 952 13.1
1981 34 196 30 529 89.3 400 1.2 21 0.1 434 1.3 na na 2 812 8.2
1982 28 666 23 713 82.7 275 1.0 11 0.0 307 1.1 na na 4 360 15.2
1983 31 282 27 809 88.9 258 0.8 6 0.0 197 0.6 520 1.9 2 492 8.0
1984 24 534 22 863 93.2 135 0.6 5 0.0 218 0.9 3 0.0 1 310 5.3
1985 26 999 24 907 92.3 139 0.5 3 0.0 171 0.6 274 1.1 1 505 5.6
1986 16 316 14 684 90.0 261 1.6 2 0.0 408 2.5 na na 961 5.9
1987 16 816 14 518 86.3 308 1.8 2 0.0 444 2.6 na na 1 544 9.2
1988 16 359 13 898 85.0 548 3.3 2 0.0 368 2.2 235 1.7 1 308 8.0
1989 15 650 13 008 83.1 709 4.5 2 0.0 313 2.0 na na 1 618 10.3
1990 21 883 19 563 89.4 477 2.2 na na 90 0.4 na na 1 753 8.0
1991 30 839 29 389 95.3 247 0.8 na na na na na na 1 203 3.9
1992 26 219 24 148 92.1 577 2.2 na na na na na na 1 494 5.7
1993 17 931 16 192 90.3 538 3.0 na na na na na na 1 201 6.7
1994 22 074 19 817 89.8 661 3.0 na na na na 55 0.3 1 541 7.0
1995 22 058 18 926 85.8 772 3.5 na na na na na na 2 360 10.7
1996 20 541 17 258 84.0 902 4.4 na na na na na na 2 381 11.6
1997 20 699 15 960 77.1 684 3.3 na na na na 98 0.6 3 957 19.1
1998 19 302 14 195 73.5 720 3.7 na na 98 0.5 98 0.7 4 191 21.7
1999 10 660 3 160 29.6 187 1.8 na na 277 2.6 2 929 92.7 4 107 38.5
2000 9 129 2 840 31.1 222 2.4 na na 847 9.3 847 29.8 4 373 47.9
2001 12 858 6 490 50.5 328 2.6 na na 716 5.6 716 11.0 4 608 35.8
2002 23 588 15 004 63.6 2 020 8.6 na na 1 492 6.3 1 492 9.9 3 580 15.2
2003 18 404 9 945 54.0 1 414 7.7 na na 1 375 7.5 1 375 13.8 4 295 23.3
2004 13 441 6 344 47.2 719 5.3 na na 1 007 7.5 1 007 15.9 4 364 32.5
na = not availableSource: Lake Nasser Development Authority.

Review of tropical reservoirs and their fisheries140
TABLE A1.4Evolution of the set price for tilapia harvested from Lake Nasser, 1979–2001
Year EGP/tonne
1979
1980
1981
1982
1983
1984
1985
1986
1987
1988
1989
1990
1991
1992
1993
1994
1995
1996
1997
1998
1999
2000
2001
173
173
173
173
200
200
353
640
640
640
1 048
1 160
1 160
1 350
1 350
1 650
1 650
1 905
2 405
2 405
2 600
2 600
2 600
Source: Lake Nasser Development Authority.
TABLE A1.5Tax per kilogram of fish, 1999
Item Piaster/kg
Transportation costs on the reservoir
Lake Nasser Development Authority
Aswan Governorate
Fish union
General Syndicate of Agricultural and Irrigation Labourers
Cooperative association
Miscellaneous
Taxes
Fishers social services box
Association for Hired Fishers Care
Fishers saving box
34.5
3.0
1.0
1.0
1.0
1.0
0.5
1.0
1.0
1.0
1.0
Total monetary discount per kg
Producer price of tilapia per kg
Discount percentage
46.0
260.0
17.7
Source: Lake Nasser Development Authority.

141
APPENDIX 2
Lake Volta: additional tables and information
TABLE A2.1Estimated total catch from Lake Volta, 1969–1977
Year Total catch stratum VII (tonnes)
Landings at Dzemeni and Kpando markets (strata II/III)
(tonnes)
Other estimates1
(tonnes)Estimated total catch
(tonnes)
1969 na na na 61 700
1970 na na na 39 200
1971 na na na 39 000
1972 na na na 36 000
1973 na na na 35 900
1974 na na na 37 300
1975 na na na 41 900
1976 na na na 40 700
1977 na na na 38 300
1978 na na na 37 261
1979 na na na 39 368
1980 na na na na
1981 na na na 40 000
1982 na na na 42 200
1983 na na na 43 200
1984 na na na 41 200
1985 na na na 43 200
1986 na na na 45 100
1987 na na na 45 100
1988 na na na 46 200
1989 na 3 717 na 46 200
1990 19 300 4 007 na 46 200
1991 na 3 597 36 3602 45 100
1992 na 3 796 na 45 100
1993 na 2 861 na 40 200
1994 na 3 894 na 42 200
1995 na 5 015 na 52 000
1996 33 800 5 033 150 000–200 0003 60 200
1997 na 4 724 na 62 200
1998 28 373 4 230 na 62 200
1999 na 4 773 na 78 800
2000 na 5 156 251 0004 74 800
2001 na 4 014 na 74 800
2002 na 3 990 na 74 800
2003 35 000 5 398 na 74 800
2004 na 6 604 na 53 900
2005 42 300 8 423 na na
2006 32 400 na na na
1 Fresh weight equivalent (= 3 × dry weight).2 including estimates for consumption (11.7 percent) and postharvest losses (5.7 percent) (Braimah, 1995).3 De Graaf and Ofori-Danson, 1997.4 MOFA, 2006; Braimah, 2001 and 2003.na = not available.Note: MOFA = Ministry of Fisheries and Agriculture. Braimah 2001 and 2003 not available; data cited from Béné (2007). Landings at stratum V in 1990 and 2003–2006 based on processed landings estimates from Yeji markets multiplied by 3 to obtain fresh weight equivalent.Sources: Volta Lake Research Project (UNDP/FAO/VRA); 1996: de Graaf and Ofori-Danson, 1997; 1998; 1978–1979: Vanderpuye, 1984; 1981–2004: estimated from Béné, 2007.
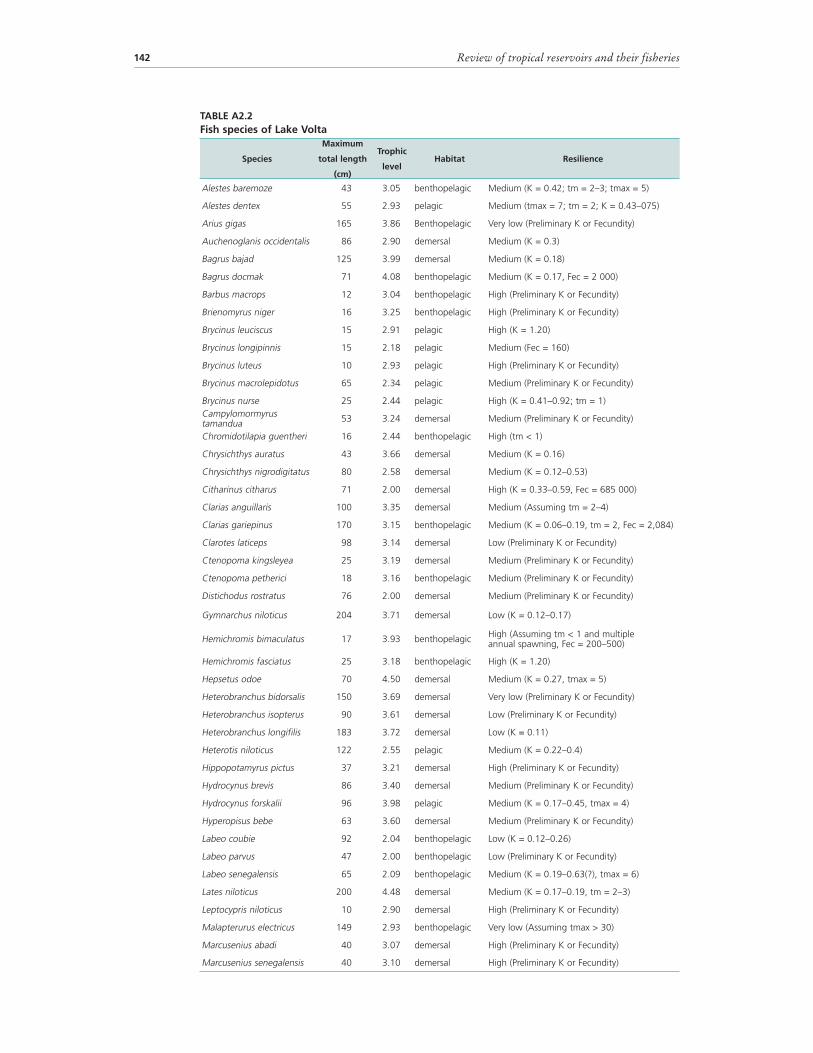
Review of tropical reservoirs and their fisheries142
TABLE A2.2Fish species of Lake Volta
Species
Maximum
total length
(cm)
Trophic
levelHabitat Resilience
Alestes baremoze 43 3.05 benthopelagic Medium (K = 0.42; tm = 2–3; tmax = 5)
Alestes dentex 55 2.93 pelagic Medium (tmax = 7; tm = 2; K = 0.43–075)
Arius gigas 165 3.86 Benthopelagic Very low (Preliminary K or Fecundity)
Auchenoglanis occidentalis 86 2.90 demersal Medium (K = 0.3)
Bagrus bajad 125 3.99 demersal Medium (K = 0.18)
Bagrus docmak 71 4.08 benthopelagic Medium (K = 0.17, Fec = 2 000)
Barbus macrops 12 3.04 benthopelagic High (Preliminary K or Fecundity)
Brienomyrus niger 16 3.25 benthopelagic High (Preliminary K or Fecundity)
Brycinus leuciscus 15 2.91 pelagic High (K = 1.20)
Brycinus longipinnis 15 2.18 pelagic Medium (Fec = 160)
Brycinus luteus 10 2.93 pelagic High (Preliminary K or Fecundity)
Brycinus macrolepidotus 65 2.34 pelagic Medium (Preliminary K or Fecundity)
Brycinus nurse 25 2.44 pelagic High (K = 0.41–0.92; tm = 1) Campylomormyrus tamandua 53 3.24 demersal Medium (Preliminary K or Fecundity)
Chromidotilapia guentheri 16 2.44 benthopelagic High (tm < 1)
Chrysichthys auratus 43 3.66 demersal Medium (K = 0.16)
Chrysichthys nigrodigitatus 80 2.58 demersal Medium (K = 0.12–0.53)
Citharinus citharus 71 2.00 demersal High (K = 0.33–0.59, Fec = 685 000)
Clarias anguillaris 100 3.35 demersal Medium (Assuming tm = 2–4)
Clarias gariepinus 170 3.15 benthopelagic Medium (K = 0.06–0.19, tm = 2, Fec = 2,084)
Clarotes laticeps 98 3.14 demersal Low (Preliminary K or Fecundity)
Ctenopoma kingsleyea 25 3.19 demersal Medium (Preliminary K or Fecundity)
Ctenopoma petherici 18 3.16 benthopelagic Medium (Preliminary K or Fecundity)
Distichodus rostratus 76 2.00 demersal Medium (Preliminary K or Fecundity)
Gymnarchus niloticus 204 3.71 demersal Low (K = 0.12–0.17)
Hemichromis bimaculatus 17 3.93 benthopelagic High (Assuming tm < 1 and multiple annual spawning, Fec = 200–500)
Hemichromis fasciatus 25 3.18 benthopelagic High (K = 1.20)
Hepsetus odoe 70 4.50 demersal Medium (K = 0.27, tmax = 5)
Heterobranchus bidorsalis 150 3.69 demersal Very low (Preliminary K or Fecundity)
Heterobranchus isopterus 90 3.61 demersal Low (Preliminary K or Fecundity)
Heterobranchus longifilis 183 3.72 demersal Low (K = 0.11)
Heterotis niloticus 122 2.55 pelagic Medium (K = 0.22–0.4)
Hippopotamyrus pictus 37 3.21 demersal High (Preliminary K or Fecundity)
Hydrocynus brevis 86 3.40 demersal Medium (Preliminary K or Fecundity)
Hydrocynus forskalii 96 3.98 pelagic Medium (K = 0.17–0.45, tmax = 4)
Hyperopisus bebe 63 3.60 demersal Medium (Preliminary K or Fecundity)
Labeo coubie 92 2.04 benthopelagic Low (K = 0.12–0.26)
Labeo parvus 47 2.00 benthopelagic Low (Preliminary K or Fecundity)
Labeo senegalensis 65 2.09 benthopelagic Medium (K = 0.19–0.63(?), tmax = 6)
Lates niloticus 200 4.48 demersal Medium (K = 0.17–0.19, tm = 2–3)
Leptocypris niloticus 10 2.90 demersal High (Preliminary K or Fecundity)
Malapterurus electricus 149 2.93 benthopelagic Very low (Assuming tmax > 30)
Marcusenius abadi 40 3.07 demersal High (Preliminary K or Fecundity)
Marcusenius senegalensis 40 3.10 demersal High (Preliminary K or Fecundity)

Appendix 2 143
Species
Maximum
total length
(cm)
Trophic
levelHabitat Resilience
Mormyrops anguilloides 150 3.58 demersal Low (K = 0.08–0.12)
Mormyrops breviceps 80 3.27 demersal Medium (Preliminary K or Fecundity)
Mormyrus hasselquistii 61 3.17 demersal Medium (Preliminary K or Fecundity)
Mormyrus macropthalmus 37 3.15 demersal High (Preliminary K or Fecundity)
Mormyrus rume 122 2.48 demersal Low (Assuming tm = 5–10)
Odaxothrissa mento 16 4.29 pelagic High (Preliminary K or Fecundity)
Oreochromis niloticus 74 2.00 benthopelagic Medium (K = 0.14–0.41, tm = 1–2, tmax = 9)
Parachanna obscura 60 3.40 demersal High (Preliminary K or Fecundity)
Paradistichodus dimidiatus 8 3.00 demersal High (Preliminary K or Fecundity)
Parailia pellucida 15 3.45 demersal High (Preliminary K or Fecundity)
Pellonula leonensis 10 3.30 pelagic High (Preliminary K or Fecundity)
Petrocephalus bane/P. bovei 25 3.20 demersal High (Preliminary K or Fecundity)
Petrocephalus bovei 14 3.11 demersal High (K = 0.53–1.10, tmax = 2.5)
Petrocephalus soudanensis 12 3.14 demersal High (Preliminary K or Fecundity)
Pollimyrus isidori 11 2.61 demersal High (tm = 0.5)
Polypterus endlicheri 77 3.77 demersal Medium (Preliminary K or Fecundity.)
Polypterus senegalus 51 3.54 demersal Very low (tmax = 34)
Protopterus annectens 100 3.83 demersal Very low (Assuming tmax > 30)
Raimas senegalensis 25 2.84 demersal Medium (Preliminary K or Fecundity)
Sarotherodon galilaeus 41 2.05 demersal Medium (K = 0.22–0.5, tm = 1.5–2)
Schilbe intermedius 61 3.60 pelagic High (tmax = 5, probably greater, K < 0.30, Fec = 18 000)
Schilbe mystus 40 3.45 demersal High (K = 0.09–0.94, tmax = 6–7, assuming Fec > 10 000)
Sierrathissa leonensis 4 3.10 pelagic High (tm < 1)
Siluranodon auritus 18 2.86 demersal High (Preliminary K or Fecundity.)
Steatocranus irvinei 14 3.32 demersal High (tm < 1)
Synodontis clarias 44 2.96 benthopelagic Medium (Preliminary K or Fecundity)
Synodontis eupterus 37 2.65 benthopelagic Medium (Preliminary K or Fecundity)
Synodontis filamentosa 32 2.88 benthopelagic High (Preliminary K or Fecundity)
Synodontis membranaceus 61 3.11 benthopelagic Medium (K = 0.14–0.55)
Synodontis nigrita 22 2.89 benthopelagic High (Preliminary K or Fecundity.)
Synodontis ocellifer 49 3.12 benthopelagic Medium (Preliminary K or Fecundity)
Synodontis schall 49 2.92 benthopelagic Medium (K = 0.10–0.54, tmax = 3, Fec = 64 273)
Synodontis velifer 24 2.89 benthopelagic High (Preliminary K or Fecundity)
Tetraodon lineatus 43 3.60 demersal Medium (Preliminary K or Fecundity)
Tilapia dageti 40 2.06 demersal Medium (Preliminary K or Fecundity)
Tilapia guineensis 38 2.80 benthopelagic High (K = 047)
Tilapia zillii 49 2.00 demersal Medium (K = 0.2–0.5, tm = 2–3, tmax = 7)
Note: Tm = age at maturity and tmax = maximum age. Sources: Goudswaard and Avoke, unpublished report. Values and descriptions compiled from www.fishbase.org (accessed on 14 June 2008).
Fishing methods of Lake VoltaThe following description of gear and catch rates are taken from an unpublished report by Goudswaard based on studies undertaken from February 1992 to April 1993. Fishing methods could be classified into 27 types, 23 of which were sampled.
TABLE A2.2 (continued)

Review of tropical reservoirs and their fisheries144
Brush parks and vegetation parks Acadjas. Acadjas (in the Ewe language, atidza) are groups of tree branches closely placed in water about 1.5 m deep. The planted area is about 50 m2 for each acadja. After planting, the branches are left for 1–3 days, during which fish looking for shelter aggregate. Food (e.g. cassava root peelings) is placed between the branches as an attractant. The method is practised when the water level of the reservoir has receded below the level of submerged vegetation. Fishers plant a net on sticks around the acadja, which is lowered during the night before harvesting. The bottom strip of the net is dug into the soil by hand, and chicken-wire mesh traps are placed at regular distances between the net and the bottom. When all branches are removed from the acadja area, a small seine net is used to harvest those fish that have not moved into the traps. When all fish have been removed, the place is abandoned and a new acadja may be created elsewhere.
Acadjas are installed in soft-bottomed areas located in sheltered places such as bays. When acadja fishing stops, fishers use the same gear for a similar kind of fishing called nifa-nifa. Seventy-six acadjas were found operating in stratum VII between 1991 and 1993. Béné and Obirih-Opareh (2009) give an updated analysis of the use of acadjas in Lake Volta, and Welcomme (2002) describes their use in West Africa and elsewhere in the world.
Nifa-nifa. This method is similar to acadja but, instead of deliberately placed branches, the net is placed around existing submerged vegetation. Fish feeding between and from the submerged vegetation enter from deeper parts of the reservoir and adjacent areas in the submerged vegetation during the night. The net is lowered during the night, and chicken-wire traps are placed at regular intervals between the bottom and the net. During the day when the fish attempt to migrate to deeper waters, they find their way blocked and are caught in the traps. Occasionally a 3–3.5 inch (75–87 mm) gillnet is placed in the nifa-nifa to obtain species that do not enter the traps. Nifa-nifa fishers have two strategies: (i) after cropping one spot they leave the net on top of the sticks for some days and set them again after about five days; or (ii) they remove all sticks and net and move to another spot. Usually, a fisher only has one nifa-nifa net. Nifa-nifa is practised at high water level, when vegetation is submerged after the annual water level rise, which ends in October. Nifa-nifa is not practised 5–6 days before and after full moon. In March 1992, 69 nifa-nifa were counted between Sokpoekope and Mataheko, and 34 between Pejai and Lomkotor and the total number was estimated at 200–250 in the area investigated in stratum VII.
Gillnets, passive and active methodsGillnet fishing. Gillnets are widely used in Lake Volta, where most fishers use a hanging ratio of 0.5. Trammel nets are never found in the reservoir, although fishers are aware of the technique. Many fishers use a number of different mesh sizes and categorization is difficult for that reason. Nevertheless, seven different techniques can be distinguished.
(1) One-inch (25 mm) pelagic set gillnets (passive) are top set and target small pelagic fish species. The method is widely practised all over the Lake Volta. Fishers usually operate only one net, as the time needed to remove the catch may be several hours. Nets are set for only one night. Occasionally, the net is set during the day for some hours, but these catches are extremely poor.
(2) Small-mesh bottom set gillnets (passive) are all multifilament nets with meshes ranging from 1 to 2½ inches (35–63.5 mm). The nets are set overnight but may remain for two successive nights in shallow water. One boat usually carries four bundles of nets, which is the maximum the crew members can handle in removing fish and carrying out extensive repairs on these fragile nets of two and three ply.
(3) Three inch (75 mm) “disco” bottom set gillnets (passive) may range from 2½ to 3½ inches (63.5–89 mm) and are almost all of monofilament twine, popularly

Appendix 2 145
known as “disco”. The targets are tilapiine species and, for this reason, the nets are placed in shallow waters along the reservoir. Usually, only one bundle is operated. Nets are not commonly repaired, and consequently the life span of a net is only one season. The method is common, but seasonal because of the migrating and spawning behaviour of the target species.
(4) Large-mesh bottom set gillnets (passive) is a category that includes all nets larger than 3½ inches (89 mm), both monofilament and multifilament. The nets are usually deep and, when set in shallow areas, may reach from the bottom to the surface. In the deeper parts of the reservoir, they are usually placed on the bottom.
(5) Large-mesh pelagic set gillnets (passive) are identical to the previous category except that they are placed 1 m below the surface of the water. Polystyrene floats on ropes attached at short intervals to the top line keep these nets in position. A few stones on ropes moored to the bottom keep the nets from drifting downstream. The targets are large pelagic species. The method is not very common as it is practised in the open-water areas of the reservoir where the active fishing of winch boats is destructive to this passive gear.
(6) Drift nets (passive) are monofilament with 2–3½ inch (50–89 mm) mesh that are placed in strong currents. The net is placed across the stream and is carried downstream. For this reason the method is very seasonal and used widely above and around the confluence of White and Black Volta Rivers. The target species are pelagic fish moving against the current, and anadromous species preparing to spawn in the upstream riverine environment during flood periods. During periods with high-velocity discharge, this is almost the only method practised. After this period, which lasts from July to October, all drift-net fishers turn to gillnet fishing. Drift nets last for only one season of 3–4 months.
(7) Gillnets with beating of water (active) uses a 3–3½ inch (75–89 mm) monofilament net set around a shallow area. When the net is set, the surface of the water is beaten with paddles, scaring the fish that try to escape from the area and are subsequently gilled, wedged or entangled. The method may be more common than reported.
Cast nets Fishing with cast nets in Lake Volta is seasonal and full-time. The method is usually practised by two fishers. One in the front of the boat casts the net, while the second paddles the canoe forward while herding the fish. Most cast nets are 2–2½ inch (51–63.5 mm) monofilament and 4–4.5 m long, measured centre to lead line. This means that approximately 50 m2 is surrounded in one casting. Cast netting is popular as an instant fishing technique, cheap to equip but labour-intensive. The number of full-time cast net fishers is small. Besides these professional fishers, there are cast net fishers who operate from the shores. Their nets usually have a one-inch (25 mm) mesh, and their target is small tilapiines. This last group is occasional fishers, and their number is very small. Catches with these nets are not recorded.
Seine netsSeine fishing is an active method in which a net is pulled on two sides through the water. Besides purse seining, there are three seine methods practised in Lake Volta that are quite distinctive in design and the fish species targeted:
(1) Beach seine fishing is the active method in which a part of the shore is surrounded by a two-inch (50 mm) net that is pulled ashore by a group of fishers. The codend of the seine is usually one-inch (25 mm) mesh of thick twine (ply 210D/30). The method is practised on every suitable shore (those that are free of obstacles like tree stumps, stones or vegetation) along the reservoir. Fishers claim stretches of

Review of tropical reservoirs and their fisheries146
shore as their fishing area after removing these obstacles. Visiting fishers pay a fee in cash or catch for the use of a beach. The method is very common, and on suitable beaches, six out of every ten canoes may be involved in beach seining. As several places are unfit for beach seine fishing, an overall ratio of four out of ten canoes seems more realistic. The targets of beach seines are tilapiine species.
(2) Pellonula seine fishing uses a seine of half-inch (12.5 mm) knotless mesh net approximately 6–8 m in length and 1 m in height. The net is pulled by two people wading through the water. After a drag of about 20 m, a small child walks towards the middle of the net scaring fish into it, and it is lifted. The method is used to obtain bait for longline fishers; around Yeji town, the catch is sold to the kenke producers. The method is practised at sunrise, from 05:00 to 06:30 hours. There are probably equal numbers of pellonula seine and Bagrus line fishers.
(3) Mosquito net seine uses as a seine a piece of mosquito net of variable size that is dragged by two children through very shallow water of less than 1.5 m. The target species is the clupeid Sierrathrissa leonensis. The catch has to be processed immediately, and all fish are fried or cooked as street food. In the whole area, the method is only seen in and around Yeji town, practised almost daily by a few children.
(4) Purse seine fishing is popularly known in the area as winch net or winch boat operating. The method uses a floating ring net with iron rings on 1 m ropes from the lead line reaching the bottom of the reservoir. These rings carry a ground rope that is pulled with the head rope into the boat by hand, finally closing a bowl-shaped net that catches all fish not able to pass through the two-inch (50 mm) webbing. The method is illegal but commonly practised in the area north of Yeji. At least 360 boats are recognizable as winch net boats. A number of winch nets are operated as well from the usual type of canoe. Winch boats are divided in two groups: with or without an outboard engine. Winch boats operate at night, and many boats also make a number of trips during daylight hours.
(5) Engine-powered winch boats most often use a 25 horsepower outboard engine to reach the fishing grounds and set the net. The net should be set quickly to deprive fish of the chance to escape. In this respect, engine-powered winch boats have an advantage over manual winch nets. The number of fishers used to pull the net onto the boat averages about 9 but may vary from 6 to 14. Many boats operate in the absence of the owner. The area of operation has to be free of bottom obstacles. For this reason, most boats are active in the former river bed. However, with very high water levels towards the end of 1991, winch nets were active in shallow areas that, when water levels are low, are beach areas that have been cleared by beach seine fishers. The target species for winch net fishers in shallow water are tilapiines and, in the open waters, large pelagic fishes. It is uncommon for engine-powered winch net operators to be involved in other types of fishing, although some fishers also operate bamboo pipes.
(6) Manually operated winch boats are large open canoes of the usual type used by all kinds of fishers in the reservoir. As a result of manual paddling, the action radius of operation of these boats compared with engine-powered boats is small, and many operate in shallow waters close to home. Goudswaard (personal communiation) had the impression that most of these operators were active only during the daytime.
TrapsBamboo pipe fishing became very popular in the late 1980s among fishers of the northern arm of Lake Volta. The technique is quite simple. A number of pipes are hung from snoods measuring 1–1.5 m that are attached to a line hung between two tree stumps. The bamboo pipes are three internodes long. Either holes are cut in each internode or the

Appendix 2 147
internode is broken throughout to form one long pipe. Bamboo pipe fishing is practised between submerged trees in areas where other methods like gillnetting, which targets the same synodontid species, is difficult as nets become entangled. After three days during high season or 14 days during the low season, a fisher lifts the pipes and shakes the fish out of the pipes. The number of pipes used by one fisher unit is usually about 600 but may vary between 400 and 3 000. The method is practised widely in the whole area. In January–May 1993, a total of 118 truckloads of about 2 200 pipes each were offloaded at Yeji, the main trading centre for pipes in the area. This would mean that more than 250 000 pipes were added to the existing number on the reservoir. Bamboo pipe fishing is practised by all kinds of fishers in combination with other gear.
Palm frond traps are produced from palm trees in the Volta Region and transported by Volta Lake Transport Company boats to Yeji, where marketing takes place for the whole area. The traps consist of two chambers that are baited with the waste from local beer production and placed on a line at the bottom of the reservoir. The targets are bottom-dwelling species. The method is highly seasonal, although a few fishers practise this method year-round with small catches in the off-season. The main season is from August to December. An estimated 200 fishers are involved in this type of fishing.
Tilapia traps are made of chicken wire or fine bamboo sticks woven together with bamboo leaves twisted into a kind of rope. The traps are produced at the fishing villages from raw materials arriving from the Ashanti Region. The traps are placed in shallow waters where tilapiine species wriggle themselves through the vegetation and a kind of path can be recognized. The method requires extensive knowledge of the area and of fish behaviour and is practised only by older fishers.
Hook and line and longlinesHook and line fishing can be divided into four different types by hook size and bait (ripping hooks are unbaited and for that reason are regarded as a distinct gear):
(1) Lates longlining targets large predator fishes like Lates niloticus and Gymnarchus niloticus, which are caught by hooks baited with live Chrysichthys. The hooks are Kirby sea hook numbers 1, 2, 3 or 4 and are usually checked daily, but may stay in the water a second day. Only six fishers using this fishing gear were found in Tokponya village, one at Ghanakwe Island, one in Dente Manso and one at Jaklai village.
(2) Clarias longline fishing targets Clarias by placing hooks in shallow areas using small fish or soap as bait. The hooks are Kirby sea hook number 14. The method is practised over the whole area on a small scale.
(3) Bagrus longlining uses gear similar to the methods above, but the hooks are Kirby sea hook number 12 and are always baited with small fish like Barbus macrops, Pellonula leonensis or tiny tilapiine fishes. The hooks are set in deep-water areas, usually the former river bed. Target species are predatory fishes like Bagrus bayad and B. docmac. One fisher may have 1 200–3 000 hooks. The method is common over the whole area and the most common longlining method. An estimated 100–150 fishers are involved in this kind of fishing. This estimate is based on the number of fishers counted in the sampled villages as a proportion of the total number of villages.
(4) Ripping hook fishing uses a large number of unbaited hooks attached to a line at short intervals. The line is tied to small sticks that are placed in very shallow water along beaches. The hooks hang 25–30 cm above the bottom. Bottom-feeding fish brush against the hooks while foraging and get snagged. The method is practised throughout the year. An estimated 50 fishers use this method.
Hand lining is done with one hook on a line baited with a piece of worm. It is widely practised at all locations by young children. The target species is Brycinus nurse, while small Chrysichthys and Synodontis are also caught. There is no hand lining that targets tilapiines.

Review of tropical reservoirs and their fisheries148
Other methodsLift-basket fishing uses a basket woven of palm fronds attached to two poles 3 m in length. The basket is baited with fermented cassava flour and pushed alongside a canoe under water. After approximately three minutes, the basket is lifted and the fish shaken into the canoe. The method was found to be practised exclusively by women during daylight hours. The only places where the method was found were along the White Volta River, where 58 women were counted practising lift-basket fishing in September 1992.
Poisoning is practised in shallow pools that remain when water has receded or in small streams, using agricultural pesticide thrown into the water. The method is illegal. The target species is Heterotis niloticus. Opposition to the method by almost all fishers in the area and the incidental nature of the method means it may be more common than reported.
Wangara is a long, bottom-reaching net fixed between two tree stumps whose lower and upper lines are lifted by two fishers in a canoe. The method targets migrating fishes, especially tilapiines. The method is labour-intensive and capital-intensive and not common in the area. It is practised in very shallow places where streams enter the reservoir. The method is said to have been introduced to the reservoir by Malian and Nigerian fishers.
Harpooning is performed with an arrow that swimming fishers launch from a gun-like apparatus with rubber bands, targeting large tilapiines.
REFERENCESBéné, C. 2007. Diagnostic study of the Volta Basin fisheries. Focal Basin Project – Volta.
Report No. 1: Overview of the Volta Basin fisheries resources. Penang, Malaysia, WorldFish Center. 32 pp.
Béné, C. & Obirih-Opareh, N. 2009. Social and economic impacts of agricultural productivity intensification: the case of brush park fisheries in Lake Volta. Agricultural Systems, 102: 1–10.
Braimah, L.I. 1995. Recent developments in the fisheries of Volta Lake (Ghana). In R.R.M. Crul & F.C. Roest, eds. Current status of fisheries and fish stocks of four largest African resources, pp. 111–134. Committee for Inland Fisheries of Africa Technical Paper No. 30. Rome, FAO. 134 pp.
de Graaf, G.J. & Ofori-Danson, P.K. 1997. Catch and fish stock assessment in stratum VII of Lake Volta. Integrated Development of Artisanal Fisheries Project Technical Report No. 97/I. Rome, FAO. 96 pp.
Ministry of Fisheries and Aquaculture (MOFA). 2006. Inland Fisheries Policy. Accra. 18 pp.
Vanderpuye, C.J. 1984. Synthesis of information on selected African reservoirs – Lake Volta in Ghana. In J.M. Kapetsky, & T. Petr, eds. Status of African reservoir fisheries, pp. 261–321. Rome, FAO. 326 pp.
Welcomme, R.L. 2002. An evaluation of tropical brush and vegetation park fisheries. Fisheries Management and Ecology, 9: 175–188.