Embed Size (px)
Citation preview
4 June 2005Island Universes
Benne W. Holwerda
Opacity of Spiral Galaxy Disks
Extinction measurements from counts of distant galaxies.
B.W. Holwerda (Kapteyn/ STScI)R.J. Allen (STScI) R.A. González (UNAM, Morelia)P.C. van der Kruit (Kapteyn)

4 June 2005Island Universes
Benne W. Holwerda
Finding dust in spiralsFinding dust in spirals• To characterize dust in spirals:
– Emission: infrared/sub-mm – Extinction: SED models, background
objects.
• Different strengths & weaknesses:– Emission depends on dust temperature
and hence illumination and dust emissivity is still uncertain.
– Extinction needs a known background source.
=> We use the number of distant galaxies as the background.

4 June 2005Island Universes
Benne W. Holwerda
Counting GalaxiesCounting Galaxies
• Calibration issues:– Crowding: are the distant galaxies hidden
by stars or dust? – Confusion: what is a foreground object and
what is a distant galaxy?– Clustering: are the distant galaxies blocked
by dust or simply not there?

4 June 2005Island Universes
Benne W. Holwerda
The “Synthetic Field Method”The “Synthetic Field Method”1. Identify distant galaxies in
science field.2. Combine image with dimmed
HDF-N/S.3. Identify background galaxies
in simulations.4. Fit relation between simulated
background galaxies and dimming: A = -2.5 Log(N/N0)
5. Estimate opacity from the intersection of fit and number from the science field.
González et al. (1998)Holwerda et al. (2005a)

4 June 2005Island Universes
Benne W. Holwerda
Beating statisticsBeating statistics• The HDF has ~100 easily recognizable field
galaxies, in a crowded field, ~30 remain.• Beating statistics with more data; deeper
impractical, analyze more fields with automated method Holwerda et al. (2005a).
• Combine 32 HST/WFPC2 fields based on common characteristics e.g.: – Radius, distance from foreground galaxy center– Arm, inter-arm and outside disk regions– Disk surface brightness– HI column density

4 June 2005Island Universes
Benne W. Holwerda
Radial extinction plotsRadial extinction plots• Scale all radii with
R25 (de Vaucouleur et al. 1991)
• Find background galaxies, synthetic and real, in radial annuli.
• Combine counts and derive opacity (AI)
Holwerda et al. (2005b)

4 June 2005Island Universes
Benne W. Holwerda
Arm and disk regionsArm and disk regions
• Divide fields into arm/inter-arm and outside disk regions.
• Compare to similar results from occulting galaxy technique
• Points from White et al. (2000) and Domingue et al. (2000).
Holwerda et al. (2005b)

4 June 2005Island Universes
Benne W. Holwerda
Galaxy colors: patchy dustGalaxy colors: patchy dust• Average color of
background galaxies independent of the inferred opacity.
• Grey extinction known effect of patchy dust.
• Extinction measured from missing number, color from remaining galaxies.
• Distant galaxies are extended objects
Holwerda et al. (2005b)

4 June 2005Island Universes
Benne W. Holwerda
Dust and lightDust and light
• Flag each background galaxy with the 2MASS pixel value
• Sort the galaxy counts per surface brightness
• SB-A relation in arms, not in the disk.
Holwerda et al. (2005d)submitted

4 June 2005Island Universes
Benne W. Holwerda
Compare to SCUBA sub-mmCompare to SCUBA sub-mm
• Radial Profiles of sub-mm emission and opacity values match.
• Individual measurements of opacity are uncertain.
• Little overlap in current samples. Much future work for SCUBA and ACS.
Meijerink et al. 2005Holwerda et al. (2005c)A&A accepted

4 June 2005Island Universes
Benne W. Holwerda
Comparison to HIComparison to HI• Radial surface
density profiles HI(r) from the literature.
• Compare to individual opacity profiles.
• No apparent relation between HI and opacity.
Holwerda et al. (2005c)A&A accepted

4 June 2005Island Universes
Benne W. Holwerda
Average Dust-to-HI ratioAverage Dust-to-HI ratio
• Average opacity profile
• Average HI profile• Compare ratio.• Higher than earlier
estimates.• Similar to sub-mm
estimates.Mayya et al. (1997)
Issa et al. (1990)
Boissier et al. (2004)
Thomas et al. (2005)
Cuillandre et al. (2001)
Holwerda et al. (2005c)A&A accepted

4 June 2005Island Universes
Benne W. Holwerda
Conclusions (1)Conclusions (1)
• SFM calibrates biases and errors in field galaxy numbers.
• Spiral disk show AI < 1 magnitude of extinctions within the R25
• Later type spirals slightly more opaque than earlier types.
• Arms are more opaque than the disk.
• Dust in the disk is patchy.
4 June 2005Island Universes
Benne W. Holwerda
Conclusions (2)Conclusions (2)
• Surface brightness and opacity are linked, especially in the spiral arms.
• Dust responsible for opacity appears cold when compared to sub-mm emission.
• HI column density and opacity appear not linked.
• The ratio of the average opacity profile and the average HI profile poinst to more dust per HI.

4 June 2005Island Universes
Benne W. Holwerda
Future WorkFuture Work• ACS imaging of
M101 and M51• Direct
comparison to HI column density and IR/sub-mm emission.
• Fully automated object classification.
Image courtesy of K.D. Kuntz

4 June 2005Island Universes
Benne W. Holwerda
More Questions?More Questions?
• My thesis is done!• Results also in
holwerda et. al. (2005a,b) (published) (2005c,d,e)(submitted)
• Or send me an email: [email protected]

4 June 2005Island Universes
Benne W. Holwerda
Cepheid reddening & opacityCepheid reddening & opacity
• Average reddening of the Cepheids in the fields is converted to extinction.
• Opacity from number of galaxies mostly similar.
• Detection bias in Cepheids at higher values.
Holwerda et al. (2005d)A&A submitted
4 June 2005Island Universes
Benne W. Holwerda
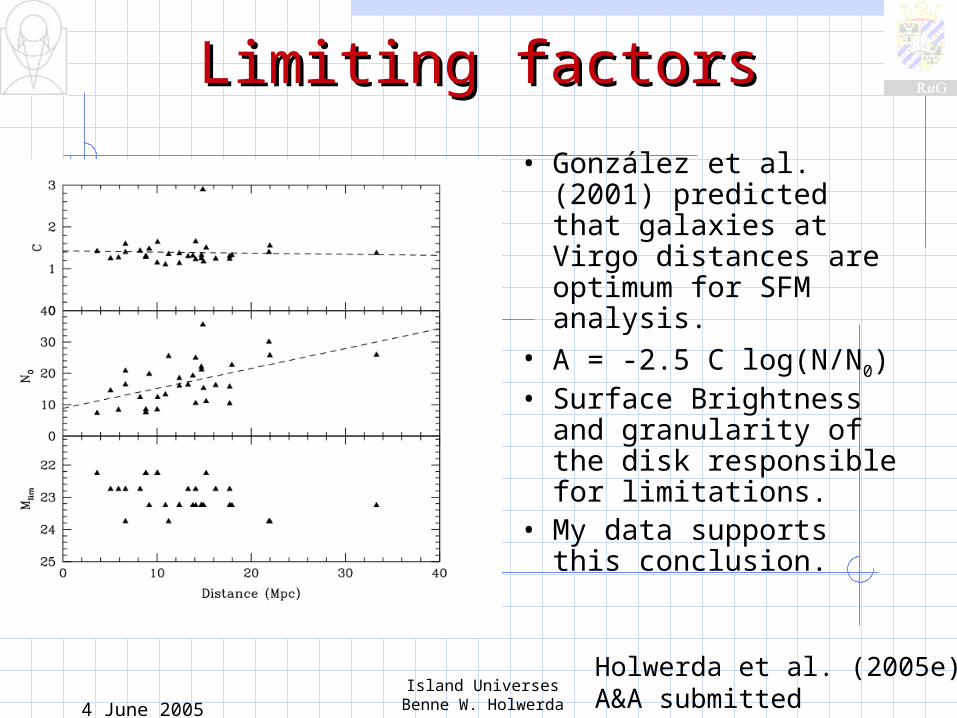
Limiting factorsLimiting factors
• González et al. (2001) predicted that galaxies at Virgo distances are optimum for SFM analysis.
• A = -2.5 C log(N/N0)• Surface Brightness and
granularity of the disk responsible for limitations.
• My data supports this conclusion.
Holwerda et al. (2005e)A&A submitted

4 June 2005Island Universes
Benne W. Holwerda
An improved HI comparisonAn improved HI comparison
• Cuillandre et al (2001)
• Compare number of galaxies per HI contour.
• Optimal for single disk .

4 June 2005Island Universes
Benne W. Holwerda
Object ClassificationObject Classification
• Single parameter cut not sensitive enough
• Total chance computed from all parameters.
• Some hard cuts to remove blue clusters HII regions etc.
• Total score works but improvements still possible.HDF
All Objects

4 June 2005Island Universes
Benne W. Holwerda
Comparing observersComparing observers
• NGC 4536 re-analyzed with automated SFM
• Compared to the number of González et al (1998).
• Difference due to limiting depth.
Holwerda et al. (2005a)

4 June 2005Island Universes
Benne W. Holwerda
HDF-N/S as a reference fieldHDF-N/S as a reference field
• The HDF-N/S fields; how ``average’’ are they?
• Compare numbers of objects per magnitude range to cosmological searches.
• No deviation from the mean field up to the detection limit.
Holwerda et al. (2005a)

4 June 2005Island Universes
Benne W. Holwerda
Computing the ErrorComputing the Error
• Relation between number of synthetic galaxies and dimming.
• Measurement error in synthetic number
• Measurement and clustering error in actual number.

4 June 2005Island Universes
Benne W. Holwerda
Galactic ExtinctionGalactic Extinction
• Galactic extinction varies for each field.
• Difference with the reference field (HDF-N/S) important.
• Nearly negligible except for NGC6946

4 June 2005Island Universes
Benne W. Holwerda
Synthetic Dust ModelsSynthetic Dust Models
• Filling factor of dust clouds observed.
• Many small clouds or a few big ones?
• The effects on number of distant galaxies very different.
• Focus for future work.

4 June 2005Island Universes
Benne W. Holwerda
Inclination correctionInclination correction
• Radial opacity profiles independent of inclination.
• Implies that the filling factor remains the same.
• Flat distribution of dust.
Holwerda et al. (2005b)

4 June 2005Island Universes
Benne W. Holwerda
Disk Opacity and Hubble typeDisk Opacity and Hubble type
• AI < 1 until R25
• Disks early types more opaque than later types?
• LSB transparent.
Holwerda et al. (2005b)

4 June 2005Island Universes
Benne W. Holwerda
Disk surface brightness Disk surface brightness
• Relation between SB and A in radial annuli.
• More extinction at brighter SB.
• Combine background galaxy numbers based on disk surface brightness.
Holwerda et al. (2005b)

4 June 2005Island Universes
Benne W. Holwerda
Comparison to IR/sub-mm.Comparison to IR/sub-mm.• Cold dust best
characterized in sub-mm• Very few galaxies done
with SCUBA• Substantial overlap with
the Spitzer Infrared Nearby Galaxies (SINGS) data.
• Compare radial profiles with FIR profile.
4 June 2005Island Universes
Benne W. Holwerda
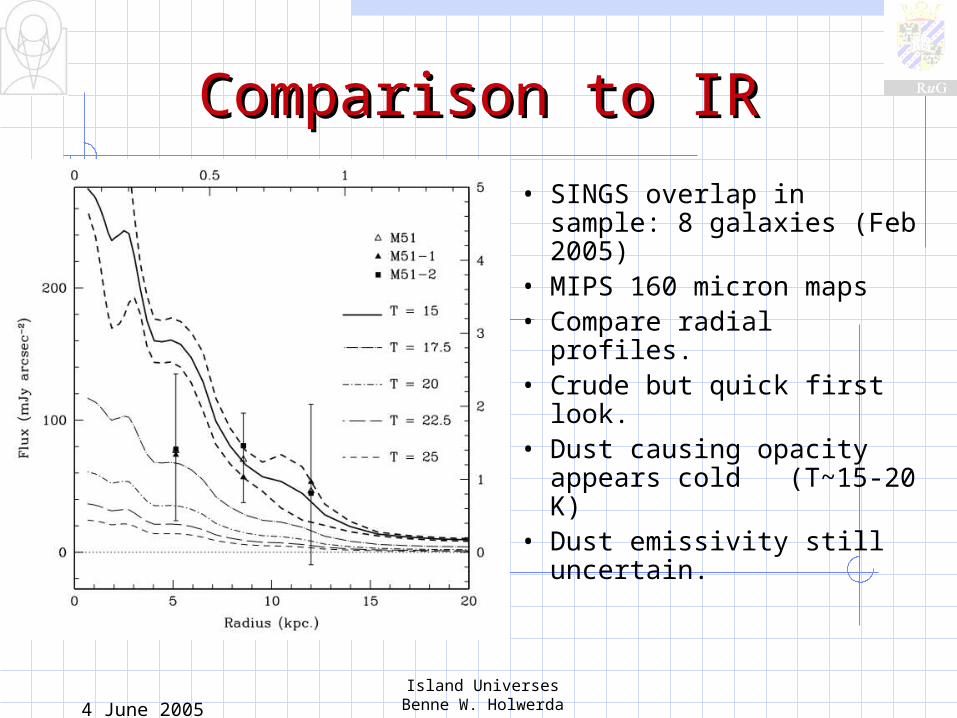
Comparison to IRComparison to IR
• SINGS overlap in sample: 8 galaxies (Feb 2005)
• MIPS 160 micron maps• Compare radial profiles.• Crude but quick first look.• Dust causing opacity
appears cold (T~15-20 K)
• Dust emissivity still uncertain.

4 June 2005Island Universes
Benne W. Holwerda
The SampleThe Sample
• 32 WFPC2 fields in V,I
• Mostly Cepheid Distance Scale Key Project
• Drizzled, analyzed & combined.
Holwerda et al. (2005a,b)


![Holwerda, D._sprünge in Die Tiefen Heraklits_1978 [Marcovich, Miroslav_Gnomon, 54, 7_1982_691-692]](https://img.dokumen.tips/doc/110x75/577cb9e61a28aba7118d8d60/holwerda-dspruenge-in-die-tiefen-heraklits1978-marcovich-miroslavgnomon.jpg)


![[Carroll B.W., Ostlie D.a.] an Introduction to Mod](https://img.dokumen.tips/doc/110x75/56d6be0b1a28ab301690652a/carroll-bw-ostlie-da-an-introduction-to-mod.jpg)