Embed Size (px)
Citation preview
1
4. Debuggers4.1 Architecture4.2 Case study: Java Platform Debugger

2
Overview
source program
machine program
compiler
source level
machine level
source state
debugger
machine statestackheapglobal dataregistersload listcode
reference info
Reference info (symbol info)• contains names and addresses of variables and methods• is often part of the object file
Debugger decodes the machine state using the reference infoand shows the program state in source code
Debugger = inverse of a compiler
3
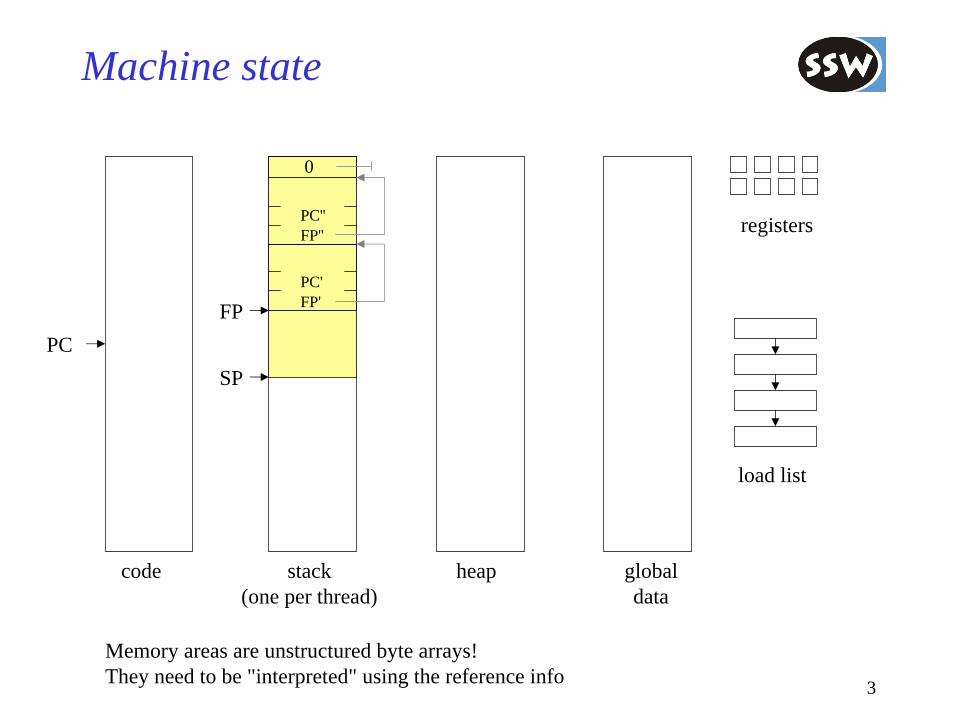
Machine state
PC
code stack(one per thread)
FP
SP
FP'PC'
FP''PC''
0
heap globaldata
registers
load list
Memory areas are unstructured byte arrays!They need to be "interpreted" using the reference info
4
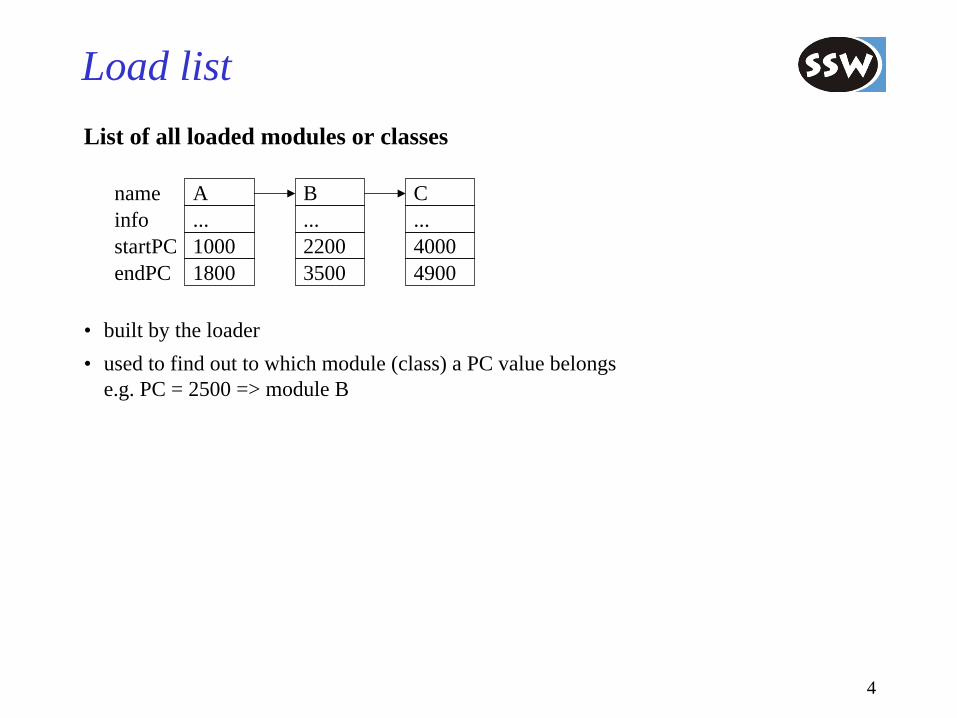
Load listList of all loaded modules or classes
• built by the loader• used to find out to which module (class) a PC value belongs
e.g. PC = 2500 => module B
name Ainfo ...startPC 1000endPC 1800
B...22003500
C...40004900
5
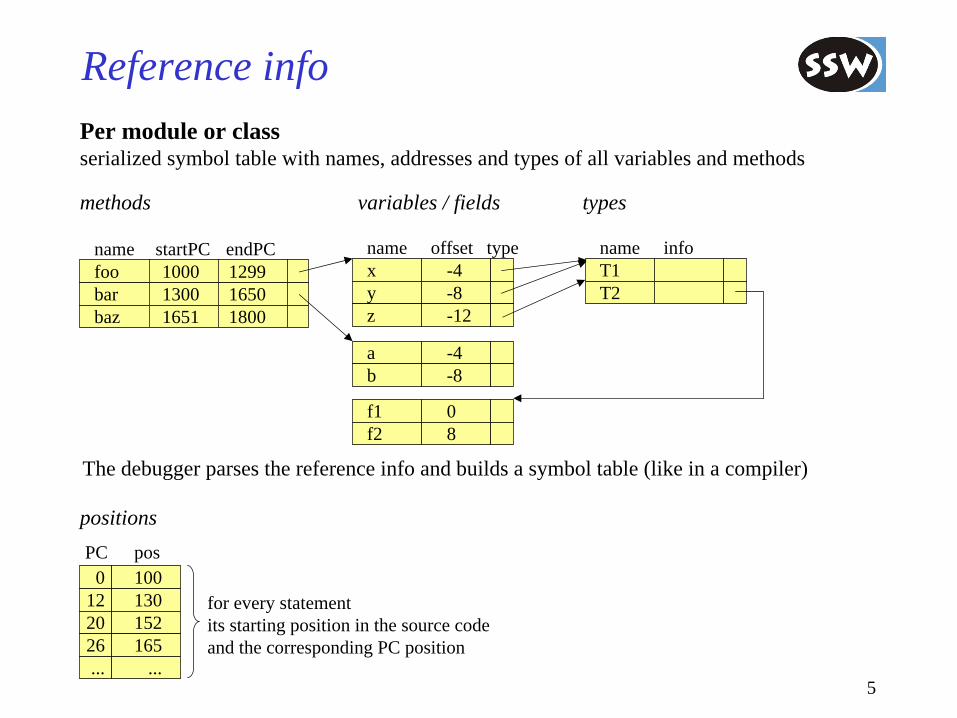
Reference infoPer module or classserialized symbol table with names, addresses and types of all variables and methods
methods
name startPC endPCfoo 1000 1299bar 1300 1650baz 1651 1800
name offset typex -4y -8z -12
variables / fields
a -4b -8
name infoT1T2
types
positionsPC pos
1000130121522016526
......
for every statementits starting position in the source codeand the corresponding PC position
f1 0f2 8
The debugger parses the reference info and builds a symbol table (like in a compiler)
6
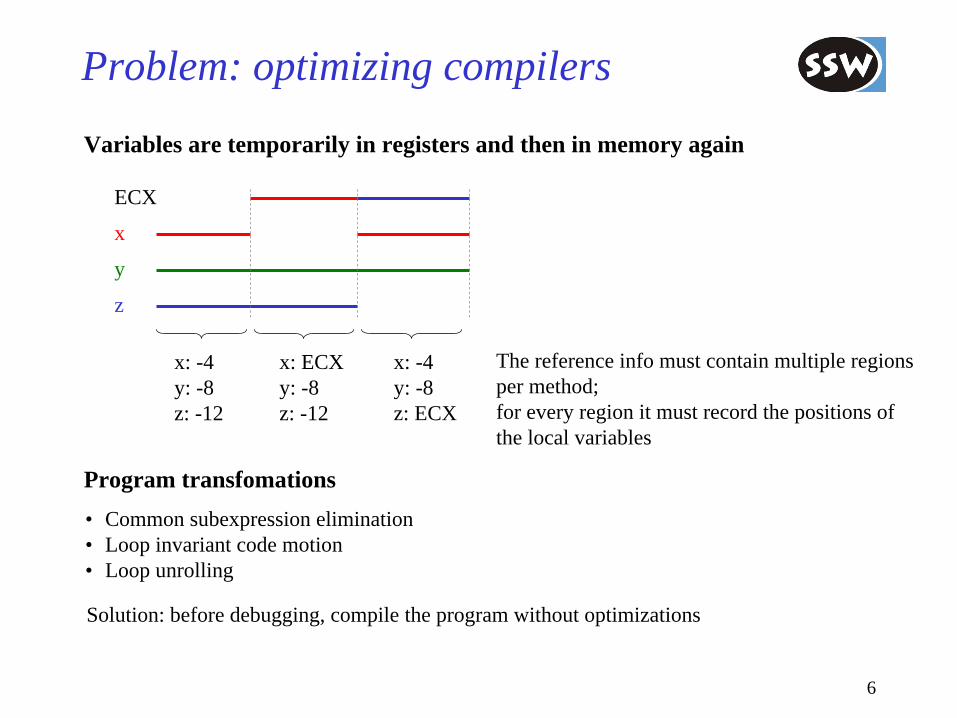
Problem: optimizing compilers
Variables are temporarily in registers and then in memory again
x
ECX
y
z
x: -4y: -8z: -12
x: ECXy: -8z: -12
x: -4y: -8z: ECX
The reference info must contain multiple regionsper method;for every region it must record the positions ofthe local variables
Program transfomations• Common subexpression elimination• Loop invariant code motion• Loop unrolling
Solution: before debugging, compile the program without optimizations

7
Reference information in OberonFor every module there is a reference file with the following structure
RefInfo = {Procedure} {Record}.
Procedure = ProcTag address Name {Variable}.Name = char {char} 0.Variable = (VarTag | VarParTag) Name address Type.Type = ByteTag | BoolTag | CharTag
| SIntTag | IntTag | LIntTag | RealTag | LRealTag| SetTag | StringTag | NilTag | NoTypeTag| PointerTag Type| ArrayTag length elemsize Type| RecTag mod typeDescAdr.
Record = RecTag typeDescAdr Name {Field} 0.Field = Name address Type.
NoTypeTag = 0ByteTag = 1BoolTag = 2CharTag = 3SIntTag = 4IntTag = 5LIntTag = 6RealTag = 7LRealTag = 8SetTag = 9StringTag = 10NilTag = 11ProcTag = 12RecTag = 13VarTag = 14VarParTag = 15PointerTag = 16ArrayTag = 17
PROCEDURE Foo(VAR x: INTEGER);VAR a: REAL;
BEGIN...
END Foo; 12 00 00 F o o 0 15 x 0 5 14 a 0 ff
Proc
Tag
Var
ParT
ag
IntT
agV
arTa
g
Rea
lTag
fc 700 08

8
Example: stack trace with local variables
stack
FP
SP
FP'PC'
FP''PC''
null while (FP != null) {mod = findModule(PC);proc = mod.findProc(PC);println(mod.Name + "." proc.Name);foreach (local v in proc.locals) {
print(v.name);print value at mem[FP+v.adr] according to v.type;
}PC = mem[FP+4];FP = mem[FP];
}
xyz
x -4name adr
inttype
y -8 floatz -12 int
Reference information of the current stack frame

9
Example: display of the error position
PC
...x = 2 * x + 1;y = x - 5;z = foo(x, y);...
code source programPC pos
1000130121522016526
......
PC/pos mapping table
pos
mod = findModule(PC);pos = mod.findPos(PC);markPos(sourceFile(mod), pos);
10
Kinds of debuggers
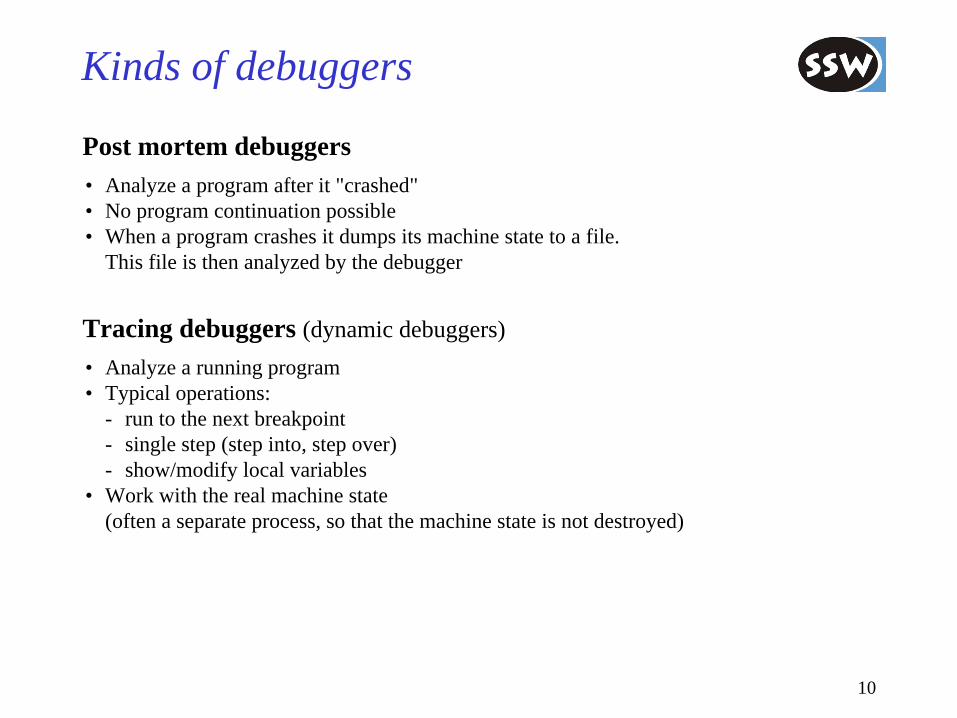
Post mortem debuggers• Analyze a program after it "crashed"• No program continuation possible• When a program crashes it dumps its machine state to a file.
This file is then analyzed by the debugger
Tracing debuggers (dynamic debuggers)• Analyze a running program• Typical operations:
- run to the next breakpoint- single step (step into, step over)- show/modify local variables
• Work with the real machine state(often a separate process, so that the machine state is not destroyed)
11
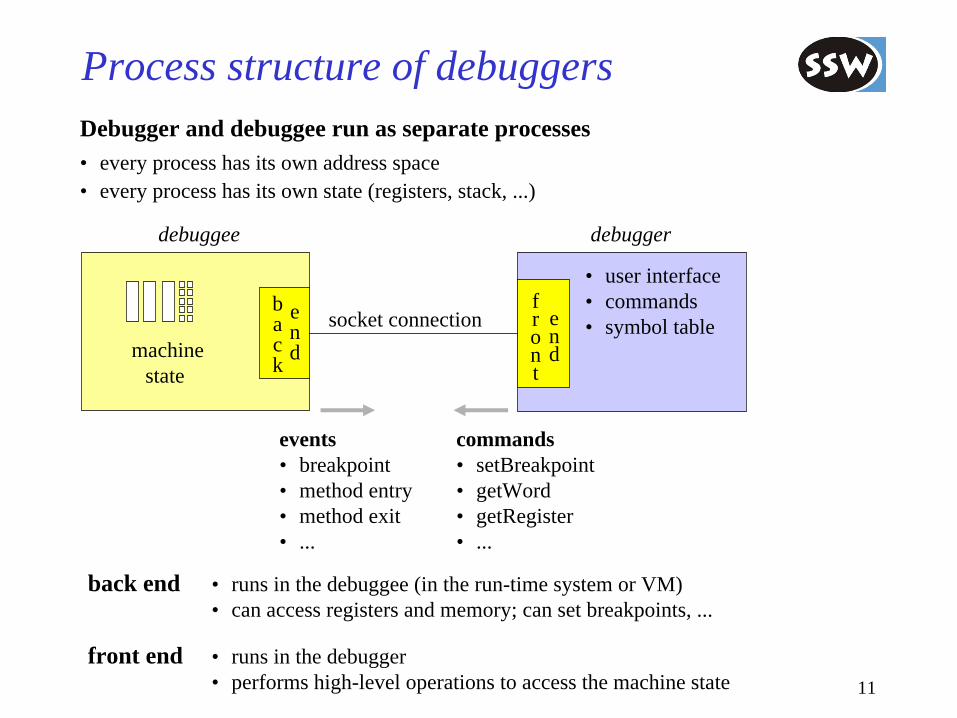
Process structure of debuggersDebugger and debuggee run as separate processes• every process has its own address space• every process has its own state (registers, stack, ...)
machinestate
back
• user interface• commands• symbol table
debuggee debugger
front
socket connection
commands• setBreakpoint• getWord• getRegister• ...
events• breakpoint• method entry• method exit• ...
back end • runs in the debuggee (in the run-time system or VM)• can access registers and memory; can set breakpoints, ...
front end • runs in the debugger• performs high-level operations to access the machine state
end
end
12
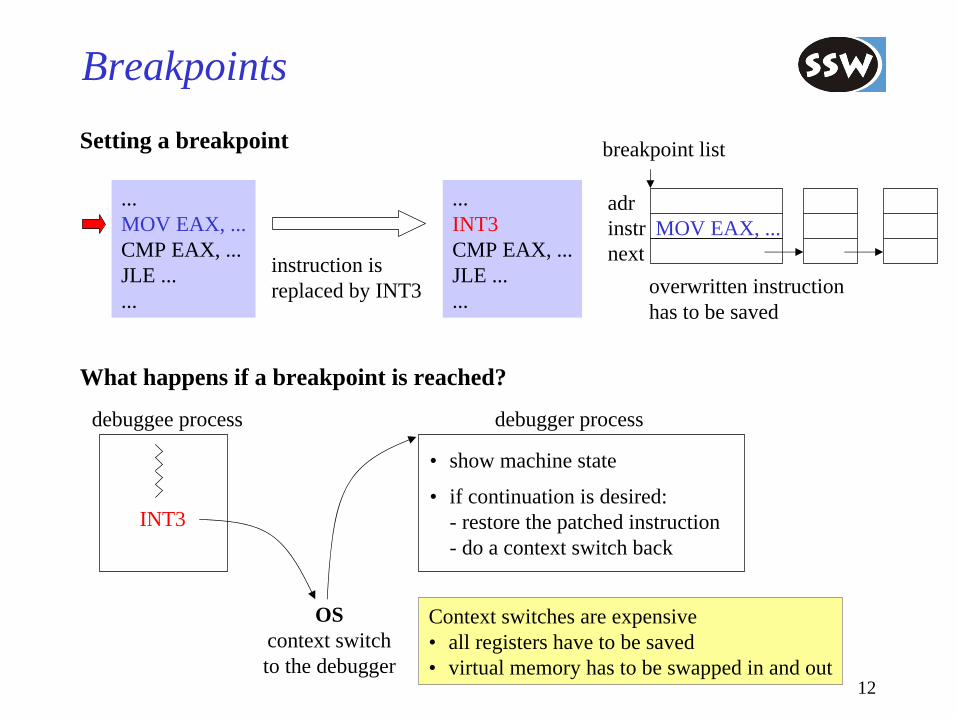
BreakpointsSetting a breakpoint
...MOV EAX, ...CMP EAX, ...JLE ......
instruction isreplaced by INT3
...INT3CMP EAX, ...JLE ......
overwritten instructionhas to be saved
adrinstr MOV EAX, ...next
breakpoint list
What happens if a breakpoint is reached?
INT3
OScontext switchto the debugger
• show machine state
• if continuation is desired:- restore the patched instruction- do a context switch back
debuggee process debugger process
Context switches are expensive• all registers have to be saved• virtual memory has to be swapped in and out
13
Conditional breakpoints
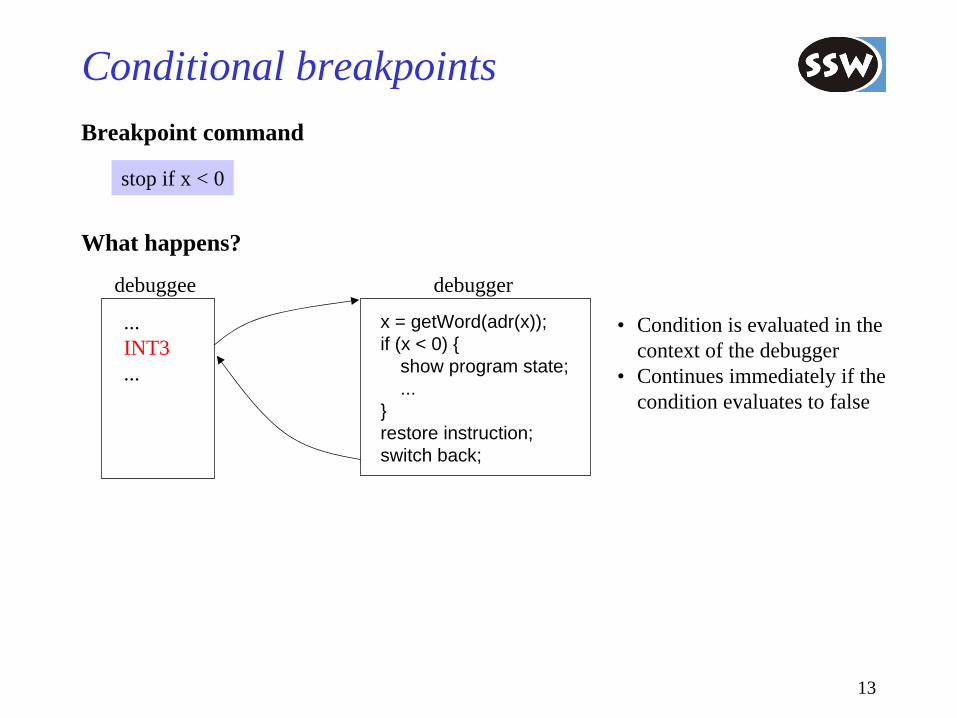
stop if x < 0
Breakpoint command
What happens?
...INT3...
debuggee
x = getWord(adr(x));if (x < 0) {
show program state;...
}restore instruction;switch back;
debugger
• Condition is evaluated in thecontext of the debugger
• Continues immediately if thecondition evaluates to false

14
Implicit breakpointsSet by the debugger implicitly (e.g. for single step)
...x = x + 1;y = x - 2;...
source program
PC = 1000PC = 1007
remove breakpoint at current PC;PC1 = address of next statement;set breakpoint at PC1;switch back;
debugger
...MOV EAX, xADD EAX, 1MOV x, EAXMOV EAX, xSUB EAX, 2MOV y, EAX...
1000
1007
INT3...MOV EAX, xADD EAX, 1MOV x, EAXMOV EAX, xSUB EAX, 2MOV y, EAX...
1000
1007 INT3
command
step
step over Set breakpoint to the beginning of the next statement
step into Set breakpoint to the beginning of the called methodProblem: dynamic binding => set breakpoints to the beginnings of all possibly invoked methods
15
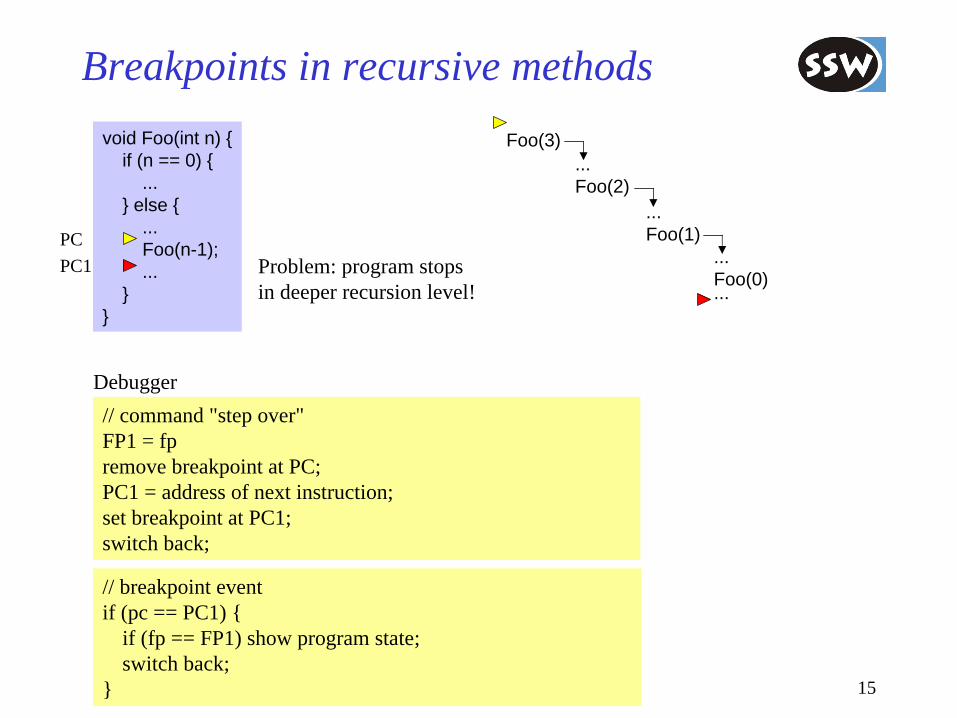
Breakpoints in recursive methodsvoid Foo(int n) {
if (n == 0) {...
} else {...Foo(n-1);...
}}
Problem: program stops in deeper recursion level!
PCPC1
// command "step over"FP1 = fpremove breakpoint at PC;PC1 = address of next instruction;set breakpoint at PC1;switch back;
// breakpoint eventif (pc == PC1) {
if (fp == FP1) show program state;switch back;
}
Debugger
Foo(3)...Foo(2)
...Foo(1)
...Foo(0)...

16
TracingExecute an action when the program reaches a certain location• increment a counter• print a log message
With normal breakpoints
...MOV EAX, ......
execute action;switch back to saved instruction;INT3
MOV EAX, ...JMP ...
With "fast" breakpoints
MOV EAX, ......
JMP, ...
save registers;execute action;restore registers;MOV EAX, ...JMP ...
• no context switch• but code must be generated
for executing the action in thecontext of the debuggee

17
4. Debuggers4.1 Architecture4.2 Case study: Java Platform Debugger
18
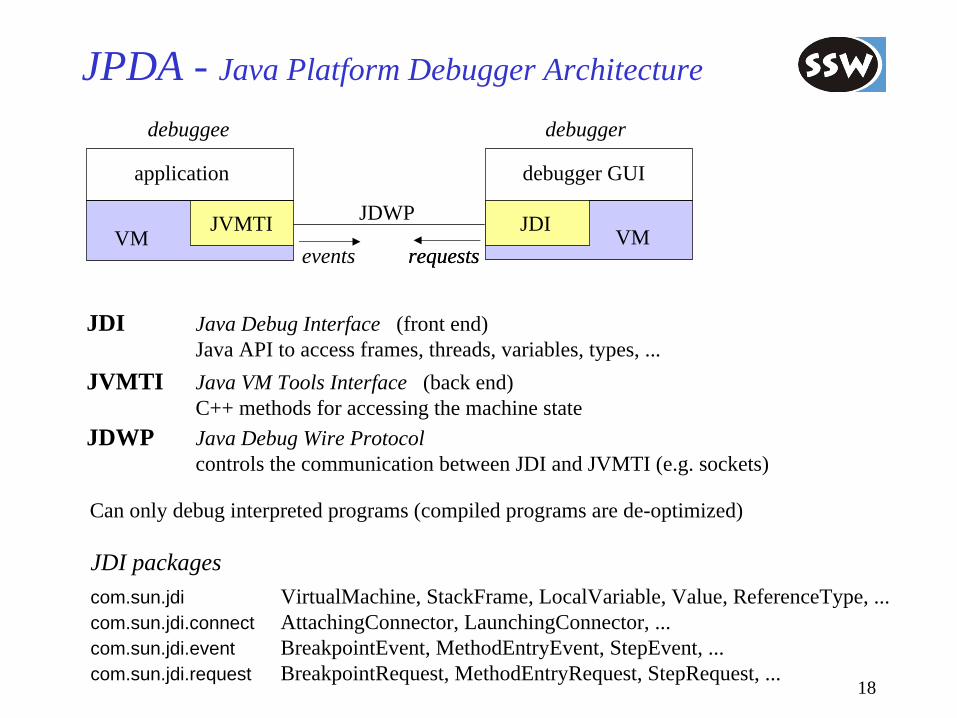
JPDA - Java Platform Debugger Architecture
JVMTI JDWP
debuggee debugger
VM VM
application debugger GUI
JDI Java Debug Interface (front end)Java API to access frames, threads, variables, types, ...
JVMTI Java VM Tools Interface (back end)C++ methods for accessing the machine state
JDWP Java Debug Wire Protocolcontrols the communication between JDI and JVMTI (e.g. sockets)
JDI packagescom.sun.jdi VirtualMachine, StackFrame, LocalVariable, Value, ReferenceType, ...com.sun.jdi.connect AttachingConnector, LaunchingConnector, ...com.sun.jdi.event BreakpointEvent, MethodEntryEvent, StepEvent, ...com.sun.jdi.request BreakpointRequest, MethodEntryRequest, StepRequest, ...
requestsrequestseventsJDI
Can only debug interpreted programs (compiled programs are de-optimized)

19
JDB - Command Line Java Debugger
class Test {public static void main(String[] args) {
int i = 1;int j = i * 2;System.out.println(j);
}}
Sample programmust be compiled with -g (generate reference info)
javac -g Test.java
Debug sessionjdb Test myArg> stop in Test.main> runBreakpoint hit: "thread=main", Test.main(), line=3 bci=03 int i = 1;> nextStep completed: "thread=main", Test.main(), line=4 bci=24 int j = 2 * i;> localsargs = instance of java.lang.String[0] (id=280)i = 1> print args[0]args[0] = "myArg"> quit
JDB uses JDI
reference info is written to the class file(as a special code attribute)

20
JDI classes for making a connection
BootstrapVirtualMachineManager virtualMachineManager()
VirtualMachineManagerList<Connector> allConnectors()LaunchingConnector defaultConnector()...
LaunchingConnectorVirtualMachine launch(Map arguments)
AttachingConnectorVirtualMachine attach(Map arguments)
VirtualMachineList<ReferenceType> allClasses()List<ThreadReference> allThreads()EventRequestManager eventRequestManager()EventQueue eventQueue()Process process()void suspend()void resume()...
21
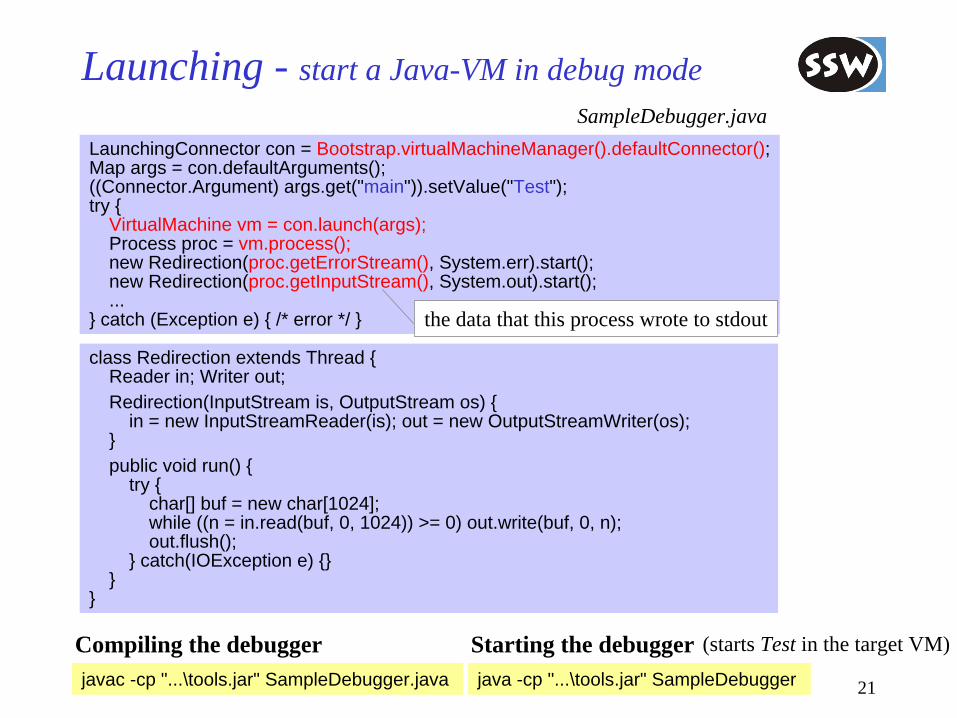
Launching - start a Java-VM in debug mode
LaunchingConnector con = Bootstrap.virtualMachineManager().defaultConnector();Map args = con.defaultArguments();((Connector.Argument) args.get("main")).setValue("Test");try {
VirtualMachine vm = con.launch(args);Process proc = vm.process();new Redirection(proc.getErrorStream(), System.err).start();new Redirection(proc.getInputStream(), System.out).start();...
} catch (Exception e) { /* error */ }
SampleDebugger.java
Starting the debuggerjava -cp "...\tools.jar" SampleDebugger
(starts Test in the target VM)
class Redirection extends Thread {Reader in; Writer out;Redirection(InputStream is, OutputStream os) {
in = new InputStreamReader(is); out = new OutputStreamWriter(os);}public void run() {
try {char[] buf = new char[1024];while ((n = in.read(buf, 0, 1024)) >= 0) out.write(buf, 0, n);out.flush();
} catch(IOException e) {}}
}
Compiling the debuggerjavac -cp "...\tools.jar" SampleDebugger.java
the data that this process wrote to stdout
22
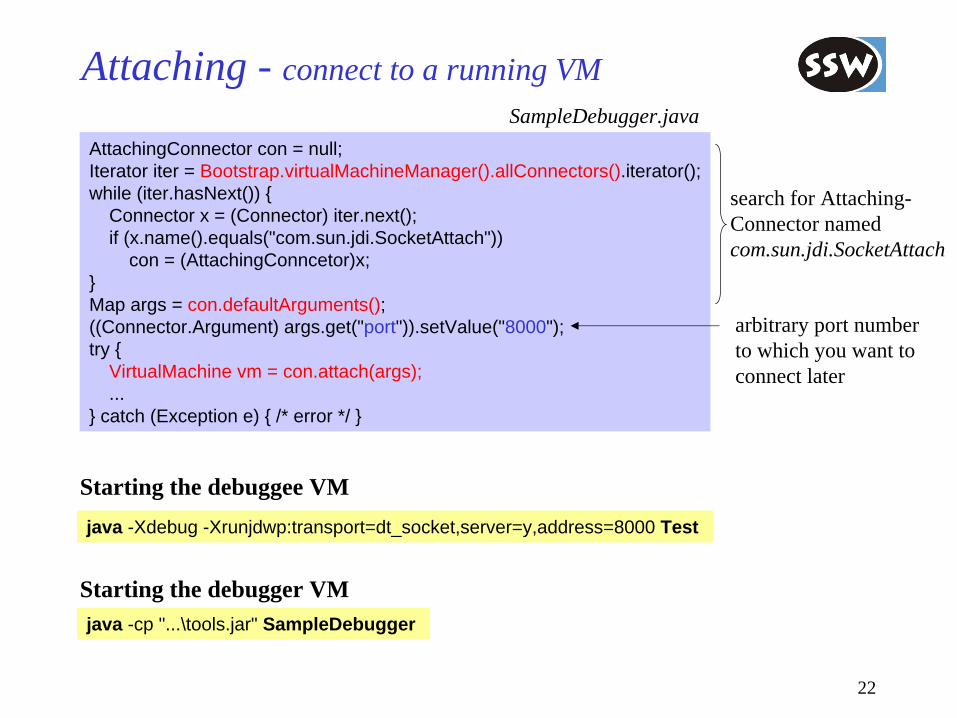
Attaching - connect to a running VM
AttachingConnector con = null;Iterator iter = Bootstrap.virtualMachineManager().allConnectors().iterator();while (iter.hasNext()) {
Connector x = (Connector) iter.next();if (x.name().equals("com.sun.jdi.SocketAttach"))
con = (AttachingConncetor)x;}Map args = con.defaultArguments();((Connector.Argument) args.get("port")).setValue("8000");try {
VirtualMachine vm = con.attach(args);...
} catch (Exception e) { /* error */ }
Starting the debuggee VMjava -Xdebug -Xrunjdwp:transport=dt_socket,server=y,address=8000 Test
Starting the debugger VMjava -cp "...\tools.jar" SampleDebugger
SampleDebugger.java
arbitrary port numberto which you want toconnect later
search for Attaching-Connector namedcom.sun.jdi.SocketAttach
23
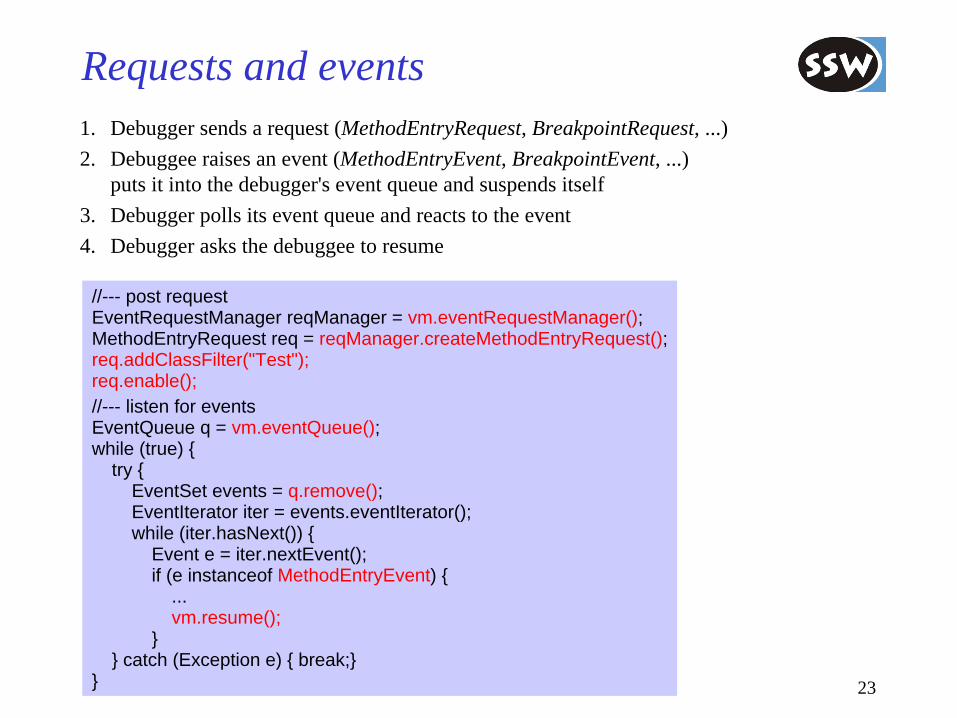
Requests and events1. Debugger sends a request (MethodEntryRequest, BreakpointRequest, ...)2. Debuggee raises an event (MethodEntryEvent, BreakpointEvent, ...)
puts it into the debugger's event queue and suspends itself3. Debugger polls its event queue and reacts to the event4. Debugger asks the debuggee to resume
//--- post requestEventRequestManager reqManager = vm.eventRequestManager();MethodEntryRequest req = reqManager.createMethodEntryRequest();req.addClassFilter("Test");req.enable();//--- listen for eventsEventQueue q = vm.eventQueue();while (true) {
try {EventSet events = q.remove();EventIterator iter = events.eventIterator();while (iter.hasNext()) {
Event e = iter.nextEvent();if (e instanceof MethodEntryEvent) {
...vm.resume();
}} catch (Exception e) { break;}
}
24
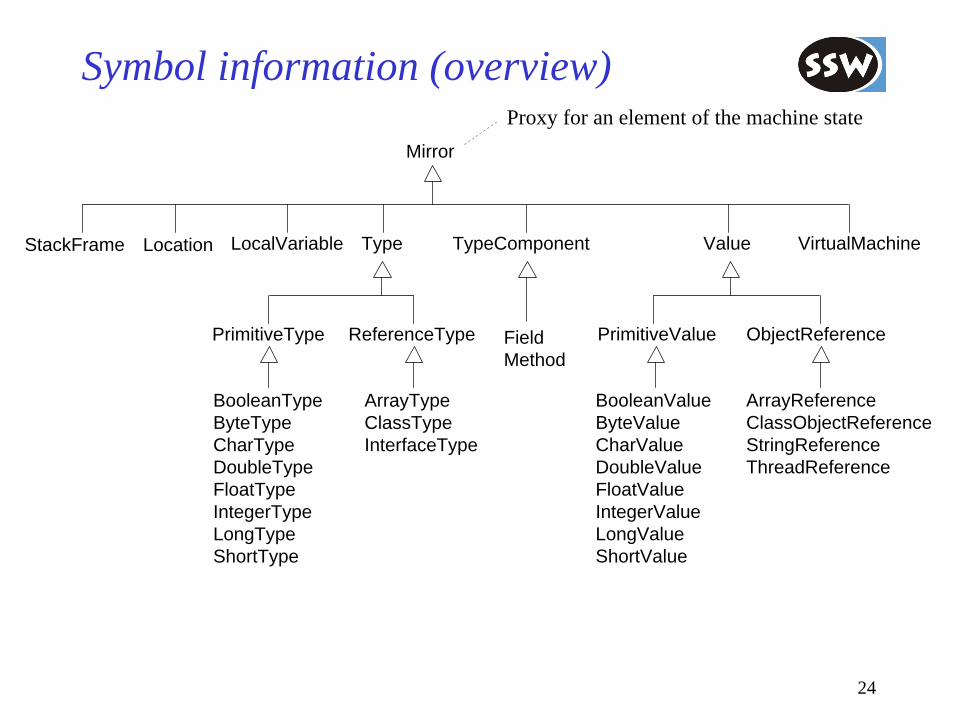
Symbol information (overview)
Mirror
LocalVariableLocation Type
PrimitiveType ReferenceType
ArrayTypeClassTypeInterfaceType
BooleanTypeByteTypeCharTypeDoubleTypeFloatTypeIntegerTypeLongTypeShortType
TypeComponent
FieldMethod
Value
PrimitiveValue ObjectReference
BooleanValueByteValueCharValueDoubleValueFloatValueIntegerValueLongValueShortValue
ArrayReferenceClassObjectReferenceStringReferenceThreadReference
VirtualMachineStackFrame
Proxy for an element of the machine state

25
Symbol information (details)ThreadReferenceList<StackFrame> frames()StackFrame frame(int i)...
StackFrameList<LocalVariable> visibleVariables()LocalVariable visibleVariableByName(String name)Value getValue(LocalVariable v)void setValue(LocalVariable v, Value x)Location location()ThreadReference thread()...
*
Locationint lineNumber()long codeIndex()Method method()ReferenceType declaringType()...
LocalVariableString name()Type type()boolean isArgument()void isVisible(StackFrame f)...
ValueType type()
IntegerValueint value()
TypeString name()String signature()
ArrayTypeType componentType()
MethodList<LocalVariable> arguments()List<LocalVariable> variables()Type returnType()List<Location> allLineLocations()...
ClassTypeList<Field> fields()List<Method> methods()...

26
Example: printing the local variablesif (e instanceof MethodEntryEvent) {
MethodEntryEvent me = (MethodEntryEvent)e;System.out.println("call of " + me.method().toString());printVars(me.thread().frame(0));...
}
static void printVars(StackFrame frame) {try {
Iterator iter = frame.visibleVariables().iterator();while (iter.hasNext()) {
LocalVariable v = (LocalVariable)iter.next();Out.print(v.name() + ": " + v.type().name() + " = ");printValue(frame.getValue(v)); Out.println();
}} catch (Exception e) { e.printStackTrace(); }
}
static void printValue(Value val) {if (val instanceof IntegerValue) {
Out.print(((IntegerValue)val).value() + " ");} else if (val instanceof StringReference) {
Out.print(((StringReference)val).value() + " ");} else if (val instanceof ArrayReference) {
Iterator iter = ((ArrayReference)val).getValues().iterator();while (iter.hasNext()) {
printValue((Value)iter.next());}
} else...}

27
Example: setting a breakpoint
static void setBreakpoint(Method m, int line) {try {
List<Location> locs = m.locationsOfLine(line);if (locs.size() > 0) {
Location loc = locs.get(0);EventRequestManager reqManager = vm.eventRequestManager();BreakpointRequest req = reqManager.createBreakpointRequest(loc);req.enable();
}} catch (Exception e) { e.printStackTrace(); }
}
if (e instanceof BreakpointEvent) {BreakpointEvent be = (BreakpointEvent)e;System.out.println("breakpoint at " + be.location().lineNumber() + " in " +
be.location().method().toString());printVars(be.thread().frame(0));
}
Handling the breakpoint event

28
Example: single stepstatic void stepOver(ThreadReference thread) {
try {StepRequest req = reqManager.createStepRequest(thread,
StepRequest.STEP_LINE, StepRequest.STEP_OVER);req.addClassFilter("*Test"); // create step requests only in class Testreq.addCountFilter(1); // create step event after 1 stepreq.enable();vm.resume();
} catch (Exception e) { e.printStackTrace(); }}
Handling the step eventif (e instanceof StepEvent) {
StepEvent se = (StepEvent)e;Out.print("step halted in " + se.location().method().name() + " at ");printLocation(se.location());printVars(se.thread().frame(0));reqManager.deleteEventRequest(se.request());
}
static void printLocation(Location loc) {Out.println(loc.lineNumber() + ", " + loc.codeIndex());
}


![Unit II [Software Process and SDLC Models] notes/Software...programming tools like compilers, interpreters, debuggers, etc. are used to generate the code. Different high level programming](https://img.dokumen.tips/doc/110x75/5eccdf9a13c75112e9419447/unit-ii-software-process-and-sdlc-models-notessoftware-programming-tools-like.jpg)


![Debuggers - LA | EPFLla.epfl.ch/.../Teaching/CS111-Programming/2015/Debuggers.2015.pdf · CI Display debuggers log C] Add other open projects' paths in the debuggers search list C]](https://img.dokumen.tips/doc/110x75/5ac2135d7f8b9a357e8d6d5c/debuggers-la-display-debuggers-log-c-add-other-open-projects-paths-in-the.jpg)