Embed Size (px)
Citation preview

China-USA Business Review, July 2016, Vol. 15, No. 7, 337-361 doi: 10.17265/1537-1514/2016.07.004
Betas Used by Professors: A Survey With 2,500 Answers
Pablo Fernandez, Isabel Fernandez Acín University of Navarra, Madrid, Spain
This paper reports report 2,510 answers from professors from 65 countries and 934 institutions, 1,791 respondents
use betas, but 107 of them do not justify the betas they use. About 97.3% of the professors justify the betas use
regressions, webs, databases, textbooks, or papers, although many of them state that calculated betas “are poorly
measured and have many problems”. Only 0.9% of the professors justify the beta using exclusively personal
judgement (named qualitative, common sense, intuitive, and logical magnitude betas by different professors).
Keywords: beta, capital asset pricing model, homogeneous and heterogeneous expectations, dispersion of calculated
betas
Betas Used by Professors A short email (see Appendix 1) was sent during the third week of April 2009 to about 8,000 email
addresses of finance and economic professors obtained from previous correspondence, papers, and webs of the universities. It asked the beta that professors used to calculate the required return to equity. It also asked how the number was justified.
By May 12, 2009, 2,510 responses1 from professors from 65 countries were received. Of these 2,510 answers, 1,791 respondents used betas (see Table 1), 107 of these professors do not justify the betas that they use, and the rest (1,684) justify the betas.
According to the result, 1,684 professors justify the betas that they use: 1,639 (97.3%) justify the beta that they use with regressions, webs, databases, textbooks, or papers. 15 (0.9%) justify the beta using only personal judgement (named qualitative betas, common sense betas,
intuitive betas, logical magnitude betas, and own judgement betas by different professors). Appendix 2 shows the main results of the survey by country. Table 2 contains the most frequent comments of the professors that use “other” justification for the betas.
Table 3 contains the references (books and articles) cited by professors for justifying the use of calculated betas or the magnitude of the betas that they use. Table 4 contains the webs and databases cited by some of the 761 professors that use them.
∗ Acknowledgements: We are very grateful to the professors that answered my email and to Maria Oleaga for improving earlier versions of this paper. Vicente Bermejo and Laura Parga provided excellent research assistance.
Pablo Fernandez, professor of finance, IESE Business School, University of Navarra, Madrid, Spain. Isabel Fernandez Acín, research assistant, IESE Business School, University of Navarra, Madrid, Spain. Correspondence concerning this article should be addressed to detailed address Pablo Fernandez, IESE Business School,
University of Navarra, Camino del Cerro del Aguila 3, 28023 Madrid, Spain. 1 The authors also received answers from companies, banks and investment banks. The authors will analyse them in a separate document.
DAVID PUBLISHING
D

A SURVEY WITH 2,500 ANSWERS
338
Table 1 Main Results of the Survey
USA Europe Asia Australia & New Zealand
Canada America (ex US & Can)
Africa Total
1 Number of answers 1,340 748 170 94 80 66 12 2,5102 Different countries 1 26 20 2 1 11 4 65 3 Different institutions 443 299 92 28 31 35 6 934 4 Do not use betas, but use required return to equity 87 43 5 9 2 3 2 151 5 Use betas 995 478 138 60 58 53 9 1,7916 Do not justify the betas 62 26 11 3 4 0 1 107 Justify the betas with: 7 Regressions 669 344 104 44 48 39 5 1,2538 Webs and databases 461 167 42 23 23 41 4 761 9 Textbooks or papers 298 153 36 18 19 26 5 555 10 Cases 12 4 0 0 0 0 0 16 11 Common sense, judgement… 12 12 0 1 0 1 0 26 12 Other 18 74 28 8 4 5 2 139
13 Regressions, webs, databases, Textbooks or Papers 922 426 123 55 52 53 8 1,639
14 Use only common sense, judgement… 6 8 0 1 0 0 0 15 Do not use betas because 15 Teach accounting or economics 79 68 13 11 8 4 183 16 Teach basic finance 47 27 3 4 3 1 85 17 CAPM is useless 46 29 4 3 3 1 86 18 Do not provide a reason for it 86 103 7 7 6 4 1 214 Comments from professors that justify betas with regressions, webs, databases, textbooks, or papers I use calculated betas, but I always reference the articles that explain the problems with beta as well. 117 If one does not use beta, then what is there? 45 It is poorly measured, but no substitution so far. There are no better alternatives. 18 I use betas… but I use all metrics that are available. 80 I do not use betas, but I teach their use. 16 The model has received a Nobel Prize in economics and while not perfect is used extensively in practice. 13
Table 2 Comments of the Professors That Reported “Other” Justification of the Betas Annual report of firms that calculate EVA Bond premium model Fundamental beta2 Betas derived from options prices Fundamentals Downside beta Damodaran’s bottom-up approach3 Hedge ratios Implied beta Beta’s applied by official regulators Sovereign risk Total beta4 SWAG analysis (scientific wild-ass guess) Continuous time finance Three-factor model
2 The predicted beta according to Barra that depends on “fundamental risk factors”: industry exposures, size, volatility, momentum, and value factors. 3 According to Damodaran’s web page, to estimate the bottom-up beta of a company, we broke it up into the different businesses and estimated the betas for each business based upon comparable firms. 4 Damodaran’s web page: “Total beta = Market beta/Correlation between stock and market. This measure is equivalent to dividing the standard deviation of a stock by the standard deviation of the market. For an undiversified investor, it may be a better measure of risk than the traditional market beta. It is useful for computing the cost of equity for a private business with an undiversified owner”.

A SURVEY WITH 2,500 ANSWERS
339
Table 3 Textbooks or Papers Cited by the Professors for Justifying the Use of Betas Fama & French (1992; 1996; 2004) 73 Bruner (1999; 2004) 5 Reilly, Wright, & Chan
(2000) 2 Comer, Larrymore, & Rodriguez (2009) 1
Keown, Petty, Martin, & Scott (2006) 1
Brealey, Myers, & Allen, (2005) 41 Carhart (1997) 5 Rohini (2008a; 2008b) 2 Cunningham (2001) 1 Kothari & Shanken
(1995; 1999) 1 Damodaran (2001; 2005; 2006) 41 Higgins (2009) 4 Scholes & Williams
(1977) 2 Da, Guo, & Jagannathan (2009) 1 Levy (1984; 1998) 1
Ross, Westerfield, & Jaffe (1993; 2005) 35
Grinblatt & Titman (2001) 4 Statman (1981) 2 Danthine & Donaldson
(2001) 1 Lobe, Niermeier, Essler, & Roder, (2008) 1
Ibbotson Associates 33 Treynor (1965) 4 Achelis (2000) 1 Daveni & Ilinitch (1992) 1
Mamaysky, Spiegel, & Zhang (2007) 1
Sharpe (1964) 30 Gitman (2008) 3 Adsera & Viñolas (1997)1 Derrig & Orr (2004) 1 Mandelker & Rhee
(1984) 1 Bodie, Kane, & Marcus (2004) 19 Hull (2009) 3 Alexander, Sharpe, &
Bailey (2003) 1 Duffie (2001) 1 Murphy (2000) 1
Berk, DeMarzo, & Harford (2008) 16 Mossin (1966) 3 Altug & Labadie (2008)
1 Eiteman, Stonehill, & Moffett (2006) 1
Nagel, Peterson, & Pratti (2007) 1
Brigham & Houston (2009) 13 Blume (1975) 2 Anderson & Fraser
(2002) 1 Fabozzi & Francis (1977) 1 Pereiro (2002) 1
Lintner (1965;1969) 11 Brennan & Li (2008) 2 Apap (2006) 1 Furman & Zitikis (2009) 1 Pike & Neale (2003) 1
Copeland, Weston, & Shastri (2005) 10
Brown & Warner (1985) 2 Baesel (1974) 1 Genton & Ronchetti
(2008) 1 Reinhart & Rogoff (2010) 1
Campbell & Vuolteenaho (2004) 10
Huang & Litzemberger (1988) 2
Beaver, Kettler, & Scholes (1970) 1
Gooding & O’Malley (1997) 1 Rojo (2007) 1
Elton, Gruber, Brown, & Goetzmann (2006) 9 Jensen (1968) 2 Bekaert & Hodrick
(2008) 1 Grabowski (2009) 1 Shapiro (2005) 1
Fernandez (2014) 9 Kaplan & Andrade (1998) 2 Berstein 1 Hamada (1972) 1 Shenoy & McCarthy
(2008) 1 Dimson, Marsh, & Staunton (2002; 2006) 8
Smith & Kiholm-Smith (2003) 2 Blake (1999) 1 Hawawini (1983) 1 Shirreff (2004) 1
Graham & Harvey (2007) 8 Los (2000; 2003) 2
Broquet, Cobbaut, Gillet, & van den Bergh (2004) 1
Hirshey & Pappas (1990) 1 Tole (1981) 1
Markowitz (1952; 1959; 2005) 8 Marín & Rubio (2009) 2 Buss & Vilkov (2009) 1 Howard (2008) 1 Turner (2005) 1
Cochrane (2005) 6 Mascarenas (2005) 2 Chrissos & Gillet (2008) 1 Jordan & Miller (2006) 1 Vasicek (1973) 1
Koller, Goedhart, & Wessels (2005) 6 Palepu & Healy (2007) 2 Christoffersen et al.
(2006) 1 Kahn & Grinold (1999) 1
Womack & Zhang (2003) 1
Table 4 Webs and Databases Cited by the 723 Professors That Used Them Yahoo Finance 109 Thomson 15 S&P’s Market Insight 2 Infinancials 1 Bloomberg 72 Madrid Stock Exchange 12 S&P NetAdvantage 2 Marketwatch.com 1 Damodaran Website 65 French Web site 11 Central Bank Chile 1 Multex Investor 1 Value Line 59 Capital Line 8 CNBC 1 Nat.Stock Exchange India 1 Google finance 32 Fama Web site 8 E-TRADE 1 Quote.com 1 Reuters 21 Capital IQ 5 ExecuComp 1 Research Insight 1 DataStream 17 Compustat 6 Fidelity Investments 1 SMARTMONEY 1 Morningstar 16 Vernimmen Website 5 Forbes.com 1 Wikipedia 2 Barra 15 Factset 5 Hoovers 1 worldexchange.org 1 MSN Moneycentral 15 Economatica database 2

A SURVEY WITH 2,500 ANSWERS
340
Dispersion of the Betas Provided by Webs and Databases Different beta sources provide different betas. Table 5 contains betas of three companies provided by the
webs and databases used by professors; and it highlights their huge dispersion: the betas of Coca Cola range from 0.31 to 0.8; the betas of Walt Disney range from 0.72 to 1.39; the betas of Wall-Mart Stores range from 0.13 to 0.71.
Table 5 Betas of Three Companies According to the Most Used Webs and Databases. May 12, 2009 Web/Database Coca Cola Walt Disney Wal-Mart Stores Bloomberg 0.79 1.06 0.58 Cnbc 0.60 1.00 0.30 Damodaran 0.61 0.88 0.19 Datastream 0.31 0.72 0.13 Ft.Com 0.80 1.06 0.57 Google Finance 0.60 1.03 0.26 Hoovers 0.60 1.00 0.20 Infomercados 0.33 1.39 0.31 Msn Moneycentral 0.54 1.03 0.16 Quote 0.54 1.13 0.19 Reuters 0.53 1.01 0.17 Smartmoney 0.61 1.03 0.26 Thomson Banker 0.55 1.09 0.38 Value Line 0.55 1.00 0.60 Vernimmen Website - 1.08 0.71 Yahoo Finance 0.63 0.99 0.28 Max 0.80 1.39 0.71 Min 0.31 0.72 0.13
Bruner, Eades, Harris, and Higgins (1998) also found sizeable differences among beta providers: for their sample, the average beta according to Bloomberg was 1.03, whereas according to Value Line it was 1.24.
Schizophrenic Approach to Valuation Valuation is about expected cash flows and about required return. All professors admit that different
investors may have different expected cash flows, but many professors affirm that the required return (discount rate) should be equal for everybody. That is the schizophrenic approach: to be a democrat for the expected cash flows but a dictator for the discount rate.
Most professors teach that the expected cash flows should be computed using common sense and good judgement about the company, its industry, the national economies… However, many professors teach a formula to calculate the discount rate (instead of using again common sense5). Most of the professors acknowledge that there are problems estimating two ingredients of the formula (the beta and the market risk premium), but, nevertheless, they continue using it for several reasons:
5 The authors mean common sense, experience and some financial knowledge.

A SURVEY WITH 2,500 ANSWERS
341
The formula is a theory that has received a Nobel Prize in Economics; “While not perfect, it is used extensively in practice”; “If one does not use beta then what is there?” “I use all metrics that are available”; “No substitution so far. There are no better alternatives”; “There is no other satisfactory tool in finance”; “We need another model to substitute CAPM and betas and 3-factor models”; “It is a useful tool to compare one stock with another”; “Calculated betas are on the CFA exam”; “Almost every practitioner book uses betas such as the McKinsey publications”; “Beta allows you to defend a valuation, impress management, and come across as a finance guru”; “Beta is simple and it is used in the real world”; “In consulting, it is essential to fully support your estimates”; “Referees want to see them as the underlying model”; “Fortune 500 firms use the CAPM to estimate their cost of equity”; “Regulatory practice often requires it”; “That point estimate gives the impression of truth”.
But business and management (which includes investing and valuation) are about common sense, not about recipes.
Problems Estimating the Betas The problems of the betas calculated with historical data are well-known: (1) They change considerably from one day to the next6. (2) They depend very much on which stock index is used as the market reference. (3) They depend very much on the historical period (five years, three years…) used7. (4) They depend on what returns (monthly, yearly…) are used to calculate them. (5) Very often it is not known if the beta of one company is lower or higher than the beta of another. (6) Calculated betas have little correlation with stock returns. (7) β = 1 has a higher correlation with stock returns than calculated betas for many companies. (8) The correlation coefficients of the regressions used to calculate the betas are very small. (9) The relative magnitude of betas often makes very little sense: companies with high risk often have
lower calculated betas than companies with lower risk. For these nine reasons, it can be said that:
the beta calculated with historical data is not a good approximation to the company’s beta;
6 Some authors, such as Damodaran( 2001, p. 72) acknowledged that company betas vary considerably, but claim that industry betas (the beta of the portfolio composed of the companies in a given industry) vary very little. They therefore recommend using the calculated beta of an industry. However, although industry betas vary less than company betas, they still vary significantly and using them can lead to serious errors. 7 Brigham and Gapenski (1977, p. 354, footnote 8) reported an illustrative anecdote in this respect: “A company that supplied betas told the authors that their company, and others, did not know what was the most appropriate period to use, but that they had decided to use five years in order to eliminate apparent differences between the betas provided by different companies, because big differences undermined the credibility of all of them”.
A SURVEY WITH 2,500 ANSWERS
342
or the beta of a company (a common figure for all investors) does not exist8. As many professors mention, historical betas (calculated from historical data) are useless to calculate the
required return to equity9, to rank portfolios with respect to systematic risk, and to estimate the expected return of companies.
A practical consequence: using a historical beta to value a stock, without analyzing the company’s and the industry’s future prospects, is very risky and, many times, a source of huge errors.
Calculated Betas Change Considerably From One Day to the Next Figure 1 is an example of how calculated betas change from one day to the next: it shows the historical
betas10 of Coca Cola, Walt Disney, and Wal-Mart in April 2009: the beta of Coca Cola varies from 0.06 to 0.57, the beta of Walt Disney varies from 0.66 to 1.07, and the beta of Wal-Mart varies from -0.05 to 0.5.
Fernandez (2014) showed the betas of 3,813 US companies calculated every day in the month of December 2001 and found that the median of (maximum beta/minimum beta) for each company was 3.07. The median of the percentage daily change (in absolute value) of the betas was 20% for companies and 7% for industries. The average of (maximum beta/minimum beta) for each industry was 2.7. About 77% of the companies and 25% of the industries had, in a month, a maximum beta more than two times bigger than their minimum beta.
-0,2
0,0
0,2
0,4
0,6
0,8
1,0
1,2
1-Ap
r-09
3-Ap
r-09
5-Ap
r-09
7-Ap
r-09
9-Ap
r-09
11-A
pr-0
9
13-A
pr-0
9
15-A
pr-0
9
17-A
pr-0
9
19-A
pr-0
9
21-A
pr-0
9
23-A
pr-0
9
25-A
pr-0
9
27-A
pr-0
9
29-A
pr-0
9
Calcu
lated
bet
as (m
onth
, 5 ye
ars)
Coca Cola Walt Disney Wal Mart
Figure 1. Historical betas of Coca Cola, Walt Disney, and Wal-Mart calculated each day of April 2009 with respect to the S&P 500 using five years of monthly data. Note. On April 7, 2009, the beta is calculated by running a regression of the 60 monthly returns of the company on the 60 monthly returns of the S&P 500 calculated on the 7th of the month: monthly return of April = [TRI (Total Return Index) of April, 7/TRI of March, 7] - 1.
Calculated Betas Change Considerably With the Time Period, Frecuency and Index Chosen as Reference Damodaran (1994) made this point by calculating the beta of Disney with different intervals (three and
five years), different frecuencies (daily, weekly…), and different market indexes: the beta ranges from 0.44 to 1.38. Damodaran (2001, p. 72) also calculated betas for Cisco versus the S&P 500 that range from 1.45 to 2.7. 8 It would imply that the CAPM does not work. It maybe because the required return is affected by other factors, besides, the co-variance of the company’s return with the market return, the risk-free rate, and the market risk premium; it also may be due to the heterenogeity of investors, it does not make sense talking about a “market portfolio”; it also maybe because the distribution of expected returns changes with time (and it can change in a different way for different investors). 9 The author use the term required return to equity instead of cost of equity because there is a radical difference between a required return and a cost. If the manager does not pay the cost of debt, the company , whereas if the company does not provide the required return to equity to their shareholders, the managers may suffer some problems. 10 When estimating betas, the standard procedure is to use five years of monthly data and a value-weighted index. This procedure is widely used in academic research and by many commercial beta providers.
A SURVEY WITH 2,500 ANSWERS
343
Figure 2 shows the historical betas of Coca Cola calculated every day in the month of April 2009 using monthly, weekly, and daily data of the last five years. It may be seen that betas calculated with daily data change very little (between 0.197 and 0.204), much less than the betas calculated with weekly data (between 0.07 and 0.35), and with mothly data (between 0.06 and 0.57).
0,0
0,1
0,2
0,3
0,4
0,5
0,6
1-Ap
r-09
3-Ap
r-09
5-Ap
r-09
7-Ap
r-09
9-Ap
r-09
11-A
pr-0
9
13-A
pr-0
9
15-A
pr-0
9
17-A
pr-0
9
19-A
pr-0
9
21-A
pr-0
9
23-A
pr-0
9
25-A
pr-0
9
27-A
pr-0
9
29-A
pr-0
9
Calcu
lated
bet
as o
f Coc
a Col
a
Monthly 5y Weekly 5y Daily 5y
Figure 2. Historical betas of Coca Cola. Betas calculated on each day of April 2009 with respect to the S&P 500 using five years of monthly, weekly, and daily data.
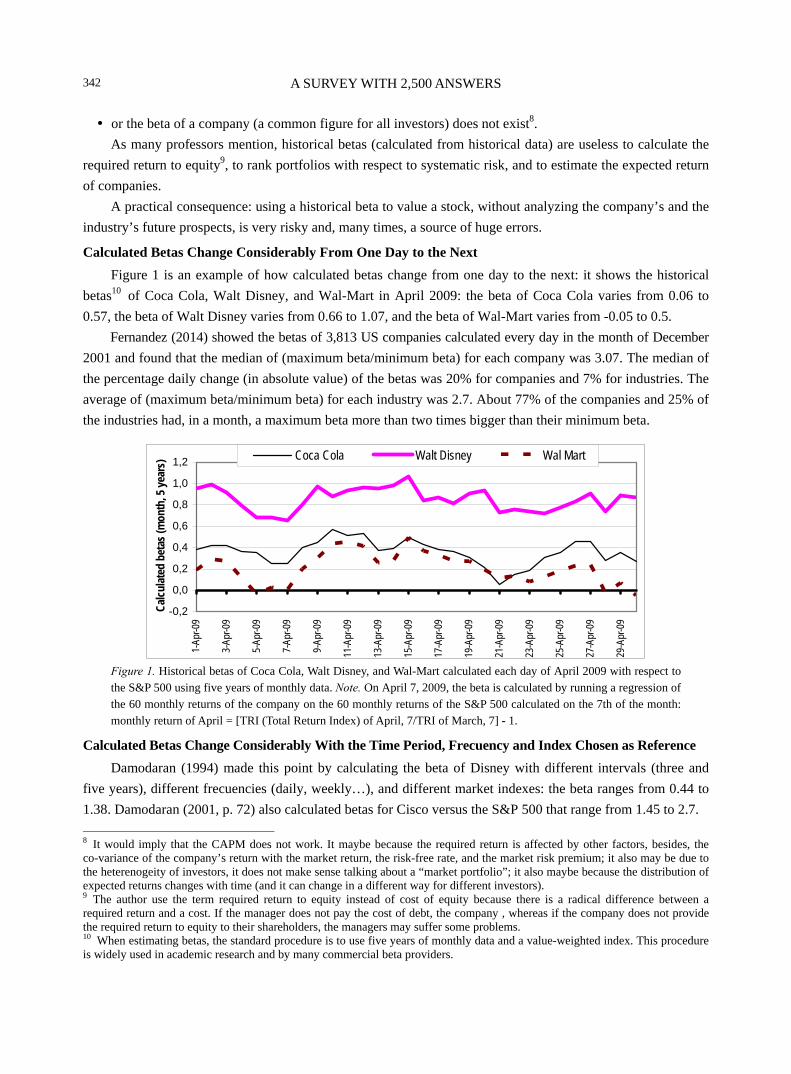
Which Company Has a Higher Beta? Fernandez (2014) ranked each day the companies from one (the one with the lowest beta) to 3,813 (the
company with the highest beta) and found that the average change in (max ranking-min ranking) for all 3,813 companies in December 2001 is 1,542 positions. The average beta ranking change from one day to the next was 233 positions; and from one day to the next week 479 positions.
Figure 3 highlights this point. It shows that in the month of December 2001, the beta of of AT&T varies from 0.33 to 1.02; the beta of Boeing varies from 0.58 to 1.22; and the beta of Coca Cola varies from 0.55 to 1.11. Which company has the highest or the lowest beta? It depends on which day was chosen.
0,2
0,4
0,6
0,8
1,0
1,2
1,4
1-Dec-01 6-Dec-01 11-Dec-01 16-Dec-01 21-Dec-01 26-Dec-01 31-Dec-01
AT&T Boeing Coca Cola
Figure 3. Historical betas of AT&T, Boeing, and Coca-Cola. Source: Datastream. Note. Betas calculated on each day of the month of December 2001 with respect to the S&P 500, i.e. on December 18, 2001, the beta is calculated by running a regression of the 60 monthly returns of the company on the 60 monthly returns of the S&P 500. The returns of each month are calculated on the 18th of the month:
1total return December 18, 2001monthly return of December 18, 2001 .total return November 18, 2001
−=
A SURVEY WITH 2,500 ANSWERS
344
Implications for Constructing Beta-ranked Portfolios Fernandez (2014) sorted 3,813 US companies by decreasing betas on December 1, 2001 and constructed
20 portfolios (Portfolio 1 had the company with the highest betas and portfolio 20 is the one with the lowest betas). Then, he calculated the beta of the portfolios every day of the following two months and found that 300 portfolios were misallocated (i.e., on 26 days, portfolio 5 had lower beta than portfolio 6). He also formed portfolios in the Fama and French’s (1992) way on December 1 and December 15, 2001 and found that 71.3% of the companies change from one portfolio on December 1 to another on December 15.
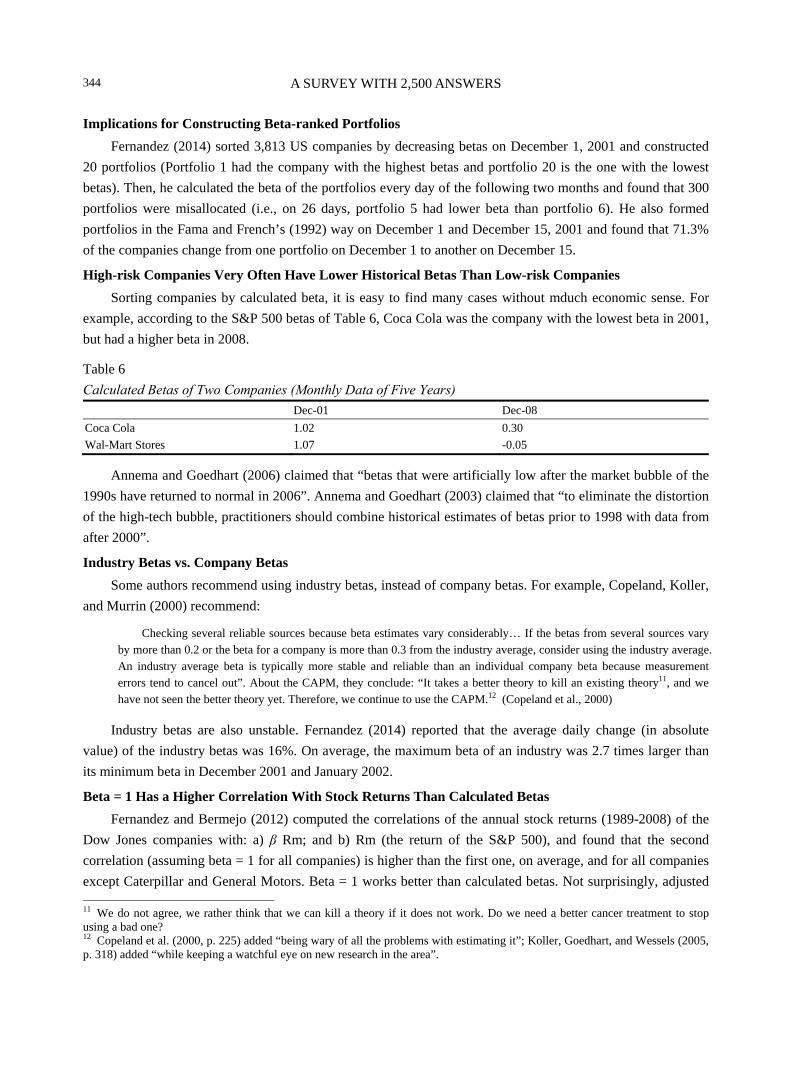
High-risk Companies Very Often Have Lower Historical Betas Than Low-risk Companies Sorting companies by calculated beta, it is easy to find many cases without mduch economic sense. For
example, according to the S&P 500 betas of Table 6, Coca Cola was the company with the lowest beta in 2001, but had a higher beta in 2008.
Table 6 Calculated Betas of Two Companies (Monthly Data of Five Years) Dec-01 Dec-08 Coca Cola 1.02 0.30 Wal-Mart Stores 1.07 -0.05
Annema and Goedhart (2006) claimed that “betas that were artificially low after the market bubble of the 1990s have returned to normal in 2006”. Annema and Goedhart (2003) claimed that “to eliminate the distortion of the high-tech bubble, practitioners should combine historical estimates of betas prior to 1998 with data from after 2000”.
Industry Betas vs. Company Betas Some authors recommend using industry betas, instead of company betas. For example, Copeland, Koller,
and Murrin (2000) recommend:
Checking several reliable sources because beta estimates vary considerably… If the betas from several sources vary by more than 0.2 or the beta for a company is more than 0.3 from the industry average, consider using the industry average. An industry average beta is typically more stable and reliable than an individual company beta because measurement errors tend to cancel out”. About the CAPM, they conclude: “It takes a better theory to kill an existing theory11, and we have not seen the better theory yet. Therefore, we continue to use the CAPM.12 (Copeland et al., 2000)
Industry betas are also unstable. Fernandez (2014) reported that the average daily change (in absolute value) of the industry betas was 16%. On average, the maximum beta of an industry was 2.7 times larger than its minimum beta in December 2001 and January 2002.
Beta = 1 Has a Higher Correlation With Stock Returns Than Calculated Betas Fernandez and Bermejo (2012) computed the correlations of the annual stock returns (1989-2008) of the
Dow Jones companies with: a) β Rm; and b) Rm (the return of the S&P 500), and found that the second correlation (assuming beta = 1 for all companies) is higher than the first one, on average, and for all companies except Caterpillar and General Motors. Beta = 1 works better than calculated betas. Not surprisingly, adjusted 11 We do not agree, we rather think that we can kill a theory if it does not work. Do we need a better cancer treatment to stop using a bad one? 12 Copeland et al. (2000, p. 225) added “being wary of all the problems with estimating it”; Koller, Goedhart, and Wessels (2005, p. 318) added “while keeping a watchful eye on new research in the area”.

A SURVEY WITH 2,500 ANSWERS
345
betas (0.67 calculated beta + 0.33) have higher correlation than calculated betas. But adjusted betas have lower correlation than beta = 1. They do the exercise with four calculated betas every year end vs. the S$P 500, using: a) monthly data of last five years; b) monthly data of last two years; c) weekly data of last five years; and d) daily data of last five years. They find similar results with the four betas.
Calculating the Required Return to Equity Without Regressions The market value of the company’s equity is obtained by discounting the expected equity cash flows at the
required return to equity (Ke). Ke can be calculated by adding a company premium (CP) to the risk free rate (RF). The risk free rate can
be gotten for sure buying government bonds. The magnitude of CP depends on the assessment of the risk of the expected cash flows.
Ke = RF + CP There are 151 respondents in the survey that use this method (without using β) to calculate the Ke13.
According to Lobe et al. (2008), “the majority of German firms merely rely on individual risk premiums”. The company premium (CP) can be decomposed in two components: the market risk premium (MRP) and
the beta (β). The MRP is the answer to the following question: What incremental return does the investor require for investing in a diversified portfolio of shares over the risk-free rate? Different companies, different professors, and different books may use, and in fact do use different MRPs14. The β is a firm specific parameter that depends on the assessment of the risk of the expected cash flows, β, is 0 for government bonds, 1 for a diversified portfolio of shares.
Ke = RF + CP = RF + βMRP According to the capital asset pricing model (CAPM), all investors should use the same β and the same
MRP. On top of that, the β of each company and the MRP are parameters that exist and investors should be able to estimate accurately with appropriate statistical tools. Many investors do not share this view and think that the β of each company and the MRP should be computed for each company and every investor using common sense and good judgement about the company, its industry, the national economies…15
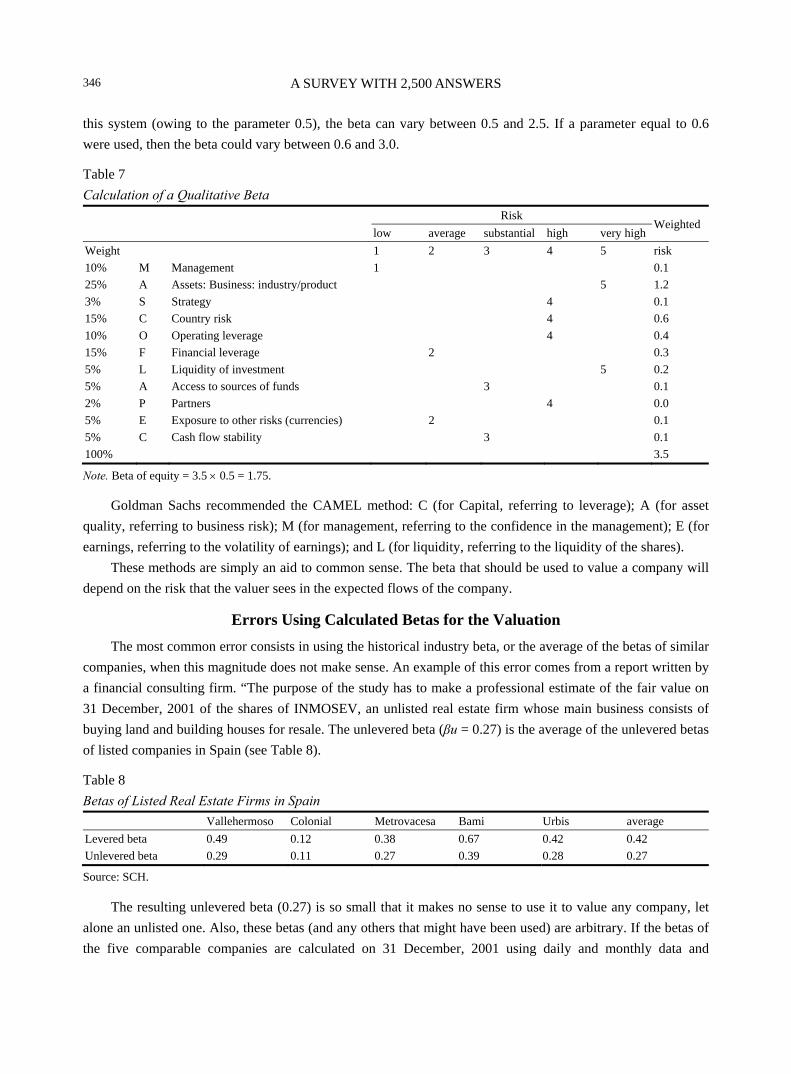
Calculating a Qualitative Beta Given the instability and the meaninglessness of historical betas, companies are increasingly resorting to
calculate a qualitative beta of companies or investment projects. For example16: A company uses the MASCOFLAPEC method (from the initials of the parameters used to evaluate the risk of each project, see Table 7) to estimate the beta. Each parameter is scored from 1 to 5 according to its contribution to the risk. Each factor also has to be weighted. In the attached example, the sum of the scores of each parameter, bearing in mind its weight, was 3.5. Multiplying this number by 0.5, a beta of 1.75 can be obtained. Noting that with
13 Another related method is the “Bond premium model”: Ke is calculated by adding a premium to the cost of debt of the company. 14 Fernandez (2009) reported the average MRP used in 2008 by US professors: 6.3%. The dispersion was high: professors of the same institution had an average range of 3.5% and professors of the same country 6.9%. He also reported 416 answers from the field: the average MRP used by European Companies in 2008 was 6.4%, ranging from 2% to 30%. 15 Another method for family business is explained by the authors’ friend Guillermo Fraile, IAE professor at Buenos Aires, in his classes: the HMDYWD (initials for how much do you want, Dad?) method. It is not a joke: it does not make much sense to talk about the Ke as a magnitude shared by all investors; but it does make sense to talk about each investor’s Ke, including Dad’s. 16 This example is taken from Fernandez (2014).
A SURVEY WITH 2,500 ANSWERS
346
this system (owing to the parameter 0.5), the beta can vary between 0.5 and 2.5. If a parameter equal to 0.6 were used, then the beta could vary between 0.6 and 3.0.
Table 7 Calculation of a Qualitative Beta
Risk
Weightedlow average substantial high very high
Weight 1 2 3 4 5 risk 10% M Management 1 0.1 25% A Assets: Business: industry/product 5 1.2 3% S Strategy 4 0.1 15% C Country risk 4 0.6 10% O Operating leverage 4 0.4 15% F Financial leverage 2 0.3 5% L Liquidity of investment 5 0.2 5% A Access to sources of funds 3 0.1 2% P Partners 4 0.0 5% E Exposure to other risks (currencies) 2 0.1 5% C Cash flow stability 3 0.1 100% 3.5
Note. Beta of equity = 3.5 × 0.5 = 1.75.
Goldman Sachs recommended the CAMEL method: C (for Capital, referring to leverage); A (for asset quality, referring to business risk); M (for management, referring to the confidence in the management); E (for earnings, referring to the volatility of earnings); and L (for liquidity, referring to the liquidity of the shares).
These methods are simply an aid to common sense. The beta that should be used to value a company will depend on the risk that the valuer sees in the expected flows of the company.
Errors Using Calculated Betas for the Valuation The most common error consists in using the historical industry beta, or the average of the betas of similar
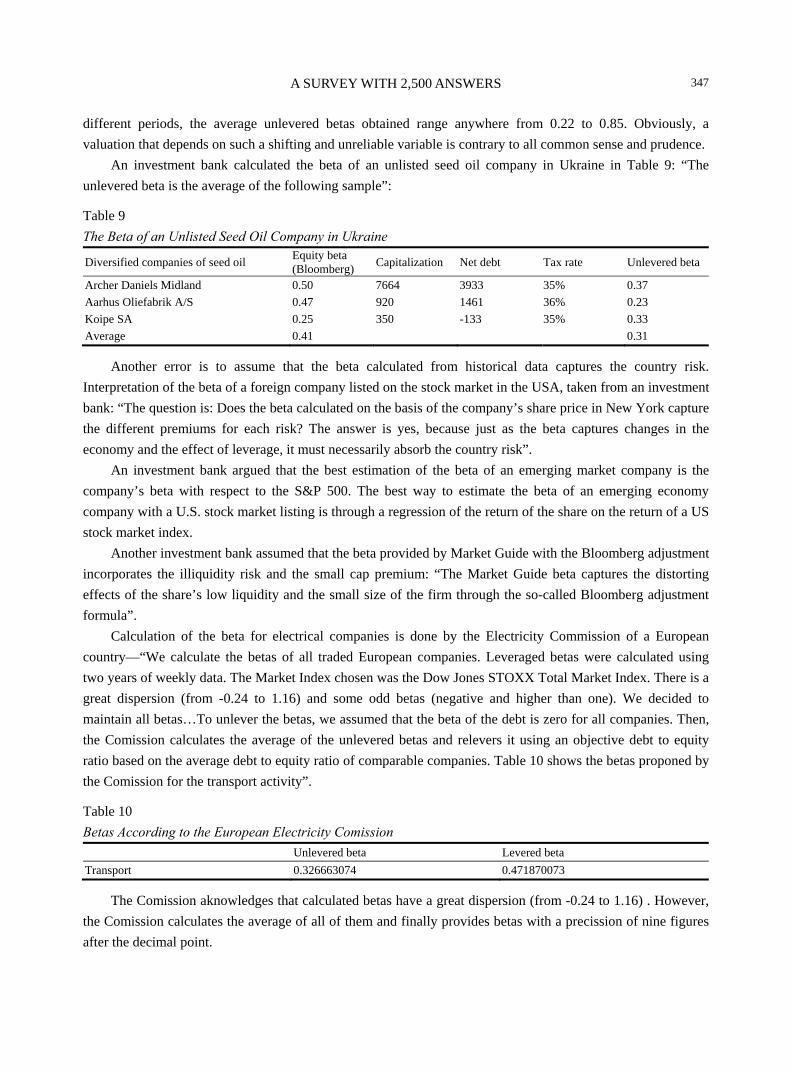
companies, when this magnitude does not make sense. An example of this error comes from a report written by a financial consulting firm. “The purpose of the study has to make a professional estimate of the fair value on 31 December, 2001 of the shares of INMOSEV, an unlisted real estate firm whose main business consists of buying land and building houses for resale. The unlevered beta (βu = 0.27) is the average of the unlevered betas of listed companies in Spain (see Table 8).
Table 8 Betas of Listed Real Estate Firms in Spain Vallehermoso Colonial Metrovacesa Bami Urbis average Levered beta 0.49 0.12 0.38 0.67 0.42 0.42 Unlevered beta 0.29 0.11 0.27 0.39 0.28 0.27
Source: SCH.
The resulting unlevered beta (0.27) is so small that it makes no sense to use it to value any company, let alone an unlisted one. Also, these betas (and any others that might have been used) are arbitrary. If the betas of the five comparable companies are calculated on 31 December, 2001 using daily and monthly data and
A SURVEY WITH 2,500 ANSWERS
347
different periods, the average unlevered betas obtained range anywhere from 0.22 to 0.85. Obviously, a valuation that depends on such a shifting and unreliable variable is contrary to all common sense and prudence.
An investment bank calculated the beta of an unlisted seed oil company in Ukraine in Table 9: “The unlevered beta is the average of the following sample”:
Table 9 The Beta of an Unlisted Seed Oil Company in Ukraine
Diversified companies of seed oil Equity beta (Bloomberg) Capitalization Net debt Tax rate Unlevered beta
Archer Daniels Midland 0.50 7664 3933 35% 0.37 Aarhus Oliefabrik A/S 0.47 920 1461 36% 0.23 Koipe SA 0.25 350 -133 35% 0.33 Average 0.41 0.31
Another error is to assume that the beta calculated from historical data captures the country risk. Interpretation of the beta of a foreign company listed on the stock market in the USA, taken from an investment bank: “The question is: Does the beta calculated on the basis of the company’s share price in New York capture the different premiums for each risk? The answer is yes, because just as the beta captures changes in the economy and the effect of leverage, it must necessarily absorb the country risk”.
An investment bank argued that the best estimation of the beta of an emerging market company is the company’s beta with respect to the S&P 500. The best way to estimate the beta of an emerging economy company with a U.S. stock market listing is through a regression of the return of the share on the return of a US stock market index.
Another investment bank assumed that the beta provided by Market Guide with the Bloomberg adjustment incorporates the illiquidity risk and the small cap premium: “The Market Guide beta captures the distorting effects of the share’s low liquidity and the small size of the firm through the so-called Bloomberg adjustment formula”.
Calculation of the beta for electrical companies is done by the Electricity Commission of a European country—“We calculate the betas of all traded European companies. Leveraged betas were calculated using two years of weekly data. The Market Index chosen was the Dow Jones STOXX Total Market Index. There is a great dispersion (from -0.24 to 1.16) and some odd betas (negative and higher than one). We decided to maintain all betas…To unlever the betas, we assumed that the beta of the debt is zero for all companies. Then, the Comission calculates the average of the unlevered betas and relevers it using an objective debt to equity ratio based on the average debt to equity ratio of comparable companies. Table 10 shows the betas proponed by the Comission for the transport activity”.
Table 10 Betas According to the European Electricity Comission Unlevered beta Levered beta Transport 0.326663074 0.471870073
The Comission aknowledges that calculated betas have a great dispersion (from -0.24 to 1.16) . However, the Comission calculates the average of all of them and finally provides betas with a precission of nine figures after the decimal point.

A SURVEY WITH 2,500 ANSWERS
348
Conclusion This paper reports 2,510 answers from professors from 65 countries and 934 institutions, 1,791
respondents use betas, but 107 of them do not justify the betas they use; 97.3% of the professors justify the betas use regressions, webs, databases, textbooks, or papers (Tables 2, 3, and 4 specify which ones), although many of them admit that calculated betas are poorly measured and have many problems.
Only 0.9% of the professors justify the beta using exclusively personal judgement (named qualitative betas, common sense betas, intuitive betas, logical magnitude betas, and own judgement betas by different professors).
Appendixes 3, 4 and 5 include interesting comments from 160 professors. The required return to equity is one of the most important but elusive parameters in finance. According to
the CAPM, all investors should use the same figure. Historical betas are not meaningful to calculate the required return on equity. First, because they change
dramatically from one day to the next; second, because very often it cannot be said with confidence that the calculated beta of a company is smaller or bigger than the beta of another; third, because historical betas do not make much sense in many cases: high-risk companies very often have smaller historical betas than low-risk companies; fourth, because historical betas depend very much on which index, on which data frequency and in which time interval is used to calculate them; and fifth, because beta = 1 works better than calculated betas.
Fama (1976, p. 319) mentioned about the CAPM that “The fact that assessments are assumed to be common to all investors and that investor perceptions are assumed to be correct allows us to go from theory to data”. Later, Fama and French (2004) stated that “Unfortunately, the empirical record of the model is poor—poor enough to invalidate the way it is used in applications… Evidence mounts that much of the variation in expected return is unrelated to market beta”.
Valuation is about expected cash flows and about required return. All professors admit that different investors may have different expected cash flows, but many professors affirm that the required return (discount rate) should be equal for everybody. That is the schizophrenic approach: to be a democrat for the expected cash flows but a dictator for the discount rate.
Most professors teach that the expected cash flows should be computed using common sense and good judgement about the company, its industry, the national economies… However, many professors teach a formula to calculate the discount rate (instead of using again common sense). Most of the professors acknowledge that there are problems estimating two ingredients of the formula (the beta and the market risk premium), but, nevertheless, many of them continue using it.
References Achelis, S. B. (2000). Technical analysis from A to Z (2nd ed.). New York, NY: McGraw Hill. Adsera, X., & Vinolas, P. (1997). Principios de valoracion de empresas. Editorial Deusto. Alexander, G., Sharpe, W., & Bailey, J. (2003). Fundamentos de inversiones: Teoría y práctica (3rd ed.). Mexico: Pearson. Altug, S., & Labadie, P. (2008). Asset pricing for dynamic economies. Cambridge University Press. Anderson, R. C., & Fraser, D. R. (2000). Corporate control, bank risk taking, and the health of the banking industry. Journal of
Banking & Finance, 24(8), 1383-1398. Annema, M., & Goedhart, M. (2003). Better betas. McKinsey on finance (pp. 10-13). Winter. Annema, M., & Goedhart, M. (2006). Betas: Back to normal. McKinsey on finance 20 (pp. 14-16). Summer. Apap, A. (2006). Portfolio planning for individual investors. Bosworth-Bradley Publishing.

A SURVEY WITH 2,500 ANSWERS
349
Baesel, J. B. (1974). On the assessment of risk: Some further considerations. Journal of Finance, 24(5), 1491-1494. Beaver, W., Kettler, P., & Scholes, M. (1970). The association between market determined and accounting determined risk
measures. The Accounting Review, 45, 654-682. Bekaert, G., & Hodrick, R. J. (2008). International financial management. Pearson Education. Berk, J., DeMarzo, P., & Harford, J. (2008). Fundamentals of corporate finance. Pearson Education. Blake, D. (1999). Financial market analysis (2nd ed.). New York, NY: John Wiley & Sons. Blume, M. E. (1975). Betas and their regression tendencies. The Journal of Finance, 30(3), 785-795. Bodie, Z., Kane, A., & Marcus, A. J. (2004). Investments (6th ed.). New York, NY: McGraw Hill. Brealey, R. A., Myers, S. C., & Allen, F. (2005). Principles of corporate finance (8th ed.). New York, NY:
McGraw-Hill/Irwin. Brennan, M. J., & Li, F. (2008). Agency and asset pricing. UCLA Working Paper. SSRN No. 1104546. Brigham, E., & Gapenski, L. C. (1977). Financial management: Theory and practice. Dryden Press. Brigham, E., & Houston, J. F. (2009). Fundamentals of financial management (12th ed.). Thomson One. Broquet, C., Cobbaut, R., Gillet, R., & van den Bergh, A. (2004). Gestion de portefeuille (4th ed.). De Boeck. Brown, S. J., & Warner, J. B. (1985). Using daily stock returns: The case of event studies. Journal of Financial Economics, 14(1),
3-31. Bruner, R. F. (1999). Instructor’s resource manual to accompany case studies in finance (3rd ed.). New York, NY:
McGraw-Hill/Irwin. Bruner, R. F. (2004). Applied mergers and acquisitions. New York, NY: John Wiley & Sons. Bruner, R. F., Eades, K., Harris, R., & Higgins, R. (1998). Best practices in estimating the cost of capital: Survey and synthesis.
Financial Practice and Education, 8(1), 13-28. Buss, A., & Vilkov, G. (2009). Option-implied correlation and factor betas revisited. SSRN WP No. 1301437. Campbell, J. Y., & Vuolteenaho, T. (2004). Bad beta, good beta. American Economic Review, 94, 1249-1275. Carhart, M. M. (1997). On persistence in mutual fund performance. Journal of Finance, 52, 57-82. Chrissos, J., & Gillet, R. (2008). Décision d investissement (2nd ed.). Collection Gestion appliquée, Pearson, Paris. Christoffersen, P., Jacobs, K., & Vainberg, G. (2006). Forward-looking betas. Working Paper, Faculty of Management, McGill
University. Cochrane, J. (2005). Asset pricing. Princeton University Press. Comer, G., Larrymore, N., & Rodriguez, J. (2009). Controlling for fixed income exposure in portfolio evaluation: Evidence from
hybrid mutual funds. Review of Financial Studies, 22, 481-507. Copeland, T., Koller, T., & Murrin, J. (2000). Valuation: Measuring and managing the value of companies (3rd ed.). New York,
NY: Wiley. Copeland, T., Weston, F., & Shastri, K. (2005). Financial theory and corporate policy (4th ed.). Pearson Addison-Wesley. Cunningham, L. A. (2001). How to think like benjamin graham and invest like warren buffett. New York, NY: McGraw-Hill
Publishing. Da, Z., Guo, R., & Jagannathan, R. (2009). CAPM for estimating the cost of equity capital: Interpreting the empirical evidence.
NBER Working Paper No. 14889. Damodaran, A. (1994). Damodaran on valuation. New York: John Wiley. Damodaran, A. (2001). The dark side of valuation. New York, NY: Prentice-Hall. Damodaran, A. (2005). Applied corporate finance: A user’s manual (2nd ed.). New York, NY: Wiley. Damodaran, A. (2006). Damodaran on valuation (2nd ed.). New York: John Wiley and Sons. Danthine, J. P., & Donaldson, J. B. (2001). Intermediate financial theory. Prentice-Hall. Daveni, R. A., & Ilinitch, A. Y. (1992). Complex patterns of vertical integration in the forest products industry—Systematic and
bankruptcy risks. Academy of Management Journal, 35(3), 596-625. Derrig, R. A., & Orr, E. D. (2004). Equity risk premium: Expectations great and small. North American Actuarial Journal, 8(1),
45-69. Dimson, E., Marsh, P., & Staunton, M. (2002). Triumph of the optimists: 101 years of global investment returns. Princeton
University Press. Dimson, E., Marsh, P., & Staunton, M. (2006). DMS global returns data module. Chicago, Ibbotson Associates. Duffie, J. (2001). Dynamic asset pricing theory (3rd ed.). Princeton University Press. Eiteman, D. K., Stonehill, A. I., & Moffett, M. H. (2006). Multinational business finance (11th ed.). Addison Wesley.

A SURVEY WITH 2,500 ANSWERS
350
Elton, E. J., Gruber, M. J., Brown, S. J., & Goetzmann, W. N. (2006). Modern portfolio theory and investment analysis (7th ed.). Wiley.
Fabozzi, F. J., & Francis, J. C. (1977). Stability tests for alphas and betas over bull and bear market conditions. The Journal of Finance, 32(4), 1093-1128.
Fama, E. (1976). Foundations of finance. New York: Basic Books Inc. Fama, E., & French, K. (1992). The cross-section of expected stock returns. Journal of Finance, 47, 427-466. Fama, E., & French, K. (1996). The CAPM is wanted, dead or alive. Journal of Finance, 51, 1947-1958. Fama, E., & French, K. (2004). The CAPM: Theory and evidence. Journal of Economic Perspectives, 18, 25-46. Fernandez, P. (2009). Market risk premium used in 2008 by professors: A survey with 1,400 answers. SSRN No. 1344209. Fernandez, P. (2014). Are calculated betas worth for anything? SSRN No. 504565. Retrieved from
http://ssrn.com/abstract=504565 Fernandez, P., & Bermejo, V. (2012). Beta = 1 does a better job than calculated betas. SSRN No. 1406923. Furman, E., & Zitikis, R. (2009). General Stein-type decompositions of covariances and the CAPM. SSRN No. 1103333. Genton, M., & Ronchetti, E. (2008). Robust prediction of beta. In E. J. Kontoghiorghes, B. Rustem, and P. Winker (Eds.),
Computational methods in financial engineering (pp. 147-161). Berlin: Springer. Gitman, L. (2008). Principles of managerial finance (5th ed.). Addison Wesley. Gooding, A. R., & O’Malley, T. P. (1977). Market phase and the stationarity of beta. Journal of Financial and Quantitative
Analysis, 833-857. Grabowski, R. J. (2009). Problems with cost of capital estimation in the current environment—Update 1. Graham, J. R., & Harvey, C. R. (2007). The equity risk premium in january 2007: Evidence from the Global CFO Outlook Survey.
Icfai Journal of Financial Risk Management, IV, No. 2, 46-61. Grinblatt, M., & Titman, S. (2001). Financial markets & corporate strategy (2nd ed.). New York, NY: McGraw-Hill/Irwin. Hamada, R. S. (1972). The effect of the firm’s capital structure on the systematic risk of common stocks. Journal of Finance, 27,
435-452. Hawawini, G. (1983). Why beta shifts as the return interval changes. Financial Analysts Journal, May-June, 73-77. Higgins, R. (2009). Analysis for financial management (9th ed.). McGraw Hill Higher Education. Hirshey, J., & Pappas, M. (1990). Managerial economics. Thomson Learning. Howard, M. (2008). Accounting and business valuation methods. Elsevier. Huang, C. F., & Litzemberger, R. (1988). Foundations for financial economics. North-Holland. Hull, J. (2009). Risk management and financial institutions (2nd ed.). Prentice Hall. Jensen, M. (1968). The performance of mutual funds in the period 1945-1964. Journal of Finance, 23(2), 389-416. Jordan, B., & Miller, T. (2006). Fundamentals of investments (4th ed.). New York, NY: McGraw-Hill/Irwin. Kahn, R., & Grinold, R. (1999). Active portfolio management (2nd ed.). New York, NY: McGraw-Hill. Kaplan, S., & Andrade, G. (1998). How costly is financial (not economic) distress? Evidence from highly leveraged transactions
that became distressed. Journal of Finance, 53, 1443-1494. Keown, A., Petty, W., Martin, J., & Scott, D. (2006). Foundations of finance: The logic and practice of finance management (5th
ed.). Prentice Hall. Koller, T., Goedhart, M., & Wessels, D. (2005). Valuation: Measuring and managing the value of companies (4th ed.). McKinsey
& Company, Inc. Wiley. Kothary, S. P., & Shanken, J. (1995). In defense of beta. Journal of Applied Corporate Finance, 8, 53-58. Kothary, S. P., & Shanken, J. (1999). Beta and book-to-market: Is the glass half full or half empty? Simon School of Business
Working Paper FR 97-20. Levy, H. (1984). Measuring risk and performance over alternative investment horizons. Financial Analysts Journal, 40(2), 61-68. Levy, H. (1998). Principles of corporate finance. South-Western Educational Publishing. Lintner, J. (1965). The valuation of risk assets and the selection of risky investments in stock portfolios and capital budgets.
Review of Economics and Statistics, 47, 13-37. Lintner, J. (1969). The aggregation of investor’s diverse judgments and preferences in purely competitive security markets.
Journal of Financial and Quantitative Analysis, 347-400. Lobe, S., Niermeier, T., Essler, W., & Roder, K. (2008). Do managers follow the shareholder value principle when applying
capital budgeting methods? SSRN No. 1089379. Los, C. A. (2000). Computational finance. World Scientific Publishing Co.
A SURVEY WITH 2,500 ANSWERS
351
Los, C. A. (2003). Financial market risk: Measurement & analysis (2nd ed.). Routledge. Mamaysky, H., Spiegel, M., & Zhang, H. (2007). Improved forecasting of mutual fund alphas and betas. Review of Finance, 11,
359-400. Mandelker, G. N., & Rhee, S. G. (1984). The impact of the degrees of operating and financial leverage on systematic risk of
common stock. Journal of Financial and Quantitative Analysis, 19(1), 45-57. Marín, J. M., & Rubio, G. (2009). Economía financiera. Antonio Bosch Ed. Markowitz, H. M. (1952). Portfolio selection. Journal of Finance, 7(1), 77-99. Markowitz, H. M. (1959). Portfolio selection: Efficient diversification of investments. Cowles Foundation Monograph No. 16.
New York: John Wiley & Sons, Inc. Markowitz, H. M. (2005). Market efficiency: A theoretical distinction & so what? Working Paper. Mascarenas, J. (2005). Fusiones y adquisiciones de empresas (4th ed.). Madrid: McGraw Hill. Mossin, J. (1966). Equilibrium in a capital asset market. Econometrica, 34, 768-783. Murphy, A. (2000). Scientific investment analysis (2nd ed.). Quorum Books. Nagel, G. L., Peterson, D. R., & Pratti, R. (2007). The effect of risk factors on estimating the cost of equity. Quarterly Journal of
Business and Economics (Finance and Accounting), 46(1), 61-87. Palepu, K. G., & Healy, P. M. (2007). Business analysis and valuation: using financial statements (4th ed.). South-Western
College Pub. Pereiro, L. E. (2002). Valuation of companies in emerging markets (1st ed.). Wiley. Pike, R., & Neale, B. (2003). Corporate finance & investment: Decisions & strategies (Pearson 4th ed.). Financial Times
Management. Reilly, F. K., Wright, D. J., & Chan, K. C. (2000). Bond market volatility compared to stock market volatility. Journal of
Portfolio Management, 82-92. Reinhart, C. M., & Rogoff, K. S. (2010). Growth in a time of debt. American Economic Review, 100(2), 573-578. Rohini, S. (2008a). Beta estimation in the Indian stock market: Stability, stationarity and computational considerations. Decision,
35(2), 63-86. Rohini, S. (2008b). Beta stationarity over bull and bear markets in India. ICFAI Journal of Applied Finance, 14(4), 32-47. Rojo, A. (2007). Valoración de empresas y gestion basada en valor. Editorial Thompson Paraninfo. Roll, R. (1977). A critique of the asset pricing theory’s tests. Journal of Financial Economics, 4(2), 129-176. Ross, S. A., Westerfield, R. W., & Jaffe, J. F. (1993). Corporate finance (3rd ed.). Homewood, IL: Irwin/McGraw-Hill. Ross, S. A., Westerfield, R. W., & Jaffe, J. F. (2005). Corporate finance (7th ed.). Homewood, IL: McGraw-Hill/Irwin. Scholes, M., & Williams, J. (1977). Estimating betas from nonsynchronous data. Journal of Financial Economics, 5, 309-327. Shapiro, A. C. (2005). Capital budgeting and investment analysis. Prentice Hall. Sharpe, W. (1964). Capital asset prices: A theory of capital market equilibrium under conditions of risk. Journal of Finance, 19,
425-442. Shenoy, C., & McCarthy, K. (2008). Applied portfolio management: How University of Kansas students generate alpha to beat
the street. Wiley Finance. Shirreff, D. (2004). Dealing with financial risk. The Economist. Smith, R. L., & Kiholm-Smith, J. (2003). Entrepreneurial finance (2nd ed.). Wiley. Statman, M. (1981). Betas compared: Merrill Lynch vs. Value Line. Journal of Portfolio Management, 7(2), 41-44. Tole, T. M. (1981). How to maximize stationarity of beta. The Journal of Portfolio Management, 7(2), 45-49. Treynor, J. (1965). How to rate management of investment funds. Harvard Business Review, 43, 63-75. Turner, T. (2005). Short term trading in the new stock market. St. Martin’s Griffin. Vasicek, O. A. (1973). A note on using cross-sectional information in Bayesean estimation of security betas. The Journal of
Finance, 28(5), 1233-1239. Womack, K. L., & Zhang, Y. (2003). Understanding risk and return, the CAPM, and the Fama-French three-factor model. Tuck
Case No. 03-111. SSRN No. 481881.
A SURVEY WITH 2,500 ANSWERS
352
Appendix
Appendix 1. Mail Sent on April 2009
I am doing a survey about the betas that we, professors, use to calculate the required return to equity.
I will be very grateful to you if you kindly reply to the following two questions.
Of course, no individuals or schools will be identified and only aggregate data will be made public.
Best regards and thanks, Pablo Fernández. IESE Business School. Spain.
Two questions:
1. I use betas: YES___ NO___
2. I justify the betas I use:
- I do not justify the betas ___
- Reference to books or articles ___
Which ones?:
- Regressions ___
- Financial webs in Internet ___
- Other ___
Comments
-------------------------------------------------------------------------------------------------------------------

A SURVEY WITH 2,500 ANSWERS
353
Appendix 2. Main Results of the Survey. Details by Country
Justify the betas with: N
umbe
r of a
nsw
ers
Diff
eren
t ins
titut
ions
Use
bet
as
Do
not j
ustif
y th
e be
tas
Reg
ress
ions
Web
s and
dat
abas
es
Text
book
s or p
aper
s
Cas
es
Com
mon
sens
e,
judg
emen
t…
Oth
er
Reg
ress
ions
, web
s, da
taba
ses,
text
book
s or
pape
rs
Onl
y co
mm
on se
nse,
ju
dgem
ent…
USA 1,295 443 995 62 669 461 298 12 12 18 922 6 Spain 151 44 103 5 69 23 27 3 6 7 90 6 UK 124 52 83 4 63 34 30 0 2 11 74 0 Germany 93 47 50 2 35 15 11 0 0 5 46 0 Canada 78 31 58 4 48 23 19 0 0 4 52 0 Australia 77 22 50 3 34 19 15 0 1 6 45 1 France 62 30 47 2 38 20 20 0 0 3 43 0 Italy 60 28 40 3 29 12 14 0 0 4 35 0 Netherlands 53 11 30 0 24 10 12 0 1 5 28 1 Switzerland 34 14 19 2 4 4 7 1 0 4 15 0 India 32 22 31 2 25 13 12 0 0 2 29 0 Hong Kong 28 7 23 2 17 8 5 0 0 3 19 0 Taiwan 22 12 16 1 14 4 0 0 0 1 13 0 Norway 21 6 15 3 6 3 7 0 1 2 11 0 China 19 13 14 2 13 2 1 0 0 3 12 0 Belgium 19 6 15 1 12 9 3 0 0 4 13 0 Israel 17 6 13 2 10 5 3 0 0 3 11 0 Denmark 17 6 8 1 6 3 4 0 0 2 7 0 Finland 17 6 14 0 12 8 5 0 0 3 14 0 Singapur 16 3 15 1 11 6 4 0 0 3 14 0 New Zealand 13 6 10 0 10 4 3 0 0 2 10 0 Colombia 12 8 10 0 5 10 7 0 0 3 10 0 Austria 12 5 8 0 4 4 1 0 1 2 7 1 Portugal 12 7 11 0 9 5 3 0 0 4 11 0 Brazil 11 7 9 0 8 4 6 0 1 2 9 0 Mexico 11 6 9 0 9 8 4 0 0 3 9 0 Korea 10 8 9 1 5 2 3 0 0 5 8 0 Greece 10 7 7 1 6 0 2 0 1 1 6 0 Ireland 10 5 6 0 4 2 2 0 0 1 6 0 Argentina 9 4 9 0 7 8 5 0 0 2 9 0 Chile 9 4 8 0 6 7 3 0 0 3 8 0 Sweden 8 5 5 1 4 0 0 0 0 2 4 0 Japan 6 6 6 0 6 1 3 0 0 2 6 0 Czech Rep. 5 3 4 0 4 2 1 0 0 3 4 0 Russia 5 5 3 1 1 1 0 0 0 2 2 0 Venezuela 5 1 4 0 2 4 3 0 0 2 4 0 Other 29 countries* 54 38 34 1 24 17 12 0 0 7 33 0 Total 2,437 934 1,791 107 1,253 761 555 16 26 139 1,639 15 Note. * Other: Countries with four answers (Romania, Slovakia, South Africa, and Turkey); with three answers (Egypt, Lebanon, Peru, and Poland); with two answers (Luxembourg, Puerto Rico, Slovenia, and Un Arab Emirates) and with one answer (Cyprus, Dubai, El Salvador, Hungary, Jamaica, Kenya, Macau, Macedonia, Malaysia, Mauritius, Pakistan, Palestine, Philipines, Qatar, Singapore, Thailand, Trinidad, and Tobago).

A SURVEY WITH 2,500 ANSWERS
354
Appendix 3. Comments of Professors That Use Calculated Betas
We have to use historical data to estimate beta—therefore of necessity there is estimation error.
Professors should justify the beta information through regression analysis. Research indicates that five years’ data provide
more appropriate results. I used five years monthly closing data to justify CitiBank, Wells Fargo, and Bank of America beta and
after regression the result is very close to beta (available in Reuters).
Betas are a useful tool to compare one stock with another. However, beta has a number of weaknesses and limitations: First:
betas are based on historical data and may not be a good indication of the future. Second: There are an infinite number of ways to
calculate beta because of the choices of time period, one, three, five, 20 years…. prices (open, high, low, close), interval (daily,
weekly, monthly), and whether to use a moving average and over what period. Third: The choice of market to which your target
company is to be compared is wide (S&P 500, DJIA, Wilshire, etc.) Fourth: Applying a beta based on historical observations to
cash flow estimates of future operations invites problems. For example: changes in leverage (gearing). Using adjusted present
value calculations and adjusted betas can overcome some of these problems.
When using betas obtained from an Internet source, the same source should be used for all companies being compared to
assure the same method used to calculate each beta. A sensitivity analysis could be conducted by changing beta to determine the
effect on the cost of equity, WACC, and Net Present Value.
Indian betas vary from one year to another and from one source to another. I feel these are highly suspect.
I’ve used downside risk measures, as downside risk, tail measures, and downside risk beta.
Betas are a primitive model (like a car from before 1900) and more sophisticated models are available now.
I explain how betas are computed and I show students how to find betas already computed, and we talk about what a
particular beta means. We also discuss the fact the betas are not stable and that the CAPM assumes that the beta is the expected
beta, not the historical beta.
I use betas… but I use all metrics that are available.
Students calculate their own betas about 15-20 different ways using regression. I discuss published sources and their use. In
all cases, I point out the underlying volatility of beta depending on the specific calculation approach.
Beta use requires judgment. I demonstrate how to calculate betas and highlight the issues with time-line and independent
variable selection.
Showing regression and sensitivities to choice of time window and sampling frequency to generate both raw and adjusted
beta [i.e. Vasicek’s (1973) or Blume’s (1975) beta].
I justify the betas by computing them and proving that they are right. References are also made to financial webs.
I always emphasize that beta calculations have to be taken with some leeway.
I get students to download Thomson One Banker data and then get them to estimate betas via a single index model. Often
they are required to compare the results from different frequencies and time spans of data. Also, we get them to produce adjusted
betas (e.g., 2/3 × estimate + 1/3 × 1).
I point out that returns on beta are much flatter than predicted by the CAPM.
I discuss the issues of betas and use a robust measure from a reliable source. I make reference to high quality scholarship on
the matter. I do not confuse beta with standard deviation.
If one does not use beta then what is there?
I do not use betas for personal investing, but I teach their use with both regressions and secondary sources.
It is a simplification of reality, but a useful one.
I tell my students to use an average published beta for the stock’s systematic risk.

A SURVEY WITH 2,500 ANSWERS
355
We use the equity betas in our text, based on reference to multiple articles—beginning with Sharpe (1964) and Hamada
(1972) and going up through current research.
I usually look at a couple of sources before deciding what beta is appropriate.
I am becoming more and more skeptical of using betas and believe that the total return for an industry is just as good. I am
also investigating the “Total” beta concept. The problem with using betas is that the equity risk premium is suspect and has no
standard interpretation. I do not believe that the historical ERP from Ibbotson from 1926 is valid.
Our students calculate betas for an industry. They unlever the individual companies; calculate betas using the Fama-French
factors; test two hypotheses: that the unlevered betas are identical, and that the factors are priced; estimate the model subject to
APT restrictions; and then lever the betas for the individual firms.
It is poorly measured, but no substitution so far.
I like to show students that this is not a completely imaginary number, even though there are some good debates about it.
Hence, we pull betas off Yahoo finance.
Regressions. I do not have much confidence in beta but we do not seem to have any easy substitute.
Beta and CAPM do not work very well. Students need to know what the weaknesses are and why betas often provide
misleading results. I demonstrate how misleading betas can be using style index data going back to 1970, which shows a nearly
perfect inverse relationship between risk (beta) and return.
I use an adjusted beta (2/3 the calculated beta and 1/3 a beta of 1). This is more consistent with actual history.
I justify the betas if the published betas are “abnormal” (i.e., negative when you would expect it to be positive).
A very relevant question would be: “What is the relevant historical data in calculating the Beta?”
The key to using beta is to use multiple sources and estimates and come to a reasonable choice. No single estimate is
enough.
The most important part of required return is the error factor. Ke = Rf + Beta × (Rm - Rf) + e1 + e2 +e3 with error
representing early stage risk, sovereign risk, currency risk, etc. Applying an error factor is often more important than beta.
Sometimes, I use qualitative adjustments for betas obtained from regressions, websites, or databases.
Though beta (CAPM) is old and rough, it helps in stocks portfolio trading.
When I cannot find a similar exchange-traded company, I use US data.
The model has received a Nobel Prize in Economics and while not perfect is used extensively in practice.
There is no other viable approach and it serves a good guideline for the decision.
They are better than not using betas.
Betas are well known and relatively easy to use.
CAPM does not seem to fit Chinese data.
There are not better alternatives.
We have found useful to extend betas by using for instance the concept of “beta smile”.
Betas are historical and they are more for guidance than a total reflection of the “truth”.
Modeling the cash flows is much more important than the discount rate.
Given the lack of alternative, I find no other choice than to use Betas.
It fails to give meaningful predictions.
I normally use Value Line’s betas. I am consistent in the use of betas because other sources would differ.
I compare the required return to the required return from the bond premium model.
Using them to calculate required rates of return on common stock and retained earnings for actual companies. Remember: the
two requirements are different.
A SURVEY WITH 2,500 ANSWERS
356
We need to continue to use betas for at least three reasons: 1) still on the CFA exam, 2) the theory is still correct, only the
lack of a true market prevents the correct calculation of beta (and there is no good substitute), and 3) The need to understand the
concept of beta to hedge an equity portfolio using futures contracts.
I show in class the example of IBM when they switched from being just a mainframe computer maker to also doing a lot of
IT consulting. Their beta went up by about 0.5.
I emphasize that CAPM is mainly useful in calculating cost of capital for capital budgeting applications; not so much for
portfolio investment.
I use betas 1/3 input into required return. I justify by r-squares for their reliability.
This is a strange survey. If you do not use betas, how do you adjust for risk? Almost every practitioner book uses betas such
as the McKinsey publications. I know money managers who use betas; one calculates them using Factset and the Fama French
factors.
Barra betas seem to be the most soothing to bankers and clients, partly because no one really knows how they are calculated
and they are more expensive. The tough is that you pay a lot for them.
I justify use of betas by running my own regressions using techniques that have some support in the literature. While
GMM/EGARCH receive little use for Betas they are econometrically justified.
I use whatever is suggested in the teaching note.
I have recently used betas derived from options prices. See Christoffersen, Jacobs, and Vainberg (2006).
I use betas because they are the standard and the best we seem to have for now. But I always reference the articles that
explain the problems with beta as well.
a) I deal in middle market M&A. Buyers have an expected ROE in their mind. It does not matter where they get it. If the
buyer is a PE, then they build it up starting with what their LPs want and then adding expenses, carry, etc. b) If one is doing a
corporate M&A deal, then beta is used so the analyst or the investment banker can “defend” their valuation, “impress”
management and come across as “finance gurus”. And c) My colleagues in the valuation field do use beta. They use beta of public
companies in the same industry.
Beta is a simple method and it is used in the “real world”. It is really not so helpful, although easy to use.
I use beta in my valuations. In consulting, it is essential to fully support your estimates.
Referees want to see them as the underlying model. I need a model anyway, and these are the safe bets that referees will not
challenge.
If I am in charge of the seller, I argue a beta as low as possible: After dealing many years in academic and professional life
with cost of capital, I might summarize my experiences as follows: it does not exist any true/objective cost of capital figure. When
calculating cost of capital, there are always discretionary decisions to be made: Cost of capital is not a matter of truth/scientific
derivation. Therefore, I decided not to search for the “true” cost of capital, that is “love’s labors lost”.
Students tend so see CAPM as just one recipe from a coking book.
CAPM has problems that the academic profession has generally swept under the rug. I had to buy three estimates of industry
costs of capital to convince two of my colleagues that CAPM was incorrect.
Beta is the first order success and risk factor of any portfolio, the most important parameter for a single investors to settle in
investing.
I definitely use betas, because I have not yet found a way to avoid teaching CAPM (still looking).
Most of the time, I recommend just using a market beta of one. In class, I point out (for the benefit of economists) that betas
are elasticities. I have never seen a finance textbook that mentions this.
I teach beta to my students because Fortune 500 firms use the CAPM to estimate their cost of equity.

A SURVEY WITH 2,500 ANSWERS
357
I use the beta both in class and for some consulting work. I do not believe a particular beta estimate is justifiable, so I rely on
sensitivity analysis to show how our results change given the size of the estimation error. I actually try to put more emphasis on
the size of the estimation error than the actual estimate of the beta.
If there is better measure of systematic risk as intuitive as beta, I will be glad to use it.
I use the beta in class but with plenty of caution. I tell students “beta is dead long live beta”. The use of betas is problematic
but there is no other satisfactory tool in finance.
I assume that the required return is equal to the expected return on equity.
I use beta estimates. True betas can never be measured. I use a mix of regression from market data, web sites, and
comparable companies.
I am not a big fan of beta as a practical tool, but regulatory and corporate practice often requires it.
I do not use betas except for teaching purposes. I researched the predictability for stock returns. I found worse out of sample
predictive power for future returns using betas than when the market average return is used.
Because beta remains prevalent in the financial websites commonly used by investors (Morningstar, Yahoo Finance, etc.), it
would be a mistake not to instruct students on its use.
I point to an article I once read that Merrill Lynch at one time used a 56-factor model in their equity analysis.
I suggest students check many sources and make an informed decision. It is, after all, an art, not a science.
In light of Fama and French (1996), you even have to wonder about the use of betas, but, yes, I do make use of them. When I
assign valuation projects, I generally prescribe the cost of equity (or WACC) that students are to use in order to “take one
important variable off the table”.
Betas are a simple and useful tool for capital budgeting not predicting in future returns.
For individual stocks, betas are hard to estimate, so an estimate of 1 is perhaps as good as any other. This being said, when
the regression results seem to be accurate and stable, I would be in favour of using the beta estimate (eventually with a Blume’s
correction). For portfolios, it makes more sense to use betas as these estimates tend to be more accurate.
Most of the time, we justify use of betas through underlying theory and students get convinced. We use regression analysis to
derive the value of beta and then, also provide necessary interpretation of other statistics like R2 along with beta analysis. I found
that students are quite excited about betas.
Although not perfect, beta can be justified looking at regression of a stock’s return against market return. Some stocks have
steeper slopes than others, which imply higher risk.
When the company does not have its stocks traded, I usually look for the mean or median beta of comparable companies. In
this case, I adjust the beta of comparable companies in order to avoid a bias from different capital structures (“de-leveraging” and
“re-leveraging” the beta).
I explain the basic concept of variability to further explain beta.
Appendix 4. Comments of Professors That Use “Common Sense” 17 Betas
I use them in a general sense and I think many on the Street do as well; “high”, “low”, or “average” beta stocks. You can not
measure them accurately.
I use regression, webs, and the comments of financial analyst contacts to obtain betas. I may subjectively adjust them. For
example, I do not believe the Pepsico beta of 0.6 in Value Line. So I use a 1.0 as I believe that Pepsico’s systematic risk is = or >
the market. 17 Also named personal judgement, qualitative betas, common sense betas, intuitive betas, logical magnitude betas, and own judgement betas by different professors.

A SURVEY WITH 2,500 ANSWERS
358
Regressions (one to five years daily data). Where no information available, ad hoc betas like 0.8, 1.0, and 1.2 for below
average, average, and above average risk.
I always use 1.
My own estimation combining regression, judgement, and adjustment for specific reasons/events.
Common sense, I always emphasize that this is the most important ingredient, e.g., if a regression tells me that Marks and
Spencers has a lower beta than Tesco (note: they are both supermarkets, you should not trust the regression, and feel confident to
overrule it).
Given the instability of estimated Betas, I check the estimated beta of the company against leverage adjusted betas for
“comparables”. Also may use range of WACCs based on range of betas. However, the main impact of the uncertain estimates is to
weight heavily the results of a competitive/strategic analysis.
I first decide on a required return and then I derive a beta to justify it.
Appendix 5. Comments of Professors That do not Use Betas
I have never believed the theory, which means that one is sampling from a fixed distribution. But where does that distribution
come from?
Based on Fama and French (1996), beta is “dead”. So, I do not use it.
I do not use the betas. Weak hypothesis of normality.
I do not use beta as a measure of risk. Beta, after all, does not consider price.
The beta calculation is deductively correct. However, our belief in beta, in any shape or form, is unjustified. The whole
calculation is essentially a waste of time. As is the CAPM.
I teach CAPM in class, but I do not believe that betas are useful to determine the required return on equity. For that, you need
an estimate of the market’s future/expected return, which is as anyone’s guess as the return on equity itself, so in my opinion you
are only shifting the problem.
My method begins by an analysis of technology relationships and moves from that base into stock analysis. My method calls
for me to sell an individual stock out of a client’s account when it reaches a 40% gain.
I do not use betas when investing in individual stocks but find them useful when looking at mutual fund performance.
The use of betas is a completely arbitrary “rule” in valuation. There is nothing that exists in nature that ties betas to the
“correct” cost of equity. One’s cost of equity is a personal decision which should be based on assumed upside/downside, and
one’s tolerance for losing money (which is different from what beta defines). Valuation is an art as much as a science.
I don’t use them in anything I do, but I do teach them to people who (some) will.
I do not use beta and I do not believe in it.
I do not use betas at all since I do not believe CAPM is a reliable model.
There is no “required” return to equity. It is something that textbook authors write about, but they do that mainly because
other textbook authors write about it, and they do not know what else to write about.
Real estate investment analysis is too local and the sample set size is too small for a reliable estimated beta.
I used to use betas in quantitative research years ago, with unsatisfactory results.
I do not research using betas. My research is related to asset pricing using martingale techniques.
Beta is bull-hockey. The underlying assumptions are not realistic nor understood by most users. Moreover, most analysis
misapplies the betas—even if there was a way to compute a meaningful number. The betas do not give an indication of investment
risk. Better to approach risk from a different direction entirely.
I can not really answer this question as I believe the required return on equity is determined by a multi-factor model, not by

A SURVEY WITH 2,500 ANSWERS
359
the CAPM. As it has been argued by Campbell, Vuolteenaho, and Polk, I think the cash-flow component of beta has a much
higher price of risk than the discount-rate component.
I do not use betas because I work on non traded companies. I use valuation models derived from the CAPM.
I show why: (1) markets are inefficient (long term) because of economic externalities—government regulation, change of
managers due to retirement and death, etc., (2) betas are not stable over time, they are based on historical data which may change
marked in the future, and (3) when computing betas there is the problem of determining the frequency of the data, which can alter
your results.
CAPM does not give any information. Roll (1977) has pointed out that using CAPM (beta) is tautological to market
efficiency which means that the market value must by correct.
This is outside my domain entirely, it is like asking me about baptism or roller blading.
To calculate the cost of equity capital for the firms of one industry, I use size adjusted CAPM from Ibbotson Associates
(2008) by assuming beta = 1 for every firm.
I think in general it’s useless.
We do not calculate required returns to equity. But we calculate “expected average returns” by using long-run risk premia
(e.g. over money market) for various asset classes.
Sharpe (1964) made it clear that beta is a prospective measure and it is impossible to measure it given that expectations are
non-homogenous in real markets. I do not use betas, as they relate only to financial assets and I value enterprises as real capital.
Other models of discount rates are in use—based on the Kantorovich—Lurje optimization doctrine (SOFE). In financial
institutions, I’m mostly looking at tracking errors and not betas.
As a developer of Minsky’s “Financial Instability Hypothesis” and an honorary member of the “Econophysics” group, I
regard the whole concept of betas as delusional.
We enter the market when there is a huge drop and sit there waiting for it to rise; we get out when there is a huge rise/hype
and sit there waiting for it to drop. Betas are for academia and large financial corporations, which may not even do better than a
snake: wait and catch.
There seems no strong evidence base to refute a null hypothesis that most betas are unity.
The CAPM provides no useful information for making business decisions.
I do not have confidence using beta, because it shifts dramatically over five years’ period. Therefore, it does not help much in
the real world.
I do not use betas because they are based on the assumption that the market is perfectly efficient. Also, as a selective
contrarian investor, I do not believe that they accurately represent the risk of a stock.
Is this the result of some idiotic comment by an anonymous moron journal referee?
I teach betas only so students know what they are and how uninformed people use them but I do not use them. I discuss how
most professors and practitioners do not understand where betas come from and discuss the evidence that supports the position
that simple single factor models (like the CAPM) are inferior to multi-factor models for estimating risk adjusted returns.
Not a meaningful concept—neither stable nor are the assumptions leading to betas realistic.
I do not use betas but it does not mean that I do not advocate CAPM. I simply give a required return to equity, and tell my
students you might get this from CAPM, the three factor model, or even from your consulting firm (like Ibbotson Associates).
I use chaos theory to guide my decisions. So far I have only lost about 20% in this market and have not moved my mix since
before the decline.
The so called “cost of equity” is again a mythical academic exercise. The true cost is not what shareholders expect, but what
a company can afford to pay.
A SURVEY WITH 2,500 ANSWERS
360
I teach that if they use beta it their investment decision, it will cost them dearly. Beta is one of the most destructive ideas in
finance. It is worthless in practice.
I do not use betas because their use presumes normal distributions of returns.
I did a little check as follows: a brand new textbook written last year had a page on betas for about a dozen stocks. I thought
to check those as of today—that is within 12 months of the book being written—all of the betas were strongly different, and many
had moved from being above one to below one, or the other way around. Betas are very unstable, not reliable, and I find their use
in predictive required returns rather spurious.
The CAPM is useless.
I do not use betas, because I prefer to value equity using fundamentals rather than cross-sectional pricing (1) cross-sectional
pricing means that a stock is priced off the market, and (2) the market is just the sum of individual stock prices. And so 1) + 2): a
kind of circular logic which permits bubbles. I therefore prefer to use fundamentals like the discounted cash flows.
I view beta as a measure of the systematic risk of a stock. However, I do not believe it can explain the required return to
equity.
Individual firm betas are inherently unstable and non-stationary. Portfolio betas are known to be relatively more stable and
stationary than individual security betas. Betas are single period devices and being so, there are an infinite number of betas: one
corresponding to each possible period.
I used them many years ago. But it has become obvious that they are of limited value.
While the distinction between alphas and betas is interesting conceptually, I do not believe that their estimation is something
we should strongly rely upon in explaining equity returns. The desire to gamble and financial fads of the moment make it difficult
to expect regression analysis to uncover stable fundamentals here.
I find the whole use of betas as an acceptable proxy for risk as very unconvincing.
I do not use beta at all, nether do I like the CAMP. It simply has no practical significance.
Beta is a historical relationship, the required rate of returns calculation requires a forecast; beta does not serve this function.
We are confusing risk with uncertainty. The required rate of returns has a large uncertainty component. I do not use beta. If you
do then you get it right about the same number of times that you get it wrong—the required rate of returns.
I do not believe there is such a thing as “required” return on equity; there may be an expected return, and for that I use an
approximate beta for classes of stock, e.g., blue chip, small cap, etc.
I do not use CAPM because I think CAPM is a better model.
I have proof that standard neoclassical economics and finance is internally inconsistent.
Beta Coefficients are not used as an investment tool in the Turkish Stock Market.
Betas have more usefulness as indicators of good “options” plays. High beta stocks are much more likely to have good price
action. Low beta stocks are better candidates for writing covered calls.
I teach that the CAPM is not a very good model and is not worth the effort. Students simply use benchmark expected returns
for capital budgeting and alternative pricing models like Fama and French (1996) for investments.
I do not use betas for explanation purposes because of statistical and estimation error. I do believe that betas are OK for
forecast purposes like ranking stocks on future risk but that there are better measures for that purpose.
Since market turnover is slow, betas are not a real issue in real estate. Even with REITs we look at longer term results.
The students had a case due on LSB Industries. Yahoo Finance reported that LSB had a beta of -0.24. Why it does not giving
us a reasonable number? Beta is not a precise estimate, but almost everyone reports a point estimate. That point estimate gives the
impression of “truth” when in fact the estimate may not be very good at all. The 95 percent confidence interval for LSB’s beta in
2001 was -2 to 1.6. That’s a huge range. Such a wide interval means that any estimate of beta is meaningless for LSB and should

A SURVEY WITH 2,500 ANSWERS
361
not be used. Still, because it is published, students and most others don’t question whether it’s a good estimate or not.
When you estimate beta, you have to decide how many years, months, or days to use. You also have to decide whether to use
daily, weekly, or monthly returns. Finally, you have to decide which market index to use: NASDAQ, S&P 500. Depending on
your choice, you can get very different point and interval estimates.
The beta’s confidence interval is enormous which turns any decision based on it in an astrological prediction.
I do not use betas at all in my research, as I am more using queuing theory and occasionally simulation.