Embed Size (px)
Citation preview

4-3-2-1 and Less
Optimising Drug regimens in HIV
Anton Pozniak MD FRCP

Why optimise dosing?
• Less cost
• Less drug to be manufactured and stored
• Less chance of side effects
• Less pills

4

4
What about 4 Drug Therapy in ART Naive

REALITY
Design
Objective– Primary endpoint: 24-week mortality
2 NRTI + NNRTI + 12 weeks of RAL
2 NRTI + NNRTI
Adults, adolescents and children > 5 years
ARV-naïveCD4 < 100/mm3
Two other factorial randomisations: 12 weeks enhanced prophylaxis, 12 weeks supplementary food
REALITY Study: raltegravir-intensified quadruple therapy in first-line antiretroviral therapy
Randomisation1 : 1
Open label
N = 903
N = 902
W48
Kityo C. AIDS 2016, Durban, Abs. FRAB0102LB

REALITY Kityo C. AIDS 2016, Durban, Abs. FRAB0102LB
REALITY Study: raltegravir-intensified quadruple therapy in first-line antiretroviral therapy
Mortality HIV RNA < 50 copies/mL (95% CI)
902 825 801 786 775 766 657
903 830 801 789 776 760 669
10.2%
13.0%
10.9%12.4%
0
5
10
15
20
N at risk
0 8 16 24 32 40 48Weeks
0
20
40
60
80
100
0 4 12 24 48Weeks
14.5%
54.6%
76.0%79.5%
42.8%
74.1% 77.2%82.9%
%%
Mean change in CD4/mm3 at W48:
+ 163 vs + 148 (p = 0.04)
W24: HR =1.09
(95% CI: 0.82-1.46) ; p = 0.54
Additional RAL Standard ART

3

3 Drug therapy is Standard of Care in ART Naive
Regimen EACS IAS-USA DHHS
RPV/TDF/FTCRecommended
or use TAFAlternative Alternative
DRV/r or/ c + TDF/FTC
Recommendedor use TAF
Alternative Recommended or
use TAF
ATV/r + TDF/FTC Alternative Alternative Alternative
EVG/c +TDF/FTCRecommended
or use TAFRecommended*
Use TAFRecommended or
use TAF
RAL + TDF/FTCRecommended
or use TAFRecommended*
Use TAFRecommended or
use TAF
DTG + TDF/3TCRecommended
or use TAFRecommended*
Use TAFRecommended or
use TAF
DTG + ABC/3TC Recommended Recommended Recommended
DHHS ART Guidelines. July 2016. Günthard HF, et al. JAMA. 2016;316:191-210.
EACS ART Guidelines. October 2016.

2

10
What about the Efficacy of Dual
versus Triple therapy – randomised
studies

Dual versus Triple therapy –randomised studies
Nuke limiting Strategies

Analysing the efficacy of 2-drug versus 3-drug treatments
PI/r + raltegravirPI/r + maravirocPI/r + NRTI (mainly 3TC)DTG + 3TCDTG + RPVCTV + RPV
7 randomised trials of PI/r + RAL versus PI/r + 2NRTIsHIV RNA <50 copies/mL (switch = failure endpoint)
Overall, in 7 randomised trials of 1266 patients, PI/r + raltegravir showed HIV RNA suppressionrates 10% lower than PI/r + 2NRTIs (p=0.008).
However there was evidence for heterogeneity between the trials (p=0.03).
Favours 3-drug treatment
Favours 2-drug treatment

Has PI/r plus integrase a role in Treatment experience ?
In treatment-experienced patients, RAL+LPV/r was non-inferior to 2NRTI+LPV/r
No efficacy advantage
No significant difference in number of Grade 3 or 4 adverse events
Costs of RAL+LPV/r significantly higher than 2NRTI+LPV/r in most countries
EARNEST and SECOND-LINE studies
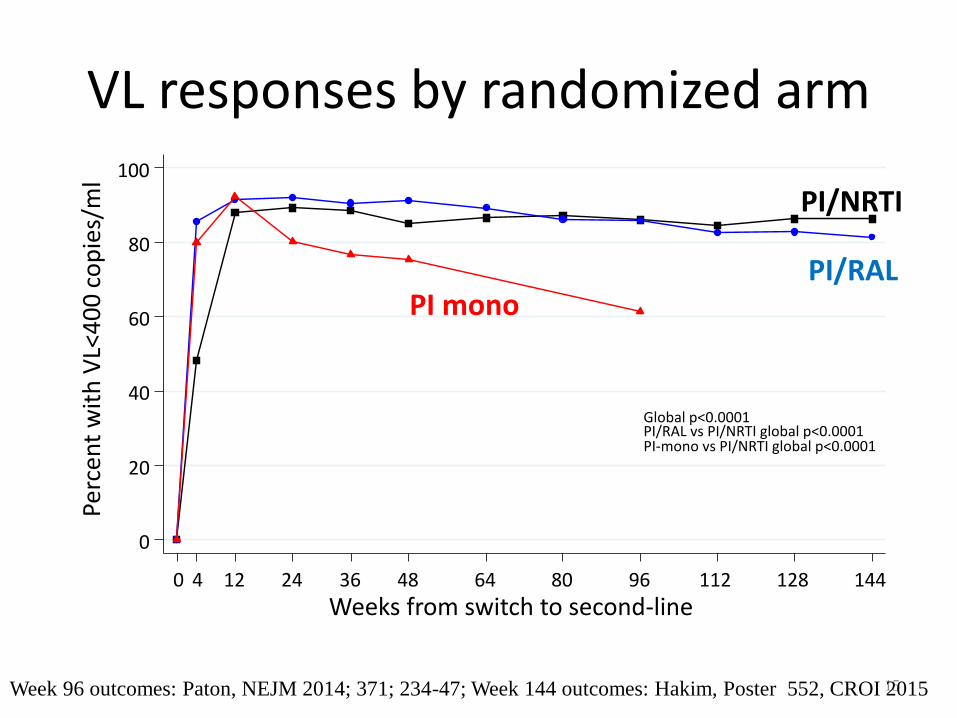
VL responses by randomized arm
15Week 96 outcomes: Paton, NEJM 2014; 371; 234-47; Week 144 outcomes: Hakim, Poster 552, CROI 2015
0
20
40
60
80
100
Perc
ent
wit
h V
L<4
00
co
pie
s/m
l
0 4 12 24 36 48 64 80 96 112 128 144
Weeks from switch to second-line
PI/NRTI
PI/RALPI mono
Global p<0.0001 PI/RAL vs PI/NRTI global p<0.0001 PI-mono vs PI/NRTI global p<0.0001

3 randomised trials of PI/r + maraviroc versus PI/r + 2NRTIsHIV RNA <50 copies/mL (switch = failure endpoint)
Overall, in 3 randomised trials of 967 patients, PI/r + maraviroc
showed HIV RNA suppression rates 4% lower than PI/r + 2NRTIs.
This difference was outside the limits for non-inferiority
(lower 95% confidence interval -15%)
There was evidence for heterogeneity between the trials (p=0.04).
Favours
3-drug
treatment
Favours
2-drug
treatment

MARCH Pett SL. Clin Infect Dis 2016;63:122-32
PI plus MVC MARCH Study: switch to MVC
% with virologic response (HIV RNA < 200 c/mL), by week
Hazard ratio for loss of virological response < 200 c/mL over 48 weeks: 2.41 (95% CI: 1.31-4.43 ; p = 0.005) for the MVC + PI/r arm vs control arm
2 NRTI + MVC2 NRTI + PI/r PI/r + MVC
0.00
1.00
0.25
0.50
0.75
0 12 24 36 48 60 72 84 96
82
156
157
Number at risk
81
149
151
80
143
137
80
139
134
77
132
123
59
103
98
45
90
65
36
86
54
17
60
36
2 NRTI + PI/r
2 NRTI + MVC
PI/r + MVC
Week
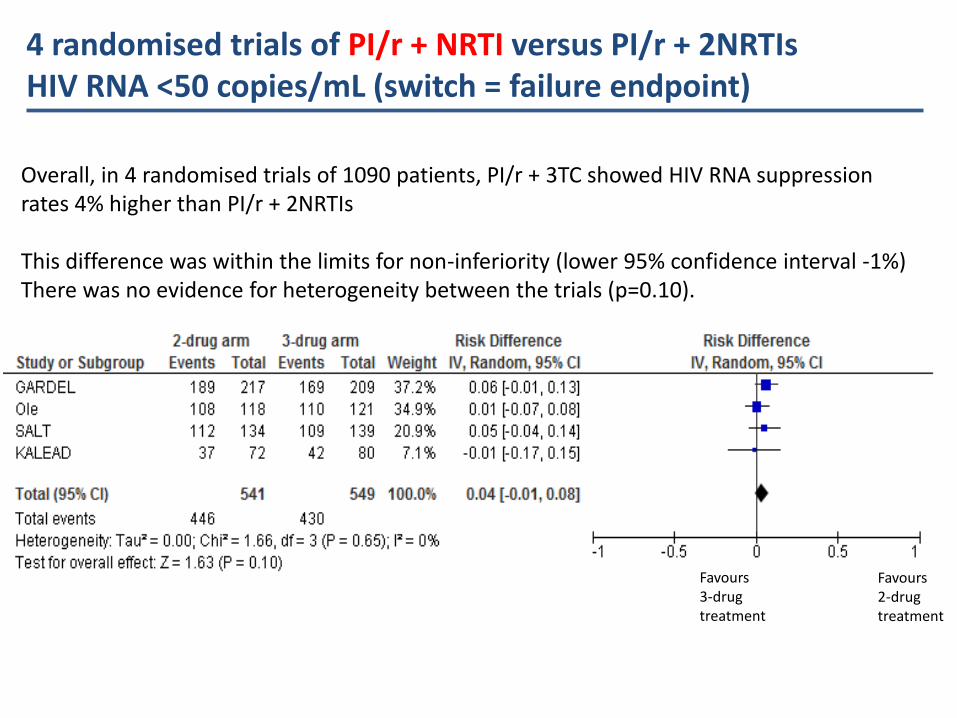
4 randomised trials of PI/r + NRTI versus PI/r + 2NRTIsHIV RNA <50 copies/mL (switch = failure endpoint)
Overall, in 4 randomised trials of 1090 patients, PI/r + 3TC showed HIV RNA suppressionrates 4% higher than PI/r + 2NRTIs
This difference was within the limits for non-inferiority (lower 95% confidence interval -1%) There was no evidence for heterogeneity between the trials (p=0.10).
Favours 3-drug treatment
Favours 2-drug treatment

2 Drugs in Naïve GARDEL: Dual ART With LPV/RTV + 3TC vs Triple ART
With LPV/RTV + 2 NRTIs
● Randomized, open-label phase III noninferiority trial
– Primary endpoint: HIV-1 RNA < 50 c/mL (ITT-e, FDA snapshot analysis)
● Pts with virologic response at Wk 48 offered extension to Wk 96
ART-naive pats with HIV-1 RNA > 1000 copies/mL;
no NRTI/PI resistance; HBsAg negative(N = 426)
Lopinavir/Ritonavir 400/100 mg BID +Lamivudine 150 mg BID
(n = 217)
Lopinavir/Ritonavir 400/100 mg BID +Investigator-Selected NRTIs in FDC*
(n = 209)
Wk 48primary analysis
Stratified by HIV-1 RNA (≤ vs > 100,000 c/mL)
Wk 24interim analysis
Cahn P, et al. EACS 2015. Abstract 961.
*ZDV/3TC: 54%; TDF/FTC: 37%; ABC/3TC: 9%
Wk 96 extension analysis
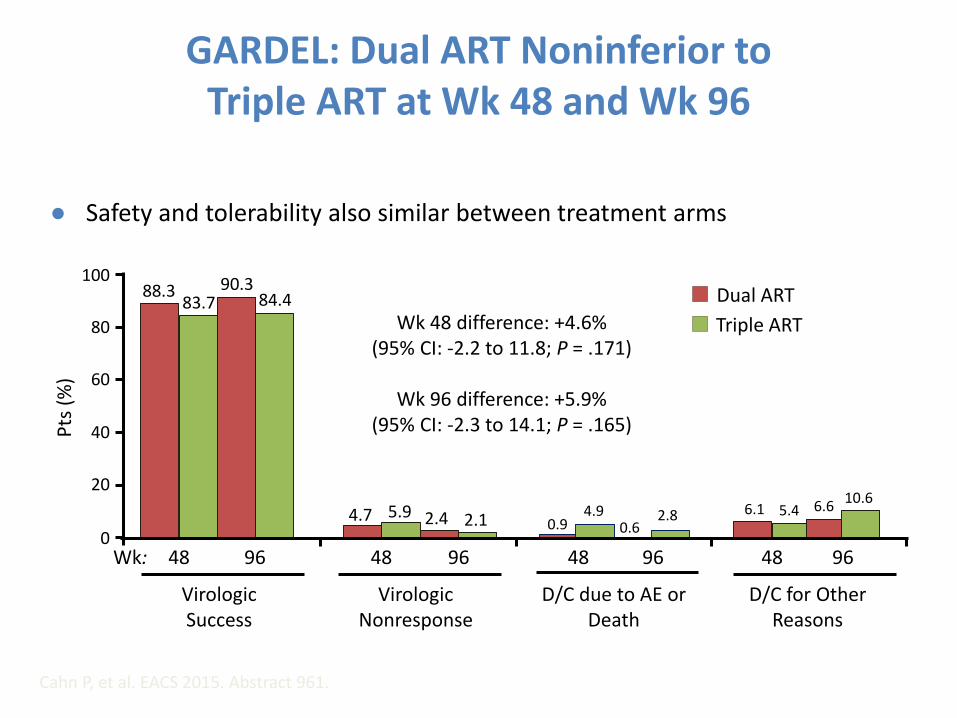
GARDEL: Dual ART Noninferior to Triple ART at Wk 48 and Wk 96
● Safety and tolerability also similar between treatment arms
Virologic Success
Virologic Nonresponse
D/C due to AE or Death
D/C for Other Reasons
Cahn P, et al. EACS 2015. Abstract 961.
Wk 48 difference: +4.6% (95% CI: -2.2 to 11.8; P = .171)
Wk 96 difference: +5.9% (95% CI: -2.3 to 14.1; P = .165)
100
80
60
40
20
0
Pts
(%
)
Dual ART
Triple ART
4.7 5.90.9
4.9 6.1 5.42.4 2.1 0.62.8
6.610.6
88.383.7
90.384.4
Wk: 9648 9648 9648 9648

Open-label, single-arm phase IV exploratory trial
– Primary endpoint: HIV-1 RNA < 50 copies/mL at Wk 48 (ITT-e, FDA snapshot analysis)
Lets treat an Integrase like a boosted PI!PADDLE: Dolutegravir + Lamivudine in Treatment-
Naive Pts
Figueroa MI, et al. EACS 2015. Abstract 1066.
Treatment-naive pts with HIV-1 RNA
5000-100,000 copies/mL; CD4+ cell count
≥ 200 cells/mm3;HBsAg negative
(N = 20)
Second Cohort
DTG 50 mg QD +Lamivudine 300 mg QD
(n = 10)
Dolutegravir 50 mg QD +Lamivudine 300 mg QD
(n = 10)
First Cohort
Second cohort to be enrolled following confirmation of
first cohort success at Wk 8

PADDLE Study: Efficacy-DTG and 3TC in Naïve patients
# SCR BSL DAY 4 DAY 7 W.2 W.3 W.4 W.6 W.8 W.12 W.24 W.36 W.48
1 5.584 10.909 383 101 <50 <50 <50 <50 <50 <50 <50 <50 <50
2 8.887 10.233 318 <50 <50 <50 <50 <50 <50 <50 <50 <50 <50
3 67.335 151.569 1.565 1.178 97 53 <50 <50 <50 <50 <50 <50 <50
4 99.291 148.370 3.303 432 178 55 <50 <50 <50 <50 <50 <50 <50
5 34.362 20.544 1.292 570 107 <50 <50 <50 <50 <50 <50 <50 <50
6 16.024 14.499 1.634 162 <50 <50 <50 <50 <50 <50 <50 <50 <50
7 37.604 18.597 819 61 <50 <50 <50 <50 <50 <50 <50 <50 <50
8 25.071 24.368 1.377 Not done 105 <50 <50 <50 <50 <50 <50 <50 <50
9 14.707 10.832 516 202 <50 <50 <50 <50 <50 <50 <50 SAE
10 10.679 7.987 318 <50 <50 <50 <50 <50 <50 <50 <50 <50 <50
11 50.089 273.676 68.129 3.880 784 290 288 147 <50 <50 <50 <50 <50
12 13.508 64.103 3.296 135 351 84 67 <50 <50 <50 <50 <50 <50
13 28.093 33.829 26.343 539 61 <50 <50 <50 <50 <50 <50 <50 <50
14 15.348 15.151 791 198 <50 61 64 <50 <50 <50 <50 <50 <50
15 23.185 23.500 4.217 192 <50 <50 <50 Not done <50 <50 <50 <50 <50
16 11.377 3.910 97 143 <50 <50 <50 <50 <50 <50 <50 <50 <50
17 39.100 25.828 1.970 460 52 <50 <50 <50 <50 <50 <50 <50 <50
18 60.771 73.069 2.174 692 156 <50 <50 <50 <50 <50 <50 <50 <50
19 82.803 106.320 2.902 897 168 76 <50 <50 <50 <50 <50 PDVF
20 5.190 7.368 147 56 <50 <50 <50 <50 <50 <50 <50 <50 <50
Cahn P, et al. AIDS 2016; Durban, South Africa; July 18-22, 2016; Abst. FARB0104LB.
SAE = serious adverse event PDVF = protocol defined virologic failure

0
25
50
75
100
DTG+3TC
% <
50
Week 4
0
• 110 Subjects
• No Hx of failure, No Hep B
• 8 week Switch to 2NRTI+DTG
• Then to DTG/3TC-40 Weeks FU
• 97% (101/104) pts maintained therapeutic success through 40 wks of dual therapy (study Wk 48)[1]
– No INSTI resistance in 3 pts with virologic failure
– 7 pts with serious AEs, only 2 related to dual therapy
ANRS 167 LamiDol Study DTG/3TC Maintenance
Joly V, et al. 24th CROI; Seattle, WA; February 13-16, 2017. Abst. 458.

Switch to 2 drugs -do we need nukes?

SWORD 1 & 2: Switch From Suppressive ART to DTG + RPV Dual Therapy
• Randomized, open-label, multicenter phase III trials– Primary endpoint: HIV-1 RNA < 50 copies/mL at Wk 48 (ITT-E snapshot
• 70% to 73% of pts receiving TDF at baseline
Llibre JM, et al. CROI 2017. Abstract 44LB.
Switch to DTG + RPV(n = 513)
Continue Baseline ART
(n = 511)
HIV-infected pts withHIV-1 RNA < 50 c/mL
for ≥ 12 mos while receiving first-line or second-line ART with
2 NRTIs + INSTI, NNRTI, or PI; no
previous VF; HBV negative
(N = 1024)
Wk 52 Wk 148
Switch to DTG + RPV
Continue DTG + RPV
DTG + RPV

Switch From Suppressive ART to DTG + RPV Noninferior to Continued Baseline ART at Wk 48
• 1 pt with confirmed criteria for virologic withdrawal at Wk 36 in DTG + RPV arm had K101K/E (1.2-fold RPV change)
– Resuppressed with continued DTG + RPV
– No INSTI resistance
• AE rates generally similar between treatment arms through Wk 52
– Numerically higher rate of drug-related grade 1/2 AEs with switch: 17% vs 2%
– Numerically higher rate of withdrawal for AEs with switch: 4% vs < 1%
Llibre JM, et al. CROI 2017. Abstract 44LB.
Virologic Nonresponse
Wk 48
HIV-1 RNA< 50 c/mL
No Data
100
80
60
40
20
0
Pts
(%
)
95 95
< 1 15 4
Treatment difference: -0.2% (95% CI: -3.0% to 2.5%)
DTG + RPV (n = 513)Baseline ART (n = 511)

Switch to DTG + RPV in Suppressed Pts
With Multiple Previous Treatment Failures
Open-label cohort study based in clinical practice setting (N = 38)
– DTG 50 mg/day + RPV 25 mg/day for pts with long-term virologic suppression but virologic failure on > 1 previous ART regimens
HIV-1 RNA suppressed to < 35 copies/mL in 92% (35/38) at Wk 48
– No virologic failures; 3 pts d/c (GI toxicity, DDI, physician decision, n = 1)
DTG + RPV associated with improved liver function tests, improved lipid profile, and stable kidney function at Wk 48
Díaz A, et al. AIDS 2016. Abstract TUPDB0106.
Baseline Characteristic , % Switch to DTG + RPV (N = 38)
Regimen at time of switch NRTI + NNRTI + PI
NRTI + NNRTI + PI + INSTI
85
53
Reasons for switch to DTG + RPV Drug–drug interaction
Toxicity
Simplification
38
33
25
Pre-existing resistance mutations NRTI: 65; NNRTI: 37; PI: 32; INSTI: NA

Induction period
Switch to Long acting Injectables
LATTE-2
Week 32
Primary analysis
Dosing regimen
selection
Day 1
Randomization
2:2:1
Week 48
Analysis
Dosing regimen
confirmation
CAB 400 mg IM + RPV 600 mg IM Q4W (n=115)
CAB 600 mg IM + RPV 900 mg IM Q8W (n=115)
Week 96b
CAB loading dose at Day 1
CAB loading doses at Day 1 and Week 4
CAB 30 mg +
ABC/3TC for
20 weeks
CAB 30 mg + ABC/3TC PO QD (n=56)
Maintenance perioda
Add RPV
PO QD
4 weeks
Margolis et al. AIDS 2016; Durban, South Africa. Abstract THAB0206LB.
ABC/3TC, abacavir/lamivudine; ALT, alanine aminotransferase; IM, intramuscular; PO, orally; QD, once daily; Q4W, every 4 weeks;
Q8W, every 8 weeks; ULN, upper limit of normal. aSubjects who withdrew after at least 1 IM dose entered the long-term follow-up period. bSubjects can elect to enter Q4W and Q8W LA Extension Phase beyond Week 96.

HIV-1 RNA <50 c/mL at Week 48: ITT-ME (Snapshot)
Margolis et al. AIDS 2016; Durban, South Africa. Abstract THAB0206LB.
aMet prespecified threshold for concluding IM regimen is comparable to oral regimen (Bayesian Posterior Probability >90% that true IM response rate is no worse than -10% compared to the oral regimen). Observed Bayesian Probabilities: Q8W vs Oral = 99.7%; Q4W vs Oral = 99.4%.
Both Q8W and Q4W comparable to Oral CAB at Week 48a

• NNRTI—K103N, E138G, and K238T (FC RPV=3.3; Etravirine=1.9); INI—Q148R (FC CAB=5.1; Dolutegravir=1.38)c
• No additional PDVFs beyond W48 on any arm (all subjects through W72)d
Protocol-Defined Virologic Failure (PDVF)
Margolis et al. AIDS 2016; Durban, South Africa. Abstract THAB0206LB.
Maintenance periodaQ8W IM (n=115)
Q4W IM(n=115)
Oral CAB(n=56)
Subjects with PDVF 2 (1%)b 0 1 (2%)
INI-r mutations 1c 0 0
NRTI-r mutations 0 0 0
NNRTI-r mutations 1c 0 0
PDVF: <1.0 log10 c/mL decrease in plasma HIV-1 RNA by Week 4, OR confirmed HIV-1 RNA ≥200 c/mL after prior
suppression to <200 c/mL, OR >0.5 log10 c/mL increase from nadir HIV-1 RNA value ≥200 c/mL. aOne additional PDVF
without treatment-emergent resistance occurred during oral Induction Period due to oral medication non-adherence. bOne
PDVF at Week 4: no detectable RPV at Week 4 and Week 8, suggesting maladministration. cOne PDVF at Week 48 at HIV-
1 RNA 463 c/mL (confirmed at 205 c/mL). dContains data beyond W48.

2 drugs Health Warning!
Not in Hepatitis B co-infected? Pregnancy?TB

1
PI monotherapy

Proportion of subjects with HIV-1 RNA<50copies/mL by Week 144
MONET: Switch to DRV/RTV vs DRV/RTV + 2 NRTIs
Primary endpoint: HIV-1 RNA<50 copies/mL
* Intent to treat (ITT), TLOVR, switch = failure method; † strict ITT analysis (switches not considered failures)
DRV, darunavir; ITT, intent–to-treat; NRTI, nucleoside reverse transcriptase inhibitors; RTV, ritonavirArribas et al, HIV Medicine 2012;13:398–405
For patients with HIV RNA < 50 mL/min at baseline, switching to DRV/RTV monotherapy did not show noninferior efficacy to DRV/RTV plus two NRTIs in an ITT/TLOVR analysis, but not in a strict ITT analysis (switches not considered failures)
75.0%82.0%
69.0%
83.0%
0%
10%
20%
30%
40%
50%
60%
70%
80%
90%
100%
DRV/r +
2NRTI
DRV/r
mono
DRV/r +
2NRTI
DRV/r
mono
Pro
po
rtio
n o
f H
IV-p
osi
tive
ind
ivid
ual
s (%
)
HIV RNA<50 copies/mL*
97/129 88/127 106/127
HIV RNA<50 copies/mL†
n/N 106/129
DRV/RTV +2 NRTIs
DRV/RTVmono
DRV/RTV +2 NRTIs
DRV/RTVmono

Pro
po
rti
on
(%
)
Proportion of subjects in ITT population with HIV-1 RNA<50copies/mL by Week 48
nTotal
118137
129136
PROTEA: Switch to DRV/RTV or DRV/RTV + 2 N(t)RTIs
Primary endpoint: HIV-1 RNA<50 copies/mL
CI, confidence interval; DRV, darunavir; ITT, intent–to-treat; N(t)RTI, nucleo(t)side reverse transcriptase inhibitor; PI, protease inhibitor; RTV, ritonavirAntinori A et al. HIV12 2014; Glasgow, Scotland. #O423A
Switching to DRV/RTV monotherapy showed lower efficacy vs triple antiretroviral therapy at Week 48 in the primary switch equals failure analysis (difference -8.8%, 95% CI: –15.5 to –1.8)
There was no evidence of PI resistance

PI Monotherapy- predictors of response
Ripamonti et al CROI 2015 poster 551

INSTI monotherapy

001/IHQ/16-08//1496i October 2016
Methods DOMONO
Randomized open label multicenter
Dolutegravir monotherapy 50 mg for 48 weeks with or without a meal
If HIV-RNA becomes detectable (any level >20c/ml) the patient is instructed to take DTG with a meal
Key inclusion:
- HIV-RNA < 1,0E5
- CD4-nadir ≥ 200
- HIV-RNA <50 ≥24w
- Never failed
- No resistance
- HBV immune
- >95% estimated
compliance
W4 8 12 18 24 36 W48
Wijting I et al, HIV Glasgow 2016
Results secondary endpoint 1: Week 24 <50 c/ml DTG monotherapy versus cART
DTG n=46/50 (92%)
cART n=53/53 (100%) } p=0.052
Delta 8% (95% C.I. -1% to +19%) (*)

Emergent INSTI Resistance After Switch to DTG Monotherapy
• International, multicenter retrospective study
– Evaluated virologically suppressed pts switched to DTG 50 mg QD monotherapy
– Pts with history of VF on INSTI and INSTI resistance excluded
• 11 of 122 pts switched to DTG monotherapy experienced VF
– 9 of 11 had genotypic INSTI resistance at VF
• INSTI resistance pathways varied
Blanco JL, et al. CROI 2017. Abstract 42.
INSTI Resistance
at VF
92Q/155H (n = 1)
97A/155H (n = 1)
155H/148R (n = 1)
118R (n = 2)
148K (n = 1)
148H (n = 2)
148R (n = 1)

LESS

Lower doses

Can we Save EFV?Dose Reduction of EFV
ENCORE1: 400-mg EFV non-inferior to 600-mg EFV With TDF/FTC for Initial ART
● Randomized, double-blind, placebo-controlled, non-inferiority phase III trial– Part of ongoing effort to identify ARVs effective at lower doses (and cost)
● No significant difference in SAEs between treatment arms
● More pts with study drug-related AEs for EFV 600 mg vs EFV 400 mg (47.2% vs 36.8%; p=0.008)
● More pts discontinued EFV 600 mg due to AE vs EFV 400 mg (1.9% vs 5.8%; p=0.010)
Puls, R et al. IAS 2013. Abstract WELBB01
EFV 400 mg + placebo +
TDF/FTC 300/200 mg
(n = 324)
EFV 600 mg +TDF/FTC 300/200 mg
(n = 312)
ART-naive pts,
CD4+ 50-500 cells/mm3,
HIV-1 RNA > 1000 copies/mL
(n=636)
Week 48Stratified by clinical site and
HIV-1 RNA at screening
(< 100,000 or ≥ 100,000 copies/mL)
*EFV administered as 200-mg tablets.
HIV-1 RNA < 200 c/mL
at Week 48 (%)
NC=F
90.0
85.8

PI dose optimisation
Atazanavir/r: 200/100 mg OD dose?
Darunavir/r: 400/100 OD dose?
Cobicistat as alternative to ritonavir?

LASA trial:Maintenance trial, primary analysis
at Week 48
Patients enrolled in Thailand. (HIV RNA suppression endpoint)
ATV/r 200/100 mg
OD
+ 2NRTIs
n=280
ATV/r 300/100 mg
OD
+2NRTIs
n=280
HIV RNA <50 on ART
n=560
<50 copies/mL were: 93.4% vs 91.7% (95% CI: 1.71, -2.67 to 6.09).

DRV/r: can we switch to a 400/100 OD dose?
• Approved dose is 600/100 mg BID for PI pre-treated patients,
800/100 OD for PI naïve patients
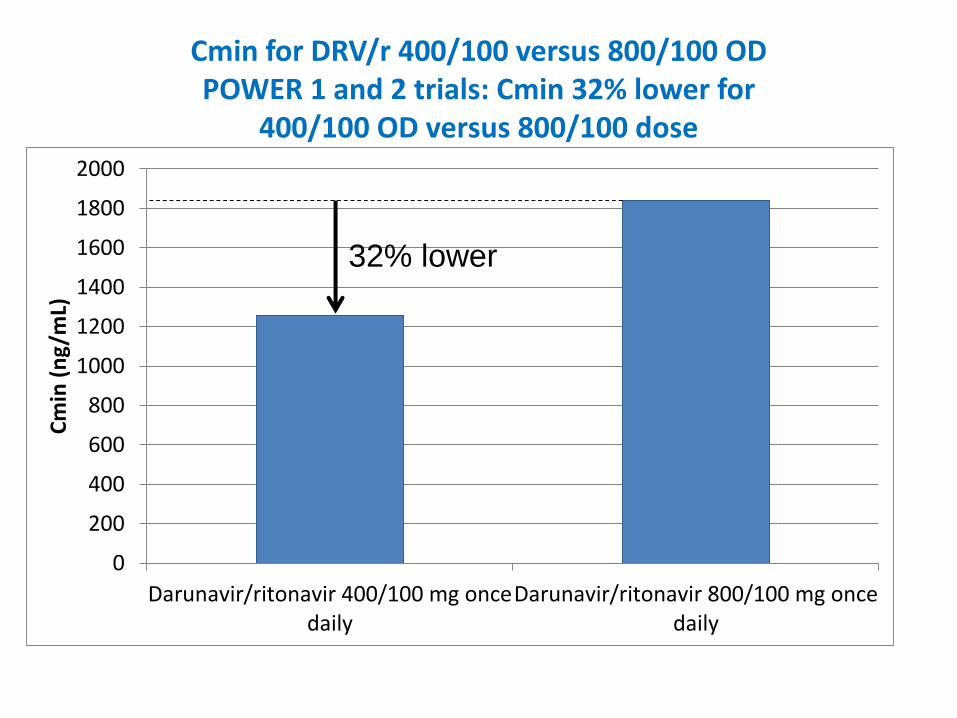
Cmin for DRV/r 400/100 versus 800/100 OD POWER 1 and 2 trials: Cmin 32% lower for
400/100 OD versus 800/100 dose
0
200
400
600
800
1000
1200
1400
1600
1800
2000
Darunavir/ritonavir 400/100 mg oncedaily
Darunavir/ritonavir 800/100 mg oncedaily
Cm
in (
ng/
mL)
32% lower
Sekar et al, EACS, CROI 2006 [abstr J121]

POWER trials: %HIV RNA >1 log reduction at Week 24, by dose and baseline DRV resistance
Katlama C et al AIDS 2007, 21: 395-402
Haubrich et al AIDS 2007, 21: F11-F18
0
10
20
30
40
50
60
70
80
90
100
1 2 3 4
0
10
20
30
40
50
60
70
80
90
100
1 2 3 4
DRV FC <4 (sensitive) DRV FC >4 (resistant)
400/100 800/100 400/100 600/100
OD OD BID BID
400/100 800/100 400/100 600/100
OD OD BID BID
DRV/r dose group DRV/r dose group

94 95
88
84
0
20
40
60
80
100
1 2 3 4
TITAN trial: HIV RNA <50 copies/mL at Week 48, Treatment experienced, PI sensitive patients,
DRV/r 600/100 mg BID +2NRTIs, by DRV Cmin
Quartile of DRV Cmin
HIV
RNA
<50
c/mL
(%)
Week
48
Sekar et al, EACS, Madrid 2007 [abstr P4.1/10]
p=0.047, inverse correlation

ODIN trial – safety results to Week 48DRV/r 800/100 OD versus 600/100 BID
___________________________________________________________________
Safety parameter 800/100 OD 600/100 BID
n=294 n=296 p value
___________________________________________________________________
≥1 Grade 3 or 4 AE 23 (8%) 45 (15%) p<0.05
D/C for adverse events 10 (3%) 14 (5%) n.s.
Triglycerides ≥500mg/dL 15 (5%) 31 (11%) p<0.05
Total cholesterol ≥240mg/dL 29 (10%) 58 (21%) p<0.05
LDL cholesterol ≥160mg/dL 28 (10%) 47 (17%) p<0.05
___________________________________________________________________
No other significant differences in lab parameters or individual clinical adverse events
Cahn et al. AIDS 2011, 25:929-939

Study endpoints– The proportion of patients with HIV-1 RNA <50 c/mL at w48 (ITT).
Non inferiority if lower limit of the 95% CI for d < -15%, 80% power
– Changes in CD4+ T cell count
– Changes in DRV Ctrough in plasma
– The proportion of patients with AEs during follow-up
– The economic cost derived from ARV drugs
DRV/r 800/100 mg QD+ 2 NRTIs
DRV/r 600/100 mg QD+ 2 NRTIs
Randomisation1 : 1
Open-label
100 HIV+ adultsOn 2 NRTIs + DRV 800mg qd > 4 weeks
HIV-1 RNA < 50 c/mL > 3 monthsNo history of prior virologic failure to
PI-based ARTN = 50
N = 50
W48
DRV600. Study Design

DRV600. Results at w48
0
20
40
60
80
100
% H
IV-1
RN
A <
50 c
p/m
L
ITT Observed data
DRV800 DRV600
94%90%
96% 94%
Non inferiority of DRV/r 600/100 mg QD
0-15%
ITT
Observed
data
50 50 49 48
95% CI for the difference
ITT -4.0 (-12.9; 4.9)
Observed data -2,2 (-9.6; 5.2)

Similar to Cobi?
DRV/r 400/100 OD versus DRV/c 800/150 OD
1840
1258
1870
1330
1540
1224
0
200
400
600
800
1000
1200
1400
1600
1800
2000
DRV/r800/100
DRV/r400/100
DRV/r800/100
DRV/c800/150
DRV/c800/150
DRV/r800/100
POWER trials Mathias 2010 Kakuda 2014

Conclusion
1. No clinical advantage of 4 drugs-even in low CD4 and high VL.
2. Need RT inhibitors plus high barrier to resistance in 2 drug Rx
3. Dual therapy Regimen in naïve or switch-some data evolving
4. Monotherapy is a niche area but only with boosted Pis not
InSTIs
5. Stay with the data use triple therapy and wait for trials to
report.
6. Low dose EFV approved by the FDA
7. ? move to low dose DRV