Embed Size (px)
Citation preview

4-1
Any Questions
V
4-2
Analysis of Financial
Statements
Welcome Back! No TVM…..I promise!
Green = Balance Sheet Blue = Income Statement
4-3
Excellent PPT in Book
One ratio at a time
4-4
For every dollar of ….…
Important Concept
4-5
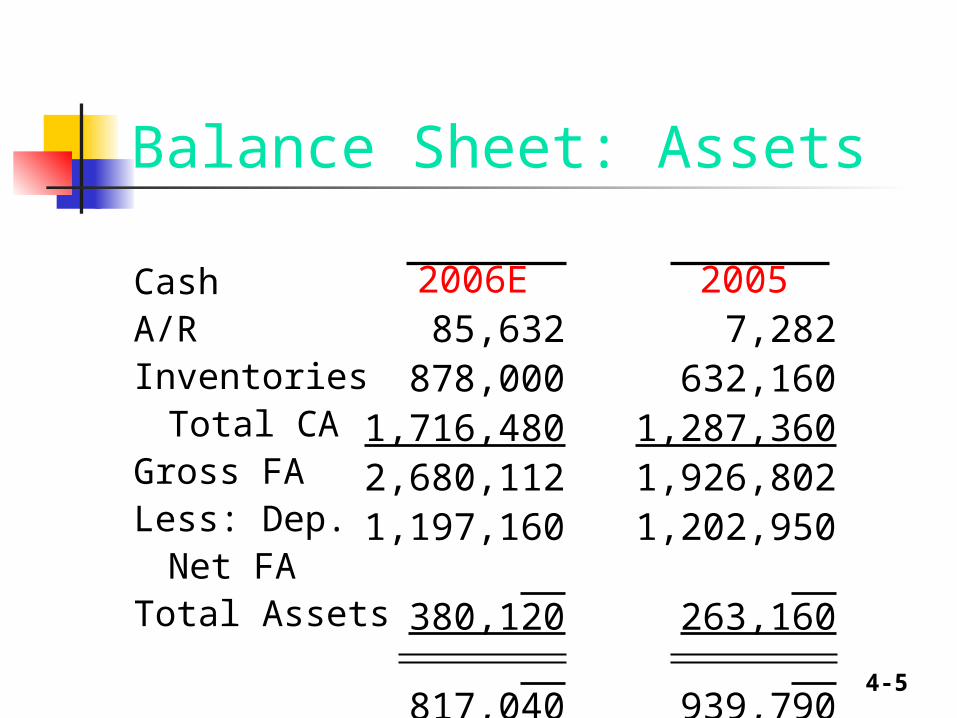
Balance Sheet: Assets
CashA/RInventories
Total CAGross FALess: Dep.
Net FATotal Assets
20057,282
632,1601,287,3601,926,8021,202,950 263,160 939,7902,866,592
2006E85,632
878,0001,716,4802,680,1121,197,160 380,120 817,0403,497,152
4-6
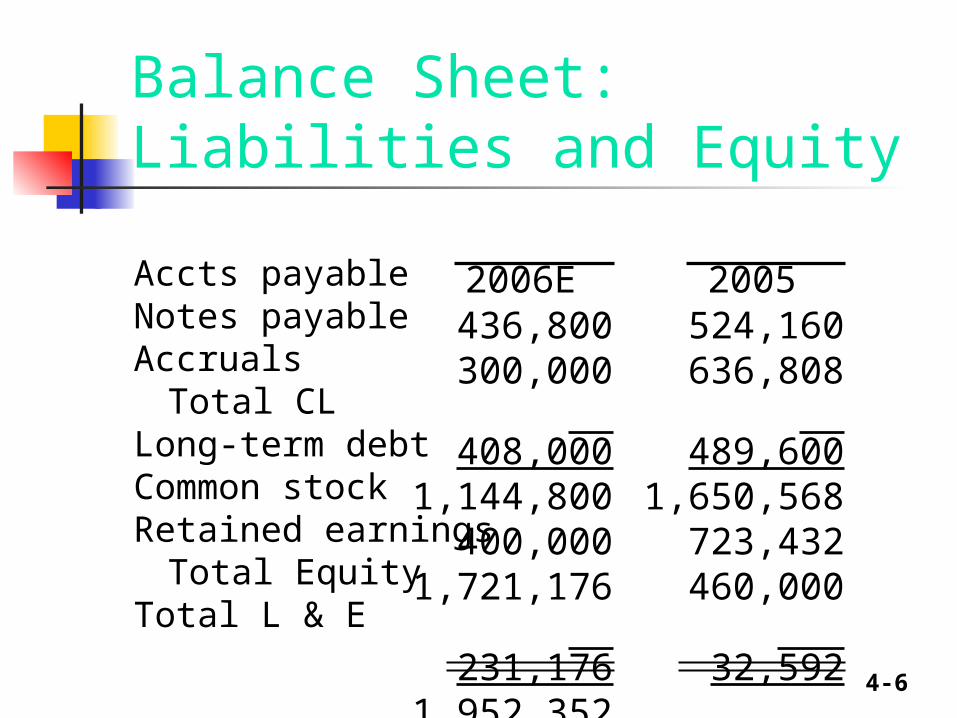
Balance Sheet: Liabilities and Equity
Accts payableNotes payableAccruals
Total CLLong-term debtCommon stockRetained earnings
Total EquityTotal L & E
2005524,160
636,808 489,6001,650,568
723,432460,000
32,592 492,5922,866,592
2006E436,800
300,000 408,0001,144,800
400,0001,721,176 231,1761,952,3523,497,152
4-7
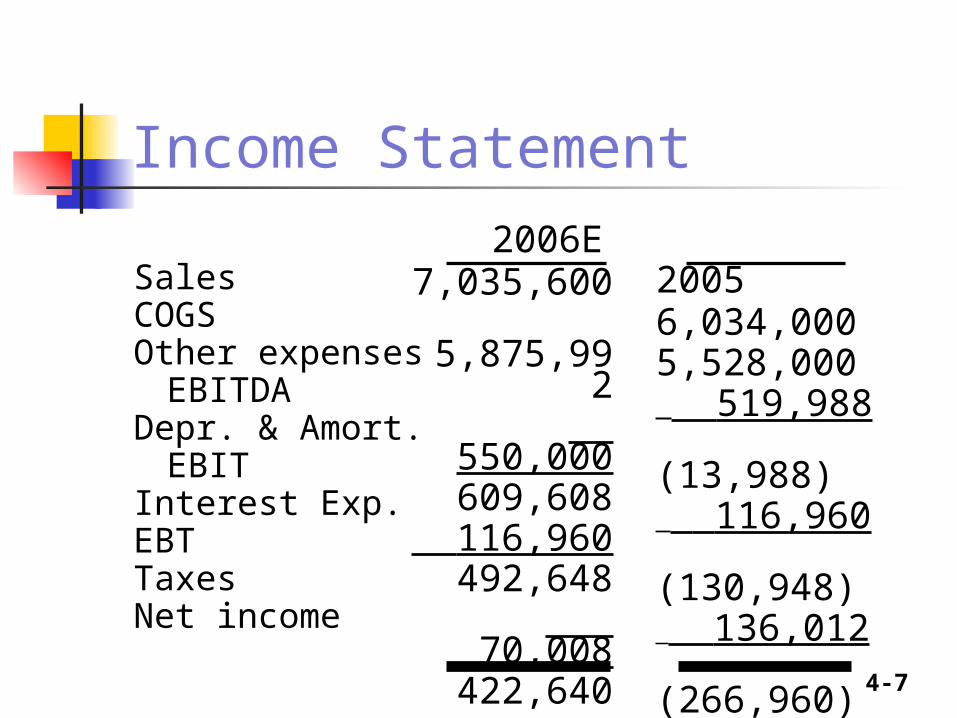
Income Statement
SalesCOGSOther expenses
EBITDADepr. & Amort.
EBITInterest Exp.EBTTaxesNet income
20056,034,0005,528,000 519,988 (13,988) 116,960 (130,948) 136,012 (266,960) (106,784) (160,176)
2006E7,035,600
5,875,992 550,000
609,608 116,960
492,648 70,008
422,640 169,056 253,584
4-8
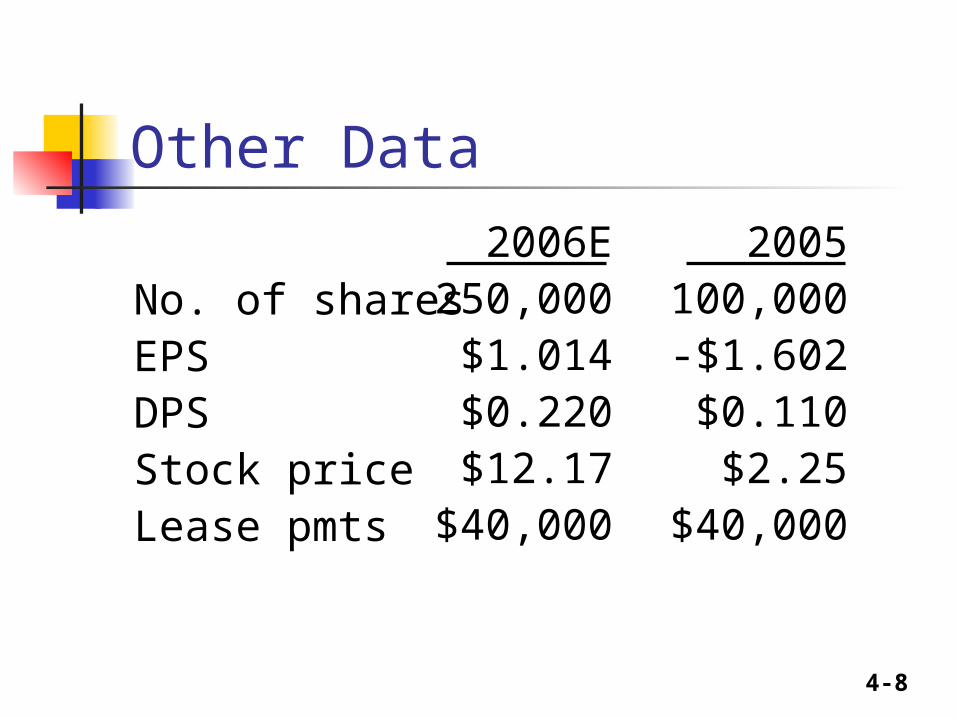
Other Data
No. of sharesEPSDPSStock priceLease pmts
2006E250,000
$1.014$0.220$12.17
$40,000
2005100,000-$1.602$0.110
$2.25$40,000
4-9
This week I’ll send an Income Statement and
Balance Sheet which holds all the data you’ll need. Also attached will be an Excel Spreadsheet to post your answers.
4-10
What are the five major categories of ratios, and what questions do they answer?
Liquidity: Can we make required payments?
4-11
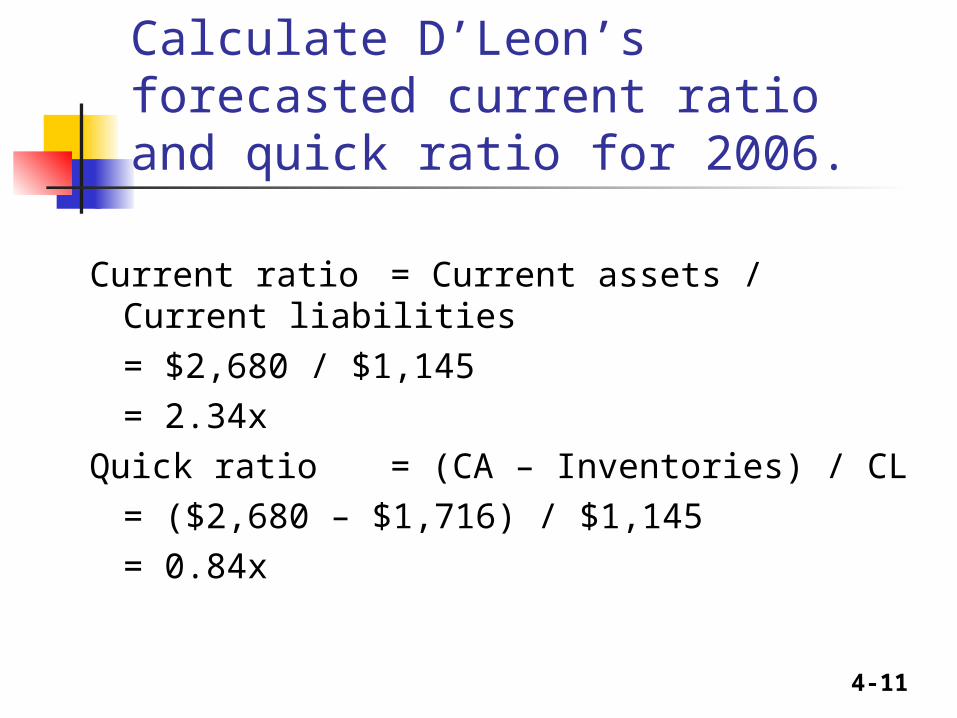
Calculate D’Leon’s forecasted current ratio and quick ratio for 2006.
Current ratio = Current assets / Current liabilities
= $2,680 / $1,145= 2.34x
Quick ratio = (CA – Inventories) / CL= ($2,680 – $1,716) / $1,145= 0.84x
4-12
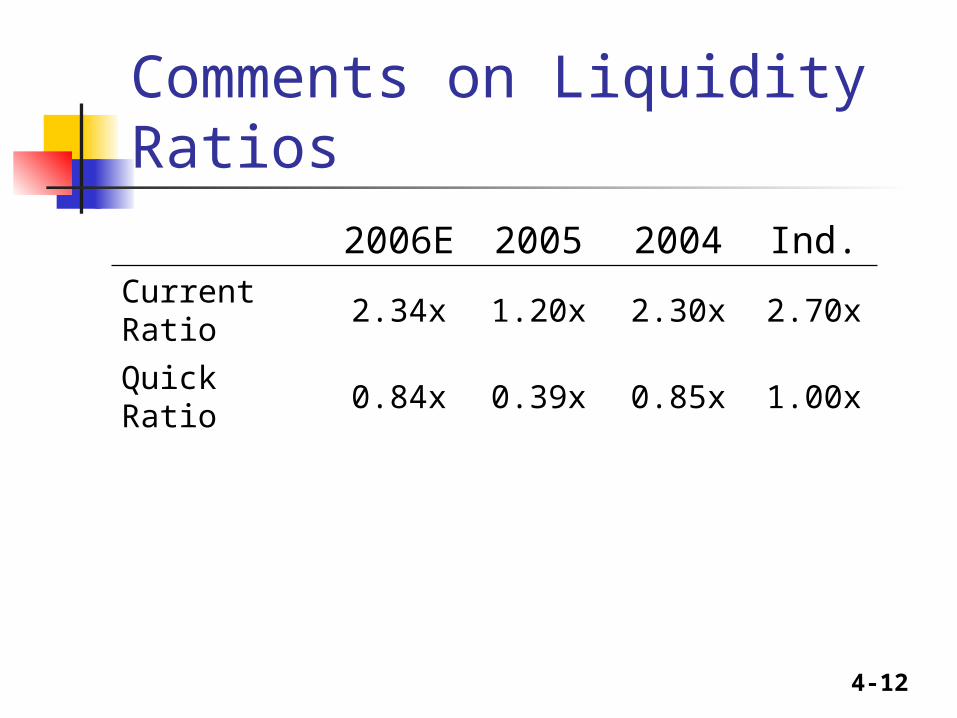
Comments on Liquidity Ratios
2006E 2005 2004 Ind.Current Ratio
2.34x 1.20x 2.30x 2.70x
Quick Ratio 0.84x 0.39x 0.85x 1.00x
4-13
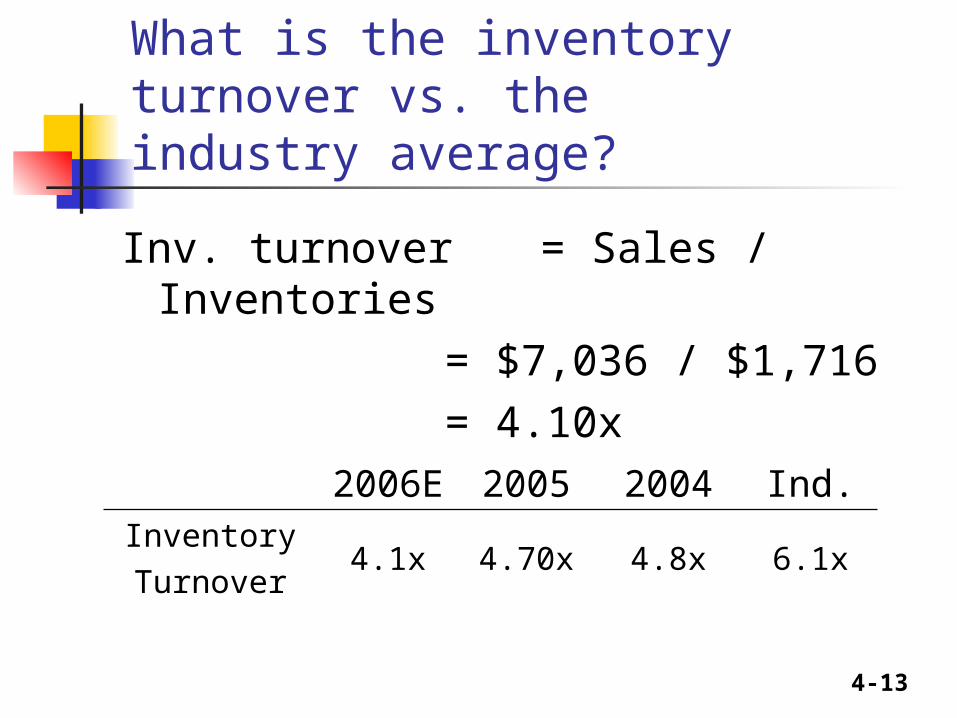
What is the inventory turnover vs. the industry average?
2006E 2005 2004 Ind.InventoryTurnover
4.1x 4.70x 4.8x 6.1x
Inv. turnover = Sales / Inventories= $7,036 / $1,716= 4.10x
4-14
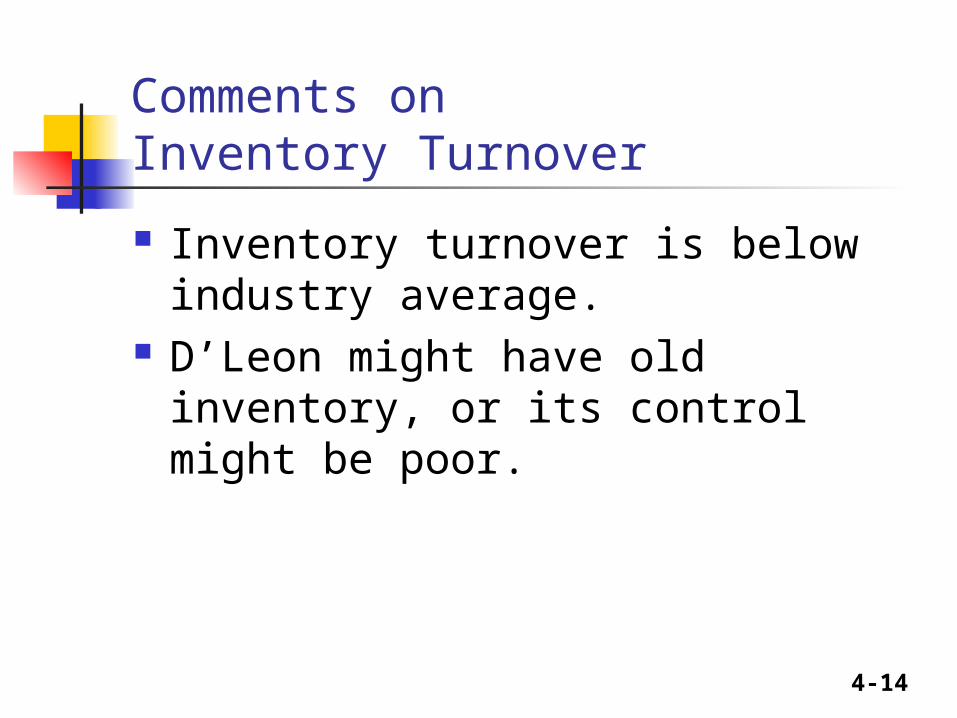
Comments on Inventory Turnover
Inventory turnover is below industry average.
D’Leon might have old inventory, or its control might be poor.
4-15
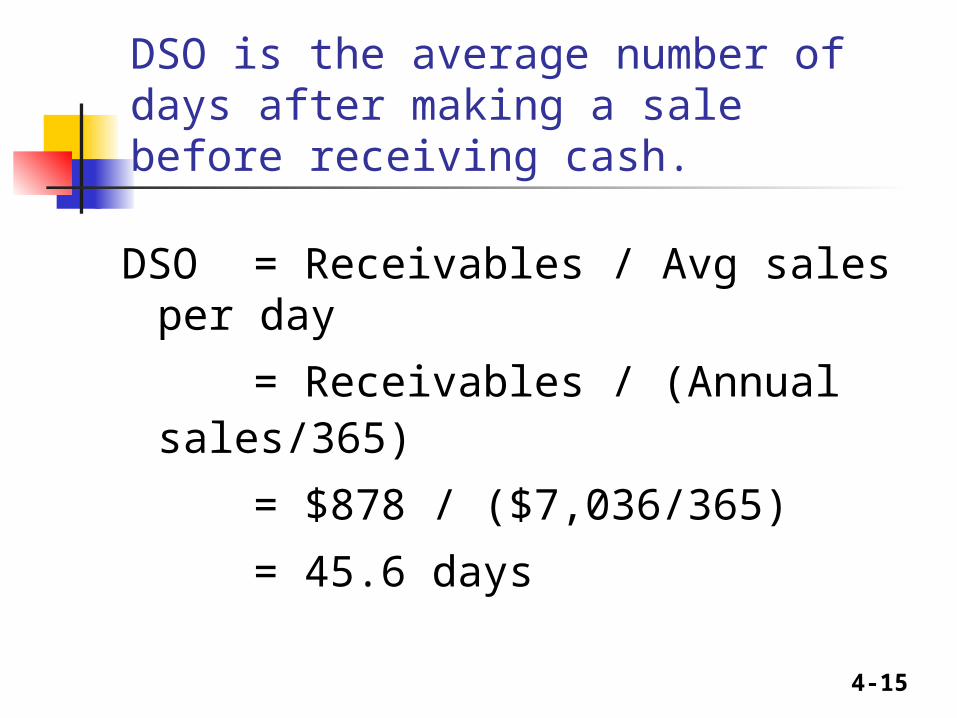
DSO is the average number of days after making a sale before receiving cash.
DSO = Receivables / Avg sales per day
= Receivables / (Annual sales/365)
= $878 / ($7,036/365)
= 45.6 days
4-16
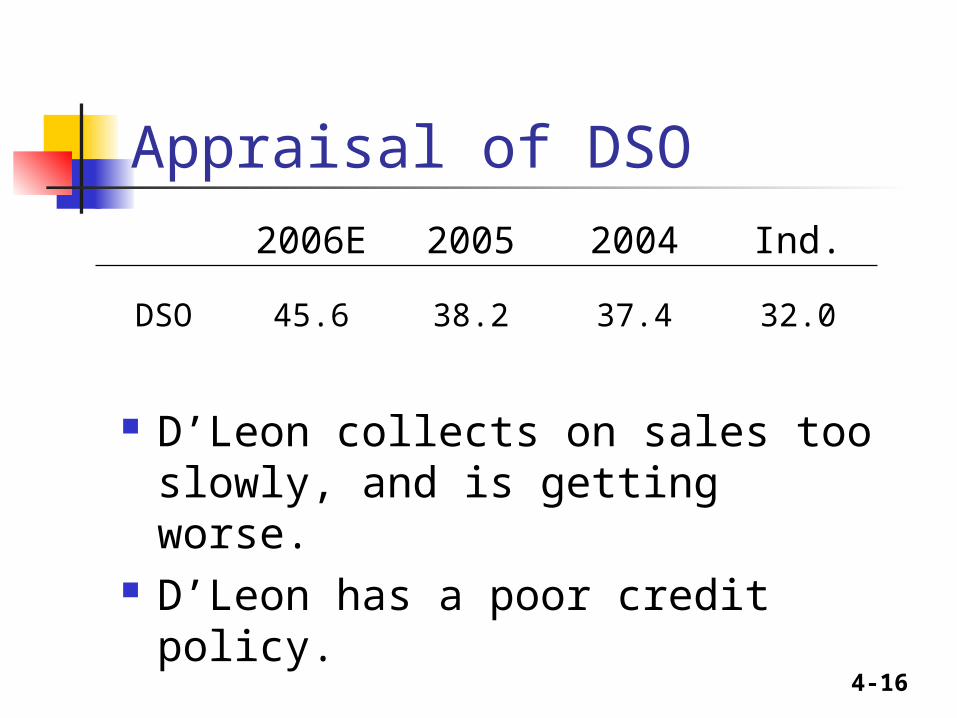
Appraisal of DSO
2006E 2005 2004 Ind.
DSO 45.6 38.2 37.4 32.0
D’Leon collects on sales too slowly, and is getting worse.
D’Leon has a poor credit policy.
4-17
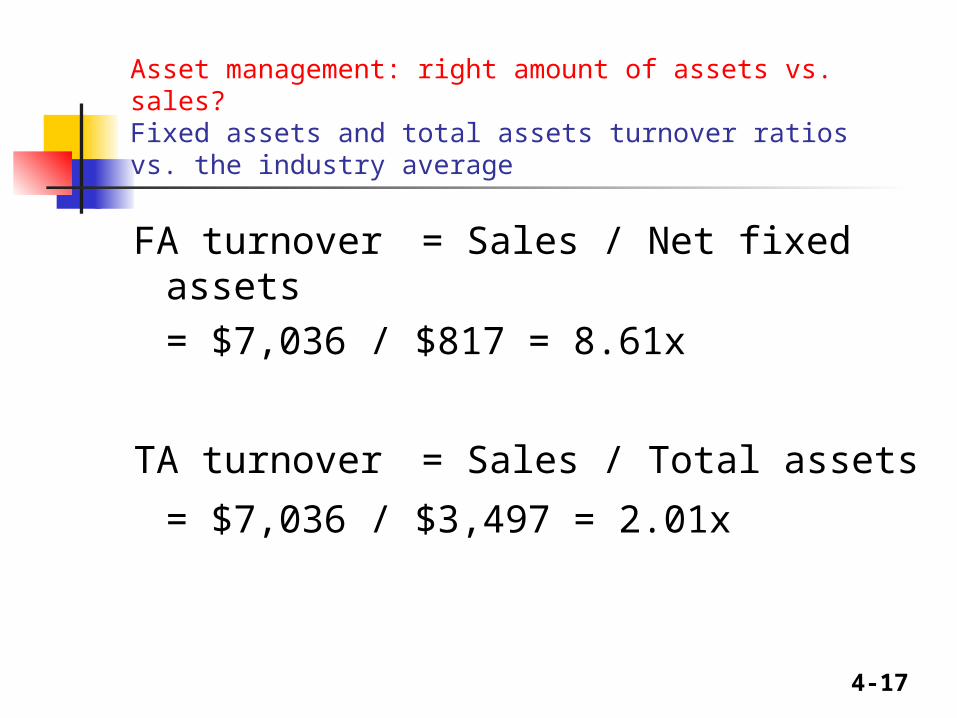
Asset management: right amount of assets vs. sales? Fixed assets and total assets turnover ratios vs. the industry average
FA turnover = Sales / Net fixed assets= $7,036 / $817 = 8.61x
TA turnover = Sales / Total assets
= $7,036 / $3,497 = 2.01x
4-18
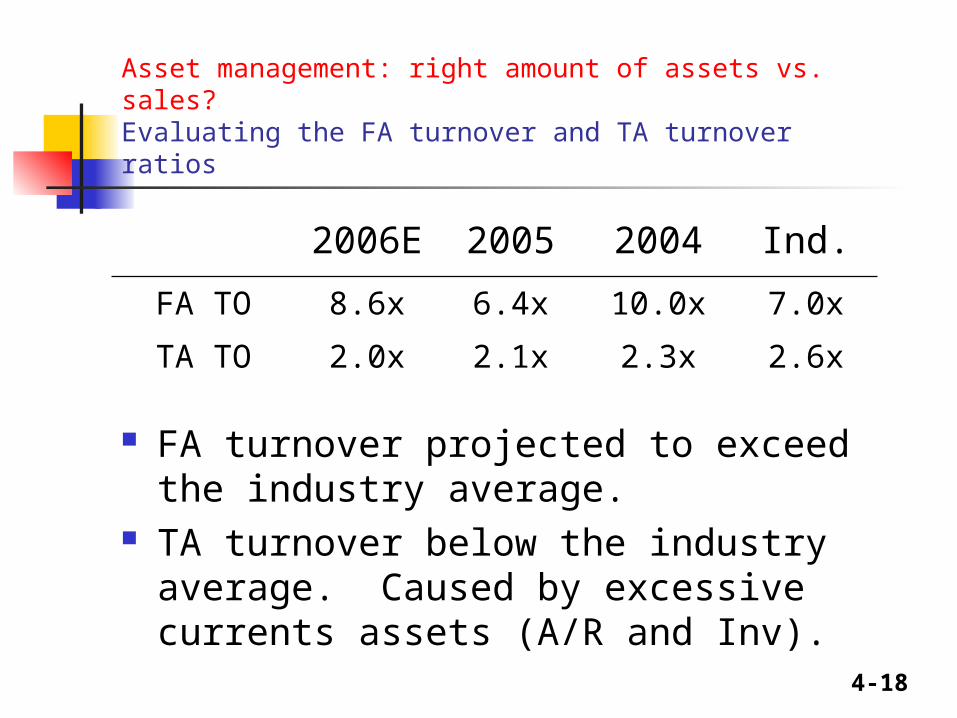
Asset management: right amount of assets vs. sales?Evaluating the FA turnover and TA turnover ratios
2006E 2005 2004 Ind.
FA TO 8.6x 6.4x 10.0x 7.0x
TA TO 2.0x 2.1x 2.3x 2.6x
FA turnover projected to exceed the industry average.
TA turnover below the industry average. Caused by excessive currents assets (A/R and Inv).
4-19
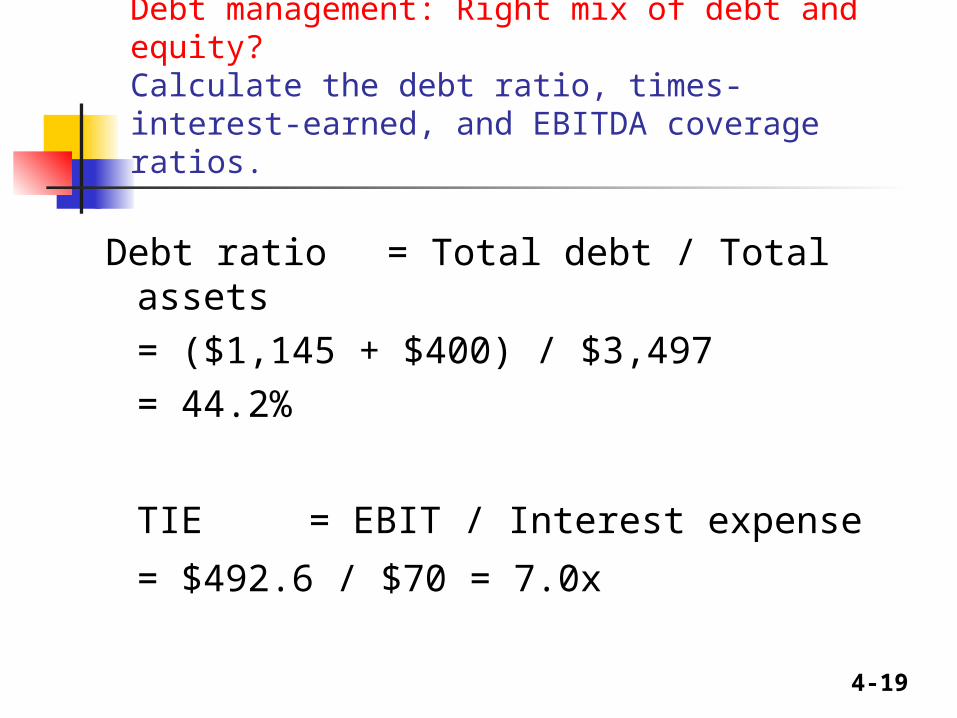
Debt management: Right mix of debt and equity?Calculate the debt ratio, times-interest-earned, and EBITDA coverage ratios.
Debt ratio = Total debt / Total assets= ($1,145 + $400) / $3,497 = 44.2%
TIE = EBIT / Interest expense
= $492.6 / $70 = 7.0x
4-20
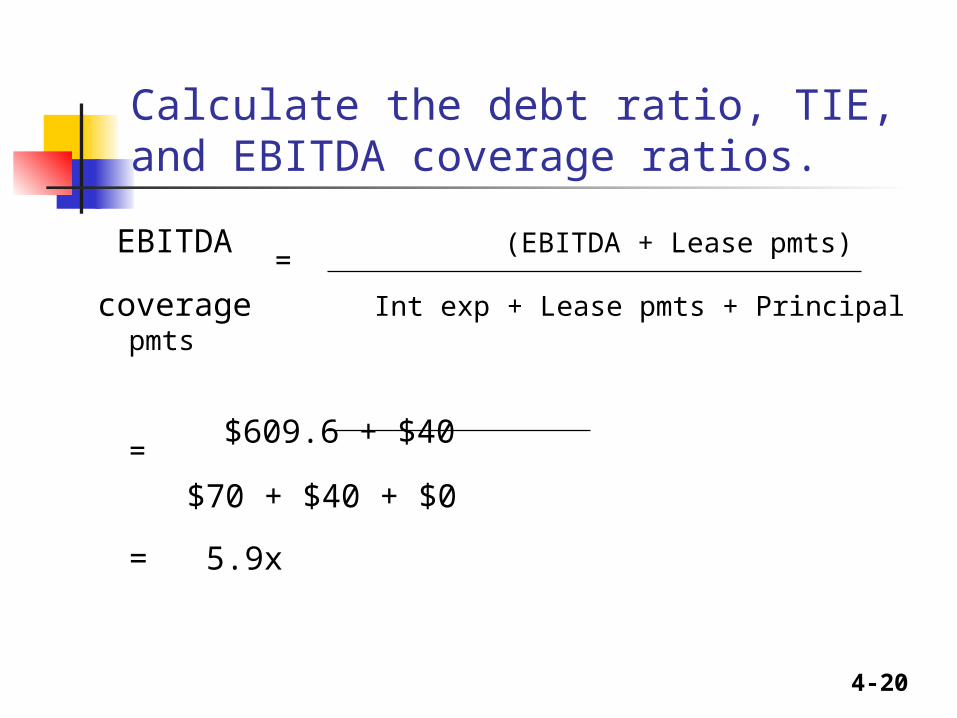
Calculate the debt ratio, TIE, and EBITDA coverage ratios.
EBITDA=
(EBITDA + Lease pmts)
coverage Int exp + Lease pmts + Principal pmts
= $609.6 + $40
$70 + $40 + $0
= 5.9x
4-21
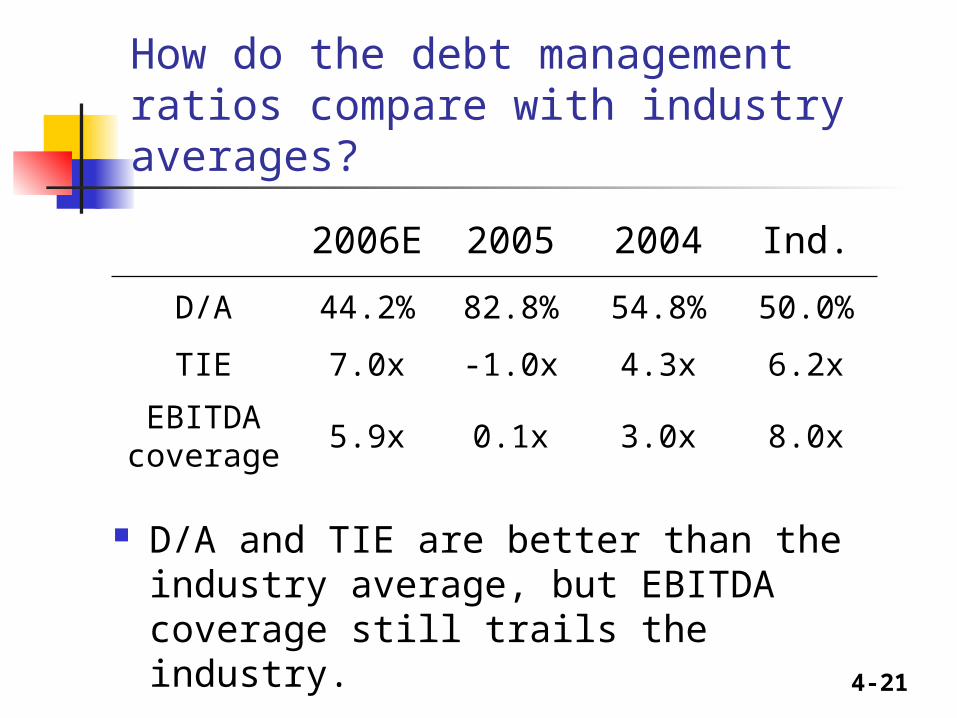
How do the debt management ratios compare with industry averages?
2006E 2005 2004 Ind.
D/A 44.2% 82.8% 54.8% 50.0%
TIE 7.0x -1.0x 4.3x 6.2x
EBITDA coverage
5.9x 0.1x 3.0x 8.0x
D/A and TIE are better than the industry average, but EBITDA coverage still trails the industry.
4-22
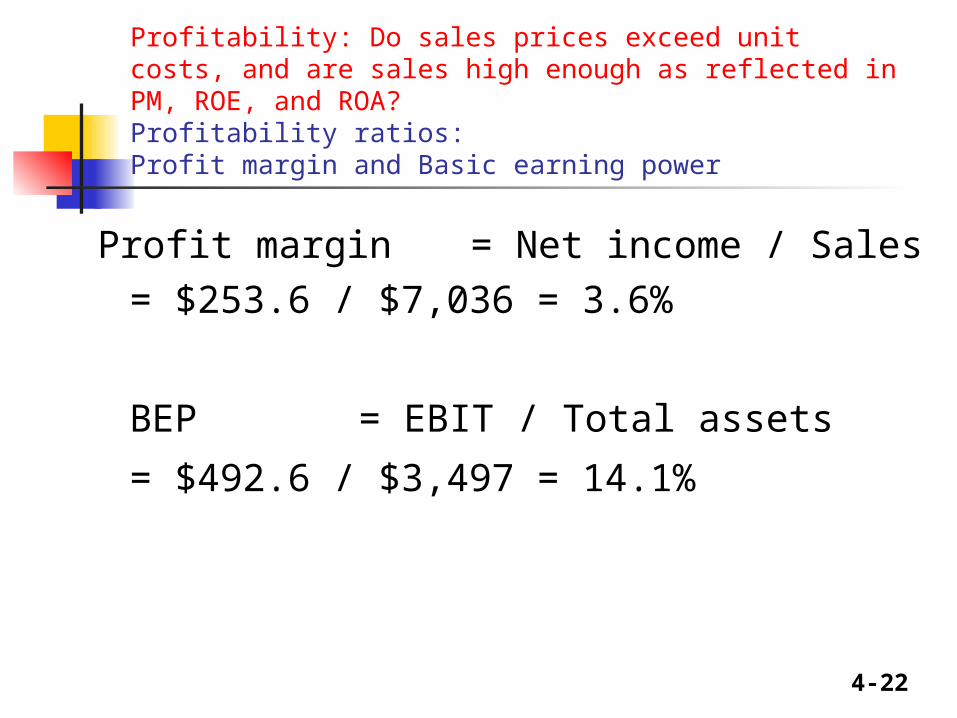
Profitability: Do sales prices exceed unit costs, and are sales high enough as reflected in PM, ROE, and ROA?Profitability ratios: Profit margin and Basic earning power
Profit margin = Net income / Sales= $253.6 / $7,036 =
3.6%
BEP = EBIT / Total assets
= $492.6 / $3,497 = 14.1%
4-23
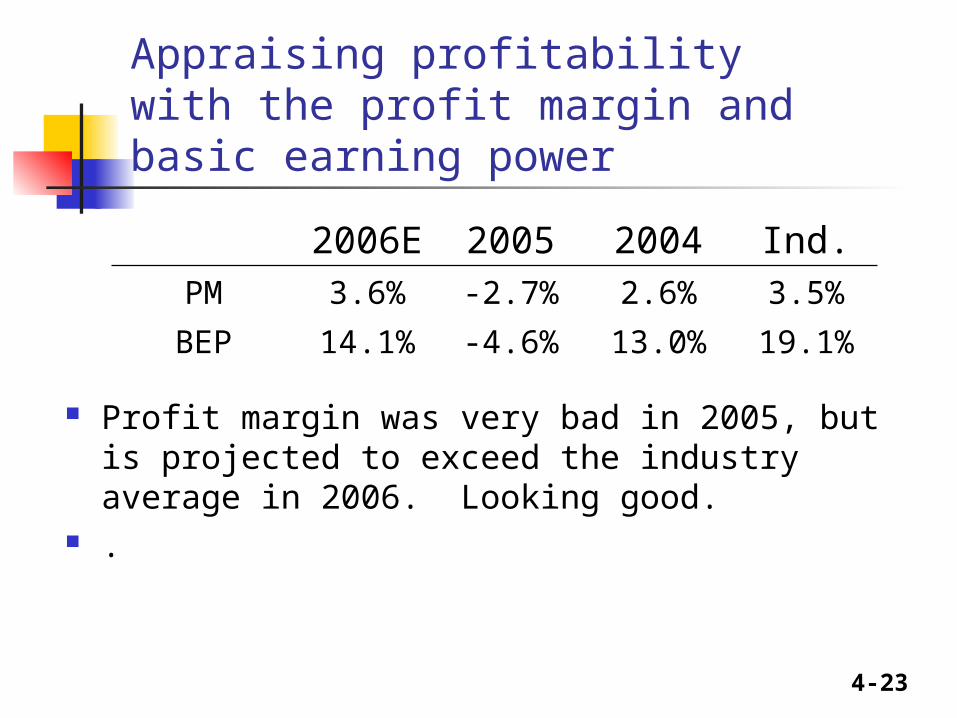
Appraising profitability with the profit margin and basic earning power
2006E 2005 2004 Ind.PM 3.6% -2.7% 2.6% 3.5%
BEP 14.1% -4.6% 13.0% 19.1%
Profit margin was very bad in 2005, but is projected to exceed the industry average in 2006. Looking good.
.
4-24
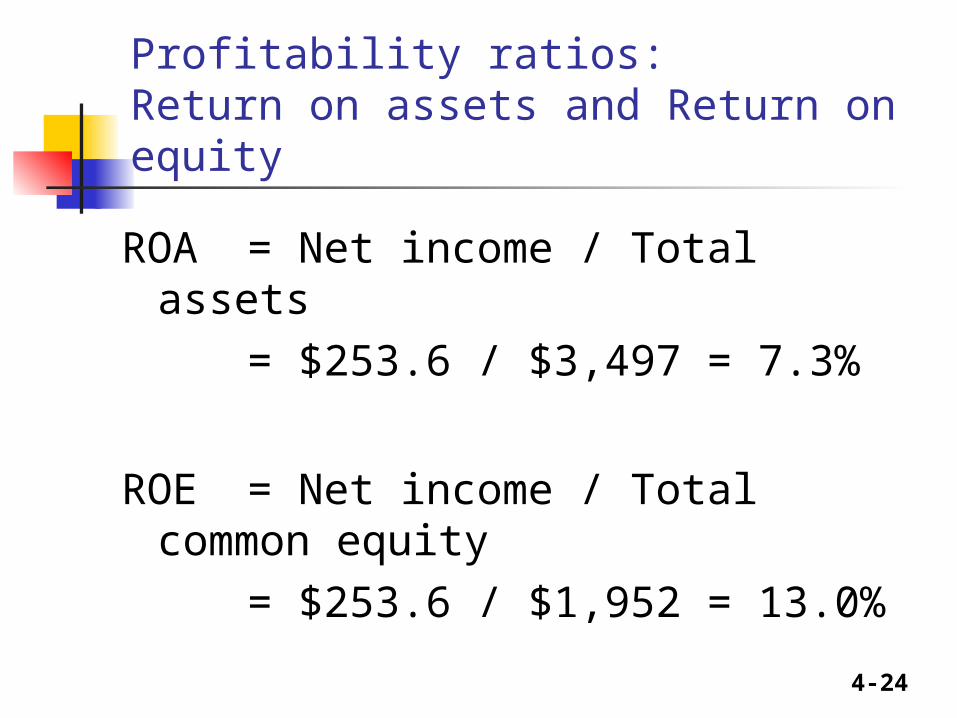
Profitability ratios: Return on assets and Return on equity
ROA = Net income / Total assets= $253.6 / $3,497 = 7.3%
ROE = Net income / Total common equity
= $253.6 / $1,952 = 13.0%
4-25
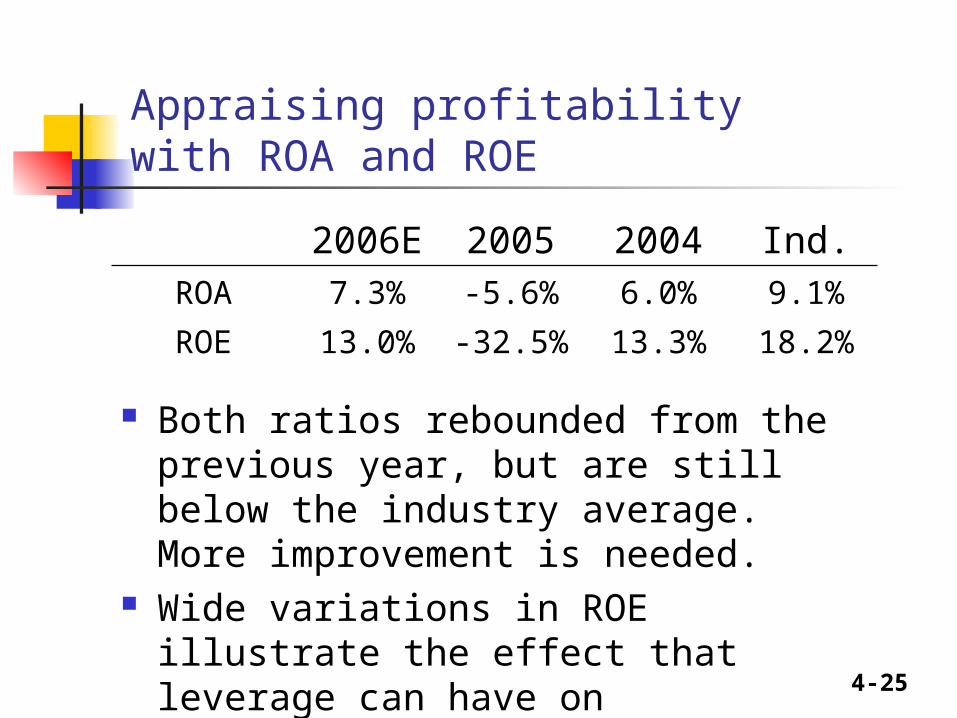
Appraising profitability with ROA and ROE
2006E 2005 2004 Ind.ROA 7.3% -5.6% 6.0% 9.1%
ROE 13.0% -32.5% 13.3% 18.2%
Both ratios rebounded from the previous year, but are still below the industry average. More improvement is needed.
Wide variations in ROE illustrate the effect that leverage can have on profitability.
4-26
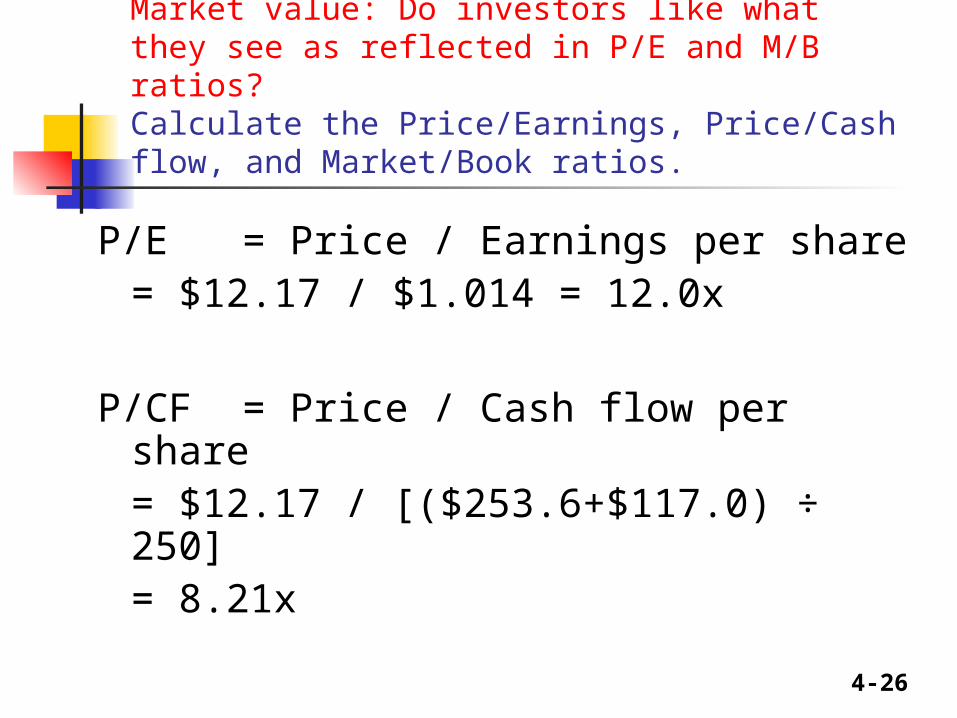
Market value: Do investors like what they see as reflected in P/E and M/B ratios?Calculate the Price/Earnings, Price/Cash flow, and Market/Book ratios.
P/E = Price / Earnings per share= $12.17 / $1.014 = 12.0x
P/CF = Price / Cash flow per share= $12.17 / [($253.6+$117.0)
÷ 250]= 8.21x
4-27
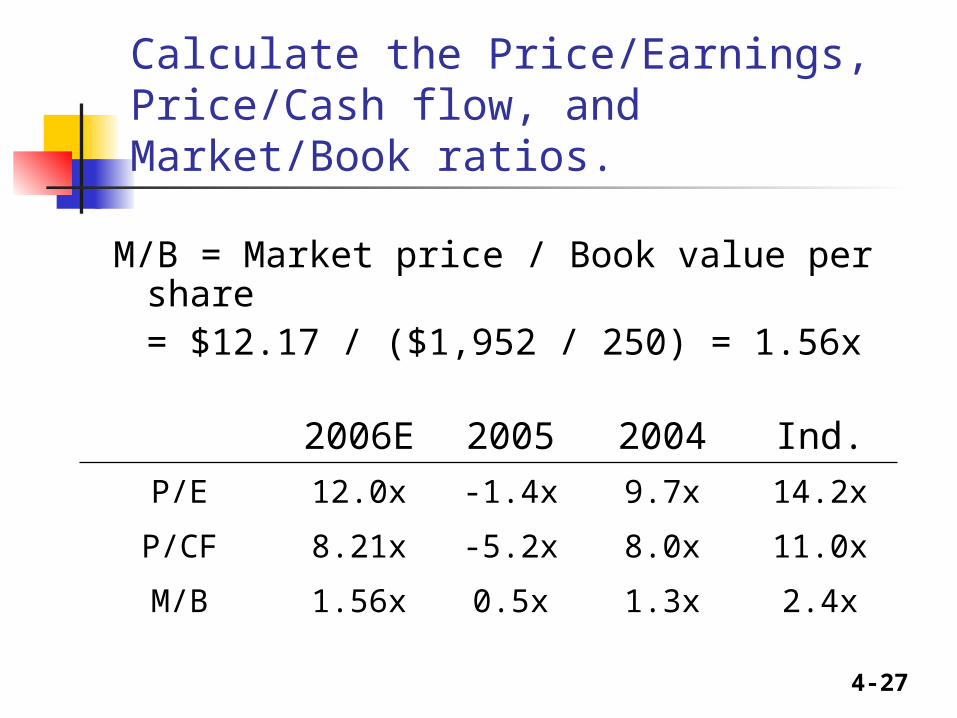
Calculate the Price/Earnings, Price/Cash flow, and Market/Book ratios.
M/B = Market price / Book value per share= $12.17 / ($1,952 / 250) = 1.56x
2006E 2005 2004 Ind.P/E 12.0x -1.4x 9.7x 14.2x
P/CF 8.21x -5.2x 8.0x 11.0x
M/B 1.56x 0.5x 1.3x 2.4x
4-28
Analyzing the market value ratios
P/E: How much investors are willing to pay for $1 of earnings.
P/CF: How much investors are willing to pay for $1 of cash flow.
M/B: How much investors are willing to pay for $1 of book value equity.
For each ratio, the higher the number, the better.
P/E and M/B are high if ROE is high and risk is low.


