Embed Size (px)
Citation preview

Example• A simplified model of thermal power plant is shown in the figure with per unit failure rate
of individual components. What is the reliability of the plant at 1000 hours
• Given
• We can calculate
Feed water pumps
10-4hr-1
Boilers
10-3hr-1
Steam turbines
5*10-3hr-1
Electric Generators
10-5hr-1

Example• A gearbox is suppose to have a reliability of 99.98%. 3 vendors offer gear sets that meets
the functions of the gear box. The reliabilities and costs are tabulated.
• What combination of gear sets will achieve the reliability at the least cost. You can use as many gear sets from each vendor or combination of vendors as needed. Gears are arranged in Parallel
• The system reliability of gearbox with n sets is
• R=1-(1-R1) (1-R2)…. (1-Rn)
• Explore 2 sets, 3 sets, and then more until least cost option is achieved
Vendor Reliability Cost
A 0.95 50
B 0.93 40
C 0.90 35
System RA RB RB RSystem CostA CostB CostC CostSystem
A+A 0.9975 100
A+A+A 0.9999 150
A+A+B 0.9998 140
A+A+C 0.9998 135
A+B+B 0.9998 130
A+B+C 0.9997 125

Example
• For options involving two gear sets, the most reliable combination does not meet the 99.98% reliability, so no need to try other combinations
• For 3 gear sets, option 2 has highest reliability, but we progressively reduce cost, until, the moste reliable and cheapest option is achieved in option 5
• Going for 4 gear sets, requires at least a cost of 140 (35X4), which is expensive than the reliable 3 gear set option that we secured.
System RA RB RB RSystem CostA CostB CostC CostSystem
A+A 0.9975 100
A+A+A 0.9999 150
A+A+B 0.9998 140
A+A+C 0.9998 135
A+B+B 0.9998 130
A+B+C 0.9997 125

Mechanical Engineering Design Project
MECH 390
Lecture 6

Concept Generation
• The 9 step design process
1. Identify the need
2. Define the problem
3. Planning the project
4. Gathering information
5. Conceptualizing the alternative design approaches
6. Evaluating alternatives
7. Selecting the best alternative
8. Communicating the design
9. Implementing the preferred design

• Concept generation is where possible solutions to the design are
thought over
• Creativity assumes importance to achieve design objectives while
satisfying the constraints
• Opportunities of creative concepts in design
• Process of creative thinking
• Barriers to creative thinking
• Steps to overcome those barriers
• Steps to elicit design ideas from individual/team
• Finally, approaches to modify, combine or organize design
alternatives towards achieving the design intent
Introduction

• Different design projects requires different levels of creative
thinking. Based on the need for creativity and innovation in design,
we can classify them into 4 categories
• There are generally 4 types of engineering design:
• Selection design
• Configuration design
• Parametric design
• Original design
Levels of Creative Design

• Design engineer picks out an existing solution
that meets the specifications and requirements of
the design problem.
• Components are selected from the vendors
catalogue that describe the relevant
characteristics
• An example is choosing a proper bearing for a
wheel, or gears, belts, pulleys etc.
• Less opportunity for creative thinking
• Example
• A .5-hp, 1730-r/min motor is to operate a drill
press having a spindle speed of approximately
1200 r/min. The center distance between the
motor shaft and spindle is approximately 19.5 in.
The type of drive required is V-belt.
Selection design
Pulley size for motor = 2.75 in.Belt section = .50 in. wide X .31 in. thick

• Generally involves standard components, similar to "selection
design," but the design challenge is to locate and arrange the
components to improve performance or reduce size.
• An example of this is the design challenge of locating the jet
engines on a commercial aircraft. The most popular configurations
consist of the engines suspended beneath the wings, or cantilevered
off the side of the rear fuselage, or mounted in the tail assembly.
• Even though many of the components are standard "off the shelf"
items, there generally are areas in the configuration design category
for modifying the size or shape of the components in order to take
advantage of particularly attractive configuration opportunities.
• When a computer company puts together a made-to-order computer,
they are doing configuration design. Standard components are
selected and combine to make a new configuration to meet unique
requirements that old configurations cannot meet.
Configuration design
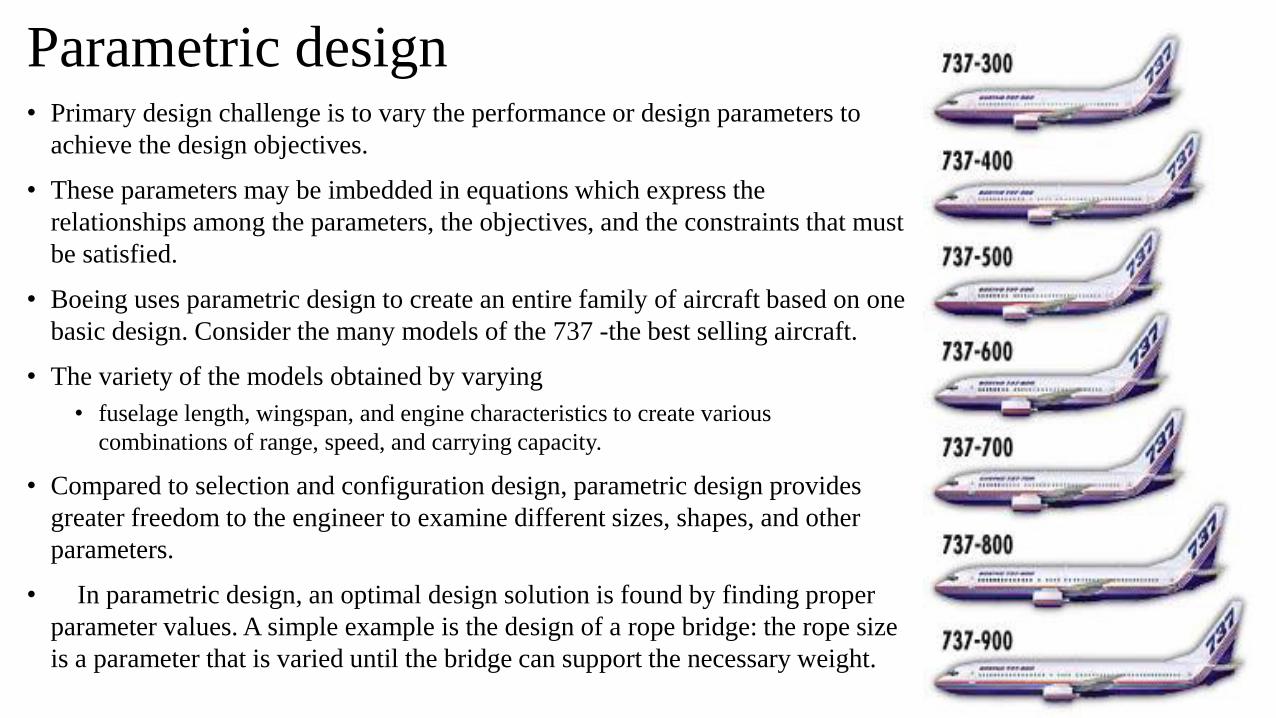
• Primary design challenge is to vary the performance or design parameters to
achieve the design objectives.
• These parameters may be imbedded in equations which express the
relationships among the parameters, the objectives, and the constraints that must
be satisfied.
• Boeing uses parametric design to create an entire family of aircraft based on one
basic design. Consider the many models of the 737 -the best selling aircraft.
• The variety of the models obtained by varying
• fuselage length, wingspan, and engine characteristics to create various
combinations of range, speed, and carrying capacity.
• Compared to selection and configuration design, parametric design provides
greater freedom to the engineer to examine different sizes, shapes, and other
parameters.
• In parametric design, an optimal design solution is found by finding proper
parameter values. A simple example is the design of a rope bridge: the rope size
is a parameter that is varied until the bridge can support the necessary weight.
Parametric design
• Parametric design involves finding values for the features that characterize the
object being studied.
• Consider a simple example – We want to design a cylindrical storage tank that
must hold 4 m3 of liquid.
• The volume is given by
• V = r2l
• The tank is described by the parameters, radius 'r', and length l .
• Given V = 4m3 = r2l
• R2l = 1.273
• We can see a number of values for the radius and length, that will satisfy this
equation.
• Each combination-values of r and l gives a possible solution for the design
problem.
Parametric design

• Refers to the design of objects and systems that are a substantial and fundamental
departure from existing products or processes.
• The push-button telephone is an example of a sudden, major, innovative departure
from the rotary dial telephone.
• Other examples of breakthrough original designs include the personal computer, the
microwave oven, the automatic transmission for automobiles, prestressed concrete
structures, the elevator, the transistor, and the laser.
• Because the designs in this category involve radical changes from the existing norm,
the creative element is a major, if not the dominant, factor in the design process.
• Original design begins with a stated need and only a completely blank sheet of paper.
This type of design arises from a completely new idea that has no apparent design
solution.
Original design

• The Sonic Cruiser concept developed from studies that
began in the 1990s. A variety of concepts were studied,
including supersonic aircraft, aircraft with the engines
mounted above the wing, aircraft with a single vertical
tail, and aircraft with rectangular intakes.
• The strongest of these initial concepts was named the
"Sonic Cruiser" and publicly unveiled on March 29,
2001, shortly after the launch of the A380 by Airbus.
• Sonic Cruiser promised 15-20% faster speed than
conventional airliner without the noise pollution caused
by the sonic boom flying at altitudes of 40,000 ft and a
range of 6000-10000 miles.
• It was suppose to start service in 2008, and design
changes was expected considering customer demands.
• Later dropped as airlines prefer smaller operating costs,
compared to marginal increase in speed
Original design

Millenium Bridge

Millenium Bridge

Millenium Bridge

Original design

Original design
• Nobody designed or built something like millennium bridge in
gatehead, across thames.
• Limited to pedestrians and cyclists
• Bridge opens by rotating the entire structure about the horizontal
axis
• In profile, it looks like V
• Planes of roadway arch and supporting arch forming the legs of
the V
• It is a original design

Characteristics of critical thinking
• Many people have studied the phenomenon of creative thinking.
• Some psychologists devote a substantial part of their careers trying to
understand what distinguishes the creative person from the individual who
rarely, if ever, comes up with a new idea.
• There are no definitive answers, but there are at least some indications of
factors that appear to affect our creativity.

Nature of Creativity• Creativity is an elusive concept, and there have been many definitions proposed by professionals in the
field.
• Davis organizes definitions of creative thinking into 4groups.
• The first group deals with the concept of combining ideas: for example, "Creative ideas are new
combinations of previously unrelated ideas".
• The second group of definitions emphasizes the originality of the ideas, as typified by this definition
attributed to Herbert Fox: "The creative process is any thinking process which solves a problem in an
original and useful way".
• Third group are those definitions which emphasize the unexplainable nature of the creative process,
such as Carl Jung's assertion that, ".... the creative act... will forever elude... human understanding".
• The last group of definitions discussed by Davis are those that propose the idea that the creative act is
inherently a product of the unconscious mind.
• For our purposes, we can be content with the insight provided by this range of definitions. We have no
need to select from among them, or to consolidate them into a single composite definition.

Models of the Creative Process• These are not rigid linear models; the steps may come out of order, be skipped entirely, or be revisited.
• We will see that there is substantial overlap between these psychological models of the creative process
and our model of the engineering design process.
• Under our model of engineering design, creativity is part of concept generation, and concept generation
in turn is just one of nine steps in the design process.
• However, as we will see, the creative process models include elements that correspond to steps in our
design model other than the concept generation step.
• We will handle this by presenting the creativity models in their entirety and indicate where they overlap
those other elements of our engineering design model.
• Wallas Model
• Fabun Model
• Creative Education Foundation Model

Models of the Creative Process
• Wallas Model
• This is a four-step model originally proposed in 1926.
• Preparation: This stage includes clarifying and defining the problem. It corresponds to Steps 1 and 2 in
our model of the design process.
• Incubation: This is the formative stage which takes place while the mind is relaxed and the individual
is engaged in an unrelated activity which frees up the conscious and perhaps unconscious mind to be in
a receptive mode.
• Illumination: This is the conscious recognition of the new idea, the so-called "Eureka" phenomenon.
• Verification: This is the reality check to determine whether the idea has merit. It corresponds to what
we called the Evaluation Step in our engineering design model.
• If we strip away those stages that are accounted for elsewhere in our engineering design model, we are
left with a two-stage (incubation and illumination) model of the creative process.

Models of the Creative Process
• Fabun model. - First proposed in 1968, this model uses the 4 stages from Wallas and adds 3more.
• Desire: This deals with a thinker's equilibrium being disturbed by a problem. The individual then becomes
motivated to restore the equilibrium by solving the problem. Step 1 in model of engineering design.
• Preparation: This is the same as in the Wallas model. But with the addition of the Desire stage, the
Preparation stage now fits better with our Step 2. So the combination of the Desire and Preparation stages
corresponds to what we call Problem Formulation. .
• Manipulation: This is where the mind actively manipulates materials or ideas in an exploratory fashion.
This may include what we refer to as Step 4: Gathering Information. But it goes beyond that and
represents the active effort that usually precedes the Incubation stage.
• Incubation: This is the same as in the Wallas model.
• Intimation: This is the feeling that you get when you realize that you are on the right track
• Illumination: and Verification: This is also the same as the Wallas Model.
• Removing the overlap with our engineering design process model leaves us with a four-stage model:
Manipulation, Incubation, Intimation, and Illumination.

Models of the Creative Process
• Creative Education Foundation (CEF) Model - proposed in 1976 by the CEF
• Five stages. Each step involves both a divergent phase in which options are generated, and a convergent
phase in which those options are winnowed down and combined or modified. Only the best of those ideas
are taken forward to the next phase.
• Fact Finding: This consists of collecting facts which might have some bearing on the problem. This
appears to be Step 4 of our design process model-Gathering Information.
• Problem Finding: This begins with developing alternative statements of the problem. This is the Problem
Formulation phase of our engineering design model-Steps 1 and 2.
• Idea Finding: This is where possible solutions are first presented.
• Solution Finding: This is the evaluation phase. It closely corresponds to a combination of Step 6:
Evaluation of Alternatives and Step 7: Decision Making.
• Acceptance Finding: This phase is the counterpart to our Step 8: Implementation.
• After stripping away the overlaps, what remains is a single-stage model of the creative process-Idea
Finding.

Models of the Creative Process
• Consolidated Model - We will combine the non-overlapping elements of the three models described
above into a consolidated model of the creative process.
• From the Wallas model, we take the Incubation and Illumination stages. The Fabun model contributes, in
addition, the Manipulation and Illumination stages. However, we combine the Manipulation stage with the
Idea Finding stage of the CEF model and rename it the Exploration phase, resulting in a 4-stage model:
• Exploration: The active and concerted search for new ideas, often terminated frustration because of the
inability to identify sufficiently attractive ideas
• Incubation: The extended period of relaxation during which there is no conscious effort to address the
problem
• Intimation: The resumption of purposeful pursuit combined with the feeling that you are beginning to
make progress
• Illumination: The breakthrough that produces an attractive new idea

Models of the Creative Process• Not all can be Thomas Edison, or Benjamin Franklin. But we can improve our creative skills beyond
current level
• Creative mind is optimistic, enthusiastic and has no preconceived solutions – aka open mind
• Adventurous, risk-taking, spontaneous and impulsive
• Creative time is not the time to be conservative, analytical, and fearful of failure, since these attitudes can
only inhibit you.
• Remember, in this phase of design our focus is on generating new ideas. Assessing the value of those ideas
is a subsequent activity.
• Let's not jump the gun and confine ourselves to ideas that we think are workable We have plenty of time to
discard or modify ideas.
• So let's do one thing at a time.
• Let's emphasize the generation of ideas at this point.
• Our awareness of the attitudes that can help sharpen our creative tendencies can be reinforced by
understanding a little bit of the physiology of the human brain.

Modes of thought• The human brain is a marvelous and mysterious organ.
• It is the home of our "mind" and the source of all our thinking abilities.
• Extensive research on the physiological structure of the brain has revealed that different parts of the brain
are associated with different modes of thought.
• Different sections of the brain is responsible for different aspects
• Left brain is for engineering and right for humanities type of
courses
• But right brain is also essential for critical design which is very
much engineering
• We should be able to switch between the two modes of thought
effortlessly

Barriers to critical thinking• Now that we have some familiarity with basic concepts of creative thinking and with the
attitudes that can improve our creativity, "Why aren't we more creative?
• The answer to this question has two parts.
• First, most of us are continuously immersed in and surrounded by very strong barriers to
creative thinking.
• Some of these are self-imposed
• Others arise from external factors.
• Second, overcoming these barriers takes a concerted effort.
• Some of the existing barriers to creative thinking include perceptual barriers, cultural
barriers, environmental barriers, emotional barriers, and intellectual barriers.
• Once we understand the nature of these barriers, we can focus on reducing the extent
which they interfere with our mental preparation and inhibit our creative thinking.
Types of barriers• Perceptual barriers. Perceptual barriers prevent a clear understanding of the design problem and/or the
opportunities for solutions.
• Cultural barriers. Cultural barriers are restrictions imposed by society. They discourage nontraditional
approaches that violate societal norms.
• American culture teaches that 2 party system is best, capitalism is better than communism, anybody can
become the president of America etc…
• Now c what happened
• Environmental barriers. Anything in your immediate surroundings which inhibits creativity is an
environmental barrier.
• This includes poor lighting, interruptions from frequent telephone calls, background noise, distracting
aromas (both pleasant and unpleasant), uncomfortable temperature, or an uncomfortable chair.
Environmental barriers are not just physical.
• The attitudes of your peers or your supervisors may be inimical to a creative thinking environment.
Coworkers or bosses who are overly critical, who have no sense of humor, and who insist on rigid rules of
dress and behavior can discourage your creative tendencies.

Types of barriers• Emotional barriers. Emotional barriers are feelings which discourage you from considering a solution, or
distract you from focusing on the problem.
• Discomfort with the risk associated with a proposed solution may cause you to discard that solution
prematurely.
• For example, if you lost a relative due to a firearm accident, you may be uncomfortable working on projects
dealing with explosives.
• Recognizing the existence of emotional barriers is an important first step in overcoming them.
• Intellectual barriers. Intellectual barriers occur when you don't have enough knowledge of a topic to
incorporate it into a design.
• Successful engineers overcome these barriers by remaining up-to-date in their field.
• You can't know everything, but you can expand your personal knowledge base by interacting with
colleagues who have diverse backgrounds.

Types of perpetual barriers• Of the 5 categories of barriers, perceptual barriers are most common; difficult to recognize & overcome.
• manifest themselves when we perceive design problems too narrowly and thus become captive to an
unnecessarily constrained perspective regarding possible solutions. 5 different ways this can occur.
• Patterns. Many design assignments involve making incremental changes in prior designs. Much
technological progress has been made though these evolutionary developments. The internal combustion
automobile engine is an excellent example of the impressive results achieved using the incremental
approach over approximately one-hundred years.
• However, there also are situations that could be improved by making a radical departure from an existing
pattern instead of continuing with incremental improvements. The phenomenon of existing patterns of
thought serving to inhibit our creative tendencies is well known, and can even permeate entire
organizations.
• Keuffel & Esser dominated the market for slide-rules but was unable to adapt to the era of pocket
calculators.
• Several mainframe and mini-computer manufacturers went out of business because they failed to appreciate
the significance of the desktop personal computer.

Types of perpetual barriers• Using shapes 1 and 2, create a simple geometric
shape
• Add 3 to the previous shape to make another simple
geometric shape
• Add 4, 5 to the previous shape to make another
simple geometric shape
• Add 6to the previous shape to make another simple
geometric shape

Types of perpetual barriers• Boundaries. Another barrier to letting loose our creative juices is our tendency to
interpret situations too literally and impose artificial boundaries on the range of solution
possibilities.
• Many people take for granted that certain restrictions or boundaries exist.
• These perceived constraints can serve to severely limit the possibilities for creative
solutions.
• Draw 4 connected lines without taking your hand off to connect all 9 dots in the picture
• Solution is easy once we remove the self imposed boundary that the lines have to be
within the implied square
• Illusions. The fact that we don't always perceive objects correctly is the basis for many
optical illusions.
• We act too quickly on our first impression of an object or
situation, we may misinterpret the situation or at least
ignore alternative explanations.

Types of perpetual barriers• Lenses. Another kind of perception barrier arises when we look
at situations with the wrong lens or focus too much on details.
When this occurs we often miss the larger picture (we can't see
the forest for the trees).
• Meanings. A perceptual barrier arises because we tend to adopt
conventional roles for objects.
• We severely limit our options if we fail to consider the
possibilities that become available if we adopt new
interpretations for the role of familiar objects.
• The objects we refer to here can also include words, since
relying only on the conventional meaning of words can also
unnecessarily restrict our opportunities for creative solutions.
• Example crossword, which US city is half golden and half
silver
• Answer: Denver

Barrier Removal• Seattle buses being dual mode to accommodate in tunnel built for train
• They were overweight making it unlawful to ply the roads based on per axle weight of each buses
• Cartoonist humorously suggesting
ways of barrier removal

Techniques for generating alternatives• Understanding the nature of creative thinking and the barriers that serve to inhibit it are a good start towards
enhancing our creative capabilities
• Several techniques that are designed to help stimulate our ability to generate design alternatives.
• Before discussing specifics, two extremely important principles that governs all concept generation activities
• Lateral Thinking. Thomas Edison said, "It's easy to obtain one hundred patents if you also have 5,000
unsuccessful inventions".
• A fundamental principle of the concept development phase of design is to concentrate on generating a large
number of alternatives. The corollaries to this principle are:
• (a) resist the urge to pursue any one of the concepts in detail; and
• (b) avoid critiquing any of the concepts.
• Essentially meaning step 5 (conceptualizing design) and step 6 (evaluating the alternatives) should be clearly
decoupled. You should not evaluate alternatives until you have all alternatives in place

Techniques for generating alternatives• Perseverance. A myth about creativity is displayed in the cartoon of the light bulb going off above
somebody's head to signal the instant creation of a new idea.
• Much closer to the truth is that many new ideas are the result of a gradual evolution of thinking about existing
concepts in new ways.
• While light bulbs occasionally do flash, they usually are the end result of a long
process of searching.
• Thomas Edison is alleged to have said, "Invention is 95% perspiration and 5%
inspiration."
• Many people find that an extended, conscious, dedicated search for new ideas is
often unsuccessful, but that it prepares the necessary background for a new idea
that is born during a period of relaxation.
• The key factor appears to be that these breakthroughs are more likely to occur if
they follow' an extended, intensive, conscious effort.

Techniques for generating alternatives• Mental Push-ups. Athletes engage in regular physical exercise between athletic events as a way to stay in
shape.
• Though football players never do push-ups in a game situation, they engage in a regular and rigorous routine
of push-ups and similar exercises in order to keep in top physical condition.
• It should not be surprising then that a regular routine of mental exercises can keep your creative thinking
powers in top form.
• Several versions of "mental push-ups" to keep you in peak creative condition include:
• making lists, word games, solving puzzles, magic tricks and other games.

Mental Push up PuzzleIn a street there are five houses, painted five different colors.- In each house lives a person of different nationality- These five homeowners each drink a different kind of beverage, smoke different brand of cigar and keep a different pet.Einstein's riddle is: Who owns the fish?Necessary clues:1. The British man lives in a red house.2. The Swedish man keeps dogs as pets.3. The Danish man drinks tea.4. The Green house is next to, and on the left of the White house.5. The owner of the Green house drinks coffee.6. The person who smokes Pall Mall rears birds.7. The owner of the Yellow house smokes Dunhill.8. The man living in the center house drinks milk.9. The Norwegian lives in the first house.10. The man who smokes Blends lives next to the one who keeps cats.11. The man who keeps horses lives next to the man who smokes Dunhill.12. The man who smokes Blue Master drinks beer.13. The German smokes Prince.14. The Norwegian lives next to the blue house.15. The Blends smoker lives next to the one who drinks water.

Project Planning
• Purpose of Project planning
• Benefits of integrating within design process
• Planning techniques
• Gantt Charts
• Critical Path Method
• Program Analysis and Review Technique
• Many commercially available software packages for this purpose

3/2/2018 Chapter 7-Project Planning 41
Elements of Project Planning
• Divide project into tasks, tasks into subtasks, subtasks into ...
• Estimate duration of each task, subtask, ...
• Estimate resource requirements for each task, subtask, ...(budget, personnel, facilities)
• Identify precedence relations among tasks

3/2/2018 Chapter 7-Project Planning 42
Benefits of Project Planning
• A Project is a set of activities which ends with specific accomplishment and which has
(1) Routine and non-routine tasks, (2) Distinct start/finish dates, and (3) Resource
constraints (time/money/people/equipment).
• Tasks are activities that must be completed in order to achieve the project goal.
• Tasks have start and end points, are short relative to the project and are significant.
• Use verb-noun form for naming tasks (not "going to library", but rather, "search literature"), other examples would include "create drawings" or "build prototype".
• Use action verbs such as "create", "define“ and "gather" rather than "will be made".
• Each task has a duration or time to completion. You may find it difficult to accurately estimate the duration of tasks.
• Doubling your best guess usually works well.
3/2/2018 Chapter 7-Project Planning 43
Benefits of Project Planning• Communications tool
• Framework for communicating with clients/team members
• Devil is in the details, task B will take 15 engineering hours, and it can only begin after completion of A, etc
• Resource allocation
• Helps in resource allocation, depending and on the number of people and number of projects,
you can delegate one engineer for 2 projects or 2 engineers for one project etc. same for other
resources as well
• Benchmarking
• Provides ability to measure progress while underway and helps midway
correction/adjustments etc
• They cannot be rigid.

3/2/2018 Chapter 7-Project Planning 44
Planning Challenges• Clients mostly will require to see a project plan. As detailed as possible to get the contact
• At the same time, not too time consuming or expensive
• Also to make it fast and cheap, you cannot make it unrealistic
• The effort and resource of planning is commensurate with the size and cost of the project
itself
• A 10M project needs a different kind of plan compared to a 5K project
• There are six stages in a design project
• Enthusiasm
• Disillusionment
• Panic
• Search for the guilty
• Punishment for the innocent
• Praise and honors for the non-participants

3/2/2018 Chapter 7-Project Planning 45
Project Planning Tools
• Gantt Chart
• Critical Path Method (CPM)
• Program Evaluation and Review Technique (PERT)
• Variations and combinations of the above
• Many available software packages contain these tools

3/2/2018 Chapter 7-Project Planning 46
Gantt Chart for Automobile Bumper Project
4 5 6 7 8 9 10 11 12 13 14 15 16 17 18321Task Name 23 24 25262728293031 22212019
Preliminary Design
Build Prototype
Test Prototype
Final Design
Days
• Widely used project planning tool developed by Henry Gantt in 1917
• Activities along vertical axis and horizontal axis in time depicts the time to completionPlan for Bumper Design Project
Task Starting
Date
Completion
Date
Cost
($)
Preliminary Design July 1 July 10 1,000
Build Prototype July 8 July 15 2,000
Test Prototype July 13 July 17 1,500
Final Design July 20 July 31 3,000

3/2/2018 Chapter 7-Project Planning 47
Enhanced Gantt Chart for Automobile Bumper Project
4 5 6 7 8 9 10 11 12 13 14 15 16 17 18321Task Name 23 24 25 26 27 28 29 30 3122212019
Preliminary Design
Build Prototype
Test Prototype
Final Design
Days
hrs
30
20
25
40
• Many additional details can be added to chart
• Diamond symbols for significant milestones
• Column listing the duration of each task
• These identify the amount of resources needed for each task and supplement to the
timeline on the horizontal axis

3/2/2018 Chapter 7-Project Planning 48
Keeping Track of Project Progress on a Gantt Chart
4 5 6 7 8 9 10 11 12 13 14 15 16 17 18321Task Name 23 24 25 26 27 28 29 30 3122212019
Preliminary Design
Build Prototype
Test Prototype
Final Design
Days
hrs
30
20
25
40
• Tasks can be subdivided in to subtasks
• And progress tracked
• Cross hatch diamond shows preliminary design completed as planned
• Prototyping delayed, causing the testing to spill onto the 18th, which was free in the
previous chart

3/2/2018 Chapter 7-Project Planning 49
Keeping Track of Project Progress on a Gantt Chart
• Shutdown planned for chemical company. Using this time, many equipment modifications
are planned

3/2/2018 Chapter 7-Project Planning 50
Tasks for Designing and Building an Electric Substation
Task Duration
(days)
A. Design substation 10
B. Select site 7
C. Prepare site 3
D. Order transformers and related electrical equipment 2
E. Order concrete, fencing, and related construction
supplies
2
F. Excavate for foundation 3
G. Pour and cure concrete foundation 10
H. Erect structural frames 2
I. Install electrical equipment 3
J. Erect fence 2
K. Test electric equipment 2
L. Connect to grid 2
M. Clean up site 2
A
B
C
D
E
F
G
H
I
J
K
L
M
M T W Th F
Week 1
Task M T W Th F
Week 2
M T W Th F
Week 3
M T W Th F
Week 4
M T W Th F
Week 5
M T W Th F
Week 6
• Few assumptions include, working only weekdays, some tasks can be done
simultaneously, some can overlap to a certain degree
• The gantt chart will look different if your assumptions are different
• In reality, you ll have a lot more info, so assumption will be reduced

3/2/2018 Chapter 7-Project Planning 51
• Graphical network diagram identifying potential bottlenecks.
• Gantt-time for tasks
• CPM-logical relationship between tasks(activities)
• Table shows the logical relationship between activities
• This is compiled so that the CPM diagram can be drawn
Critical path method (CPM)

3/2/2018 Chapter 7-Project Planning 52
• Uses a network flow diagram to depict the precedence relations among activities (tasks)
• Elements of diagram are directed line segments and nodes
• Facilitates identification of activities whose timely completion are “critical” to timely completion of the project
Critical path method (CPM)

3/2/2018 Chapter 7-Project Planning 53
CPM Notation and Conventions
• An activity is an ongoing effort on a project task (directed line segment). (not a vector)
• Every activity has an initiating event and a closing event (nodes).
• Events consume no time. Their primary role in CPM diagrams is to separate activities.
• Consecutive activities must be separated by events.
A3
(b) Events(a) Activities

3/2/2018 Chapter 7-Project Planning 54
CPM Notation and Conventions (cont.)
• No pair of events can be directly connected by more than one activity with no intervening events. If an activity R must immediately precede S and T, the relationship is depicted as follows
• If activities R and S must both immediately precede T, the relationship is depicted as follows
• All networks must begin with a single Start event and end with a single Finish event.
S
T
R
S
R
T

3/2/2018 Chapter 7-Project Planning 55
• Sometimes precedence relationships require the use of a dummy activity (depicted by a dashed line) to indicate the appropriate relationships. Dummy activities do not take up any time.
• Dummy activity is needed to correctly depict that P and Q must precede S, and P must precede R.
• Dummy activity needed when several activities have same Start and End events. Activities R and S share the same Start and End events.
• Dummy activities should be be included only when needed to display the precedence relation.
S
P R
Q
S
R
Dummy Activities

3/2/2018 Chapter 7-Project Planning 56
Using Dummy Activity for Bumper Project
Activity Preceded by
Design bracket
Build bracket Design bracket
Build bumper
Drill holes in
bumper
Build bumper, Design
bracket
(a)
Shows proper precedence relations for drilling the
holes but does not include building the bracket
drill holein bumper
(c)Inclusion of a dummy activity allows
proper relations to be depicted
(b)
Improperly shows that building the bracketrequires the bumper to be built first
build
brac
ket
build
bumper
design
bracket
build
bumper
drill hole
in bumper
build
bracket
design
bracket
drill hole
in bumper
buildbumper
design
bracket
• Logical relationship between activities for bumper project in table
• Cannot build until designed
• If bracket is assumed to be bolted to bumper, drill holes in bumper for which bumper has to be built
• Bracket design must be complete, to know where to drill the hole

3/2/2018 Chapter 7-Project Planning 57
Multiple Dummy Activities
• More than one dummy activity maybe needed for some situations
• A precedes D
• A and B precede E
• B and C precede F
Must be used with caution
Does not take time only shows alternate path
Used only when needed to show precedence
Not for closing gaps in the Gantt chart
D
C F
A
B E

3/2/2018 Chapter 7-Project Planning 58
Project Activities and their Precedence Relations
Activity Duration Preceded by
A 3
B 3 A
C 4
D 1 C
E 3 B, D
F 2 A, B, D
G 2 C, F
H 4 G
I 1 C
J 3 E, G
K 5 F, H, I
Start
A3
B
3
I
1
D1
C4
• Start with start circle. The activities that do not have preceding activities are drawn, in this case A and C
• A and C start from start event, direction and length is as per convenience
• Terminate A and C, and from their construct activities that require A or C as prerequisite
• B is preceded by only A; D and I are preceded only by C
• Full diagram seen below where no activity cris cross each other
Start
A3
Finish
B
3
E
3
H 4
G
2
I
1
J3
K5
F2
D1
C4

3/2/2018 Chapter 7-Project Planning 59
Example of Constructing a Network Diagram
Table E7.4.1
Fig. E7.4.1
Activity Preceded by
A
B
C
D A,B
E C
F A
G D, E, F
H C
I H
J D, E
K I, J
L G
M L, K
A
F G
E
C
LB D
H
J
I K M

3/2/2018 Chapter 7-Project Planning 60
Activity Duration Preceded by
A 4 —
B 5 —
C 4 A
D 5 A
E 6 A
F 4 D,C
G 7 F,B
H 4 G,E
Another Example of Constructing a Network Diagram*
Start
Finish
A
4
C 4
F 4
H
4
G
7
D 5
E 6
B
5

3/2/2018 Chapter 7-Project Planning 61
The Critical Path
• The critical path is the path of activities from the start event to the finish event for which delay in any activity along that path will delay the project finish.
• For projects with a small number of alternative paths, the critical path can be most efficiently identified by finding the longest of the alternative paths.

3/2/2018 Chapter 7-Project Planning 62
Alternative Paths and their Length
Path Length
A-B-E-J 12
A-B-F-G-dummy-J 13
A-B-F-G-H-K 19
C-D-E-J 11
C-D-F-G-dummy-J 12
C-D-F-G-H-K 18
C-I-K 10
• For the project depicted in Fig. 7.12
Table 7.3
Thus, A-B-F-G-H-K is the critical path
Start
A3
Finish
B
3
E
3
H 4
G
2
I
1
J3
K5
F2
D1
C4
Start
A3
Finish
B
3
E
3
H 4
G
2
I
1
J3
K5
F2
D1
C4

3/2/2018 Chapter 7-Project Planning 63
Example Problem of Finding the Critical Path*Path Duration
A-E-H 14
A-C-F-G-H 23
A-D-dummy-F-G-H 24
B-G-H 16
Start
Finish
A
4
C 4
F 4
H
4
G
7
D 5
E 6
B
5

3/2/2018 Chapter 7-Project Planning 64
Alternate Method for Determining Critical Path• This approach is more efficient for larger networks
• Use forward sweep to find earliest start (ES) for each activity
• Use backward sweep to find latest start (LS) for each activity
• Calculate total float (TF) for each activity
TF = LS - ES
• Critical Path consists of Activities with TF = 0

3/2/2018 Chapter 7-Project Planning 65
Earliest Start*
• Earliest Start (ES) is the earliest time an activity can start. It is found by tracing forward (from tail to head of each activity arrow) from the project Start event to the tail of the selected activity. When several paths are possible, use the longest path as determined by the sum of the activity durations on that path.
• For activity F, ES = 9
Start
Finish
A
4
C 4
F 4
H
4
G
7
D 5
E 6
B
5

3/2/2018 Chapter 7-Project Planning 66
Project Duration*
• Continue until we have ES for all activities that terminate in the project Finish event. When duration of each of those activities are added to their respective EStimes, the largest of the resulting sums is defined as the Project Duration.
• For activity H, ES=20
• Project Duration =20+4=24Start
Finish
A
4
C 4
F 4
H
4
G
7
D 5
E 6
B
5

3/2/2018 Chapter 7-Project Planning 67
Latest Start*
• Latest Start (LS) is the latest time an activity can start and still have the project completed within the Project Duration time.
• LS is found by tracing backwards (from head to tail of each activity) from the project Finish event to the tail of selected activity. Make sure you reach the tail of the selected activity via the head of that activity. When several paths are possible, use the longest path as determined by the sum of the activity durations on that path. The Project Duration minus the length of this longest path is the LS for the selected activity.
• For activity A, LS=24-24=0
Start
Finish
A
4
C 4
F 4
H
4
G
7
D 5
E 6
B
5

3/2/2018 Chapter 7-Project Planning 68
Total Float
• Total Float for each activity is the difference between the latest start and the earliest start.
TF = LS - ES
• The activities for which TF=0 define the critical path.

3/2/2018 Chapter 7-Project Planning 69
Summary of Total Float Calculations*
• Critical Path consists of A-D-F-G-H
Activity Duration ES LS TF
A 4 0 0 0
B 5 0 8 8
C 4 4 5 1
D 5 4 4 0
E 6 4 14 10
F 4 9 9 0
G 7 13 13 0
H 4 20 20 0
Project Duration 24 24
Start
Finish
A
4
C 4
F 4
H
4
G
7
D 5
E 6
B
5

3/2/2018 Chapter 7-Project Planning 70
Total Float Calculations
Activity Duration Earliest Start Latest Start Total Float
A 3 0 0 0
B 3 3 3 0
C 4 0 1 1
D 1 4 5 1
E 3 6 13 7
F 2 6 6 0
G 2 8 8 0
H 4 10 10 0
I 1 4 13 9
J 3 10 16 6
K 5 14 14 0
Project Duration 19
Table 7.4
For project shown in Fig. 7.12
Start
A3
Finish
B
3
E
3
H 4
G
2
I
1
J3
K5
F2
D1
C4
Thus, A-B-F-G-H-K is the critical path
Start
A3
Finish
B
3
E
3
H 4
G
2
I
1
J3
K5
F2
D1
C4

3/2/2018 Chapter 7-Project Planning 71
Example of Critical Path Determination
A
1
B2
D 4H
5
E6
G
1
L
3
M
4
O
7F7
J 2
K 5I
10 N6
C3
• Identify critical path for the diagram
• Construct the table for ES and LS for each activity
• The ones with TF as 0 will form the critical path
• A,B,D,E,F,G,L,M
Activity ES LS TF
A 0 0 0
B 1 1 0
C 1 4 3
D 3 3 0
E 7 7 0
F 7 7 0
G 13 13 0
H 3 8 5
I 3 12 9
J 14 15 1
K 16 17 1
L 14 14 0
M 17 17 0
N 21 22 1
O 21 21 0
Project
Duration
28
A
1
B2
D 4
H5
E6
G
1
L
3
M
4
O
7
F
7
J 2
K 5I
10 N6
C3

3/2/2018 Chapter 7-Project Planning 72
• Based on Critical Path Method
• Replaces single estimate of activity duration by
a probability distribution
• Allows estimate of probability of completing
project by a specified time
Program Evaluation and Review Technique

3/2/2018 Chapter 7-Project Planning 73
Typical Beta Distributions for Activity Durations• to-optimistic estimate; the shortest time within which this activity can be completed
assuming everything goes right. This is the left terminus of the pdf.
• tm-the most likely time required to complete the activity. This is the mode of the pdf.
• tp- pessimistic estimate; the longest time it will take this activity to be completed assuming everything goes wrong. This is the right terminus of the pdf.
to
tm t
p
(a) Skewed-left Beta distribution
to
tm t
p
(b) Skewed-right Beta distribution

3/2/2018 Chapter 7-Project Planning 74
PERT Procedure
• Calculate the expected duration te (mean) of each activity
• Calculate the variance s2 of each activity
• Use te to determine the expected project duration Te and identify the critical path
6
4 pmo
e
tttt
2
2
6
op tts
Start
A1-3
-3
Finish
B
2-3-4
E
2-3-6
G
1-2-4
I
0-1-3
J1-3-6
K3-
5-12
F
1-2
-7
D1-
1-5
C3-4-10
H
3-4
-6
• To, tm, tp, for each activity are shown in the diagram

3/2/2018 Chapter 7-Project Planning 75
Determination of Critical Path for PERT Example Calculation
Activity Expected
Time
Variance Earliest
Start
Latest
Start
Total
Float
A 3.00 0.44 0.00 0.50 0.50
B 3.00 0.11 3.00 3.50 0.50
C 4.83 1.36 0.00 0.00 0.00
D 1.67 0.44 4.83 4.83 0.00
E 3.33 0.44 6.50 14.84 8.34
F 2.67 1.00 6.50 6.50 0.00
G 2.17 0.25 9.17 9.17 0.00
H 4.17 0.25 11.34 11.34 0.00
I 1.17 0.25 4.83 14.34 9.51
J 3.17 0.69 11.34 18.17 6.83
K 5.83 2.25 15.51 15.51 0.00
Project
Duration
21.34
Table 7.5
Start
A1-3
-3
Finish
B
2-3-4
E
2-3-6
G
1-2-4
I
0-1-3
J1-3-6
K3-
5-12
F
1-2
-7
D1 -
1-5
C3-4-10
H
3-4
-6
• Critical path is C,D,F,G,H,K
• This is different from the one we got with CPM
• Te = 21.34
• T for project and t for activity

3/2/2018 Chapter 7-Project Planning 76
Probability of Completing Project by Specified time Ts
• Calculate the variance of the project duration as the sum of the variances of the activities on the critical path
• Use the standard normal variable z to find the probability of completing the project in a specified time Ts
• For Ts=20
• From Table 5.1 Pr (z < -0.57) = 0.285 (28.5% chance)
T
esS
TTz
s
362
001250250001440361
222222
.
......
)pathcritical(
T
KHGFDCT
s
sssssss
570362
342120.
.
.TTz
T
esS
s

3/2/2018 Chapter 7-Project Planning 77
Activities for Space Station PERT Problem
Activity Description
A Construct shell of module
B Order life support system and scientific
experimentation package from same supplier
C Order components of control and navigational system
D Wire module
E Assemble control and navigational system
F Preliminary test of life support system
G Install life support in module
H Install scientific experimentation package in module
I Preliminary test of control and navigational system in
module
J Install control and navigational system in module
K Final testing and debugging
Start
A25
-30-
45
F
1-1-1
G4-5-7
E
5-7-12
C20-25-35
B
10-15-20
D
3-3-5
H2-2
-3
J8-
10-
14
I
4-4-6
K
6-8-15Finish
• Given table and pert diagram for space station, find the probability of completing the space station in over 60 days

3/2/2018 Chapter 7-Project Planning 78
Summary of PERT Calculations for Space Station Project
Activity te s2 ES LS TF
A 31.67 11.11 0.00 0.50 0.50
B 15.00 2.78 0.00 19.50 19.50
C 25.83 6.25 0.00 0.00 0.00
D 3.33 0.11 31.67 32.17 0.50
E 7.50 1.36 25.83 25.83 0.00
F 1.00 0.00 15.00 34.50 19.50
G 5.17 0.25 35.00 42.83 7.83
H 2.17 0.03 35.00 35.50 0.50
I 4.33 0.11 33.33 33.33 0.00
J 10.33 1.00 37.67 37.67 0.00
K 8.83 2.25 48.00 48.00 0.00
Project Duration 56.83
• Calculate the variance of the project duration as the sum of the variances of the activities on the critical path
σt = σC2 + σE
2 + σI2 + σJ
2 + σK2
= 3.31
• Use the standard normal variable z to find the probability of completing the project in a specified time Ts
• For Ts=60
(60-56.83)/3.31
= 0.96
• From Table 5.1
Pr (TS >60) = 1 - Pr (z < 0.96) = 1 - 0.830 = 0.170 or 17%

3/2/2018 Chapter 7-Project Planning 79
Another PERT Example Problem*
Activity te s2 ES LS TF
A 4.32 1.00 0 0 0
B 5.40 1.56 0 8.64 8.64
C 4.32 1.00 4.32 5.40 1.08
D 5.40 1.56 4.32 4.32 0
E 6.48 2.25 4.32 15.12 10.80
F 4.32 1.00 9.72 9.72 0
G 7.56 3.06 14.04 14.04 0
H 4.32 1.00 21.60 21.60 0
Project Duration 25.92
Start
Finish
A
2-4-8
C
2-4
-8
F2-
4-8
H
2-4-8G
3.5-7-14
D2.
5-5-
10
E 3-6-12
B
2.5-5-10

3/2/2018 Chapter 7-Project Planning 80
Probability of Completing Project by Specified time Ts*
• Calculate the variance of the project duration as the sum of the variances of the activities on the critical path
• Use the standard normal variable z to find the probability of completing the project in a specified time Ts
• For Ts=30
• From Table 5.1
Pr (z < 1.48) = 1 - Pr (z < -1.48) = 1 - 0.067 = 0.932
T
es TTz
s
762001063001561001
22222
......
HGFDAT
ssssss
481762
922530.
.
.TTz
T
es
s

3/2/2018 Chapter 7-Project Planning 82
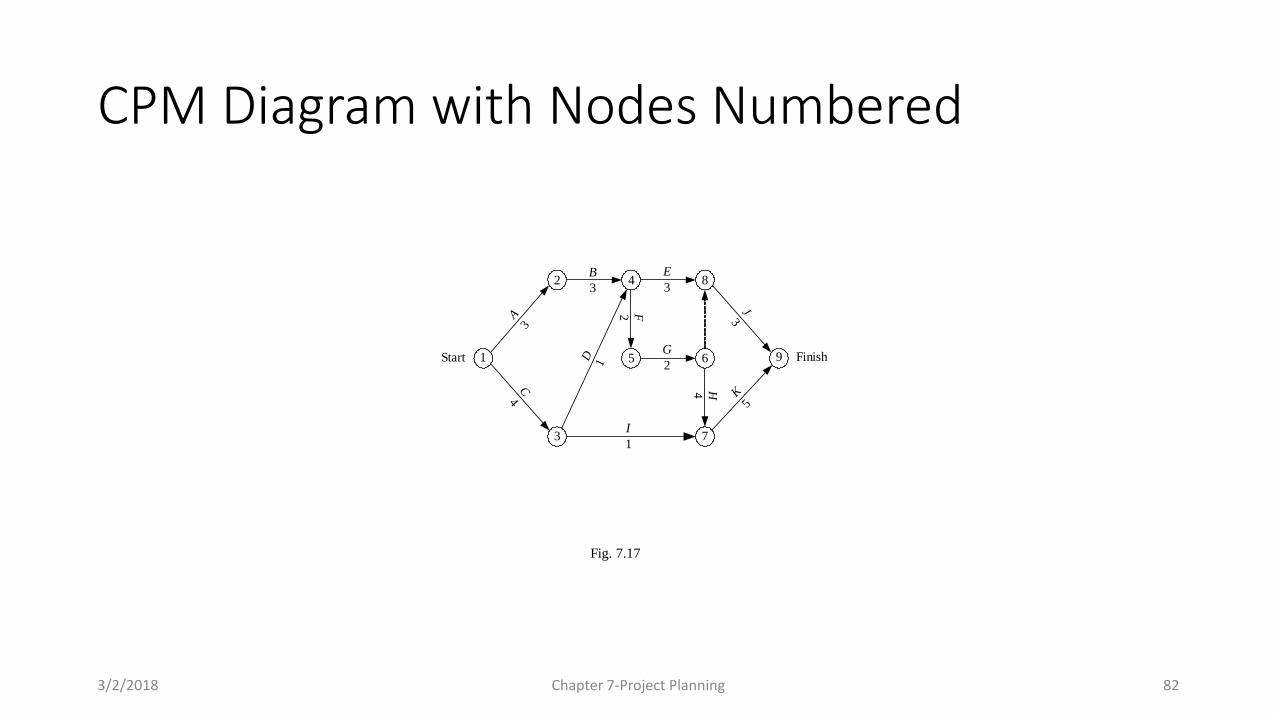
CPM Diagram with Nodes Numbered
Fig. 7.17
3
C4
2
A3
Start 1 D1
I
1
B
34
E
3
5G
2
8
6
J3
7
K5
9 Finish
H4
F2

3/2/2018 Chapter 7-Project Planning 83
Calendarized Version of Network Diagram
Fig. 7.18
3
C
2A
Start 1
D
I
B
4E
5G
8
6
J
7K
9 FinishHF
dummy
0 62 4 8 10 12 14 16 18 20
Start 1 3
4

3/2/2018 Chapter 7-Project Planning 84
Activity on Node Network Diagram
Fig. 7.19
C
1
A
1
Start
3
3
2B
4
E
8
F
D
5
I
7
Finish
4
4
4
G H
J
9
6 7K
9
8
3/2/2018 Chapter 7-Project Planning 85
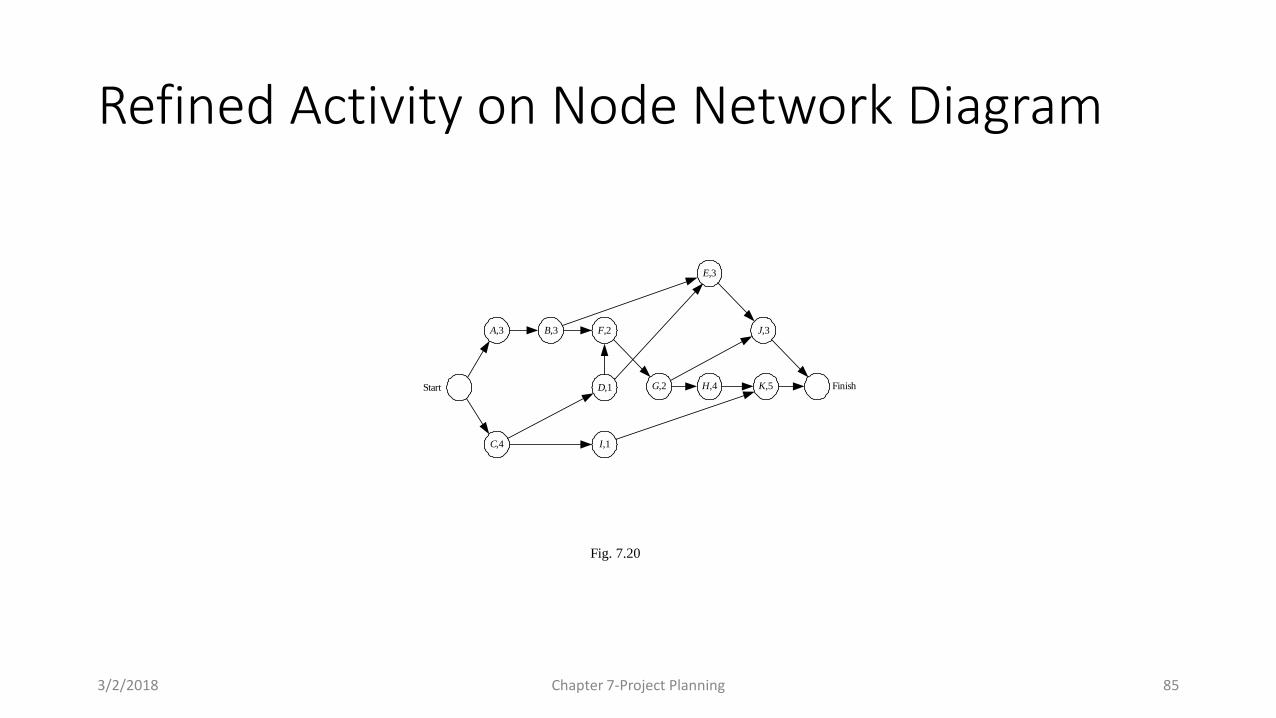
Refined Activity on Node Network Diagram
Fig. 7.20
C,4
A,3
Start
B,3
E,3
F,2
D,1
I,1
FinishG,2 H,4
J,3
K,5